 Open Access Article
Novel continuous flow synthesis of Pt NPs with narrow size distribution for Pt@carbon catalysts†
Ankit Singh and
Keiko Miyabayashi
 *
*
Department of Engineering, Graduate School of Integrated Science and Technology, Shizuoka University, Hamamatsu 432-8561, Japan. E-mail: miyabayashi.keiko@shizuoka.ac.jp
First published on 2nd January 2020
Abstract
In this work, we report a novel continuous flow synthesis method to achieve ultra-small Pt NPs (2.3 to 2.5 nm) with narrow size distribution. This method expedited the synthesis of Pt NPs without any harsh reducing agent or capping agent. Further these Pt NPs were immobilized on a carbon support in a single step procedure for its application as an electrocatalyst for fuel cells. The synthesized Pt NPs and Pt NPs supported on carbon were analyzed using transmission electron microscopy affirming uniform distribution of Pt NPs throughout the carbon support without aggregation.
Platinum nanoparticles are widely used in the field of catalysis,1,2 sensors,3,4 fuel cell technology5,6 and other integrative areas. The expanding interest in these particular nanoparticles is because of their well acknowledged properties and potential in various fields of energy especially as an electrocatalyst for fuel cell applications.7,8 Nonetheless, their structural parameters like size,9,10 morphology11,12 and distribution are some of the limiting factors to their widespread application. Therefore, it is highly important to synthesize small nanoparticles with controlled structural parameters.
Various researchers have synthesized Pt NPs with small size and narrow size distribution using various methods. But mostly the use of stabilizers like PVP,13 PEG14 and CTAB15 or harsh reducing agent like sodium borohydride16 is employed to achieve small nanoparticles without aggregation. Although, for its application in fuel cell technology where it is supported on the various carbon material17–19 it is preferred that minimum organic compounds are used for the synthesis of Pt NPs to achieve high activity. Therefore, the preparation of these Pt@carbon catalysts require tedious post-treatment method to remove organics before it is subjected for electrochemical analysis. However, some researchers pursued alternative pathway to reduce Pt salt using homogenous deposition method and mild reducing agents like ethylene glycol in batch synthesis.20–24 In this work a continuous flow method has been demonstrated for the synthesis of ultra-small Pt NPs.
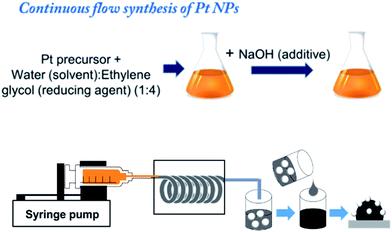
In a continuous flow method for the preparation of Pt NPs, PFA tubing was used with inner diameter of 1.59 mm and the total length of 1.8 m. The PFA tube was rolled in spiral fashion before subjecting it to the heating furnace with the two ends out. The one end of the tube was connected with glass syringe fitted in syringe pump for the reactant infusion and the colloidal solution of Pt NPs was collected from the other end of the tube (Fig. 1).
The Pt NPs were synthesized by facile polyol synthesis using ethylene glycol as reducing agent and solvent. To prepare the reactant mixture H2PtCl6·6H2O (0.015 M) was dissolved in ethylene glycol and water mixture in 4![[thin space (1/6-em)]](https://www.rsc.org/images/entities/char_2009.gif) :
:![[thin space (1/6-em)]](https://www.rsc.org/images/entities/char_2009.gif) 1 ratio. Further the concentration of NaOH/Pt was maintained around 7.5 molar ratio in the EG
1 ratio. Further the concentration of NaOH/Pt was maintained around 7.5 molar ratio in the EG![[thin space (1/6-em)]](https://www.rsc.org/images/entities/char_2009.gif) :
:![[thin space (1/6-em)]](https://www.rsc.org/images/entities/char_2009.gif) water mixture to control a nanoparticle size. The resulting solution was stirred for 30 min at room temperature in open air before injecting. The flow rate for the continuous flow synthesis was maintained at 3.0 mL h−1 and the temperature of the heating furnace was set to 180 °C. The colloidal solution of NPs was collected in the centrifuged tube for immobilization on carbon support.
water mixture to control a nanoparticle size. The resulting solution was stirred for 30 min at room temperature in open air before injecting. The flow rate for the continuous flow synthesis was maintained at 3.0 mL h−1 and the temperature of the heating furnace was set to 180 °C. The colloidal solution of NPs was collected in the centrifuged tube for immobilization on carbon support.
Carbon black (Vulcan XC72) (CB) was pretreated by 6 M HCl solution.25–27 And after the decantation of supernatant, the precipitate was washed thoroughly with ultrapure water (18.7 MΩ cm). The acid treated CB was then filtered and kept for overnight drying at room temperature. To prepare Pt@C material the pretreated CB (30 mg) was dispersed in water (30 mL) using ultra-sonication for 1 hour to obtain homogenous dispersion. The as-synthesized colloidal NPs solution (10 mL) was added to the carbon black solution dropwise under vigorous stirring for overnight mixing. Then 5 M HCl solution was added to the above suspension to adjust the pH ∼2 under constant stirring condition at room temperature. The Pt@C material was then filtered using membrane filter and washed with Milli-Q-water and ethanol to remove Cl− ions from the material. The prepared Pt@C was dried at 50 °C overnight in vacuum oven. The synthesized Pt NPs were decorated on as received Vulcan XC72 for comparison. It was, however, observed that the deposition on without acid treated Vulcan XC72 show irregularity in the shape due to aggregation as shown in Fig. S1.† In this process we can synthesize ∼158 mg of Pt NPs in 1 day and ∼375 mg of Pt@C catalyst in 3 days including washing and drying.
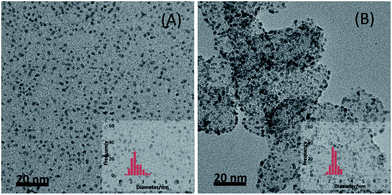
The size distribution and dispersibility of the Pt NPs synthesized using continuous flow method were analyzed using transmission electron microscopy (TEM, JEOL Ltd., JEM-2100F) at 200 kV. Fig. 2 shows the TEM images and the corresponding particle size distribution histograms of Pt NPs and Pt@C catalyst. The average size of the platinum NPs was around 2.3–2.4 nm. As shown in Fig. 2(B) the Pt NPs are uniformly dispersed all over the carbon surface with narrow size distribution. And no obvious change was observed in the size of NPs after loading on to the carbon support. The dispersibility and narrow size distribution attained using continuous synthesis is much better compared to the commercial catalyst. The TEM results showed that the present continuous flow synthesis was highly favorable to achieve the well dispersed Pt NPs over the carbon support.
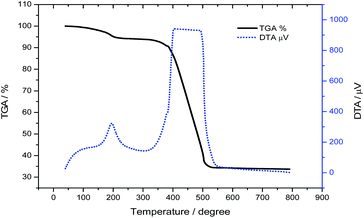
The amount of platinum in the prepared Pt@C material was determined by inductively coupled plasma atomic emission spectroscopy (ICP-AES, PerkinElmer Co., Ltd. Optima 2100DV). The ICP-AES sample was prepared by dissolving the Pt@C in aqua regia (1 mL) followed by heating at 170 °C for 30 min. The solution was then diluted to optimal concentration for the analysis. The Pt loading on the carbon support was also confirmed using thermogravimetric analysis (TGA, Shimadzu Co., DTG-60A) as shown in Fig. 3. The prepared Pt@C material was weighed ∼5 mg and was heated under Ar/air = ¼ (v/v) flow over the temperature range of 40 to 790 °C at 20 °C min−1 for TGA analysis. The amount of Pt content in the prepared catalyst was 33.6%. A gentle weight loss observed in TGA and corresponding sharp peak observed in DTA at 195 °C originated from ethylene glycol which has a boiling point of 197.6 °C. The wide peak originating above 370 °C arises from CB in Pt@C catalyst. Most of ethylene glycol in Pt@C may present on the surface of carbon not on Pt nanoparticles since the TGA curve of pure Pt NPs shows only ∼0.5 wt% loss at 195 °C (see Fig. S2†).
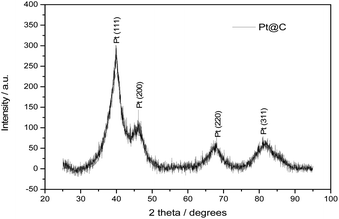
Fig. 4 shows the XRD pattern of Pt@C catalyst synthesized by continuous flow synthesis. The four strong peaks at 2 theta values 39.9, 46.5, 67.8, and 81.2° corresponds to the [111], [200], [220], [311] crystal plane of Pt respectively revealing the fcc structure. The presence of fcc structure planes showed the crystalline nature of Pt NPs decorated over carbon. The Pt [111] plane was used to evaluate the particle size of Pt NPs by Sherrer's equation: D = 0.89λ/(B![[thin space (1/6-em)]](https://www.rsc.org/images/entities/char_2009.gif) cos
cos![[thin space (1/6-em)]](https://www.rsc.org/images/entities/char_2009.gif) θ) where, λ = 0.154 nm and B is the full width at half maximum (FWHM). The calculated particle size of 2.7 nm was in close agreement with the TEM results.
θ) where, λ = 0.154 nm and B is the full width at half maximum (FWHM). The calculated particle size of 2.7 nm was in close agreement with the TEM results.
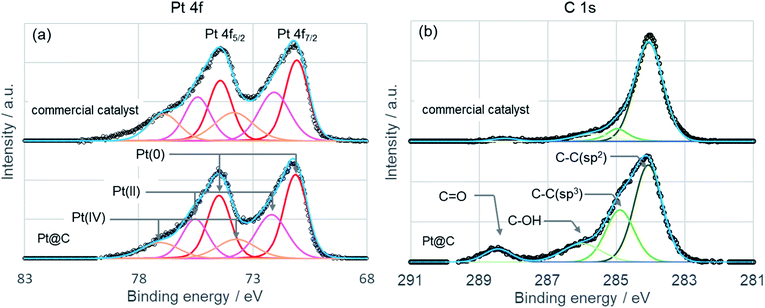
Chemical status of platinum in Pt@C was evaluated by X-ray photoelectron spectroscopy (KRATOS, AXIS Ultra DLD) by using monochromatic Al Kα radiation (1486.6 eV, 150 W) as exciting source. Commercial catalyst was also measured for comparison. Binding energy was externally calibrated by the Au 4f7/2 peak at 83.8 eV. Baseline subtraction and curve fitting was done using Casa XPS software (Version 2.3.17). XP spectra of Pt 4f and C 1s are shown in Fig. 5 as well as the deconvolution of experimental line profile. The Pt 4f peak shows a doublet peak representing Pt 4f7/2 and Pt 4f5/2 from spin–orbital splitting. The peak top of Pt 4f7/2 locates at 71.2 eV for both Pt@C and commercial catalyst indicating almost similar oxidation state. To examine the oxidation state of Pt in more detail, relative atomic concentration was estimated by the peak area of Pt(0), Pt(II), and Pt(IV). The atomic concentration of Pt(0), Pt(II), and Pt(IV) are 48.9%, 32.6%, and 18.5%, respectively, for Pt@C, and 42.9%, 33.0%, and 24.1%, respectively, for commercial catalyst. The atomic concentration of Pt(0) in Pt@C is higher than that of commercial catalyst, and the platinum nanoparticle of Pt@C is more reduced state. This result can be explained by the difference in nanoparticle size of catalysts. In a small nanoparticle, the surface atom increase per unit weight and it becomes easy to oxidize by air. In fact, Pt@C shows a larger Pt nanoparticle size (2.7 nm) by XRD spectrum compared to commercial catalyst (2.0 nm). XRD spectrum of commercial catalyst is shown in Fig. S3.† Deconvolution of the C 1s peak of Pt@C shows sp2 carbon, sp3 carbon, C–OH, and C![[double bond, length as m-dash]](https://www.rsc.org/images/entities/char_e001.gif) O peaks and the peaks of sp3 carbon, C–OH, and C
O peaks and the peaks of sp3 carbon, C–OH, and C![[double bond, length as m-dash]](https://www.rsc.org/images/entities/char_e001.gif) O show higher intensity than those of commercial catalyst. The appearance of sp3 and C–OH peaks is consistent with the TG curve indicating the presence of ethylene glycol. The peak assigned C
O show higher intensity than those of commercial catalyst. The appearance of sp3 and C–OH peaks is consistent with the TG curve indicating the presence of ethylene glycol. The peak assigned C![[double bond, length as m-dash]](https://www.rsc.org/images/entities/char_e001.gif) O can derive from oxidation product of ethylene glycol. Under the presence of sodium hydroxide, the ethylene glycol reduces the metal precursor by undergoing oxidation to form aldehydes and carboxylic acid.28 During the catalyst synthesis, the Pt@C was treated with HCl and precipitated from ethylene glycol solution. Considering the effect of Cl adsorption on Pt surface on electrocatalytic properties, we also performed XPS measurement of Cl 2s peak (see Fig. S4†). The Cl 2s peak was not detected from Pt@C and the effect of Cl species on electrocatalytic properties is considered to be small.
O can derive from oxidation product of ethylene glycol. Under the presence of sodium hydroxide, the ethylene glycol reduces the metal precursor by undergoing oxidation to form aldehydes and carboxylic acid.28 During the catalyst synthesis, the Pt@C was treated with HCl and precipitated from ethylene glycol solution. Considering the effect of Cl adsorption on Pt surface on electrocatalytic properties, we also performed XPS measurement of Cl 2s peak (see Fig. S4†). The Cl 2s peak was not detected from Pt@C and the effect of Cl species on electrocatalytic properties is considered to be small.
Electrochemical surface area (ECSA) of Pt@C and commercial catalyst were evaluated using cyclic voltammetry (CV) technique. Commercial catalyst (30% Pt/CB, Tanaka Kikinzoku Kogyo K. K., TEC10V30E) was used as standard catalyst for comparing the electrochemical performance of synthesized Pt@C catalyst. All electrochemical experiments were used a three compartment electrochemical cell. CV measurements were carried out in argon saturated 0.1 M HClO4 (aq.) using Pt wire as counter electrode, glassy carbon (GC) electrode coated with catalysts as working electrode and reversible hydrogen electrode was used as the reference electrode.29,30 For the preparation of the electrode, a GC (diameter, 5 mm; area, 0.196 cm2) was first polished with alumina (0.05 μm) and rinsed with Milli-Q water twice under sonication. Further, synthesized Pt@C and commercial catalyst (ca. 1 mg) was dispersed using ultrasonification in 0.05% Nafion solution (water![[thin space (1/6-em)]](https://www.rsc.org/images/entities/char_2009.gif) :
:![[thin space (1/6-em)]](https://www.rsc.org/images/entities/char_2009.gif) 2-propanol = 3.2
2-propanol = 3.2![[thin space (1/6-em)]](https://www.rsc.org/images/entities/char_2009.gif) :
:![[thin space (1/6-em)]](https://www.rsc.org/images/entities/char_2009.gif) 1 (v
1 (v![[thin space (1/6-em)]](https://www.rsc.org/images/entities/char_2009.gif) :
:![[thin space (1/6-em)]](https://www.rsc.org/images/entities/char_2009.gif) v)) at 0 °C for 45 min. The calculated amount of catalyst was then casted over the GC electrode fixed on the inverted RDE rotator. To obtain a uniform layer of catalyst over GC electrode surface the electrode was rotated at 700 rpm until complete dry then it was placed in oven for 30 min at 60 °C. The platinum loading density on the prepared electrodes was 10 μg cm−2. Further, these electrodes were used for electrochemical measurements.
v)) at 0 °C for 45 min. The calculated amount of catalyst was then casted over the GC electrode fixed on the inverted RDE rotator. To obtain a uniform layer of catalyst over GC electrode surface the electrode was rotated at 700 rpm until complete dry then it was placed in oven for 30 min at 60 °C. The platinum loading density on the prepared electrodes was 10 μg cm−2. Further, these electrodes were used for electrochemical measurements.
Fig. 6 shows the cyclic voltammogram of Pt@C in comparison with commercial catalyst. CV measurements were performed at a scan rate of 50 mV s−1. The electrochemically active surface areas (ECSAs) were calculated by characteristic hydrogen adsorption peak below 0.4 V. The observed ECSA values of commercial catalyst (64.0 m2 gPt−1) is slightly higher than the prepared Pt@C catalyst (53.5 m2 gPt−1). The lower ECSA values can arise because of the presence of organics at the surface of Pt NPs as evident in TGA and XPS results.
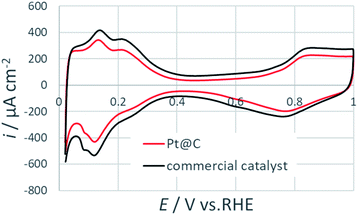 | ||
| Fig. 6 Cyclic voltammograms for Pt@C and commercial catalysts at 50 mV s−1 in an argon saturated 0.1 M HClO4. | ||
To test the electrocatalytic activity, rotatory disk experiment was performed in an oxygen saturated 0.1 M HClO4 solution. Fig. 7 show the comparison of two primitive materials at a rotation speed of 1600 rpm. This result indicated that the electrochemical activity of the synthesized Pt@C catalyst was comparable to the commercial catalyst. The mass activity (ikm) and specific activity (iksp) at 0.9 V vs. RHE was evaluated after the normalization based on Pt loading density for both the catalysts (Table 1). The ikm and iksp of the prepared catalyst was in close agreement to that of the commercial catalyst. The effects of the remaining ethylene glycol and its oxidation products are negligible under present experimental conditions. The slight deviation in the values can be explained on the basis on size of the Pt NPs. The ikm was found to be higher in case of the commercial catalyst as the size of the Pt NPs was smaller for commercial catalyst while the larger size of the NPs in the synthesized catalyst resulted in higher iksp. The observed results are consistent with particle size effect on ORR as reported previously.9 These electrochemical results suggested that prepared Pt@C catalyst with comparable electrochemical activity arising from continuous flow synthesis can be of great advantage for the development of next generation PEMFCs.
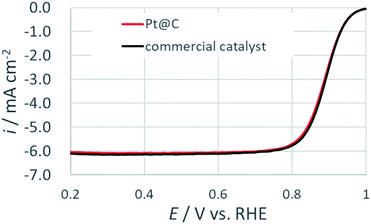 | ||
| Fig. 7 ORR polarization curves for Pt@C and commercial catalysts at 20 mV s−1 in an oxygen saturated 0.1 M HClO4 at a rotation rate of 1600 rpm. | ||
| Sample | Pt loading density (μg cm−2) | ECSA (m2 gPt−1) | ikm (A gPt−1) | iksp (μA cmPt−2) |
|---|---|---|---|---|
| Pt@C | 10 | 53.5 | 397.1 | 742 |
| Commercial catalyst | 10 | 64.0 | 423.4 | 661 |
Conclusions
In conclusion a novel continuous flow synthesis to achieve ultra-small platinum nanoparticles has been demonstrated. The synthesis was achieved without using any protecting agent or harsh reducing agent which makes the post-treatment procedure easier as opposed to conventional batch synthesis. Also the prepared catalyst showed comparable ECSA values to commercial catalyst. Therefore, easy synthesis and post-treatment procedure using continuous flow synthesis will definitely open new insights to scale-up the synthesis of ultra-small nanoparticles and achieve carbon supported catalysts without aggregation and narrow size distribution.Conflicts of interest
There are no conflicts to declare.Acknowledgements
The research reported in this publication was financially supported by the New Energy and Industrial Technology Development Organization (NEDO: grant no. 15100750-0) Japan.Notes and references
- S. Mostafa, F. Behafarid, J. R. Croy, L. K. Ono, L. Li, J. C. Yang, A. I. Frenkel and B. R. Cuenya, J. Am. Chem. Soc., 2010, 132(44), 15714–15719 CrossRef CAS PubMed.
- D. Pedone, M. Moglianetti, E. D. Luca, G. Bardi and P. P. Pompa, Chem. Soc. Rev., 2017, 46, 4951–4975 RSC.
- D. Zhai, B. Liu, Y. Shi, L. Pan, Y. Wang, W. Li, R. Zhang and G. Yu, ACS Nano, 2013, 7(4), 3540–3546 CrossRef CAS PubMed.
- E. Skotadis, D. Mousadakos, K. Katsabrokou, S. Stathopoulos and D. Tsoukalas, Sens. Actuators, B, 2013, 189, 106–112 CrossRef CAS.
- E. F. Holby, W. Sheng, Y. Shao-Horn and D. Morgan, Energy Environ. Sci., 2009, 2, 865–871 RSC.
- G. Lee, J. H. Shim, H. Kang, K. M. Nam, H. Song and J. T. Park, Chem. Commun., 2009, 5036–5038 RSC.
- S. Cherevko, N. Kulyk and K. J. J. Mayrhofer, Nano energy, 2016, 29, 275–298 CrossRef CAS.
- Y. J. Wang, W. Long, L. Wang, R. Yuan, A. Ignaszak, B. Fang and D. P. Wilkinson, Energy Environ. Sci., 2018, 11, 258–275 RSC.
- M. Shao, A. Peles and K. Shoemaker, Nano Lett., 2011, 11(9), 3714–3719 CrossRef CAS PubMed.
- B. Garlyyev, K. Kratzl, M. Rück, J. Michalička, J. Fichtner, T. Kratky, S. Günther, M. Cokoja, A. S. Bandarenka, A. Gagliardi and R. A. Fischer, Angew. Chem., Int. Ed., 2019, 58, 9596–9600 CrossRef CAS PubMed; T. Herricks, J. Chen and Y. Xia, Nano Lett., 2004, 4(12), 2367–2371 CrossRef.
- A. Miyazaki, I. Balint and Y. Nakano, J. Nanopart. Res., 2003, 5, 69–80 CrossRef CAS.
- K. M. Koczkur, S. Mourdikoudis, L. Polavarapu and S. E. Skrabalak, Dalton Trans., 2015, 44, 17883–17905 RSC.
- T. Kondo, T. Morimura, T. Tsujimoto, T. Aikawa and M. Yuasa, Scientific Reports, 2017, 7, 8651 CrossRef PubMed.
- H. Cheng, C. Xi, X. Meng, Y. Hao, Y. Yu and F. Zhao, J. Colloid Interface Sci., 2009, 336, 675–678 CrossRef CAS PubMed.
- H. C. Brown and C. A. Brown, J. Am. Chem. Soc., 1962, 84(14), 2827 CrossRef CAS.
- J. Yang, J. Y. Lee, T. C. Deivaraj and H. P. Too, Langmuir, 2003, 19, 10361–10365 CrossRef CAS.
- J. Kim, B. Fang, M. Kim, V. Tricoli and J. Yu, Catal. Today, 2009, 146, 25–30 CrossRef CAS.
- B. Z. Fang, J. H. Kim, M. S. Kim and J. S. Yu, Acc. Chem. Res., 2013, 46, 1397–1406 CrossRef CAS PubMed.
- Y. J. Wang, B. Fang, H. Li, X. T. Bi and H. Wang, Prog. Mater. Sci., 2016, 82, 445 CrossRef CAS.
- B. Fang, N. K. Chaudhari, M. S. Kim, J. H. Kim and J. S. Yu, J. Am. Chem. Soc., 2009, 131(42), 15330–15338 CrossRef CAS PubMed.
- M. S. Kim, B. Fang, N. K. Chaudhari, M. Song, T. S. Bae and J. S. Yu, Electrochim. Acta, 2010, 55(15), 4543–4550 CrossRef CAS.
- M. S. Kim, S. Lim, N. K. Chaudhari, B. Fang, T. S. Bae and J. S. Yu, Catal. Today, 2010, 158, 354–360 CrossRef CAS.
- B. Fang, M. S. Kim, J. H. Kim, M. Y. Song, Y. J. Wang, H. Wang, D. P. Wilkinson and J. S. Yu, J. Mater. Chem., 2011, 21, 8066–8073 RSC.
- N. Steinfeldt, Langmuir, 2012, 28(36), 13072–13079 CrossRef CAS PubMed.
- J.-Y. Choi, R. S. Hsu and Z. Chen, J. Phys. Chem. C, 2010, 114, 8048–8053 CrossRef CAS.
- A. Guha, W. Lu, T. A. Zawodzinski Jr and D. A. Schiraldi, Carbon, 2007, 45, 1506–1517 CrossRef CAS.
- K. Miyabayashi, H. Nishihara and M. Miyake, Langmuir, 2014, 30, 2936–2942 CrossRef CAS PubMed.
- C. Bock, C. Paquet, M. Couillard, G. A. Botton and B. R. MacDougall, J. Am. Chem. Soc., 2004, 126, 8028–8037 CrossRef CAS PubMed.
- Y. Garsany, J. Ge, J. St-Pierre, R. Rocheleau and K. E. Swider-Lyonsc, J. Electrochem. Soc., 2014, 161, F628–F640 CrossRef CAS.
- M. Chourashiya, R. Sharma and S. M. Andersen, Anal. Chem., 2018, 90, 14181–14187 CrossRef CAS PubMed.
Footnote |
| † Electronic supplementary information (ESI) available. See DOI: 10.1039/c9ra08762a |
| This journal is © The Royal Society of Chemistry 2020 |

