 Open Access Article
Flexible PEBAX/graphene electromagnetic shielding composite films with a negative pressure effect of resistance for pressure sensors applications†
Biao Zhao *ab,
Xi Zhangbc,
Jiushuai Deng*bc,
Chun Zhangd,
Yang Lie,
Xiaoqin Guoa and
Rui Zhang
 ae
ae
aHenan Key Laboratory of Aeronautical Materials and Application Technology, School of Material Science and Engineering, Zhengzhou University of Aeronautics, Zhengzhou, Henan 450046, China. E-mail: biao_zhao@zua.edu.cn; Fax: +86-371-61912600; Tel: +86-371-61912007
bState Key Laboratory of Complex Nonferrous Metal Resources Clean Utilization, Faculty of Land Resource Engineering, Kunming University of Science and Technology, Kunming 650093, China. E-mail: dengshuai689@163.com
cSchool of Chemical & Environmental Engineering, China University of Mining & Technology (Beijing), Beijing 100083, China
dCollege of Materials and Metallurgy Engineering, Guizhou Institute of Technology, Guiyang 550003, China
eSchool of Material Science and Engineering, Zhengzhou University, Zhengzhou, Henan 450001, China
First published on 8th January 2020
Abstract
In the current work, we fabricated flexible poly(ether-block-amide) (PEBAX)/graphene composite films by a combination of facile melt blending and compression molding technique. The graphene content significantly affects the mechanical properties, electrical conductivity and electromagnetic interference (EMI) shielding performance. An electrically conductive percolation threshold of 1.75 vol% graphene was obtained in the PEBAX/graphene composites. With the introduction of 4.45 vol%, and 8.91 vol% graphene content, the average EMI SE of composite films could reach 16.6 and 30.7 dB, respectively. More interestingly, the PEBAX/graphene composite exhibited a nearly-linear negative pressure coefficient (NPC) effect of resistance with increasing outer pressure stimulation, which was attributed to the formation of more conductive pathways caused by the decreased distance between adjacent graphene. In addition, these composites demonstrated good sensing stability, recoverability and reproducibility after stabilization by cyclic pressure loading. The current study provides guidelines for the large-scale preparation of elastomer NPC sensors and smart EMI shielding devices.
1. Introduction
During the past few decades, with the rapid development of electronic devices and wireless communications in daily life, there has been an increasing issue of electromagnetic interference (EMI) pollution, which has significant effects on electronic devices' operation, communication security and raises human health concerns.1–4 Therefore, much attention has been paid to the development of novel and exceptional EMI shielding materials.5–8 Promising electromagnetic shielding materials should possess the characteristics of strong blocking performance, high electrical conductivity, excellent strength and anti-corrosion ability. Generally, metals and metal alloys display outstanding EMI shielding effectiveness due to excellent electrical conductivity. However, many flaws, such as high density, easy corrosion, low flexibility and complex manufacturing processes, hamper their utilization and development in electromagnetic shielding.9,10Compared with EMI shields based on metals, conductive polymer composites (CPCs) have received extensive attention in EMI shielding recently due to their numerous advantages, such as good processability, light weight, tunable conductivity, and resistance to corrosion.11–13 It has been well anticipated that the EMI shielding effectiveness of CPCs is closely associated with the electrical conductivity.14,15 To obtain the target shielding property, considerably appropriate filler loading is required. In the practical application, when subjected to outer force, how to maintain the strong EMI shielding properties remained challenge. Thus, the compressibility of CPCs should be firstly considered when one wants to obtain high-efficiency EMI shielding ability. Encouragingly, there are several publications about compressive behavior of EMI shielding materials under force stimulation, such as carbon-wrapped metallic Ag nanowire hybrid sponges,16 Cu nanowire@graphene core–shell aerogels,17 porous multiwalled carbon nanotube/water-borne polyurethane composites,18 light graphene foams,19,20 and carbon nanotube–multilayered graphene edge plane core–shell hybrid foams.21 These materials exhibited exceptional EMI shielding properties along with superior compressibility, which renders their great potential as promising candidates for high-performance EMI shielding in flexible electronic devices.
Pressure sensors based on the resistance change upon exposing to mechanical deformation have attracted much attenuation due to their widespread applications including health monitoring,22 and movement detection.23 High sensitivity, good reproducibility, and good processability are necessarily required for satisfactory pressure sensing. Recently, CPCs based sensors have been widely investigated owing to their fast response in the style of electrical resistance variation when exposed to tensile or compressive strain.24–27 Generally, the CPCs based sensors always presented positive pressure coefficient (PPC) effect of resistance, namely, the electrical resistance of CPCs increased with an increased outer stimulated pressure. For example, thermoplastic polyurethane (TPU)/graphene,28 epoxy/CNTs,29 poly(propylene)/CNTs,30 and TPU/carbon nanotubes (CNTs)31 showed good strain sensing ability with PPC effect of resistance. To the best of our knowledge, there are scarce reports about the CPCs sensors with NPC effect of resistance. Moreover, the above mentioned CPCs sensors also possess the demerit of the limited stretchability of the matrix and poor filler–polymer interaction. How to select suitable polymer matrix with satisfied stretchability and outstanding processability is significant for pressure sensing.
Polyether block amides (PEBAX) are a relatively new family of thermoplastic elastomers, consisting of linear chains of hard polyamide blocks as crystalline hard segments and polyether blocks as soft segments. Interestingly, PEBAX exhibits a mechanical behavior ranging from that of thermoplastics to elastomers.32 In current study, we detailedly investigated the mechanical properties, electrical conductivity and EMI shielding performance of PEBAX/graphene composite films. Under cyclic pressure stimulation, the PEBAX/graphene composite films exhibited a negative pressure coefficient (NPC) effect of resistance with increasing outer pressure stimulation. This study paves a guide for the preparation of elastomer NPC sensors and smart EMI shielding devices.
2. Experimental section
2.1 Materials
PEBAX 3533 was provided by Arkema, France, with a density of 1.01 g cm−3 and a melting temperature of 143.5 °C. Graphene was supplied by Shenzhen Turing Evolution Technology Co., Ltd., with a specific surface area of 50–200 m2 g−1, thickness of 1–3 layers, and carbon purity of 98%.2.2 Preparation of PEBAX/graphene
PEBAX/graphene composites were prepared by a facile melt-mixing method, as shown in Fig. 1. Typically, 50 g of the mixture was weighed, and added to the mixing chamber of XSS-330 torque-rheometer. Then, the melt blending temperature is 175 °C for 6 min with the rotation speed of 80 rpm, and the experimental recipe is shown in Table 1. Then, the blended sample was molded by a LN-50T flat vulcanizing machine under the template temperature of 175 °C preheated for 10 min. After the preheating, the sample was subjected at a pressure of 15 MPa for 4 min to obtain final products.| wt% (vol%) | PEBAX/g | Graphene/g | wt% (vol%) | PEBAX/g | Graphene/g |
|---|---|---|---|---|---|
| 0 (0) | 50 | 0 | 1 (0.446) | 49.5 | 0.5 |
| 0.01 (0.0045) | 49.995 | 0.005 | 2 (0.891) | 49.0 | 1.0 |
| 0.02 (0.0089) | 49.99 | 0.01 | 5 (2.23) | 47.5 | 2.5 |
| 0.05 (0.0223) | 49.975 | 0.025 | 10 (4.45) | 45 | 5 |
| 0.1 (0.0445) | 49.95 | 0.05 | 15 (6.68) | 42.5 | 7.5 |
| 0.2 (0.0891) | 49.9 | 0.1 | 20 (8.91) | 40 | 10 |
| 0.5 (0.223) | 49.75 | 0.25 |
2.3 Characterization
To evidence the dispersion of graphene in the composites, samples were cut into 30 μm-thick films using an RM2235 microtome (Leica, Germany) and were observed using a BX51 microscope (Olympus, Japan) equipped with a MicroPublisher 3.3 RTV CCD camera. Scanning electron microscopy (SEM) observation was performed by a field emission scanning electron microscopy (FESEM, Nova Nano SEM 450, FEI) at an accelerating voltage of 3 kV. The specimens were cryogenically fractured in liquid nitrogen, and then the freshly fractured surfaces were coated with a thin layer of gold prior to being observed.33 High-resolution transmission electron microscopy (HRTEM, JEM-2100F, Japan) observation was performed at an accelerating voltage of 200 kV.| R = |S11|2 | (1) |
| T = |S21|2 | (2) |
| A = 1 − R − T | (3) |
SER = −10![[thin space (1/6-em)]](https://www.rsc.org/images/entities/char_2009.gif) log10(1 − R) log10(1 − R)
| (4) |
SEA = −10![[thin space (1/6-em)]](https://www.rsc.org/images/entities/char_2009.gif) log10(T/(1 − R)) log10(T/(1 − R))
| (5) |
| SET = SEA + SER + SEM | (6) |
3. Results and discussion
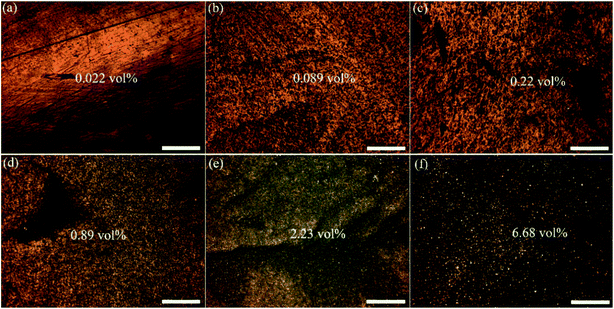
The TEM micrographs (Fig. S1†) of the graphene clearly shows a large, ultrathin, transparent laminar structure with a large number of wrinkles on the surface. To intuitively watch the graphene distribution and the formation of electrical conductive network, morphological comparison of various PEBAX/graphene composites was first carried out via optical microscope (OM) observation in a transmission light mode, as shown in Fig. 2. With the increase of graphene content from 0.022 vol% to 6.68 vol%, more black aggregation would be obtained, which could be assigned to graphene accumulation and the conductive pathways composed by incomputable graphene become thicker, indicating the perfection of the conductive network. It is well accepted that the formation of conductive network would influence the electrical conductivity and further affect the EMI shielding properties.6,21,41 To further identify the distribution of graphene and connected state between conductive graphene, SEM observation was performed (Fig. 3). From the SEM images, the random distribution of graphene imbedded into PEBAX matrix could be gradually more visible. It was noted that composite containing 2.23 vol% graphene already established interconnected graphene networks. With the increase of filler contents, denser graphene networks were observed. This bridging network could be regarded as electron transport channels in the PEBAX/graphene composite films, which would cause ohmic loss under irradiated by alternating EM fields.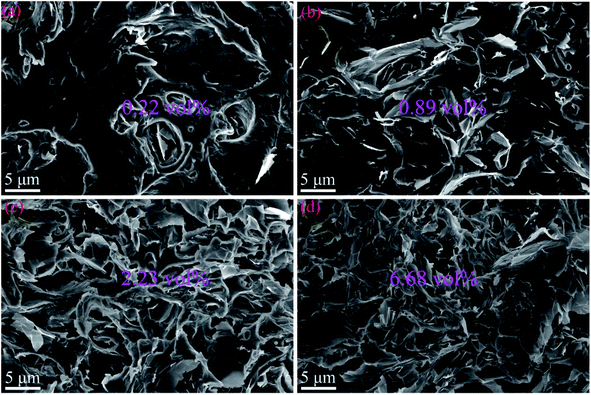 | ||
| Fig. 3 SEM images of cryofractured surface of PEBAX/graphene films with various graphene content: (a) 0.22 vol%, (b) 0.89 vol%, (c) 2.23 vol% and (d) 6.68 vol%. | ||
The electrical conductivity is one of the main factors affecting its EMI shielding performance. The behavior of electrical conductivity with the addition of a conductive filler particle can be explained by the assist of percolation theory.42,43 The theory provides a concept about the minimal amount of conductive filler needed to convert an insulating polymer matrix to a conductive one.14,44 As in Fig. 4, conductivity versus filler concentration plot can be broadly divided into three regions: insulating region, rapid increasing region and formation of plateau electrical network. At a lower concentration of filler, the composite act as an insulating material since the filler particles are separated from one another without the generation of a continuous conductive network. Then it shows an abrupt increase in conductivity due to the formation of a continuous conductive network by the arrangement of filler particles in the polymer matrix. Beyond a particular concentration, a very small increment in conductivity is observed and this unique concentration is named as the electrical percolation threshold concentration. Finally, more or less plateau region is formed beyond the threshold concentration of filler without any significant increase in conductivity. Excessive addition of filler above the threshold concentration can lead to an increase in agglomeration and aggregation of filler part which will make less contribution to enhancing electrical conductivity.
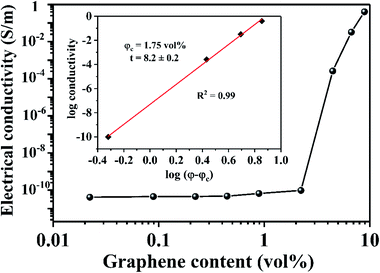 | ||
| Fig. 4 Electrical conductivity versus graphene content for the PEBAX/graphene composite films. The inset shows the power law fitting of conductivity data. | ||
To determine the electrical percolation threshold for the PEBAX/graphene composites, a power law relation, which was derived from the percolation theory, was used as follows:28,45,46
| σ = σ0(φ − φc)t | (7) |
In this equation, σ is the electrical conductivity, σ0 is a scaling factor, φ is the volume fraction of the filler, φc is the electrical percolation threshold volume fraction, and t is a critical exponent dependent on the electrical network mechanism. The inset in Fig. 4 shows the best fit result using the power law equation, and φc is calculated to be 1.75 vol%. A higher value of t indicates the conductivity is imparted by the contact between individual 2D graphene.47
In order to justify the applications of the PEBAX/graphene composite films in electromagnetic field, the mechanical properties of the composite films were investigated. As shown in Fig. 5, the mechanical properties of composite films is significantly altered when incorporating graphene fillers. It is interesting that the yield stress of the composites shifts to higher value and the yield strain decreases with the increasing graphene loading (Fig. 5a). The phenomenon is widely accepted as a results of the restriction on the polymer chain movement.48 However, the elongation at break (Fig. 5d) decrease with the higher graphene content owing to the agglomerates of the fillers which induces failure points during the deformation.49
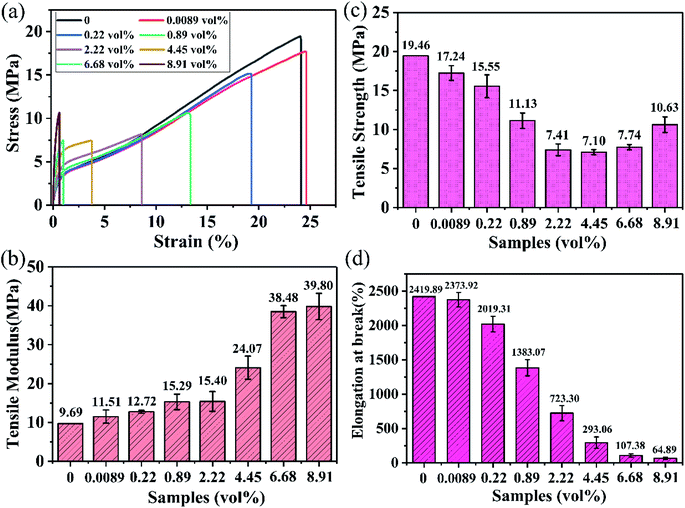 | ||
| Fig. 5 (a) Typical stress–strain curves, (b) tensile strength, (c) tensile modulus and (d) elongation at break of various PEBAX/graphene composite films. | ||
For particulate filled composites, strength relies on the effectiveness of stress transfer between the host polymer matrix and the filler material. Particle/matrix interfacial strength and particle loading significantly affect the composite strength.50 The samples with less than 4.45 vol% graphene show clearly elastic behavior, and change to the typical brittle behavior with higher graphene content. Similarly, the tensile strength (Fig. 5b) decreases first when the graphenes content is below 4.45 vol%. It indicates the poor bonding between the matrix polymer and graphene. However, when the graphene access 4.45 vol%, the tensile strength increases. Moreover, although the tensile modulus (Fig. 5c) monotonically increases with the filler content, an abrupt increase is observed when the loading excessing 4.45 vol%. All abrupt change suggests different mechanisms behind these conditions. This critical loading content has been identified for elastomer composites for several other systems, for example: carbon black,51 clay,48 graphene-based fillers52,53 and so on. This accelerated stiffening effects have been identified and analysis in several researches51 too. The critical filler loading content determined how the filler reacted to the loading. When the filler is below the critical point, the final performance is considered depending on the individual filler. According to the simple mixing rule, the properties of the composite behave in a linear pattern. However, when the loading is above the critical loading content, a percolation threshold is reached. The average distance between the filler is small enough to be considered not only individually but also simultaneously attribute to the final properties. In other word, a “net-work” structure is formed. This percolated structure will remarkably affect the mechanical performance of the PEBAX/graphene composite films.
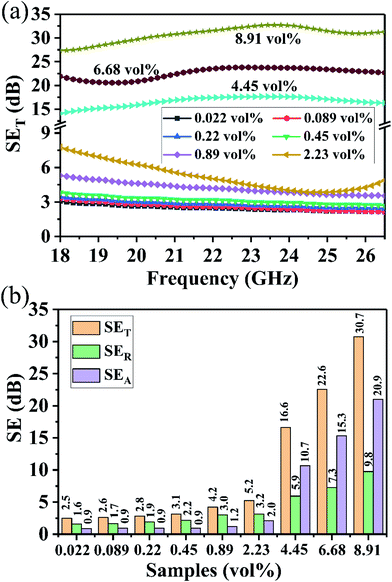
Now, our focus turns to the EMI shielding performance of as-prepared PEBAX/graphene composite films. Fig. 6a depicts the EMI SE of PEBAX/graphene composite films with the thickness of 2.0 mm over 18–26.5 GHz ranges. The EMI SE values of PEBAX/graphene composite films display weakly frequency dependence across the measured range. Interestingly, the EMI SE increases slowly with an elevated graphene amount below percolation threshold, while it increases remarkably with an increased graphene content more than percolation threshold, which mainly results from the enhanced electrical conductivity at higher graphene loading. With the addition of 4.45 vol%, 6.68 vol% and 8.91 vol% amounts, the average EMI SE of composite films could reach up to 16.6, 22.6 and 30.7 dB, respectively. More importantly, the EMI SE beyond 10 dB in the measured frequency range indicated that the prepared composite films can satisfy the requirements of traditional electromagnetic shielding materials.54
It is supposed that the EMI SE of a material originates from the reflection and absorption mechanisms. The reflection of EM wave takes place because of the impedance mismatch between air and materials. The absorption results from the conduction loss (dissipation of energy through the current flow in phase with the alternating EM wave), the polarization loss (attenuation of energy by surmounting the momentum required to reorient the dipoles in the applied EM wave) and the magnetic loss (stemming from magnetic particles in the EM field).55–57 Herein, to understand the mechanism of electromagnetic shielding, average SET, SEA and SER of composite films with various filler loading are calculated and were presented in Fig. 6b. The SET and the SEA are significantly improved with increasing graphene filler content above percolation threshold. However, the SER depicts a smaller increase dependence on graphene filler contents. With the 6.68 vol% and 8.91 vol% loading, the value of SEA reaches 15.3 dB and 20.9 dB, respectively, almost 67.7% and 68.1% of SET, indicating the absorption dominant shielding mechanism rather than reflection in the prepared composite films. As is mentioned above, the reflection mechanism of EMI shielding results from the impedance mismatch between air and materials. This depends on conductivity of shielding material, which is correlated with the interaction between mobile charge carriers of the material and the electromagnetic field.38,58,59 For the absorption, it always originates from the conduction loss (i.e., the ohmic loss) and the polarization loss.60,61 The conduction loss is associated with attenuation of energy through the current flow via the conduction, hopping, and tunneling mechanisms.54 Here, the existence of the interfaces between the graphene and PEBAX would cause interfacial polarization loss in an electromagnetic field,62 which is usually considered to be happened in a heterogeneous interface and was caused by the accumulated charge in the interface.63,64 Additionally, due to unique two-dimensional structure of graphene, the multiple reflections would also promote the microwaves absorption.65,66
To investigate the influence of pressure stimulation on the conductivity of composite films, a home-made measurement setup (Fig. S2†) was used to get the in situ electrical conductivity under pressure stimulation. Fig. 7 exhibits the conductivity–pressure behavior of composite films with different graphene contents for 5 times cycles under continuous pressure (up to 24.67 kPa). Interestingly, the value of electrical conductivity increases gradually with increasing pressure, which is defined as the negative pressure effect.67,68 This is attributed to the more connection of graphene networks and the decease the distance between fillers (graphene), both inducing an increase of conductivity. After unloading, conductivity nearly recover initial level, causing a reversible phenomenon, which is due to the elastomer properties of PEBAX.32 During the cyclic loading as shown in Fig. 7a and b, the composite films present different trends during the loading process, and good recoverability after stabilization by cyclic loading were obtained. The demonstration experiments indicate that flexible PEBAX/graphene composite films are promising negative pressure resistance materials in pressure sensors. Amazingly, in comparison with composite films with relative low graphene content (Fig. 7a), the composite film with 4.45 vol% graphene displayed the elevating conductivity during cyclic loading. Though the reason of this phenomenon has not been figured out, both the variation of elastomer properties of composite films and the struggle between the disruption and rebuilding of the conductive paths may account for this phenomenon.
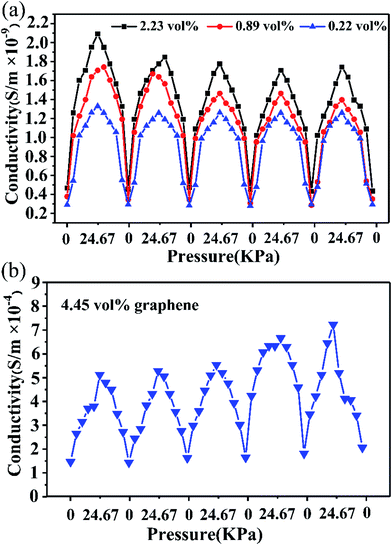 | ||
| Fig. 7 Conductivity–pressure behavior of composite films with (a) different graphene contents (0.22–2.23 vol%) and (b) 4.45 vol% loading for 5 times cycles, up to high pressure of 24.67 kPa. | ||
To better cotton on the change of electrical conductivity under the cyclic pressure, a scheme illustration about the change of graphene networks in a single cycle is proposed to describe the mechanism (Fig. 8). For the original graphene conductive network, the lamella–lamella connection of graphene conductive networks is formed in PEBAX. When the outer pressure was placed on the composite films, due to the mechanical flexibility of graphene, it stretches and creeps along the PEBAX chains, resulting in the formation of more graphene–graphene contacts and the decrease of the tunneling distance between conductive graphene fillers. Meanwhile, some break conductive pathways occurred. The reconstruction of the conductive network is predominant in the loading process, so an increasing conductivity is obtained. During the unloading process, due to superior elasticity of PEBAX, the fresh conductive networks return to their original states. In the following cycles, a gradual increase in the maximum conductivity is observed, which is caused by the formation of irreversible construction of graphene networks under cyclic pressure. Although we cannot in situ measure the EMI shielding properties of composite films under the pressure stimulation due to the device limitation, we can predict the enhanced EMI shielding properties thanks to the increased electrical conductivity stimulated by outer pressure. Thus, these composite films could be a promising smart pressure-induced EMI shielding materials.
4. Conclusion
Graphene/PEBAX composite films were prepared using a facile melt-mixing scheme. Herein, the concentration of graphene fillers could significantly affect the mechanical properties, electrical conductivity and EMI shielding properties of composite films. The results showed that graphene/PEBAX composite films with less than 4.45 vol% graphene show clearly elastic behavior, and change to the typical brittle behavior with higher graphene content. By elevating graphene loading, the electrical conductivity is increased correspondingly, and the percolation threshold is 1.75 vol%. With the addition of 4.45 vol%, and 8.91 vol% graphene amounts, the average EMI SE of composite films could reach up to 16.6 and 30.7 dB, respectively. Moreover, the absorption rather than reflection is the main shielding mechanism. When subjected to cyclic pressure loading, the pressure sensing behavior of graphene/PEBAX composite films was examined. Noticeably, the value of electrical resistance decreases gradually with increasing pressure amplitude, namely, negative pressure effect. An analytical model derived from the theory of conductive pathways was applied to describe the conductivity response to pressure. The change in the number of conductive pathways and tunneling distance under pressure account for the resistance–pressure sensing behaviors. In a word, the composite films exhibit good sensitivity and sensing stability and possess good recoverability and reproducibility after stabilization by cyclic loading, showing good discernment in pressure sensing.Conflicts of interest
There are no conflicts to declare.Acknowledgements
The authors gratefully appreciate the financial support of this work by the National Natural Science Foundation of China (51764022, 51802289 and 51863003), and Key Science and Technology Program of Henan Province (182102210108).References
- H. Duan, H. Zhu, J. Yang, J. Gao, Y. Yang, L. Xu, G. Zhao and Y. Liu, Composites, Part A, 2019, 118, 41–48 CrossRef CAS.
- H. Lv, X. Liang, G. Ji, H. Zhang and Y. Du, ACS Appl. Mater. Interfaces, 2015, 7, 9776–9783 CrossRef CAS PubMed.
- Q. Liu, Q. Cao, H. Bi, C. Liang, K. Yuan, W. She, Y. Yang and R. Che, Adv. Mater., 2016, 28, 486–490 CrossRef CAS PubMed.
- B. Zhao, X. Guo, W. Zhao, J. Deng, B. Fan, G. Shao, Z. Bai and R. Zhang, Nano Res., 2017, 10, 331–343 CrossRef CAS.
- L. Zhu, X. Zeng, M. Chen and R. Yu, RSC Adv., 2017, 7, 26801–26808 RSC.
- X. Li, S. Zeng, S. E, L. Liang, Z. Bai, Y. Zhou, B. Zhao and R. Zhang, ACS Appl. Mater. Interfaces, 2018, 10, 40789–40799 CrossRef CAS PubMed.
- A. Ameli, S. Wang, Y. Kazemi, C. B. Park and P. Pötschke, Nano Energy, 2015, 15, 54–65 CrossRef CAS.
- B. Zhao, X. Guo, W. Zhao, J. Deng, G. Shao, B. Fan, Z. Bai and R. Zhang, ACS Appl. Mater. Interfaces, 2016, 8, 28917–28925 CrossRef CAS PubMed.
- D. Xing, L. Lu, K. S. Teh, Z. Wan, Y. Xie and Y. Tang, Carbon, 2018, 132, 32–41 CrossRef CAS.
- J. Liang, Y. Gu, M. Bai, S. Wang, M. Li and Z. Zhang, Composites, Part A, 2019, 121, 289–298 CrossRef CAS.
- D. Li, X. Liang, W. Liu, J. Ma, Y. Zhang, G. Ji and W. Meng, J. Colloid Interface Sci., 2017, 507, 131–138 CrossRef CAS PubMed.
- A. Ameli, Y. Kazemi, S. Wang, C. B. Park and P. Pötschke, Composites, Part A, 2017, 96, 28–36 CrossRef CAS.
- F. Shahzad, M. Alhabeb, C. B. Hatter, B. Anasori, S. Man Hong, C. M. Koo and Y. Gogotsi, Science, 2016, 353, 1137 CrossRef CAS PubMed.
- W.-C. Yu, J.-Z. Xu, Z.-G. Wang, Y.-F. Huang, H.-M. Yin, L. Xu, Y.-W. Chen, D.-X. Yan and Z.-M. Li, Composites, Part A, 2018, 110, 237–245 CrossRef CAS.
- K. Hayashida and Y. Matsuoka, Carbon, 2015, 85, 363–371 CrossRef CAS.
- Y.-J. Wan, P.-L. Zhu, S.-H. Yu, R. Sun, C.-P. Wong and W.-H. Liao, Small, 2018, 14, 1800534 CrossRef PubMed.
- S. Wu, M. Zou, Z. Li, D. Chen, H. Zhang, Y. Yuan, Y. Pei and A. Cao, Small, 2018, 14, 1800634 CrossRef PubMed.
- Z. Zeng, H. Jin, M. Chen, W. Li, L. Zhou and Z. Zhang, Adv. Funct. Mater., 2016, 26, 303–310 CrossRef CAS.
- C. Hu, J. Xue, L. Dong, Y. Jiang, X. Wang, L. Qu and L. Dai, ACS Nano, 2016, 10, 1325–1332 CrossRef CAS PubMed.
- H. Li, L. Jing, Z. L. Ngoh, R. Y. Tay, J. Lin, H. Wang, S. H. Tsang and E. H. T. Teo, ACS Appl. Mater. Interfaces, 2018, 10, 41707–41716 CrossRef CAS PubMed.
- Q. Song, F. Ye, X. Yin, W. Li, H. Li, Y. Liu, K. Li, K. Xie, X. Li, Q. Fu, L. Cheng, L. Zhang and B. Wei, Adv. Mater., 2017, 29, 1701583 CrossRef PubMed.
- M. Li, H. Li, W. Zhong, Q. Zhao and D. Wang, ACS Appl. Mater. Interfaces, 2014, 6, 1313–1319 CrossRef CAS PubMed.
- C. Yan, J. Wang, W. Kang, M. Cui, X. Wang, C. Y. Foo, K. J. Chee and P. S. Lee, Adv. Mater., 2014, 26, 2022–2027 CrossRef CAS PubMed.
- Y. Si, J. Yu, X. Tang, J. Ge and B. Ding, Nat. Commun., 2014, 5, 5802 CrossRef PubMed.
- H. Wei, D. Ding, S. Wei and Z. Guo, J. Mater. Chem. A, 2013, 1, 10805–10813 RSC.
- M. K. Shin, J. Oh, M. Lima, M. E. Kozlov, S. J. Kim and R. H. Baughman, Adv. Mater., 2010, 22, 2663–2667 CrossRef CAS PubMed.
- P. Slobodian, P. Riha and P. Saha, Carbon, 2012, 50, 3446–3453 CrossRef CAS.
- H. Liu, Y. Li, K. Dai, G. Zheng, C. Liu, C. Shen, X. Yan, J. Guo and Z. Guo, J. Mater. Chem. C, 2016, 4, 157–166 RSC.
- Alamusi, W. F. Yuan, Surina, Y. Li, N. Hu, H. M. Ning, Y. L. Liu, L. K. Wu, S. Atobe and H. Fukunaga, Appl. Phys. Lett., 2013, 103, 221903 CrossRef.
- J. Zhao, K. Dai, C. Liu, G. Zheng, B. Wang, C. Liu, J. Chen and C. Shen, Composites, Part A, 2013, 48, 129–136 CrossRef CAS.
- Q. Fan, Z. Qin, S. Gao, Y. Wu, J. Pionteck, E. Mäder and M. Zhu, Carbon, 2012, 50, 4085–4092 CrossRef CAS.
- M. R. Barzegari, N. Hossieny, D. Jahani and C. B. Park, Polymer, 2017, 114, 15–27 CrossRef CAS.
- E. Zhou, J. Xi, Y. Guo, Y. Liu, Z. Xu, L. Peng, W. Gao, J. Ying, Z. Chen and C. Gao, Carbon, 2018, 133, 316–322 CrossRef CAS.
- J. Gao, J. Luo, L. Wang, X. Huang, H. Wang, X. Song, M. Hu, L.-C. Tang and H. Xue, Chem. Eng. J., 2019, 364, 493–502 CrossRef CAS.
- Y. Yuan, W. Yin, M. Yang, F. Xu, X. Zhao, J. Li, Q. Peng, X. He, S. Du and Y. Li, Carbon, 2018, 130, 59–68 CrossRef CAS.
- Q. Song, F. Ye, X. Yin, W. Li, H. Li, Y. Liu, K. Li, K. Xie, X. Li, Q. Fu, L. Cheng, L. Zhang and B. Wei, Adv. Mater., 2017, 29, 1701583 CrossRef PubMed.
- S. Zhu, C. Xing, F. Wu, X. Zuo, Y. Zhang, C. Yu, M. Chen, W. Li, Q. Li and L. Liu, Carbon, 2019, 145, 259–265 CrossRef CAS.
- B. Zhao, S. Wang, C. Zhao, R. Li, S. M. Hamidinejad, Y. Kazemi and C. B. Park, Carbon, 2018, 127, 469–478 CrossRef CAS.
- L.-C. Jia, L. Xu, F. Ren, P.-G. Ren, D.-X. Yan and Z.-M. Li, Carbon, 2019, 144, 101–108 CrossRef CAS.
- T. K. Gupta, B. P. Singh, S. R. Dhakate, V. N. Singh and R. B. Mathur, J. Mater. Chem. A, 2013, 1, 9138–9149 RSC.
- H. Lv, Z. Yang, P. L. Wang, G. Ji, J. Song, L. Zheng, H. Zeng and Z. J. Xu, Adv. Mater., 2018, 30, 1706343 CrossRef PubMed.
- C. W. Nan, Y. Shen and J. Ma, Annu. Rev. Mater. Res., 2010, 40, 131–151 CrossRef CAS.
- Z.-M. Dang, M.-S. Zheng and J.-W. Zha, Small, 2016, 12, 1688–1701 CrossRef CAS PubMed.
- R. Ravindren, S. Mondal, K. Nath and N. C. Das, Composites, Part A, 2019, 118, 75–89 CrossRef CAS.
- T.-W. Lee, S.-E. Lee and Y. G. Jeong, ACS Appl. Mater. Interfaces, 2016, 8, 13123–13132 CrossRef CAS PubMed.
- B. Zhao, C. Zhao, R. Li, S. M. Hamidinejad and C. B. Park, ACS Appl. Mater. Interfaces, 2017, 9, 20873–20884 CrossRef CAS.
- D. X. Yan, H. Pang, B. Li, R. Vajtai, L. Xu, P. G. Ren, J. H. Wang and Z. M. Li, Adv. Funct. Mater., 2015, 25, 559–566 CrossRef CAS.
- S. M. Liff, N. Kumar and G. H. McKinley, Nat. Mater., 2007, 6, 76–83 CrossRef CAS PubMed.
- V. G. Sreeja, G. Vinitha, R. Reshmi, M. K. Jayaraj and E. I. Anila, Mater. Today: Proc., 2019, 10, 456–465 CAS.
- J. G. Lyons, J. E. Kennedy, S. Lordan, L. M. Geever and C. L. Higginbotham, J. Mater. Sci., 2010, 45, 3204–3214 CrossRef CAS.
- E. Guth, J. Appl. Phys., 1945, 16, 20–25 CrossRef CAS.
- A. Das, G. R. Kasaliwal, R. Jurk, R. Boldt, D. Fischer, K. W. Stöckelhuber and G. Heinrich, Compos. Sci. Technol., 2012, 72, 1961–1967 CrossRef CAS.
- S. Araby, I. Zaman, Q. Meng, N. Kawashima, A. Michelmore, H.-C. Kuan, P. Majewski, J. Ma and L. Zhang, Nanotechnology, 2013, 24, 165601 CrossRef PubMed.
- F. Ren, Z. Li, L. Xu, Z. Sun, P. Ren, D. Yan and Z. Li, Composites, Part B, 2018, 155, 405–413 CrossRef CAS.
- F. Sharif, M. Arjmand, A. A. Moud, U. Sundararaj and E. P. L. Roberts, ACS Appl. Mater. Interfaces, 2017, 9, 14171–14179 CrossRef CAS PubMed.
- Y. Zhan, J. Wang, K. Zhang, Y. Li, Y. Meng, N. Yan, W. Wei, F. Peng and H. Xia, Chem. Eng. J., 2018, 344, 184–193 CrossRef CAS.
- H. Wang, N. Li, J. Niu, K. Teng, Z. Xu, M. Jing, F. Li, W. Wang and X. Zhang, Composites, Part A, 2019, 121, 321–329 CrossRef CAS.
- S. Zhao, H.-B. Zhang, J.-Q. Luo, Q.-W. Wang, B. Xu, S. Hong and Z.-Z. Yu, ACS Nano, 2018, 12, 11193–11202 CrossRef CAS.
- B. Zhao, C. Zhao, M. Hamidinejad, C. Wang, R. Li, S. Wang, K. Yasamin and C. B. Park, J. Mater. Chem. C, 2018, 6, 10292–10300 RSC.
- S. Naeem, V. Baheti, V. Tunakova, J. Militky, D. Karthik and B. Tomkova, Carbon, 2017, 111, 439–447 CrossRef CAS.
- B. Zhao and C. B. Park, J. Mater. Chem. C, 2017, 5, 6954–6961 RSC.
- T. Xia, C. Zhang, N. A. Oyler and X. Chen, Adv. Mater., 2013, 25, 6905–6910 CrossRef CAS PubMed.
- H. Lv, H. Zhang, G. Ji and Z. J. Xu, ACS Appl. Mater. Interfaces, 2016, 8, 6529–6538 CrossRef CAS PubMed.
- B. Zhao, G. Shao, B. Fan, W. Zhao and R. Zhang, Phys. Chem. Chem. Phys., 2015, 17, 2531–2539 RSC.
- B. Zhao, G. Shao, B. Fan, W. Zhao, Y. Xie and R. Zhang, J. Mater. Chem. A, 2015, 3, 10345–10352 RSC.
- B. Zhao, X. Zhang, J. Deng, Z. Bai, L. Liang, Y. Li and R. Zhang, Phys. Chem. Chem. Phys., 2018, 20, 28623–28633 RSC.
- K. Chu, S.-C. Lee, S. Lee, D. Kim, C. Moon and S.-H. Park, Nanoscale, 2015, 7, 471–478 RSC.
- X. Cui, J. Chen, Y. Zhu and W. Jiang, J. Mater. Chem. C, 2018, 6, 9354–9362 RSC.
Footnote |
| † Electronic supplementary information (ESI) available. See DOI: 10.1039/c9ra08679j |
| This journal is © The Royal Society of Chemistry 2020 |


