
 Open Access Article
 This Open Access Article is licensed under a Creative Commons Attribution-Non Commercial 3.0 Unported Licence
Electrochemical detection of 2-nitrophenol using a heterostructure ZnO/RuO2 nanoparticle modified glassy carbon electrode†
Md. Tamez Uddin *a,
Md. Mahmud Alama,
Abdullah Mohamed Asiribc,
Mohammed Muzibur Rahmanbc,
Thierry Toupanced and
Md. Akhtarul Islama
*a,
Md. Mahmud Alama,
Abdullah Mohamed Asiribc,
Mohammed Muzibur Rahmanbc,
Thierry Toupanced and
Md. Akhtarul Islama
aDepartment of Chemical Engineering and Polymer Science, Shahjalal University of Science and Technology, Sylhet 3114, Bangladesh. E-mail: mtuddin_cep@yahoo.com; Fax: +880 821 715257; Tel: +880 821 717850 ext. 681
bChemistry Department, King Abdulaziz University, Faculty of Science, P.O. Box 80203, Jeddah 21589, Saudi Arabia
cCenter of Excellence for Advanced Material Research (CEAMR), King Abdulaziz University, P.O. Box 80203, Jeddah 21589, Saudi Arabia
dInstitut des Sciences Moléculaires, Univ. Bordeaux, UMR 5255 CNRS, 351 Cours de la Libération, F-33405 Talence Cédex, France
First published on 24th December 2019
Abstract
A highly selective chemisensor for 2-nitrophenol detection was fabricated using ZnO/RuO2 nanoparticles (NPs) synthesized by impregnation method. The as-synthesized NPs were characterized through UV-vis diffuse reflectance spectroscopy, X-ray photoelectron spectroscopy (XPS), field emission scanning electron microscopy (FESEM), Energy dispersive X-ray spectroscopy (EDS), FTIR and X-ray diffraction (XRD). A glassy carbon electrode was modified with as-synthesized ZnO/RuO2 nanoparticles and utilized as a chemical sensor for the detection of 2-nitrophenol. The fabricated sensor exhibited excellent sensitivity (18.20 μA μM−1 cm−2), good reproducibility, short response time (8.0 s.), the lowest detection limit (52.20 ± 2.60 pM) and long-term stability in aqueous phase without interference effects. Finally, the fabricated sensor was validated as a 2-NP probe in various environmental water samples at room conditions.
Introduction
Nitrophenols are important and versatile organic compounds in industrial, agricultural and defense applications. These chemicals are frequently used as intermediates in the manufacture of explosives, pharmaceuticals, pesticides, pigments, dyes, rubber chemicals, lumber preservatives, photographic chemicals and fungicides.1–3 They are also produced by microbial hydrolysis of several organo-phosphorus pesticides, for example parathion, or by photo-degradation of pesticides that contain the nitrophenol moiety.4–6 Due to their high toxicity even at low concentrations, nitrophenols affect animals, plants, and human beings adversely and are listed on the United State Environmental Protection Agency's (USEPA's) “Priority Pollutants List”.7,8 Particularly, 2-nitrophenol poses significant health risks since it is highly toxic to mammals, microorganisms and anaerobic bacteria.9,10 Its toxicity is thought to be due to the nitro group being easily reduced by enzymes to a nitro anion radical, nitroso and hydroxyl-amine derivatives.11 These derivatives are responsible for the cytotoxic, mutagenic and carcinogenic action of nitro compounds. Based on the above description, it is important to develop simple and reliable method for determination of trace amounts of 2-nitrophenol in environments.Various methods, such as liquid chromatography,12 gas chromatography,13 UV-vis spectrophotometry,14 fluorescence detection,15 capillary electrophoresis,16 and other integrated methods, have been developed to detect and quantify nitrophenols. However, for the majority of these methods, sample pretreatment involving separation, extraction and adsorption, is time-consuming and complex. Aside these methods, electrochemical methods have received huge attention in the detection of 2-nitrophenol because of the advantage of fast response, inexpensive instrument, low cost, simple operation, time saving along with real-time detection in situ conditions. Electrochemical techniques are, therefore, promising ones for the detection of organic toxins with various advantages such as cheapness, simple processing with easy instrumentation, high sensitivity and selectivity, long-term stability with constancy in result and quick response ability.17,18 However, the main challenges of using conventional electrodes that needs to be overcome are their poor sensitivity and selectivity towards specific toxic and hazardous chemical and their electrochemical detection in the presence of other interfering species. As a consequence, it is highly desirable to develop novel electrodes for selective detections of 2-nitrophenol.
The modification of the surface of electrodes are widely employed to fabricate highly efficient electrochemical sensors for the determination of toxic chemicals. Very recently, Pang and Kan developed a sensor with an inner reference material covalently bonded to the electrode called ratiometric electrochemical sensor for detection of o-nitrophenol and p-nitrophenol.19 The signal from this reference would be used to rectify the signal of the analyte eventually affected by any undeterminable parameters. Although the authors observed almost repeatable constant signal from the inner reference, the idea of introduction of inner reference will be more effective, when the signal from the reference varies during measurement. In recent years, electrochemical sensors based on various nanoparticles have been developed for the detection of toxic chemicals and reported in the literature.20–22 For instance, semiconductors metal oxide nanomaterials have contributed significantly in order to modify electrodes for the determination of hazardous chemicals.23,24 Among various metal oxide, zinc oxide (ZnO) with a wide band gap of 3.37 eV and a large exciton binding energy of 60 meV at room temperature has attracted worldwide attention due to its intrinsic electronic properties, photosensitivity, and stability.25,26 ZnO has been proved to be a highly sensitive material as the modification material for electrodes in the determination of various toxic and hazardous chemicals.27–32 However, many scientific and technological efforts have been made to improve its response, reaction speed, and stability.33,34 ZnO nanocomposites prepared by adding noble metal or metal oxides to ZnO is considered an effective way to mend the properties of ZnO in order to enhance the structural properties of ZnO for various applications. This process alters the electronic (or) electrical properties, structural alignments of grains, size, shape, surface morphologies of nanoparticles, optical, chemical or catalytic activities of the metal oxide nanocomposites.35,36 Generation of heterostructure results in alteration of the mixed valence states and modification of the chemical affinity towards certain analytes. This, in turn, helps tune the band gap of the metal oxides to increase or decrease its conductance, or resistance of the metal oxide composite-based electrode towards oxidation and reduction reaction of a particular analyte.37,38 For example, silver ions doping greatly improved the photocatalytic activity of ZnO nanocrystallites for the degradation of 4-nitorphenol.39 In another study, ZnO/Pt composite arrays modified microreactor exhibited much higher catalytic efficiency for the degradation of methylene blue.40 Recently, various ZnO based nanocomposite based electrochemical sensors have been developed for the detection of nitrophenol and reported in the literature.41,42 Gupta et al. reported that ZnO nanowire covalently functionalized with 1-pyrenebutyric acid exhibited excellent sensing perform for the detection of p-nitrophenol in biological systems.41 In another study, Thirumalraj et al. fabricated chitosan-crafted ZnO nanoneedles modified electrode for specific and sensitive detection of 4-nitrophenol in the presence of interfering species.42 Furthermore, the CeO2–ZnO nanoellipsoids (NEs) synthesized by hydrothermal process were used to fabricate electrochemical sensor for the detection of 4-nitrophenol.43 In addition, Ag/ZnO modified glassy carbon electrode showed good amperometric response to hydrogen peroxide (H2O2) compared to pure ZnO.44
Recently, ruthenium(IV) oxide (RuO2), which belongs to the family of transition-metal oxides with rutile-like structure, represents an attractive metal oxide owing to its high chemical stability in both acidic and alkaline media, electrical (metallic) conductivity, and excellent diffusion barrier properties an easy processing as nanomaterials.45 Thus, RuO2-based nanomaterials have been used for various technological applications such as super capacitors,46 electrodes for chlorine electro-generation, water splitting into hydrogen and oxygen,47–49 catalysts for CO2 methanation and HCl oxidation.50,51 We have recently reported that RuO2/TiO2, RuO2/ZnO nanocomposites exhibited higher photocatalytic activity compared to pure TiO2 and ZnO for the photocatalytic degradation of organic dyes and generation of hydrogen.52,53 Although various ZnO based nanocomposite sensors for different hazardous chemical detection are reported in the literature, but to the best of authors' knowledge, there is no report on the application of ZnO/RuO2 nanocomposites for facile electrochemical sensor in liquid phase. Particularly, this work seems to be the first report on the use of heterostructure ZnO/RuO2 nanocomposites for the fabrication of electrochemical 2-nitrophenol chemical sensor. This work is not assigned to produce any exhaustive technique or procedure for the determination of 2-nitrophenol, rather it lies in line with efforts made by different authors to develop electrochemical sensors with improved performances in some aspects.
Herein, this study aims at developing ZnO/RuO2 NPs based electrochemical sensor for selective detection of 2-nitrophenol. The ZnO/RuO2 NPs were synthesized by impregnation method at low temperature. The synthesized ZnO/RuO2 NPs were deposited from an ethanol suspension onto a GCE in the form of a thin-film, and then the film was fixed to the electrode-surface with conducting Nafion binder. The GCE electrode so modified was intended to perform as the working electrode in chemical sensing. The sensing experiments were conducted using current–voltage (I–V, two-electrode system) technique. The prepared ZnO/RuO2 NPs based chemical sensor exhibited good sensitivity and high selectivity to 2-NP, long-term stability with accuracy in the measurements, broad linear dynamic range with appreciably low detection limit and reproducibility with high accuracy.
Experimental
Chemicals and reagents
Zinc acetate dihydrate, Zn(CH3COO)2·2H2O (Alfa Aesar), and ruthenium(III) chloride hydrate, RuCl3·xH2O (Sigma Aldrich), were used as the precursors for the synthesis of ZnO and RuO2, respectively. To execute this study in details, a number of analytical grade toxins such as 2,4-DNP (2,4-dinitrophenol), 4-AP (4-aminophenol), p-NP (p-nitrophenol), 2-NP (2-nitrophenol), 4-NP (4-nitrophenol), 3-MPHyd (3-methoxyphenylhydrazine), 3-MP (3-methoxyphenol), m-THyd (m-tolylhydrazinehydrochloride), PHyd (phenylhydrazine) and BPA (bisphenol A) were procured from Sigma-Aldrich Co.Synthesis of ZnO/RuO2 NPs
The hetero-structure ZnO/RuO2 nanoparticles were prepared by an impregnation method described elsewhere.54 The ZnO nanoparticles were first prepared by homogeneous precipitation method from a solutions of zinc acetate dihydrate, Zn(CH3COO)2·2H2O using urea as the precipitant. In a typical procedure, 1.62 g (0.037 M) of zinc acetate dehydrate was dissolved in 200 mL deionized water containing 6.0 g (0.5 M) of urea. The solution was magnetically stirred at room temperature in a round bottomed flask until a homogeneous solution was obtained. The solution was then heated at a temperature of 90 °C for 4 h. Upon completion of the reaction, a white precipitate was obtained, which was subsequently centrifuged at 5000 rpm for 10 min and washed with deionized water till it became neutral. The washed precipitate was then dried at 110 °C overnight followed by calcination at 350 °C in air for 2 h to obtain ZnO nanoparticle powder. Hetero-structure RuO2/ZnO was prepared by impregnation method. In a typical procedure, a calculated amount of ruthenium(III) chloride hydrate was dissolved into 50.0 mL deionized water. ZnO nano-powder (0.3 g) was then dispersed into the solution and was vigorously stirred for 8 h. The solvent was then removed by evaporation followed by drying at 110 °C overnight. Subsequently, the loaded ZnO was finally calcined at 350 °C in air for 2 h to achieve the desired RuO2/ZnO NPs.Characterizations of ZnO/RuO2 nanoparticles
To determine the phase structures and crystallite size of the hetero-structure ZnO/RuO2 NPs, XRD measurement was carried out by X-ray diffractometer (Bruker AXS, D8 Advance) using Cu Kα radiation. A continuous scan mode was used to collect 2θ data from 10 to 90°. The average crystallite size of the powder was determined from the diffraction peak widths using Scherrer's formula. To clarify the elemental and chemical state of the as-prepared ZnO/RuO2 NPs, X-ray photoelectron spectra of the NPs were recorded on X-ray photoelectron spectroscopy (XPS) with a PHOIBOS 100 analyzer (Specs GmbH). Monochromatic X-ray (Kα: 1486.61 eV) from an Al anode was used for excitation. The charge effect was evaluated using the main component of the C 1s peak, associated with adventitious hydrocarbons with a binding energy of 284.8 eV as reference for calibration. The base pressure in the sample during the measurements was less than 3 × 10⁻⁸ mbar. The optical properties of the as-synthesized NPs were investigated by UV-vis absorption spectra. Diffuse reflectance spectra of the powder NPs were measured by placing the samples in 1 mm quartz cell using an UV-vis-NIR spectrometer (Shimadzu, UV-3600 Plus) at room temperature in the wavelength range of 200–800 nm. The pure powdered BaSO4 was used as a reference sample. The existing functional groups of the as-synthesized ZnO/RuO2 NPs were studied by Fourier Transform Infrared (FTIR) spectrometer (thermos-scientific NICOLET iS50, Madison, WI, USA). The FTIR spectra were recorded as a KBr disc with 2 wt% sample, using 16 scans per sample over the range 4000–450 cm−1. The surface morphology and the corresponding elemental analysis of ZnO/RuO2 NPs were inspected by the implementation of Field Emission Scanning Electron Microscopy, FESEM (JEOL, JSM-7600F, Japan) equipped with EDS. The electrochemical behavior of assembled chemical sensor was executed by the help of Keithley electrometer (6517A, USA).Fabrication of chemical sensor based on ZnO/RuO2 NPs as active materials
The heart of a chemical sensor is the working electrode and it was fabricated by the deposition of the slurry of ZnO/RuO2 NPs as thin layer onto a GCE. The modified GCE was then dried at ambient atmosphere. To ensure the optimum binding strength between the GCE and the ZnO/RuO2 NPs, a drop of Nafion (5% Nafion suspension in ethanol) was added on modified GCE. Subsequently, it was placed into a low temperature oven at 35 °C for 1 hour to dry up the conduction film of ZnO/RuO2 NPs entirely. To assemble the electrochemical sensor with Keithley electrometer, the modified ZnO/RuO2 NPs/binder/GCE was set as working- and Pt-wire as a counter electrode. The 2-nitrophenol solution of concentration 0.1 mM was used as the stock solution to make a number of solutions with concentrations ranging from 0.1 nM to 0.1 mM, and it was the target analyte to investigate the sensing properties of the assembled electrochemical sensor. A calibration curve was plotted as concentration of 2-NP vs. current and the linearity (r2) of calibration curve was estimated. The sensor analytical performance, LDR (linear dynamic range), was calculated based on the maximum linearity of calibration curve. The sensitivity and method detection limit (MDL) of the sensor were computed from the slope of the calibration curve.Results and discussions
Characterizations of ZnO/RuO2 NPs
To gain a deep insight into both the binding energies and the corresponding oxidation states of the existing species of ZnO/RuO2 NPs, X-ray photoelectron spectroscopy (XPS) investigations were carried out. The XPS spectra of Zn 2p of ZnO are shown in Fig. 1(A). The Zn 2p spectra exhibited two features at 1021.8 and 1044.5 eV stemming from the spin–orbit coupling of the Zn 2p states. The spin–orbit separation between the Zn 2p3/2 and Zn 2p1/2 levels was found to be 22.7 eV, which is a typical value for Zn2+ oxidation state in ZnO.55–58 Fig. 1(B) represents the O 1s peaks for the synthesized NPs. It can be seen that the O 1s emission line was asymmetric, suggesting that there were more than one kind of species in the samples. The peak could be fitted into three symmetrical peaks centered at 529.0, 530.7, and 531.8 eV. The first peak located at 529.0 eV was attributed to the lattice oxygen in RuO2. The second peak at 530.70 eV was assigned to the lattice oxygen of ZnO.59 The higher binding energy at 531.8 eV was attributed to the oxygen of surface hydroxyl group of RuO2 and ZnO.60–63 Fig. 1(C) provides high-resolution XPS spectra of Ru 3d in the ZnO/RuO2 NPs. First of all, it must be underlined that the Ru 3d photoelectron spectra overlap with spectra of C 1s photoelectrons of the adventitious carbon. The Ru 3d signal shows two different binding states of ruthenium atoms and exhibits asymmetric line shapes. The de-convoluted peaks were identified as Ru 3d5/2 and Ru 3d3/2 at 280.45 eV and 284.60 eV, respectively, and were attributed to Ru4+ oxidation state of Ru and it existed as RuO2 in the prepared samples. The deconvolution of the XPS spectra revealed another additional feature with broader line width at 282.0 eV for the Ru 3d5/2 higher than the major peak by 1.55 eV. The origin of this peak has been the object of discussions in the literature. Some authors assign it to Ru6+ present on the sample surface,64 while others attribute it to the final state effects in photoemission. Recently, it has been proposed that the satellite peak is due to plasmon excitation.65,66 | ||
| Fig. 1 Evaluation of binding energy (eV) and oxidation states of ZnO/RuO2 NPs, (A) core level high resolution Zn 2p spin orbit, (B) spin orbital of O 1s level, and (C) Ru 3d orbital. | ||
The crystallinity of ZnO in ZnO/RuO2 NPs was confirmed by powder X-ray diffraction (XRD) analysis with Cu Kα radiation (λ = 0.15418 nm) (Fig. 2(A)). All the diffraction peaks could be readily indexed as hexagonal wurtzite structure for ZnO in ZnO/RuO2 NPs which is in good agreement with the reported data (JCPDS file no. 36-1451). The peaks at 2θ of 31.7°, 34.3°, 36.2°, 47.5° and 56.5°, corresponded to the crystal planes (100), (002), (101), (102), and (110) of crystalline ZnO, respectively. These identified crystal planes of ZnO are consistent with those previously reported.67–70
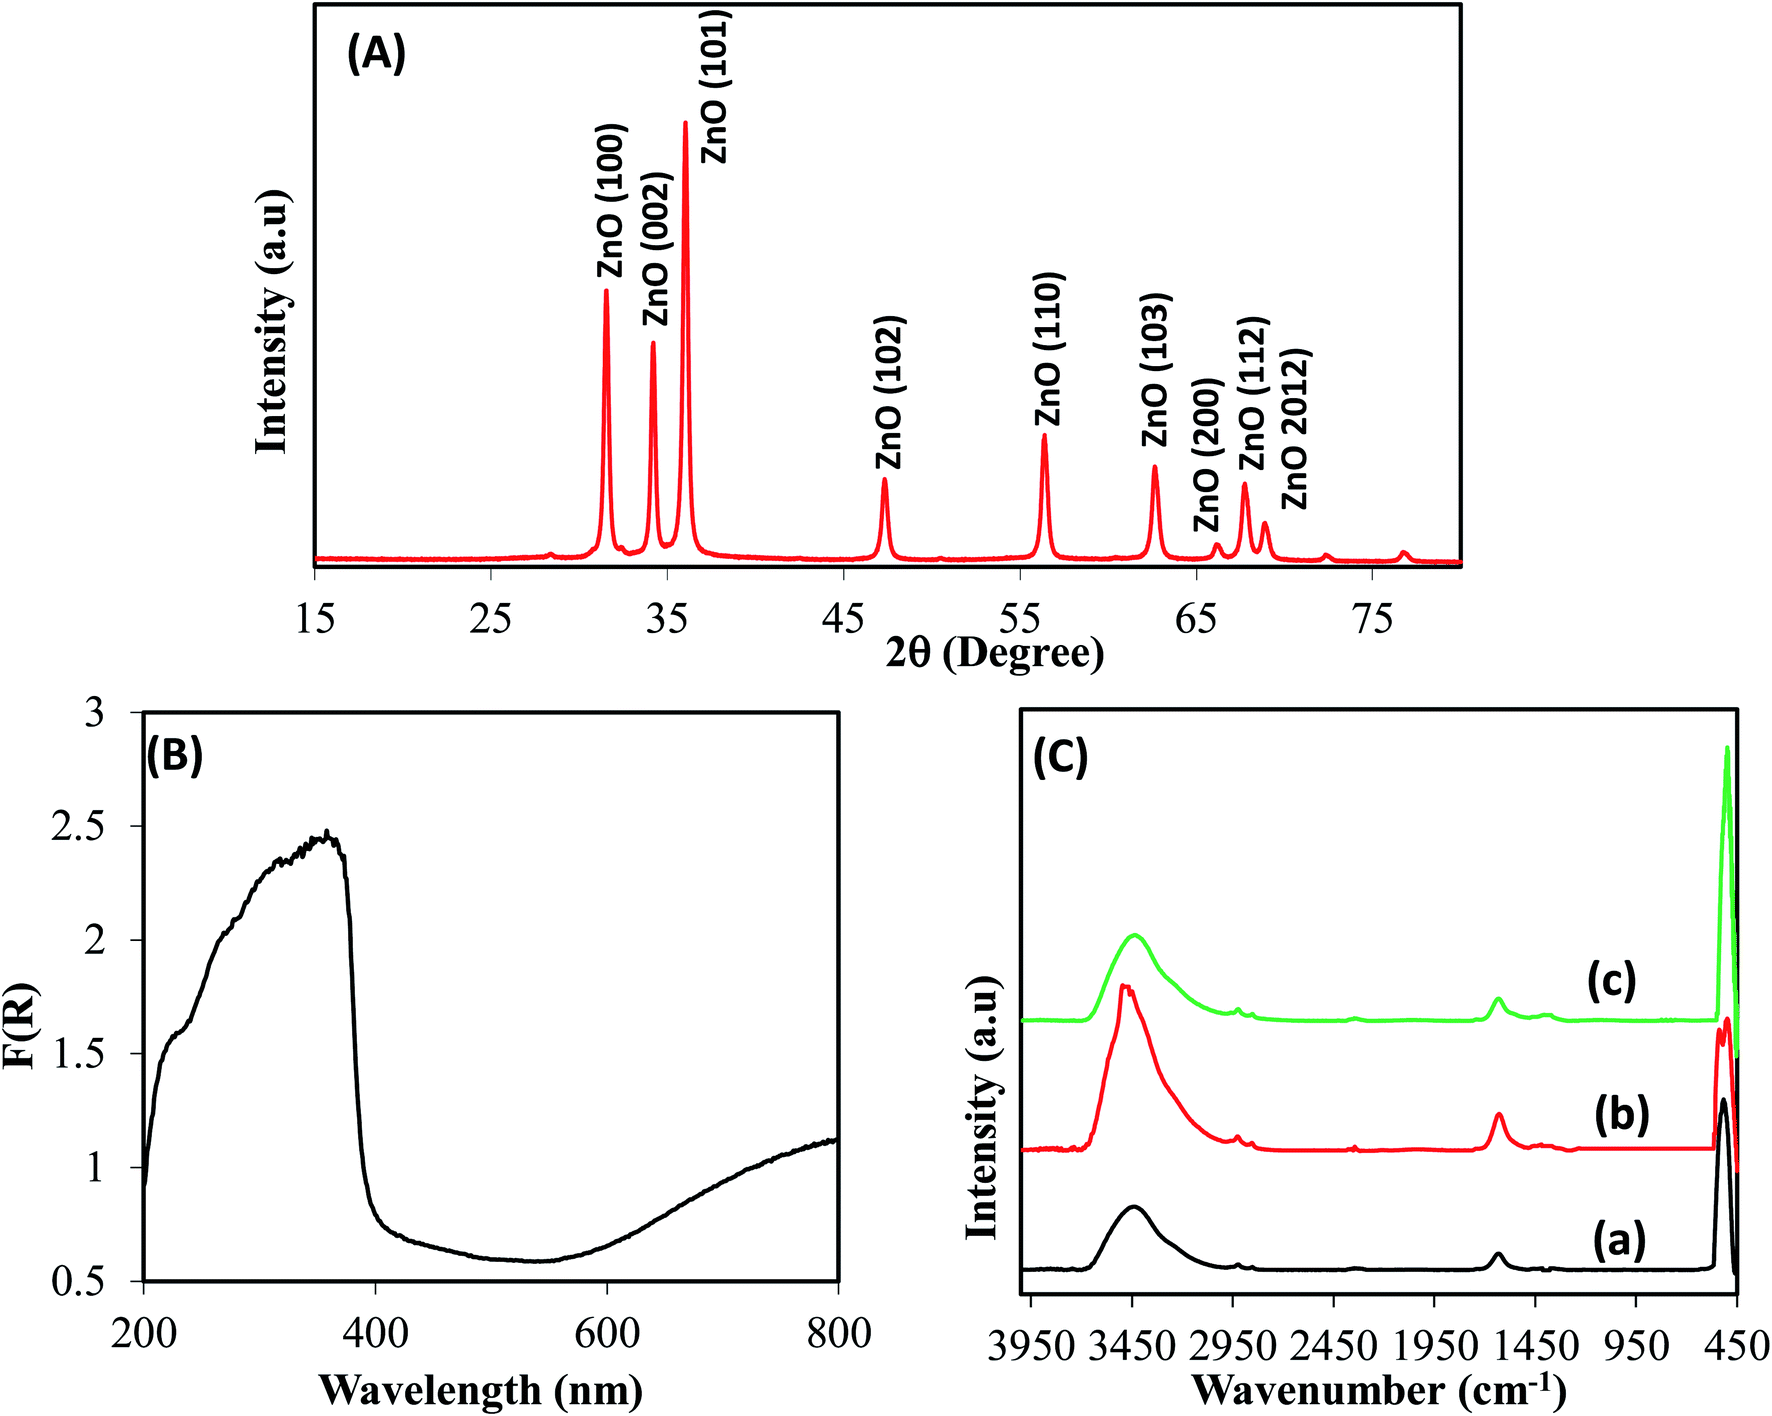 | ||
| Fig. 2 Crystallinity and photo-sensitivity, (A) powder X-ray diffraction (XRD) of ZnO/RuO2 NPs, (B) UV-vis absorption spectrum of ZnO/RuO2 NPs, and (C) FTIR analysis: (a) ZnO; (b) ZnO/RuO2 and (c) RuO2. | ||
Peaks corresponding to RuO2 were not seen clearly due to the overlapping of the peaks corresponding to RuO2 with the more intense ones of ZnO. The average crystal size of ZnO was estimated from line broadening of (101) diffraction peak using Scherrer formula and it was found to be 25 nm. The optical absorption of ZnO/RuO2 NPs was investigated by UV-vis absorption spectra performing the experiment in range of 200 to 800 nm as shown in Fig. 2(B). As depicted in Fig. 2(B), the absorption edge for the hetero-structure ZnO/RuO2 NPs sample is estimated to be about 385 nm, a result attributed to the transition of the valence electron of ZnO in ZnO/RuO2 NPs sample from lower to higher energy level.71–73 The optical band gap energy (eV) is calculated by eqn (1) equals to 3.22 eV
| Eg (eV) = 1240/λ | (1) |
To identify the presence of functional groups exiting in the prepared nanoparticles, FTIR performance was executed in the range of 450 to 4000 cm−1 wavelength shown in Fig. 2(C). FTIR studies revealed the complete elimination of the undesirable organics and the formation of metal oxide species. Thus, above 2000 cm−1, a very broad absorption around 3500 cm−1 can be ascribed to OH stretching vibration modes for each sample. Key features observed below 2000 cm−1 include a band at 1620 cm−1 due to the bending vibrations of absorbed molecular water. Bands centered at 505 cm−1 can be assigned to the stretching vibration modes of Zn–O and Zn–O–Zn bond in zinc oxide (Fig. 2C(a) and (b)).74 The strong peak at 550 cm−1 is due to the Ru–O vibrations, indicating formation of RuO2 (Fig. 2C(b) and (c)).75,76
Fig. 3(A) and (B) represents the morphology of the synthesized ZnO/RuO2 NPs. As it is observed from the low and high magnified FESEM images of ZnO/RuO2 NPs in Fig. 3(A) and (B), the ZnO and RuO2 particles are arranged irregularly with different sizes and it conforms to the shape of the nanoparticles. The composition and the presence of RuO2 in the synthesized samples were confirmed by EDX analysis and the results are shown in Fig. 3(C) and (D). All of the peaks on the curves were ascribed to Zn, Ru, and O elements, and no peaks belonging to other than those are observed. Therefore, it can be concluded that the synthesized samples are composed of Zn, Ru and O elements, which is in good agreement with the above XRD results. In addition, EDX analysis reveals the elemental compositions of the synthesized samples (listed in Fig. 3(D)) and the weight percentage of RuO2 was estimated to be about 3.0 wt%.
 | ||
| Fig. 3 Structural morphology and elemental analysis of ZnO/RuO2 NPs, (A and B) low and high magnified FESEM images, (C and D) elemental and structural analysis of ZnO/RuO2 NPs, by EDS. | ||
Analytical performance of the sensor with the active ZnO/RuO2 NPs
The first task of performance test of any sensor is to determine the time required for reaching the steady state response. For this purpose, the transient electro-chemical response of 1 μM solution of 2-NP at 1.5 V has been monitored for a period of 2.7 min. It is found that 98% of the steady state response is achieved in 12 s (Fig. S1 in the ESI†).To examine the selectivity of the assembled electrochemical sensor, a number of environmental toxins were analyzed by the prepared chemical sensor based on ZnO/RuO2 NPs/binder/GCE at 0.01 μM concentration and applied potential 0 ∼ +1.5 V. The corresponding I–V responses of 2,4-DNP, 4-AP, p-NP, 2-NP, 4-NP, 3-MPHyd, 3-MP, m-THyd, PHyd and BPA are illustrated in Fig. 4(A). From Fig. 4(A) it is obvious that the 2-NP shows the highest I–V response. To investigate the analytical performances such as sensitivity, linear dynamic range (LDR) and method detection limit (MDL), the base 2-NP with 0.1 mM concentration was diluted with di-ionized water to prepare a series of 2-NP solutions ranging from 0.1 nM to 0.1 mM and implemented as target analyte to analyze the electrochemical responses. Fig. 4(B) shows the electrochemical responses of 2-NP solution ranging 0.1 nM–0.1 mM and it is clearly observed that, electrochemical responses are distinguishable from lower to higher concentration. The current data at applied potential +1.5 V from Fig. 4(B) are collected and a new Fig. 4(C) is plotted as current vs. log![[thin space (1/6-em)]](https://www.rsc.org/images/entities/char_2009.gif) C of the analyte (2-NP). As seen in the Fig. 4(C), the plotted current data are consistently distributed around a linear plot in the 2-NP concentration range (known as linear dynamic range, LDR) of 0.1 nM to 0.01 mM. As it is observed in Fig. 4(C), the electrochemical responses of 2-NP chemical sensor based on ZnO/RuO2 NPs/binder/GCE are varied with the concentration of 2-NP. Similar observations have been reported in a number of articles dealing with toxins sensing in aqueous medium.77–79 At the beginning of sensing performance of 2-NP, a few numbers of 2-NP are absorbed on the surface of anticipated working electrode to progress oxidation of 2-NP. The reaction rate was increased with increasing the concentration of 2-NP in aqueous medium and eventually reached the steady state at equilibrium condition.
C of the analyte (2-NP). As seen in the Fig. 4(C), the plotted current data are consistently distributed around a linear plot in the 2-NP concentration range (known as linear dynamic range, LDR) of 0.1 nM to 0.01 mM. As it is observed in Fig. 4(C), the electrochemical responses of 2-NP chemical sensor based on ZnO/RuO2 NPs/binder/GCE are varied with the concentration of 2-NP. Similar observations have been reported in a number of articles dealing with toxins sensing in aqueous medium.77–79 At the beginning of sensing performance of 2-NP, a few numbers of 2-NP are absorbed on the surface of anticipated working electrode to progress oxidation of 2-NP. The reaction rate was increased with increasing the concentration of 2-NP in aqueous medium and eventually reached the steady state at equilibrium condition.
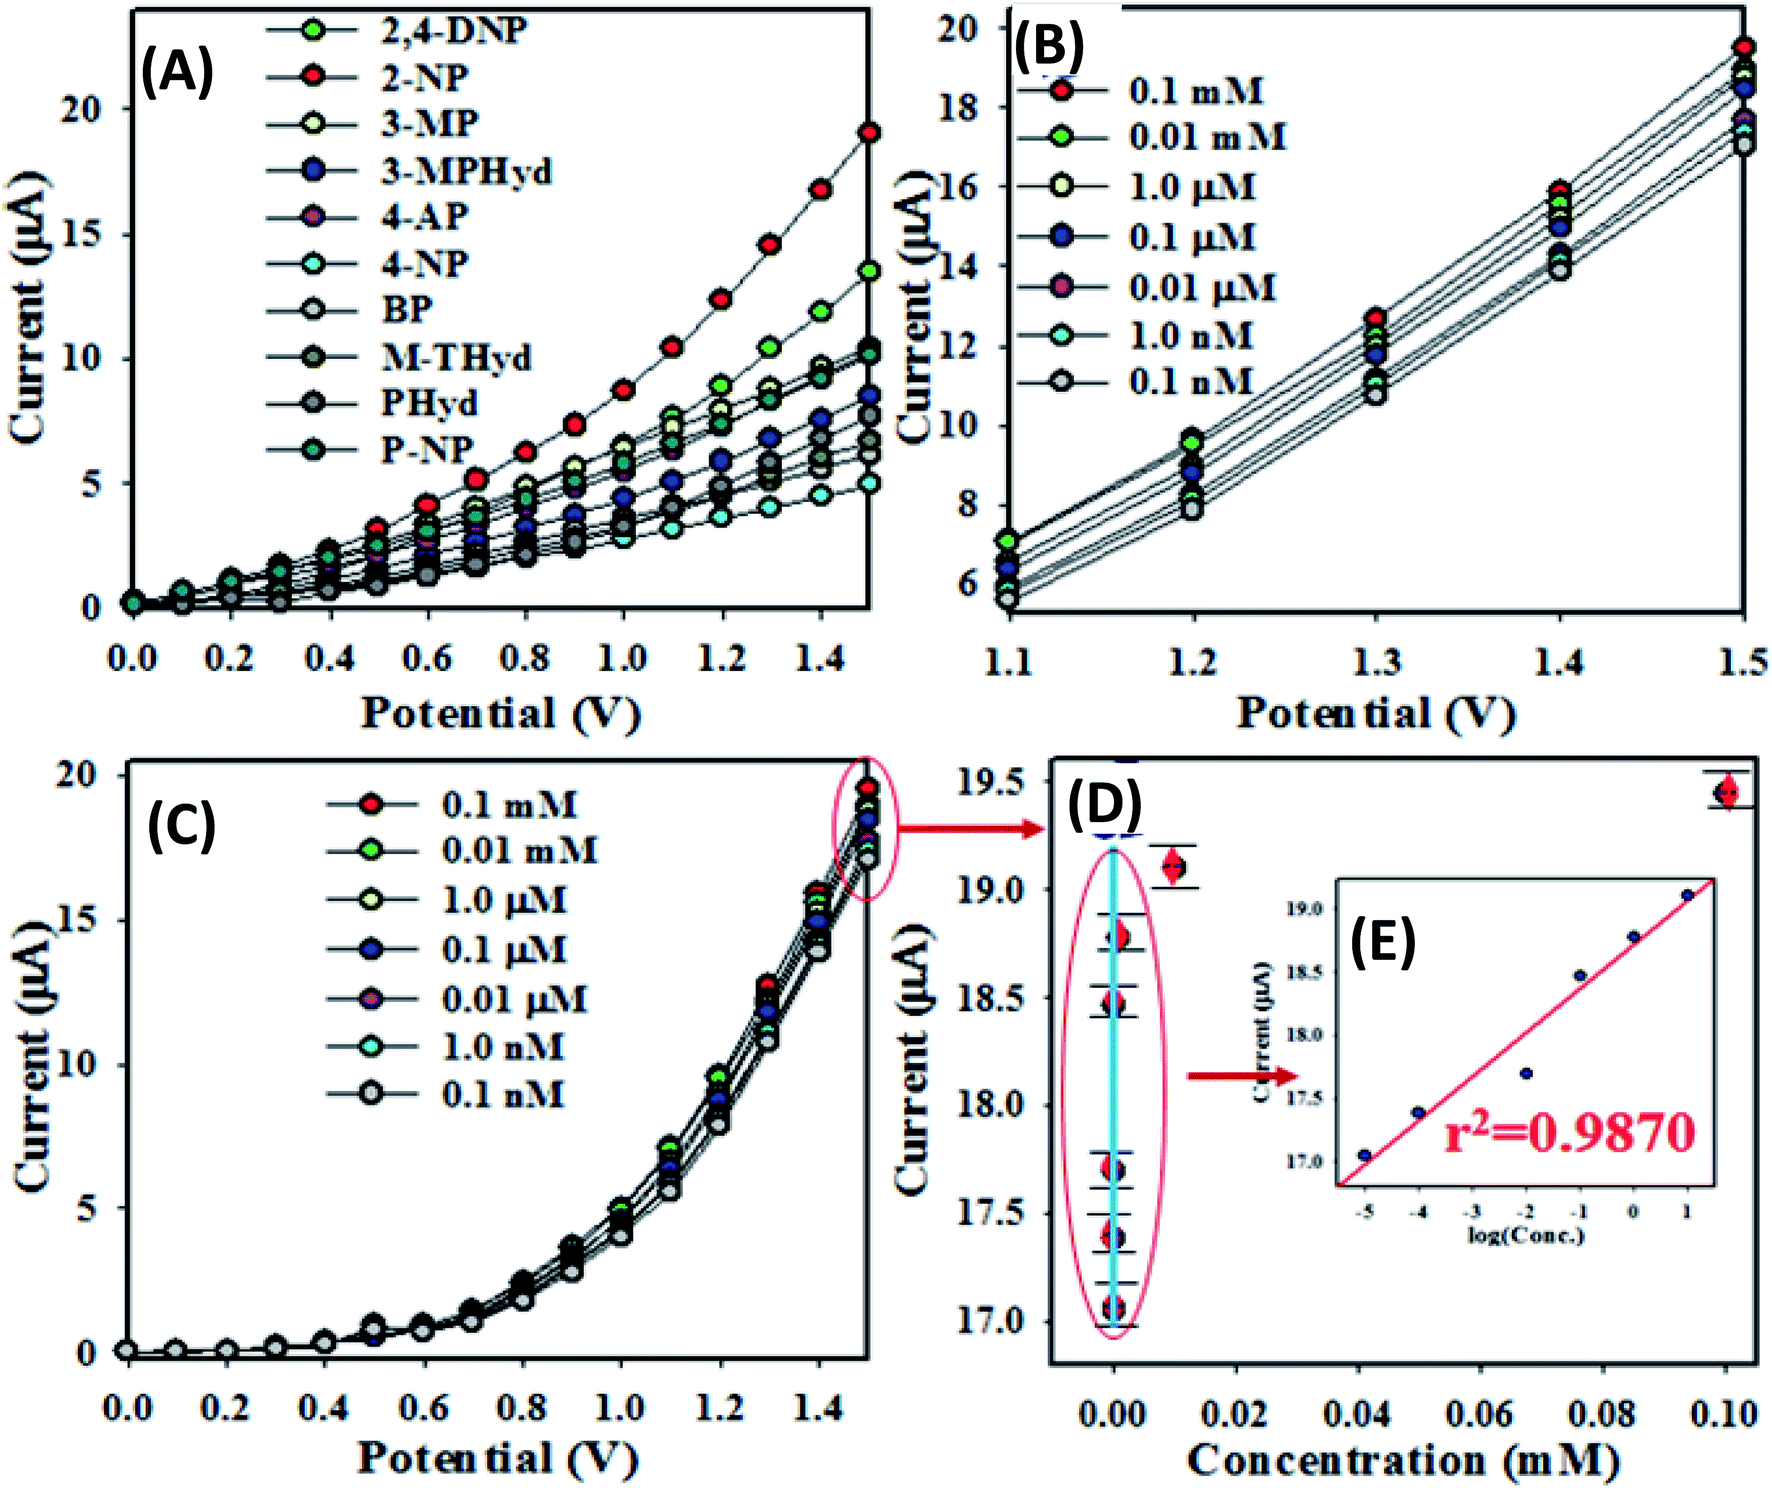 | ||
| Fig. 4 Optimization of analytical performance of chemical sensor based on ZnO/RuO2 NPs/binder/GCE, (A) selectivity, (B) amplified electrochemical responses of chemical sensor based on concentration ranging 0.1 nM–0.1 mM, (C) the electrochemical responses of chemical sensor with concentration variation of 2-NP, (D) calibration curve [inset (E) (log(conc.) vs. current)]. | ||
In Fig. 4(D), the data from a low concentration range of interest (chosen based on the usual concentration level as found in the real sample) have been plotted as current vs. concentration. Although in a wide range of 0.1 nM to 0.01 mM, the current vs. logC is linear (Fig. 4(E)), in a narrow concentration range such as that in the Fig. 4(D), the current vs. concentration relation could be approximated by a straight line and this would be considered as calibration curve for the determination of 2-NP concentration in real sample. In the present work, a concentration range of (1.0–10.0) μM has been chosen to test the linearity of the calibration curve. The choice of the concentration range is made based on the usual concentration range available in relevant samples. As seen in the Fig. 4(D), for a narrow range of concentration, the current vs. concentration plot could satisfactorily (with the regression co-efficient r2 = 0.987) be described by a linear relation. In fact, this is the straight line, which would be used to determine the sensitivity of the method as well the method detection limit (MDL).
The sensitivity of projected 2-NP chemical sensor is calculated from the slope of the calibration curve in the Fig. 4(D) divided by the surface area of GCE (0.0316 cm2). For the prepared sensor, the sensitivity is estimated to be equal to 18.20 μA μM−1 cm−2 which is higher than those of other 2-NP chemical sensors cited in literature.80–82 The MDL of the anticipated chemical sensor is computed from slope of calibration curve for the signal to noise ratio of 3 (three times current value for blank run) and it is found to be 52.20 ± 2.60 pM, the value is very lower than those reported in literature for 2-NP chemical sensor as shown in Table 1.
| Materials | LOD | LDR | Sensitivity | Ref. |
|---|---|---|---|---|
| a DL, detection limit; LDR, linear dynamic range; nM, -nanomole. | ||||
| PANI@G/CWO/GCE | 0.87 nM | 1.0 nM to 1.0 mM | 1.229 μA μM−1 cm−2 | 80 |
| Pt-CNT NCs/GCE | 2.19 mM | 0.1–2.5 mM | 0.395 μA μM−1 cm−2 | 81 |
| R-GO/ZnO/GCE | 0.27 nM | 10.0 nM to 10.0 mM | 0.0058 μA μM−1 cm−2 | 82 |
| Ce2O3 CNT NCs/GCE | 60.0 pM | 100 pM to 100.0 mM | 0.0016 μA μM−1 cm−2 | 83 |
| Ag2O NPs/AuE | 0.19 μM | 1.0 μM to 0.5 mM | 0.0474 μA μM−1 cm−2 | 84 |
| ZnMn2O4/GCE | 20.0 μM | 50.0 μM to 0.05 M | 1.500 μA μM−1 cm−2 | 85 |
| ZnO/RuO2 NPs/GCE | 52.20 pM | 0.1 nM to 0.01 mM | 18.196 μA μM−1 cm−2 | This work |
Reliability in the sensor performances
Reliability of the sensor performances has been checked by the reproducibility test. This test consists in the verification of the capability of 2-NP chemical sensor to perform long time with constancy in result in an identical condition. The reproducibility test of the chemical sensor based on the prepared ZnO/RO2 NPs/binder/GCE was carried out at the 2-NP concentration of 0.1 μM and the applied potential of 0–1.5 V in aqueous medium with pH 7.0. The reproducibility test has been performed in terms of replicate runs with long interruptions Fig. 5(A). As seen in the Fig. 5(A), the response in seven replicated runs are practically indistinguishable in an identical condition. Also, the response data acquired in seven different days are similar and the corresponding curves are almost overlapping as shown in Fig. 5(B). For a better understanding, the response data in the Fig. 5(A) are presented in three different figures for the reproducibility test performed in three different day (Fig. S2†). The electrochemical responses of these reproducibility tests do not alter with the washing of the electrode after each run and the relative standard deviations of these reproducibility test are below 1.5%. Therefore, it can be concluded that the projected 2-NP chemical sensor is able to work for a long period of time with constancy in result in aqueous medium.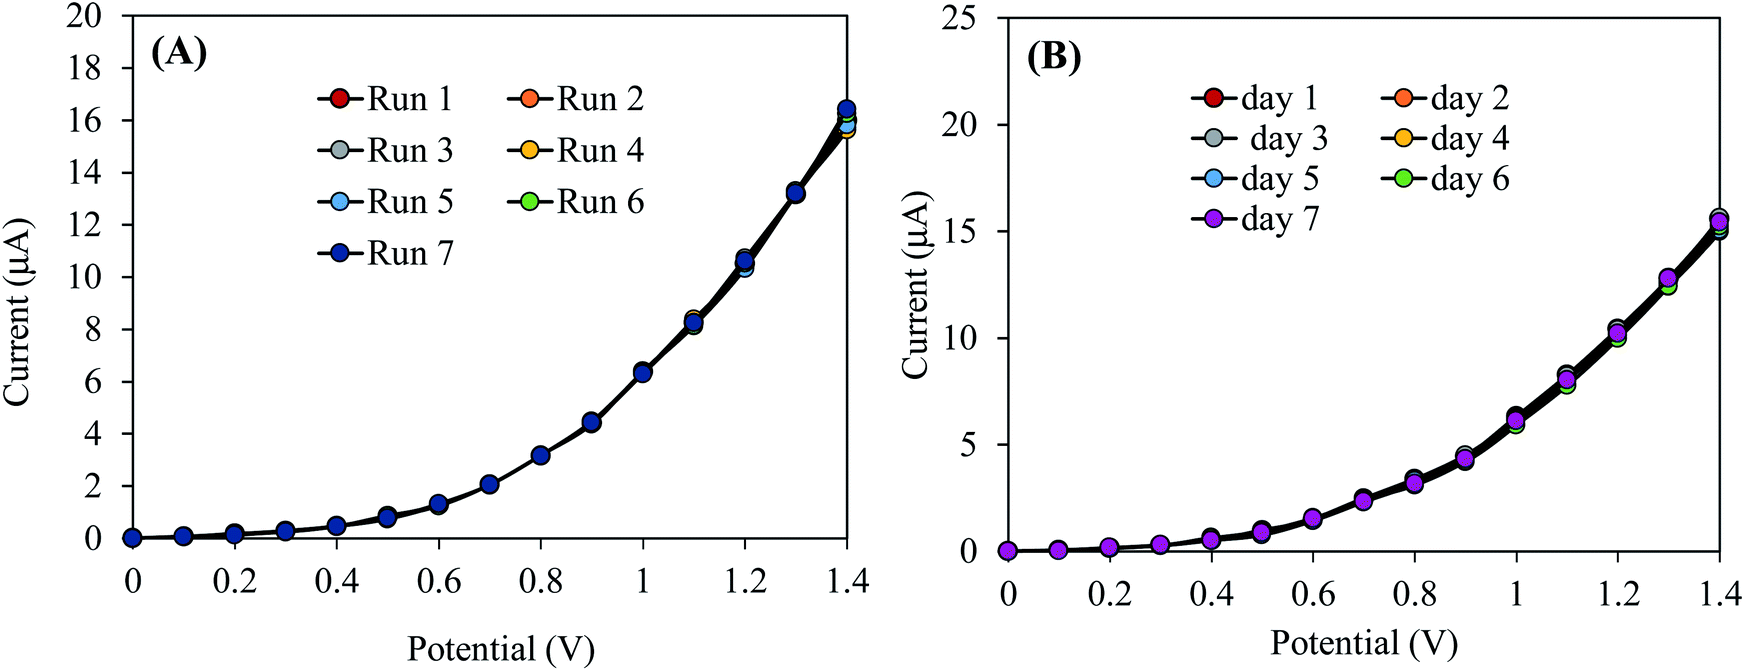 | ||
| Fig. 5 Execution of reliability test: (A) reproducibility test, (B) reproducibility performances of 2-NP chemical sensor based on ZnO/RuO2 NPs/binder/GCE for elongated period (7 days). | ||
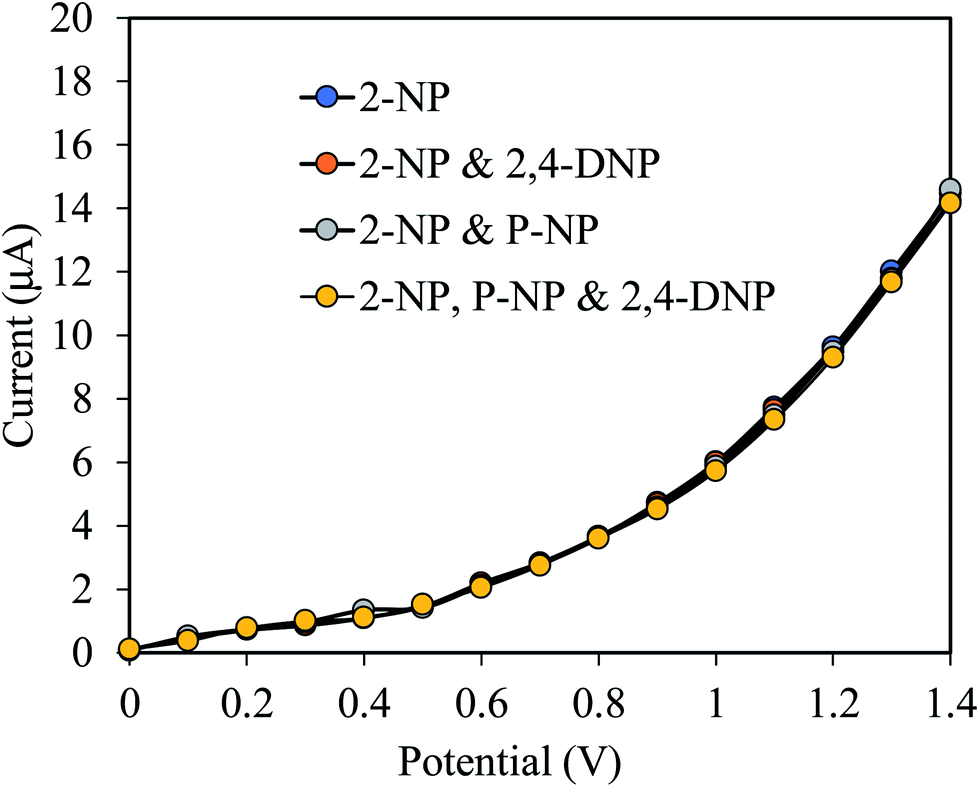
Since the prepared 2-NPs sensor is intended to be applied for measurements in real sample, it is necessary to identify the interference effect of some common molecularly similar compounds. To confirm the selectivity and interference effect of 2-NPs sensor, the electrochemical responses of 2-NPs sensor was evaluated with 0.1 μM 2-NPs solution in the presence of molecularly similar compounds such as 2,4-DNP, p-NP and the result is shown in Fig. 6. As shown in the Fig. 6, the mentioned compounds do not have any appreciable interference on the performance of the prepared sensor in measuring 2-NPs. This high degree of selectivity is a significant advantage over other methods of determination of phenolic compounds.
 | ||
| Fig. 6 Test for interference effect of 2-NP chemical sensor. | ||
As mentioned above, the response time of the desired 2-NP chemical sensor is around 8.0 s. Therefore, 8.0 second is necessary by this 2-NP chemical sensor to achieve the steady state electrochemical response. The steady state current data represented in Fig. 4(D) are regularly distributed along the linear plot.
Therefore, this observation shows the reliability of the method developed herein. In a short, the projected 2-NP chemical sensor based on ZnO/RuO2 NPs/binder/GCE exhibits good sensitivity, broad linear dynamic range, lower detection limit, short response time and long-term stability with constant reproducibility performances. Considering the analytical performances of recently reported 2-NP chemical sensor, the 2-NP chemical sensor based on ZnO/RuO2 NPs/binder/GCE showed the more promising performances for application purposes.
The oxidation mechanism of 2-NP during electrochemical detecting using I–V method is described in Scheme 1. According to Scheme 1, the o-benzoquinone and electrons are generated from 2-NP oxidation in electrochemical oxidation and these free electrons are responsible for enhancement of the I–V responses with increasing of 2-NP concentration in phosphate buffer medium (Fig. 4(C)). The similar oxidation reaction of 2-NP in electrochemical detection has been also reported earlier.80
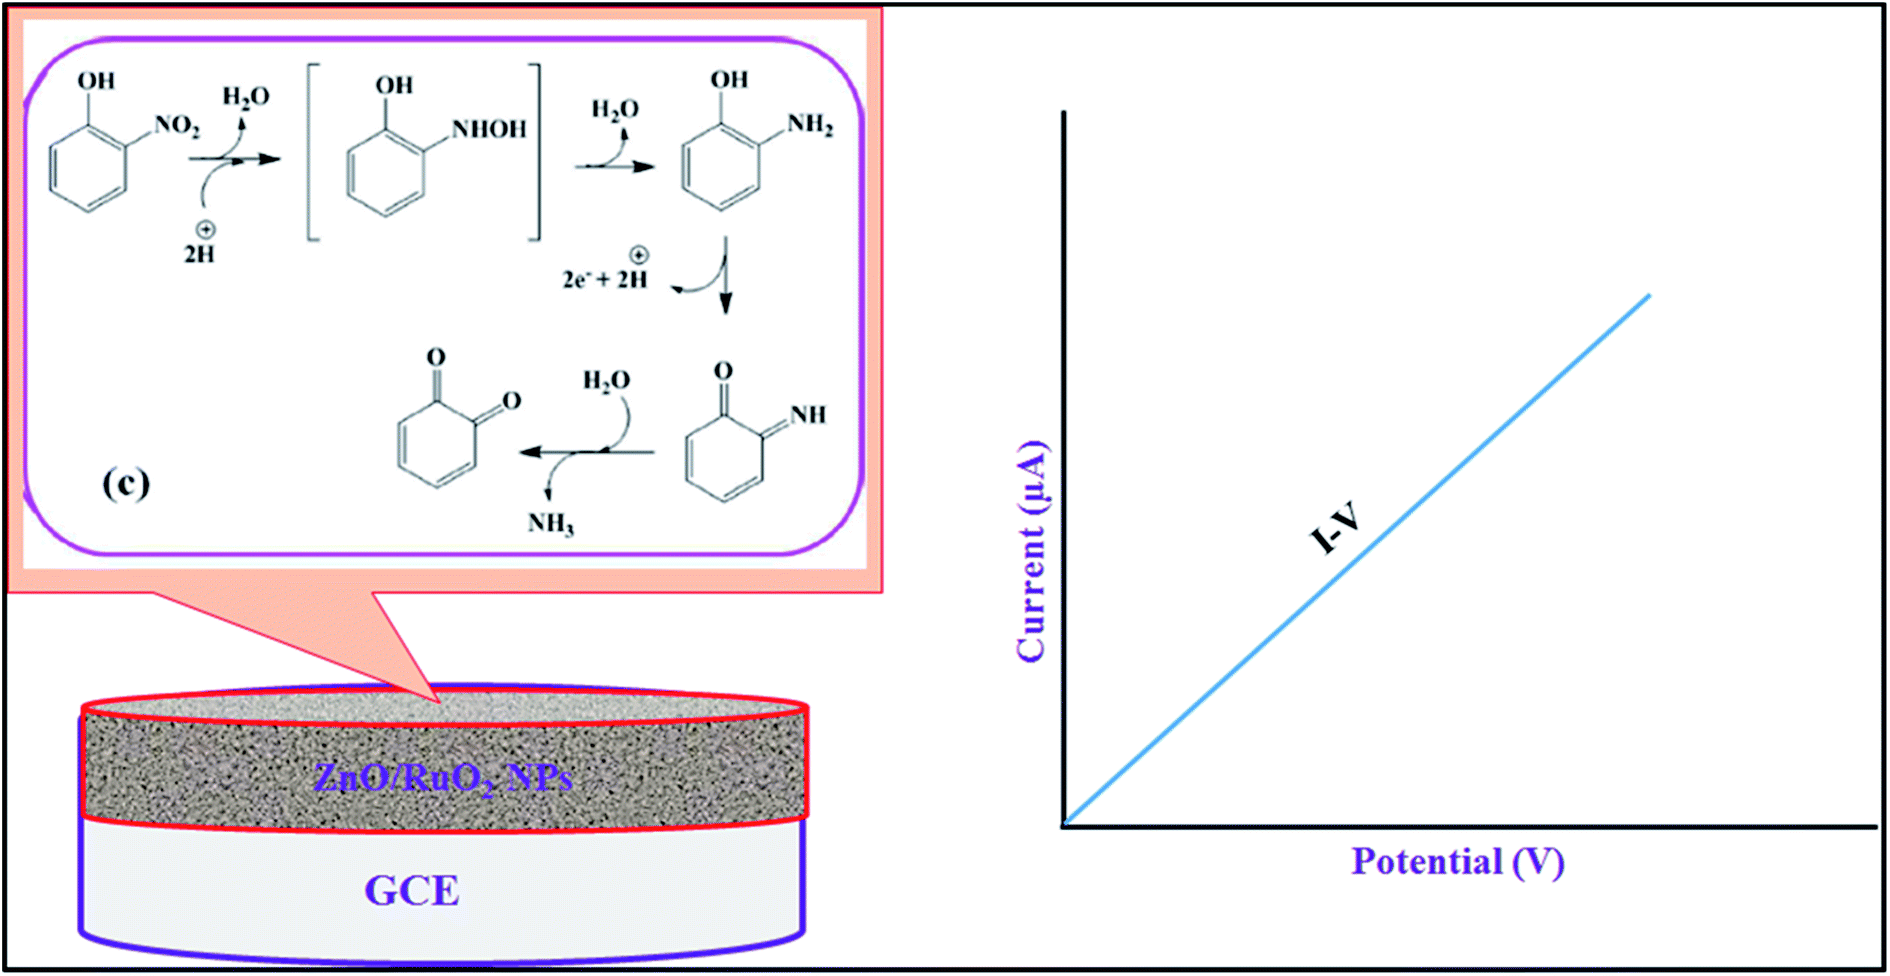 | ||
| Scheme 1 The proposed oxidation mechanism of 2-NP during electrochemical detection using I–V method. | ||
Analysis of real environmental sample by recovery method
To ensure the applicability of 2-NP chemical sensor based on ZnO/RuO2 NPs/binder/GCE, the real environmental samples such as waste effluent from industry, extract from PC-baby bottle, PC-water bottle and PVC food packaging bag are analyzed and corresponding data are represented in Table 2. According to Table 2, the obtained results seem to be quite satisfying and provide the evidence of reliability of 2-NP chemical sensor applicability.| Sample | Added 2-NP concentration (μM) | Measured 2-NP conc.a by ZnO/RuO2 NPs/Nf/GCE (μM) | Average recoveryb (%) | RSDc (%) (n = 3) | ||
|---|---|---|---|---|---|---|
| R1 | R2 | R3 | ||||
| a Mean of three repeated determination (signal to noise ratio 3) ZnO/RuO2 NPs/GCE.b Concentration of 2-NP determined/concentration taken (unit: μM).c Relative standard deviation value indicates precision among three repeated measurements (R1, R2, R3). | ||||||
| Industrial effluent | 0.01000 | 0.01011 | 0.01015 | 0.01016 | 101.4 | 0.26 |
| PC-baby bottle | 0.01000 | 0.01037 | 0.01017 | 0.01008 | 103.8 | 1.45 |
| PVC-waterbottle | 0.01000 | 0.00946 | 0.00949 | 0.00951 | 94.9 | 2.68 |
| PVC-food packaging bag | 0.01000 | 0.01106 | 0.01083 | 0.01056 | 108.2 | 2.31 |
Conclusion
The electrochemical sensor was fabricated by using ZnO/RuO2 nanoparticles prepared by impregnation method and was used to detect selective 2-NP in phosphate buffer solution. In this research approach, a reliable and simple 2-NP chemical sensor were assembled with GCE by ZnO/RuO2 NPs as thin layer with conducting Nafion binder. The anticipated 2-NP chemical sensor exhibited appreciable sensitivity, linear dynamic range, lower detection limit, precious reproducibility ability, and practically long-term stability in aqueous medium. It introduced a new route for an efficient detection of 2-NP by electrochemical approach with the binary ZnO/RuO2 NPs for the safety of health care and environment fields.Conflicts of interest
On behalf of all authors, the corresponding author states that there is no conflict of interest.Acknowledgements
The Shahjalal University of Science and Technology (SUST) Research Grant, 2018 (Project ID: AS/2018/3/35) for conducting this research work is highly appreciated.References
- V. Uberoi and S. K. Bhattacharya, Water Environ. Res., 1997, 69, 146–156 CrossRef CAS.
- P. Mulchandani, C. M. Hangarter, Y. Lei, W. Chen and A. Mulchandani, Biosens. Bioelectron., 2005, 21, 523–527 CrossRef CAS PubMed.
- J. Li, D. Kuang, Y. Feng, F. Zhang, Z. Xu and M. Liu, J. Hazard. Mater., 2012, 201–202, 250–259 CrossRef CAS PubMed.
- M. R. H. Podeh, S. K. Bhattacharya and M. Qu, Water Res., 1995, 29, 391–399 CrossRef CAS.
- L. M. Nelson, Soil Biol. Biochem., 1982, 14, 219–222 CrossRef CAS.
- K. Asadpour-Zeynali and P. Najafi-Marandi, Electroanalysis, 2011, 23, 2241–2247 CrossRef CAS.
- P. Deng, Z. Xu, Y. Feng and J. Li, Sens. Actuators, B, 2012, 168, 381–389 CrossRef CAS.
- R. M. A. Tehrani, H. Ghadimi and S. Ab Ghani, Sens. Actuators, B, 2013, 177, 612–619 CrossRef CAS.
- K. Karim and S. K. Gupta, Biodegradation, 2002, 13, 353–360 CrossRef CAS PubMed.
- K. Karim and S. K. Gupta, Bioresour. Technol., 2001, 80, 179–186 CrossRef CAS PubMed.
- A. Guissani, Y. Henry, N. Lougmani and B. Hickel, Free Radical Biol. Med., 1990, 8, 173–189 CrossRef CAS PubMed.
- R. Belloli, B. Barletta, E. Bolzacchini, S. Meinardi, M. Orlandi and B. Rindone, J. Chromatogr. A, 1999, 846, 277–281 CrossRef CAS.
- F. Jaber, C. Schummer, J. Al Chami, P. Mirabel and M. Millet, Anal. Bioanal. Chem., 2007, 387, 2527–2535 CrossRef CAS PubMed.
- C. Borrás, T. Laredo, J. Mostany and B. R. Scharifker, Electrochim. Acta, 2004, 49, 641–648 CrossRef.
- C. Nistor, A. Oubiña, M. P. Marco, D. Barceló and J. Emnéus, Anal. Chim. Acta, 2001, 426, 185–195 CrossRef CAS.
- X. Guo, Z. Wang and S. Zhou, Talanta, 2004, 64, 135–139 CrossRef CAS PubMed.
- M. M. Rahman, M. M. Alam and A. M. Asiri, New J. Chem., 2017, 41, 9938–9946 RSC.
- M. M. Rahman, M. M. Alam, A. M. Asiri and M. A. Islam, Talanta, 2017, 170, 215–223 CrossRef CAS PubMed.
- S. Pang and X. Kan, New J. Chem., 2019, 43, 10517–10522 RSC.
- L. Rassaei, F. Marken, M. Sillanpää, M. Amiri, C. M. Cirtiu and M. Sillanpää, TrAC, Trends Anal. Chem., 2011, 30, 1704–1715 CrossRef CAS.
- S. Kempahanumakkagari, A. Deep, K. H. Kim, S. Kumar Kailasa and H. O. Yoon, Biosens. Bioelectron., 2017, 95, 106–116 CrossRef CAS PubMed.
- A. Waheed, M. Mansha and N. Ullah, TrAC, Trends Anal. Chem., 2018, 105, 37–51 CrossRef CAS.
- M. Marie, S. Mandal and O. Manasreh, Sensors, 2015, 15, 18714–18723 CrossRef CAS PubMed.
- L. Zhu and W. Zeng, Sens. Actuators, A, 2017, 267, 242–261 CrossRef CAS.
- E. Comini, G. Faglia, G. Sberveglieri, Z. Pan and Z. L. Wang, Appl. Phys. Lett., 2002, 81, 1869–1871 CrossRef CAS.
- Ü. Özgür, Y. I. Alivov, C. Liu, A. Teke, M. A. Reshchikov, S. Doğan and V. Avrutin, J. Appl. Phys., 2005, 98, 041301 CrossRef.
- A. Ryzhikov, J. Jońca, M. Kahn, K. Fajerwerg, B. Chaudret, A. Chapelle, P. Ménini, C. H. Shim, A. Gaudon and P. Fau, J. Nanopart. Res., 2015, 17, 280 CrossRef.
- R. Devi, M. Thakur and C. S. Pundir, Biosens. Bioelectron., 2011, 26, 3420–3426 CrossRef CAS PubMed.
- A. Umar, M. M. Rahman and Y.-B. Hahn, J. Nanosci. Nanotechnol., 2009, 9, 4686–4691 CrossRef CAS PubMed.
- H. B. Balkhoyor, M. M. Rahman and A. M. Asiri, RSC Adv., 2016, 6, 58236–58246 RSC.
- H. Koga and T. Kitaoka, Chem. Eng. J., 2011, 168, 420–425 CrossRef CAS.
- K. Singh, A. Kaur, A. Umar, G. R. Chaudhary, S. Singh and S. K. Mehta, J. Appl. Electrochem., 2015, 45, 253–261 CrossRef CAS.
- R. Kötz, S. Stucki and B. Carcer, J. Appl. Electrochem., 1991, 21, 14–20 CrossRef.
- A. Babaei, B. Khalilzadeh and M. Afrasiabi, J. Appl. Electrochem., 2010, 40, 1537–1543 CrossRef CAS.
- S. Chaudhary, A. Umar, K. K. Bhasin and S. Baskoutas, Materials, 2018, 11, 287 CrossRef PubMed.
- T. M. Hammad, J. K. Salem and R. G. Harrison, Appl. Nanosci., 2013, 3, 133–139 CrossRef CAS.
- G. Li, Sens. Actuators, B, 1999, 60, 64–70 CrossRef CAS.
- M. Nafees, W. Liaqut, S. Ali and M. A. Shafique, Appl. Nanosci., 2013, 3, 49–55 CrossRef CAS.
- B. Divband, M. Khatamian, G. R. K. Eslamian and M. Darbandi, Appl. Surf. Sci., 2013, 284, 80–84 CrossRef CAS.
- W. Zhang, G. Wang, Z. He, C. Hou, Q. Zhang, H. Wang and Y. Li, Mater. Des., 2016, 109, 492–502 CrossRef CAS.
- A. Gupta, B. C. Kim, E. Edwards, C. Brantley and P. Ruffin, Mater. Sci. Eng., B, 2012, 177, 1583–1588 CrossRef CAS.
- B. Thirumalraj, C. Rajkumar, S. M. Chen and K. Y. Lin, J. Colloid Interface Sci., 2017, 499, 83–92 CrossRef CAS PubMed.
- K. Singh, A. A. Ibrahim, A. Umar, A. Kumar, G. R. Chaudhary, S. Singh and S. K. Mehta, Sens. Actuators, B, 2014, 202, 1044–1050 CrossRef CAS.
- M. Hussain, H. Sun, S. Karim, A. Nisar, M. Khan, A. ul Haq, M. Iqbal and M. Ahmad, J. Nanopart. Res., 2016, 18, 95 CrossRef.
- C. Sassoye, G. Muller, D. P. Debecker, A. Karelovic, S. Cassaignon, C. Pizarro, P. Ruiz and C. Sanchez, Green Chem., 2011, 13, 3230–3237 RSC.
- A. Salomonsson, R. M. Petoral, K. Uvdal, C. Aulin, P. O. Käll, L. Ojamäe, M. Strand, M. Sanati and A. L. Spetz, J. Nanopart. Res., 2006, 8, 899–910 CrossRef CAS.
- E. R. Kötz and S. Stucki, J. Appl. Electrochem., 1987, 17, 1190–1197 CrossRef.
- A. Mills, P. A. Duckmanton and J. Reglinski, Chem. Commun., 2010, 46, 2397 RSC.
- L. D. Burke and N. S. Naser, J. Appl. Electrochem., 2005, 35, 931–938 CrossRef CAS.
- N. López, J. Gómez-Segura, R. P. Marín and J. Pérez-Ramírez, J. Catal., 2008, 255, 29–39 CrossRef.
- C. Mondelli, A. P. Amrute, F. Krumeich, T. Schmidt, J. Perez-Ramirez and J. Pérez-Ramírez, ChemCatChem, 2011, 3, 657–660 CrossRef CAS.
- M. T. Uddin, O. Babot, L. Thomas, C. Olivier, M. Redaelli, M. D'Arienzo, F. Morazzoni, W. Jaegermann, N. Rockstroh, H. Junge and T. Toupance, J. Phys. Chem. C, 2015, 119, 7006–7015 CrossRef CAS.
- S. Bang, S. Lee, T. Park, Y. Ko, S. Shin, S.-Y. Yim, H. Seo and H. Jeon, J. Mater. Chem., 2012, 22, 14141 RSC.
- M. T. Uddin, Y. Nicolas, C. Olivier, L. Servant, T. Toupance, S. Li, A. Klein and W. Jaegermann, Phys. Chem. Chem. Phys., 2015, 17, 5090–5102 RSC.
- D. Kundu, B. D. Adams, V. Duffort, S. H. Vajargah and L. F. Nazar, Nat. Energy, 2016, 16119 CrossRef CAS.
- Y. Zhang, M. K. Ram, E. K. Stefanakos and D. Y. Goswami, J. Nanomater., 2012, 2012 CAS.
- D. Xu, D. Fan and W. Shen, Nanoscale Res. Lett., 2013, 8, 1–9 CrossRef PubMed.
- N. Gogurla, A. K. Sinha, S. Santra, S. Manna and S. K. Ray, Sci. Rep., 2015, 4, 6483 CrossRef PubMed.
- X. M. Teng, H. T. Fan, S. S. Pan, C. Ye and G. H. Li, J. Appl. Phys., 2006, 100, 053507 CrossRef.
- S. Bai, T. Guo, D. Li, R. Luo, A. Chen and C. C. Liu, Sens. Actuators, B, 2013, 182, 747–754 CrossRef CAS.
- S. Balachandran, S. G. Praveen, R. Velmurugan and M. Swaminathan, RSC Adv., 2014, 4, 4353–4362 RSC.
- D. R. Kumar, D. Manoj and J. Santhanalakshmi, RSC Adv., 2014, 4, 8943 RSC.
- D. E. P. Vanpoucke, Nanotechnology, 2014, 25, 458001 CrossRef PubMed.
- R. Kötz, H. J. Lewerenz and S. Stucki, J. Electrochem. Soc., 1983, 130, 825 CrossRef.
- A. Foelske, O. Barbieri, M. Hahn and R. Kotz, Electrochem. Solid-State Lett., 2006, 9, A268–A272 CrossRef CAS.
- H. Over, A. P. Seitsonen, E. Lundgren, M. Smedh and J. N. Andersen, Surf. Sci., 2002, 504, L196–L200 CrossRef CAS.
- A. Khorsand Zak, R. Razali, W. H. Abd Majid and M. Darroudi, Int. J. Nanomed., 2011, 6, 1399–1403 CrossRef CAS PubMed.
- M. R. Arefi and S. Rezaei-Zarchi, Int. J. Mol. Sci., 2012, 13, 4340–4350 CrossRef CAS PubMed.
- L. Znaidi, T. Touam, D. Vrel, N. Souded, S. Yahia, O. Brinza, A. Fischer and A. Boudrioua, Coatings, 2013, 3, 126–139 CrossRef CAS.
- Y. Zhang, F. Zhu, J. Zhang and L. Xia, Nanoscale Res. Lett., 2008, 3, 201–204 CrossRef CAS.
- J. Tian, X. Hu, N. Wei, Y. Zhou, X. Xu, H. Cui and H. Liu, Sol. Energy Mater. Sol. Cells, 2016, 151, 7–13 CrossRef CAS.
- P. Fageria, S. Gangopadhyay and S. Pande, RSC Adv., 2014, 4, 24962–24972 RSC.
- D. Amaranatha Reddy, R. Ma and T. K. Kim, Ceram. Int., 2015, 41, 6999–7009 CrossRef.
- R. F. Silva and M. E. D. Zaniquelli, in Colloids and Surfaces A: Physicochemical and Engineering Aspects, 2002 Search PubMed.
- M. Khorasani-Motlagh, M. Noroozifar and M. Yousefi, Int. J. Nanosci. Nanotechnol., 2011, 7, 167–172 Search PubMed.
- V. Natarajan and S. Basu, Int. J. Hydrogen Energy, 2015, 40, 16702–16713 CrossRef CAS.
- M. M. Rahman and J. Ahmed, Biosens. Bioelectron., 2018, 102, 631–636 CrossRef CAS PubMed.
- M. M. Rahman, H. M. Marwani, F. K. Algethami and A. M. Asiri, Mater. Express, 2017, 7, 169–179 CrossRef CAS.
- J. Ahmed, M. M. Rahman, I. A. Siddiquey, A. M. Asiri and M. A. Hasnat, Electrochim. Acta, 2017, 246, 597–605 CrossRef CAS.
- A. Khan, A. A. P. Khan, M. M. Rahman, A. M. Asiri, Inamuddin, K. A. Alamry and S. A. Hameed, Appl. Surf. Sci., 2018, 433, 696–704 CrossRef CAS.
- A. Umar, S. Kim, R. Kumar, H. Algarni and M. S. Al-Assiri, Ceram. Int., 2016, 42, 7899–9332 CrossRef.
- M. K. Alam, M. M. Rahman, M. Abbas, S. R. Torati, A. M. Asiri, D. Kim and C. G. Kim, J. Electroanal. Chem., 2017, 788, 66–73 CrossRef CAS.
- M. M. Hussain, M. M. Rahman and A. M. Asiri, PLoS One, 2016, 11(12), e0166265 CrossRef PubMed.
- M. M. Rahman, S. B. Khan, A. M. Asiri and A. G. Al-Sehemi, Electrochim. Acta, 2013, 112, 422–430 CrossRef CAS.
- S. B. Khan, M. M. Rahman, K. Akhtar, A. M. Asiri and M. A. Rub, PLoS One, 2013, 9(1), e85290 CrossRef PubMed.
Footnote |
| † Electronic supplementary information (ESI) available. See DOI: 10.1039/c9ra08669b |
| This journal is © The Royal Society of Chemistry 2020 |