
 Open Access Article
 This Open Access Article is licensed under a Creative Commons Attribution-Non Commercial 3.0 Unported Licence
Synthesis of green-emitting carbon quantum dots with double carbon sources and their application as a fluorescent probe for selective detection of Cu2+ ions
Jun Xua,
Congling Wanga,
Huizhi Lib and
Weilin Zhao *a
*a
aSchool of Materials Science and Engineering, University of Jinan, Jinan 250022, China. E-mail: zhaowl_ujn@126.com
bSchool of Chemistry and Chemical Engineering, University of Jinan, Jinan 250022, China
First published on 14th January 2020
Abstract
Green-emitting carbon quantum dots (G-CQDs) were prepared using tartaric acid and bran by one-pot solvothermal treatment and had photoluminescence quantum yields (PL QY) as high as 46%. The morphology of the G-CQDs is characterized by TEM, which shows the average diameter of G-CQDs is approximately ∼4.85 nm. The FT-IR spectra display the presence of –OH, C–N, N–H and –COOH on the surface of the G-CQDs. The emission wavelength of the G-CQDs was ∼539 nm in the case of ∼450 nm excitation wavelength, which corresponds to the green fluorescence. Furthermore, the G-CQDs were used as a fluorescent probe for detection Cu2+ ions, and demonstrated a linear distribution between ln(F/F0) and the Cu2+ ions concentration. Specifically, the Cu2+ ion concentration should fall in the G-CQD concentration range of 0–0.5 mM and the detection limit is 0.0507 μM. Thus, due to the excellent chemical stability and good luminescence performance, these G-CQDs could be excellent probes widely used in detection fields.
1. Introduction
Over the last few years, a novel type of quantum dot material—carbon quantum dots (CQDs)—has been discovered and prepared, which further broadens the application range of carbon nanomaterials. In addition, CQDs are a member of the quantum dot material family and are a zero-dimensional semiconductor nanocrystal with a nearly spherical shape and a particle size of less than 10 nm. CQDs are generally composed of very few molecules or atoms and can well disperse in water or organic solvent to form a colloid.In 2004, Xu et al.1 used the arc discharge method to prepare carbon nanotubes. When separated and purified by gel electrophoresis, a carbon nanoparticle with fluorescence was accidentally obtained. Therefore, carbon materials with fluorescent properties began to attract people's attention. Two years later, Sun's research group2 obtained fluorescent carbon nanoparticles, which were named “carbon quantum dots (CQDs)”. Compared with previous carbon nanomaterials and organic dyes, CQDs have unique luminescent properties and overcome the shortcomings of organic dyes,3 such as emission spectrum half-peak width, photobleaching, fluorescence lifetime short and toxic. Also, compared with traditional semiconductor metal quantum dots, CQDs have the advantages of good biocompatibility, low toxicity and easy functionalization in addition to the properties of metal quantum dots.4–7 Based on the advantages described above, CQDs are widely used in the fields of fluorescent labeling,8–10 analytical detection,11–13 and safety ink.14 Thus, further research on fluorescent CQDs has important theoretical and practical value.
Nowadays there are multiple methods for preparing CQDs, these methods can be summarized into two categories: top-down and bottom-up methods.15 The top-down method mainly includes arc discharge method,16 laser ablation method,17 and electrochemical method;18,19 the bottom-up method contains hydrothermal/solvothermal method,20,21 combustion method,22 pyrolysis method,23 microwave method,24 et al. Among them, hydrothermal/solvothermal method is the most commonly used method for preparing CQDs due to its advantages of simplicity and ease of operation.
Wang et al. reported the novel N-CQDs were synthesized by a hydrothermal approach using the carbon source (eggplant sepals). The prepared N-CQDs showed outstanding photoluminescence properties with excellent chemical stability in phosphate buffer solution.25 Jiang et al. synthesized the novel N-doped CQDs by hydrothermal method using isoleucine and citric acid as carbon source. Under optimal conditions, the N-doped CQDs can be applied to detect Fe3+ and presented a fluorescence quenching response to Fe3+.26 Sarkar et al. obtained CQDs with different sizes via a simple hydrothermal method. The fluorescence properties of these CQDs showed that with the excitation wavelength increasing, the emissions wavelength for these samples were red shifted, which indicated the prepared CQDs have dependence on excitation wavelength.27
With the deepening of research on CQDs, the application of CQDs has become the focus of research. At present, the researches on the application of CQDs has made some progress, mainly in the fields of optoelectronics, catalysis and sensing,28 in which the most common and simple application is the detection of metal ions. He et al. developed a facile synthetic method using cabbage juice to synthetic N-doped carbon dots (NCDs) to detect Fe3+ and the detection limit was 1.4 nM.29 Wang et al. presented the multicolored emission carbon dots to detect Fe3+ and Cu2+ ions through assigning a different colored emission carbon dot to a different metal ion.30 Zhang et al. introduced a hydrothermal approach for obtaining N-doped carbon dots (NCDs) from ammonium citrate and urea. The NCDs enable sensitive and selective determination of Hg2+ in tap water.31
In order to improve the application prospects of CQDS, researchers have adopted various methods to modify CQDS, most commonly heteroatom doping (such as N, S, P, etc.).29 Bran is the by-product of wheat processing flour and is a kind of production waste and mainly contains C, N and O elements. In this paper, we have used tartaric acid and bran as the double carbon source, and the bran contains N element, so the bran can also be used as the nitrogen source to prepare N-doped green-emitting carbon quantum dots (G-CQDs). In terms of application, we have used the synthesized G-CQDs to detect Cu2+ ions, and discovered that it has a good selectivity and sensitivity to Cu2+ ions. We expect that our work will be able to recycle wastes and improve the environment, and the G-CQDs will have better applications in detection and probe.
2. Experimental section
2.1 Reagents and chemicals
Tartaric acid, dimethylformamide (DMF), Na2HPO4, sodium citrate and the metal salts used in the experiment (KCl, NaCl, LiNO3, MgCl2, ZnCl2, CaCl2, CuSO4, FeSO4, Fe(NO3)3 and Al(NO3)3) were bought from Alfa Aesar. The above reagents are analytically pure and can be used directly. Bran is production waste and needs further treatment.2.2 Preparation of G-CQDs
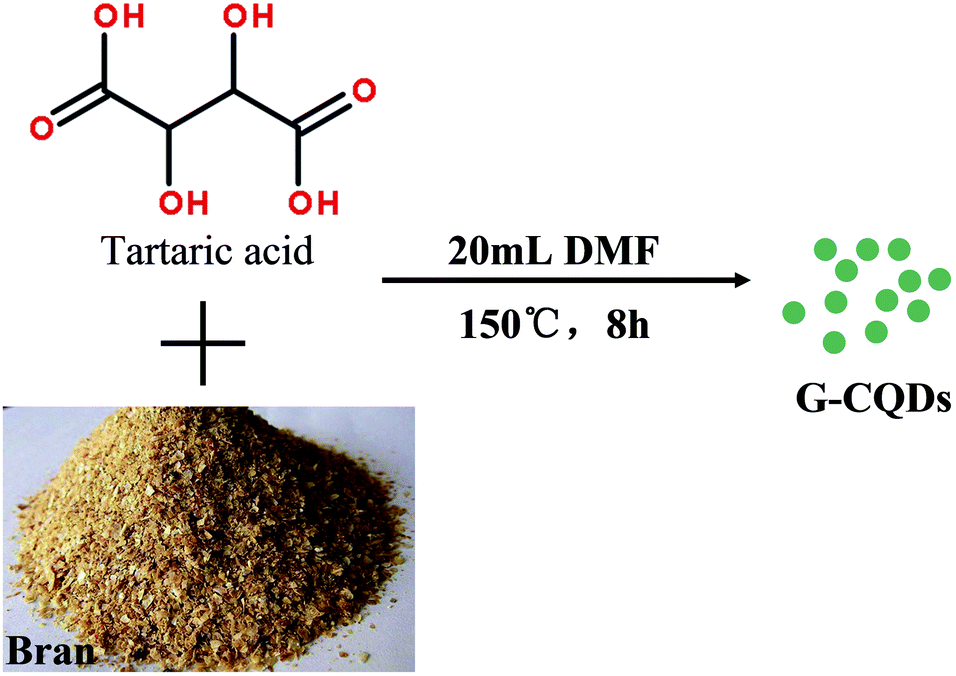
The bran was cleaned, dried, and processed through 200 mesh sieve, then the lower part of the sieve was set aside.G-CQDs were prepared by one-step solvothermal method using tartaric acid as carbon sources, bran as carbon and nitrogen sources and DMF as organic solvent. The specific experimental steps are as follows: tartaric acid and bran (with a molar ratio of 0.7) were added into 20 mL of DMF and transferred to a Teflon container that was packed into an autoclave. The autoclave was heated at 150 °C for 8 h in the oven. After the reaction, the autoclave was naturally cooled to room temperature. The black product was then centrifuged and filtrated with filter membrane (0.22 μm) and dialyzed by using the Biotech cellulose ester (CE) membrane (MWCO 500D) to obtain G-CQDs. Finally, the G-CQDs solution was added into the mixed solvents of petroleum ether and ethyl acetate to remove unreacted molecules and then the solid was dried at 65 °C overnight. The schematic diagram of the experimental process was shown in the Fig. 1.
 | ||
| Fig. 1 Schematic illustration of the experimental process of G-CQDs. | ||
2.3 Detection of Cu2+ ions with G-CQDs
The selectivity test of G-CQDs solution to Cu2+ ions: KCl, NaCl, LiNO3, MgCl2, ZnCl2, CaCl2, CuSO4, FeSO4, Fe(NO3)3 and Al(NO3)3 were respectively dissolved in DI-water and configured into a metal ion solution with a concentration of 2 mM. In the experiment of ion detection, 2 mL metal ion solution and 2 mL G-CQDs solution (5 mM) were selected to be mixed and allowed to stirring for 2 min at room temperature (pH = 7 in Na2HPO4-citrate buffer), and then fluorescence spectrophotometer was used for fluorescence spectrum test.The sensitivity test of G-CQDs solution to Cu2+ ions: the different concentrations of Cu2+ ions (pH = 7) were added into the G-CQDs solution (5 mM) for stand 2 min at 25 °C. The fluorescence intensity was measured at the 450 nm excitation wavelength.
2.4 Characterization
In this paper, a series of testing methods are applied to study the chemical and optical performances of G-CQDs.The high-resolution transmission electron microscopic (HR-TEM, JEM-1400) and Nanoparticle size and Zeta potential analyzer (Malvern ZS90) were used to describe the size and morphology of G-CQDs. The specific experimental conditions were as follows: the sample was dropped on a copper mesh of 230 mesh ultra-thin carbon film. The maximum tilt angle of the sample stage was ±400, the acceleration voltage was 200 kV, the lattice resolution was 0.2 nm, and the dot resolution was 0.34 nm.
A powder X-ray diffractometer (XRD, Bruker D8 ADVANCE) was used to detect the crystallinity of G-CQDs. The specific experimental conditions were as follows: the X-ray source used Cu target Kα-ray (λ = 0.15406 nm), the tube voltage was 40 kV, the tube current was 40 mA, the scanning speed was 5° min−1, and the scanning range (2θ) was 10–80°.
A Thermo NICOLET-380 spectrophotometer was applied to characterize the Fourier transform infrared spectrum (FT-IR) of G-CQDs. The FT-IR had an air scan as the background and the scanning range was 4000–400 cm−1. An X-ray photoelectron spectrometer (Thermo Fisher Scientific, Thermo ESCALAB 250XI) was employed to determine the X-ray photoelectron spectroscopy (XPS) analysis.
A Metash UV-5800 spectrophotometer and Shimadzu RF-6500 PC luminescence spectrometer were applied to record the UV-vis absorption spectra and photoluminescence (PL) spectra, respectively. The UV-vis absorption spectra was calibrated using the corresponding solvent as a reference, with a scan interval of 1 nm, a scan range of 300–700 nm, and a scan rate of medium speed. The fluorescence spectrum was measured by placing the sample to be tested in a quartz four-pass cuvette, using a 700 V neon lamp as the light source, the excitation slit width was 10 nm, the emission slit width was 10 nm, the scanning interval was 1 nm, and the scanning speed was 500 nm min−1, scanning range was 300–700 nm.
3. Results and discussion
The result of the XRD analysis of G-CQDs was presented in Fig. 2. The distinct diffraction peak is appeared in the range of 2θ = 20–24° corresponding to the plane of (002), this is due to the presence of graphitic carbon.32 Furthermore, the lattice spacing of G-CQDs by Bragg formula (1.1) is about ∼0.402 nm. This shows that G-CQDs are amorphous structure with sp2 hybrid carbon core of graphitic carbon.
2d![[thin space (1/6-em)]](https://www.rsc.org/images/entities/char_2009.gif) sinθ = nλ sinθ = nλ
| (1.1) |
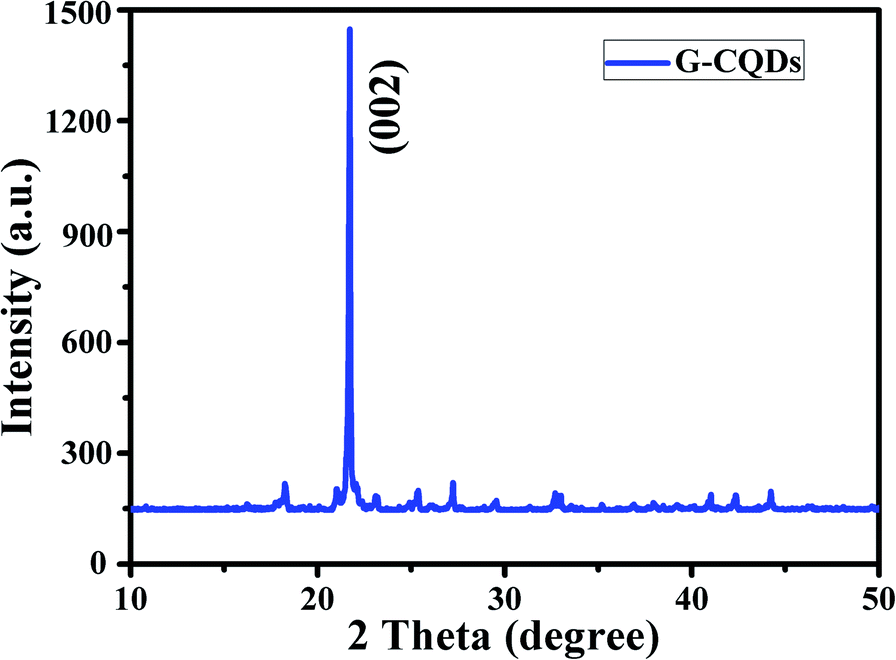 | ||
| Fig. 2 XRD pattern of the G-CQDs. | ||
To understand the structural characteristics of the prepared G-CQDs, the FT-IR spectrum was employed to analyze the functional groups of G-CQDs. Fig. 3 describes the FT-IR spectrum of the obtained G-CQDs and bran. It can be seen from the FT-IR spectrum (black curve) of the bran that the bran contains C–H2, C–O, C–N, C![[double bond, length as m-dash]](https://www.rsc.org/images/entities/char_e001.gif) N and N–H bonds, which can be used as a carbon source to prepare the G-CQDs, and as a nitrogen source to provide N elements for the G-CQDs. From the FT-IR spectrum (red curve) of the G-CQDs, the absorption peak at 3392 cm−1 corresponds to the stretching vibration of the N–H and O–H, indicating that the surface of G-CQDs contains –NH2 and hydrophilic –OH. Meanwhile, the stretching vibration peak for CH2 (2852 cm−1), CO and CN (1668 cm−1), C–N (1405 cm−1) and C–O (1078 cm−1) illustrates that the surface of G-CQDs is connected to functional groups containing O– and N–.
N and N–H bonds, which can be used as a carbon source to prepare the G-CQDs, and as a nitrogen source to provide N elements for the G-CQDs. From the FT-IR spectrum (red curve) of the G-CQDs, the absorption peak at 3392 cm−1 corresponds to the stretching vibration of the N–H and O–H, indicating that the surface of G-CQDs contains –NH2 and hydrophilic –OH. Meanwhile, the stretching vibration peak for CH2 (2852 cm−1), CO and CN (1668 cm−1), C–N (1405 cm−1) and C–O (1078 cm−1) illustrates that the surface of G-CQDs is connected to functional groups containing O– and N–.
 | ||
| Fig. 3 FT-IR spectra of G-CQDs and bran. | ||
The full survey of XPS of G-CQDs was performed to characterize the elemental composition and valence states of G-CQDs and control experiment. The result was shown in Fig. 4. Fig. 4(a) displays the synthesized G-CQDs and the compare experimental CQDs mainly all contain C, N, and O elements. This indicates that bran can provide N element for the preparation of G-CQDs. The XPS full survey spectra of G-CQDs shows an clear peak of C 1s at ∼298.9 eV, O 1s at ∼531.4 eV and N 1s at ∼401.3 eV, which is similar with the characteristic peaks found in the N-CQDs prepared using biomass tar and ethylene-diamine solution.33 Fig. 4(b) reveals three peaks of the C 1s XPS spectrum, which can be fitted into sp2 and sp3 hybridized carbon atoms in C–C/CC (∼285 eV), C–N/C–O (∼287.1 eV) and a carboxyl group (–COOH) at ∼288.7 eV, separately. Fig. 4(c) shows the N 1s XPS spectrum of G-CQDs, which presents the peak appearing at ∼399.8 eV corresponds to a pyridine N. The O 1s XPS spectrum (Fig. 4(d)) of G-CQDs displays that the characteristic peaks at ∼531.1 eV and ∼532.5 eV, corresponding to the CO bond and the C–O bond, respectively.
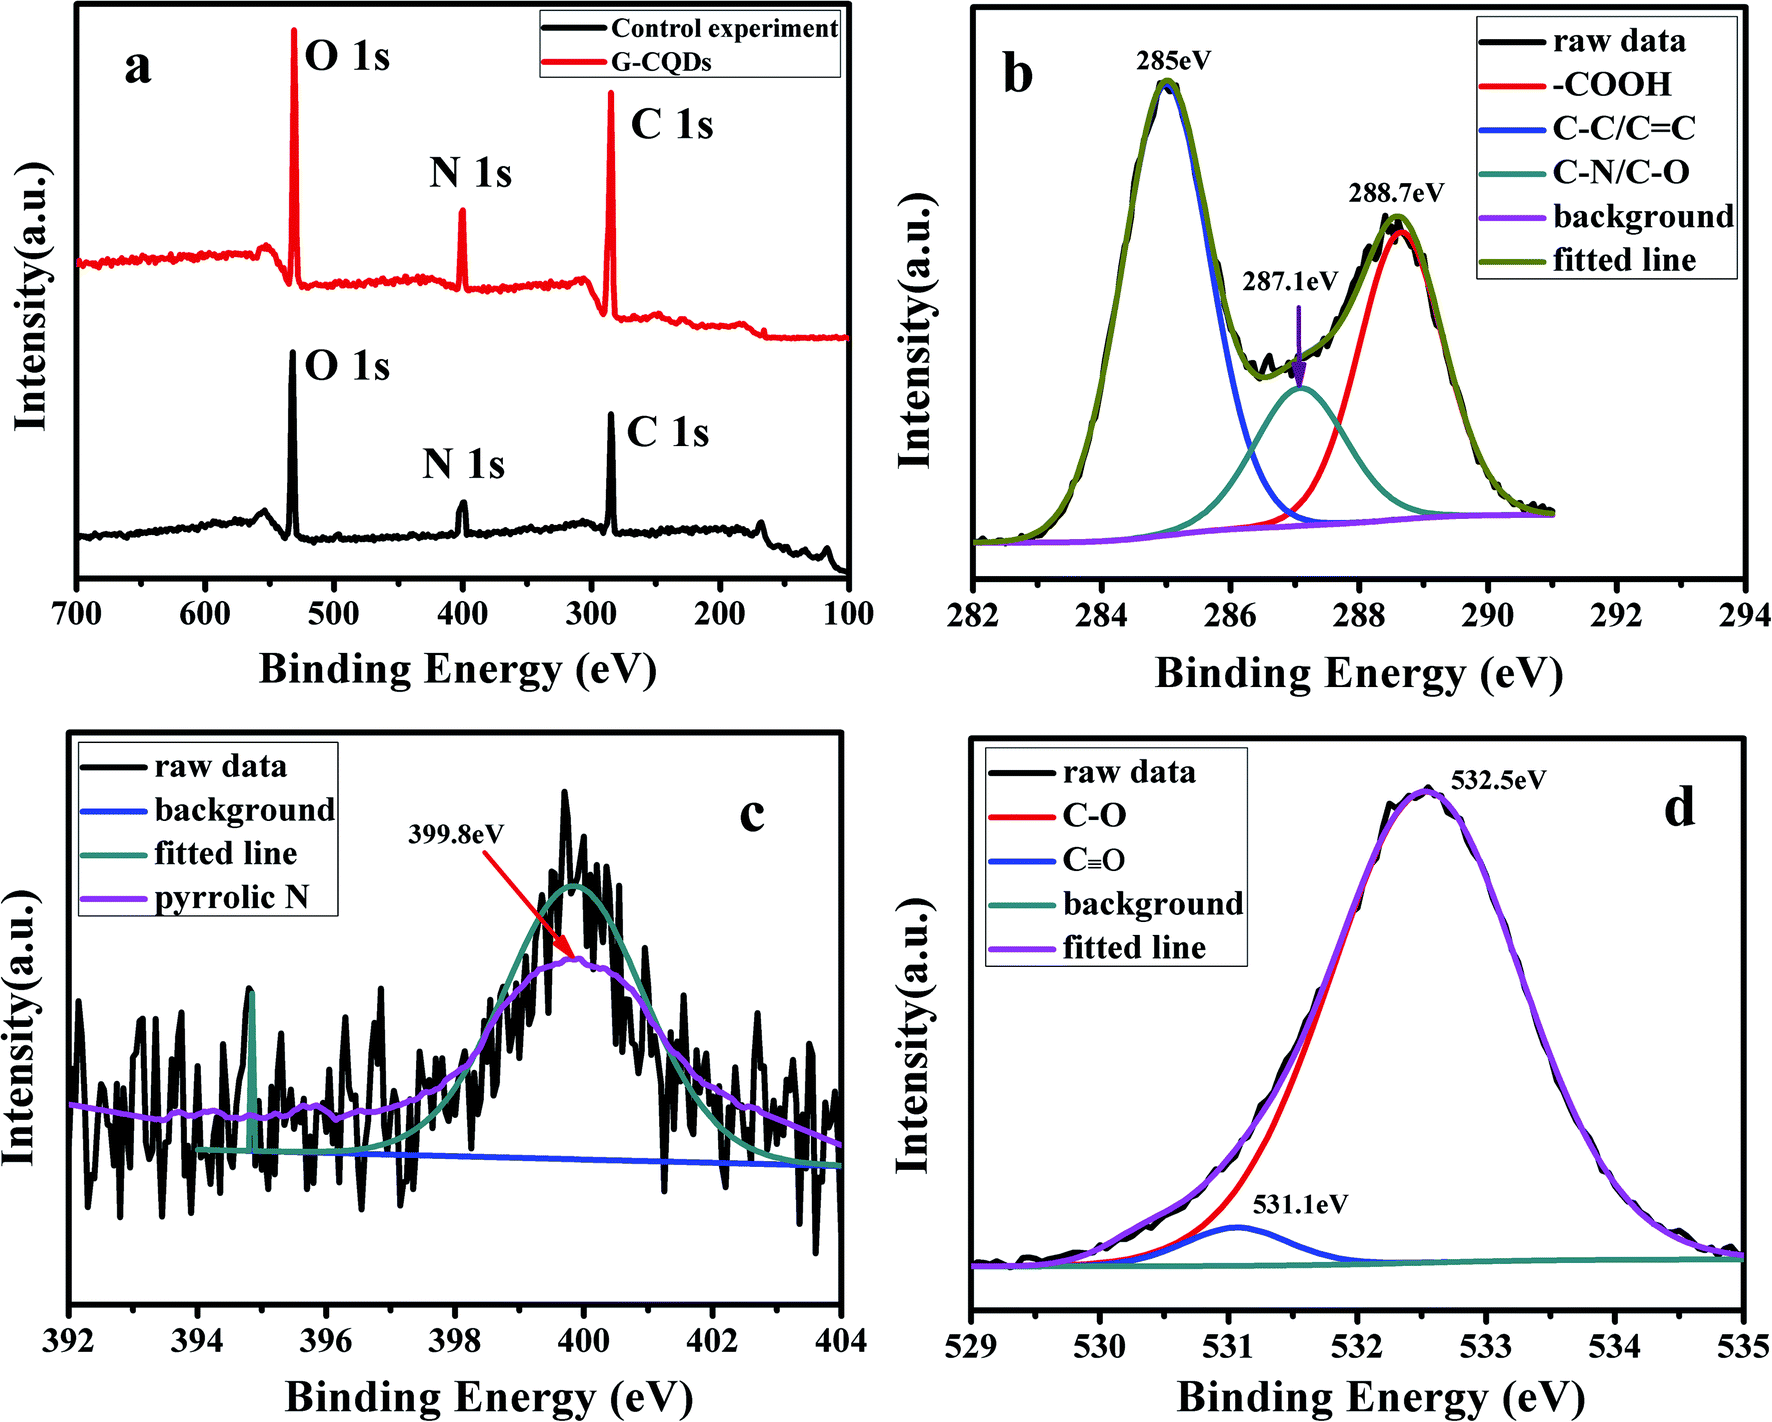 | ||
| Fig. 4 (a) Full-survey XPS spectrum of G-CQDs and control experiment, (b) C 1s, (c) N 1s and (d) O 1s XPS spectra. | ||
From Fig. 5, the TEM images of G-CQDs were investigated. We can see the particle size of G-CQDs is mainly concentrated in the range of 4–6 nm and the average particle size is ∼4.85 nm (Fig. 5(a)). From the HR-TEM of G-CQDs (Fig. 5(b)), it can be seen the G-CQDs have distinct stripes and the stripe pitch is 0.24 nm.
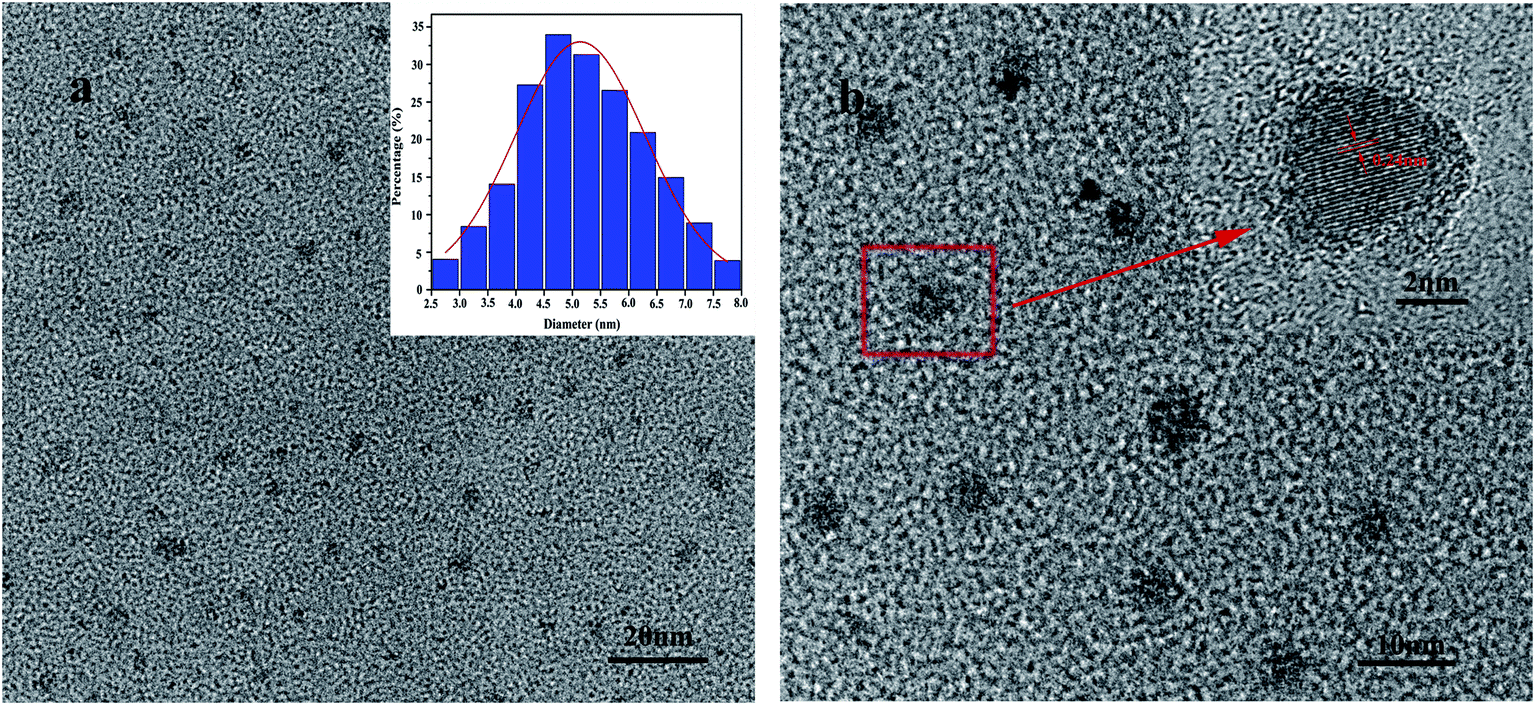 | ||
| Fig. 5 Morphologies and structural characterization of the G-CQDs: (a) TEM and particle size distribution, (b) HR-TEM. | ||
Fig. 6 displays the photoluminescence (PL) performance of G-CQDs. From Fig. 6(a), the UV absorption spectrum of G-CQDs has a distinct absorption peak at ∼350 nm, which may be caused by the n–π* transition of CO.34 Meanwhile, it can be seen from the excitation and emission spectrum curves of G-CQDs that at 450 nm excitation wavelength, the optimum fluorescence emission peak is ∼539 nm, which showed the green emission and was consistent with the photograph of the inline image. To further explore the PL performance of G-CQDs, the excitation wavelength dependence of G-CQDs was analyzed. Fig. 6(b) exhibits the fluorescence emission spectra of G-CQDs under different excitation wavelengths. It can be observed that with the increase of excitation wavelength, the fluorescence intensity of the G-CQDs first increases and then decreases; and the fluorescence intensity of G-CQDs is the strongest at the ∼450 nm excitation wavelength. Meanwhile, from Fig. 6(c), under the excitation of ∼450 nm, the color coordinates of G-CQDs are in the green region (∼0.35, ∼0.54). The color temperature is ∼5180 K, which calculated by eqn (1.2) and (1.3). In addition, according to the formula (1.4), the calculated photoluminescence quantum yields (PL QY) of the G-CQDs by relative method can reach up to 46%.
| T = −437n3 + 3601n2 − 6861n + 5514.31 | (1.2) |
| n = (x − 0.332)/(y − 0.1858) | (1.3) |
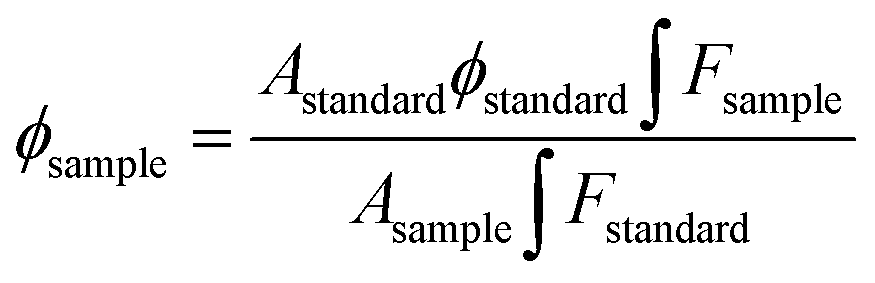 | (1.4) |
 and
and 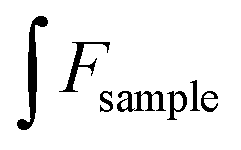 express the integral area of the emission spectrum of the standard (quinine sulfate) and G-CQDs under the same condition.
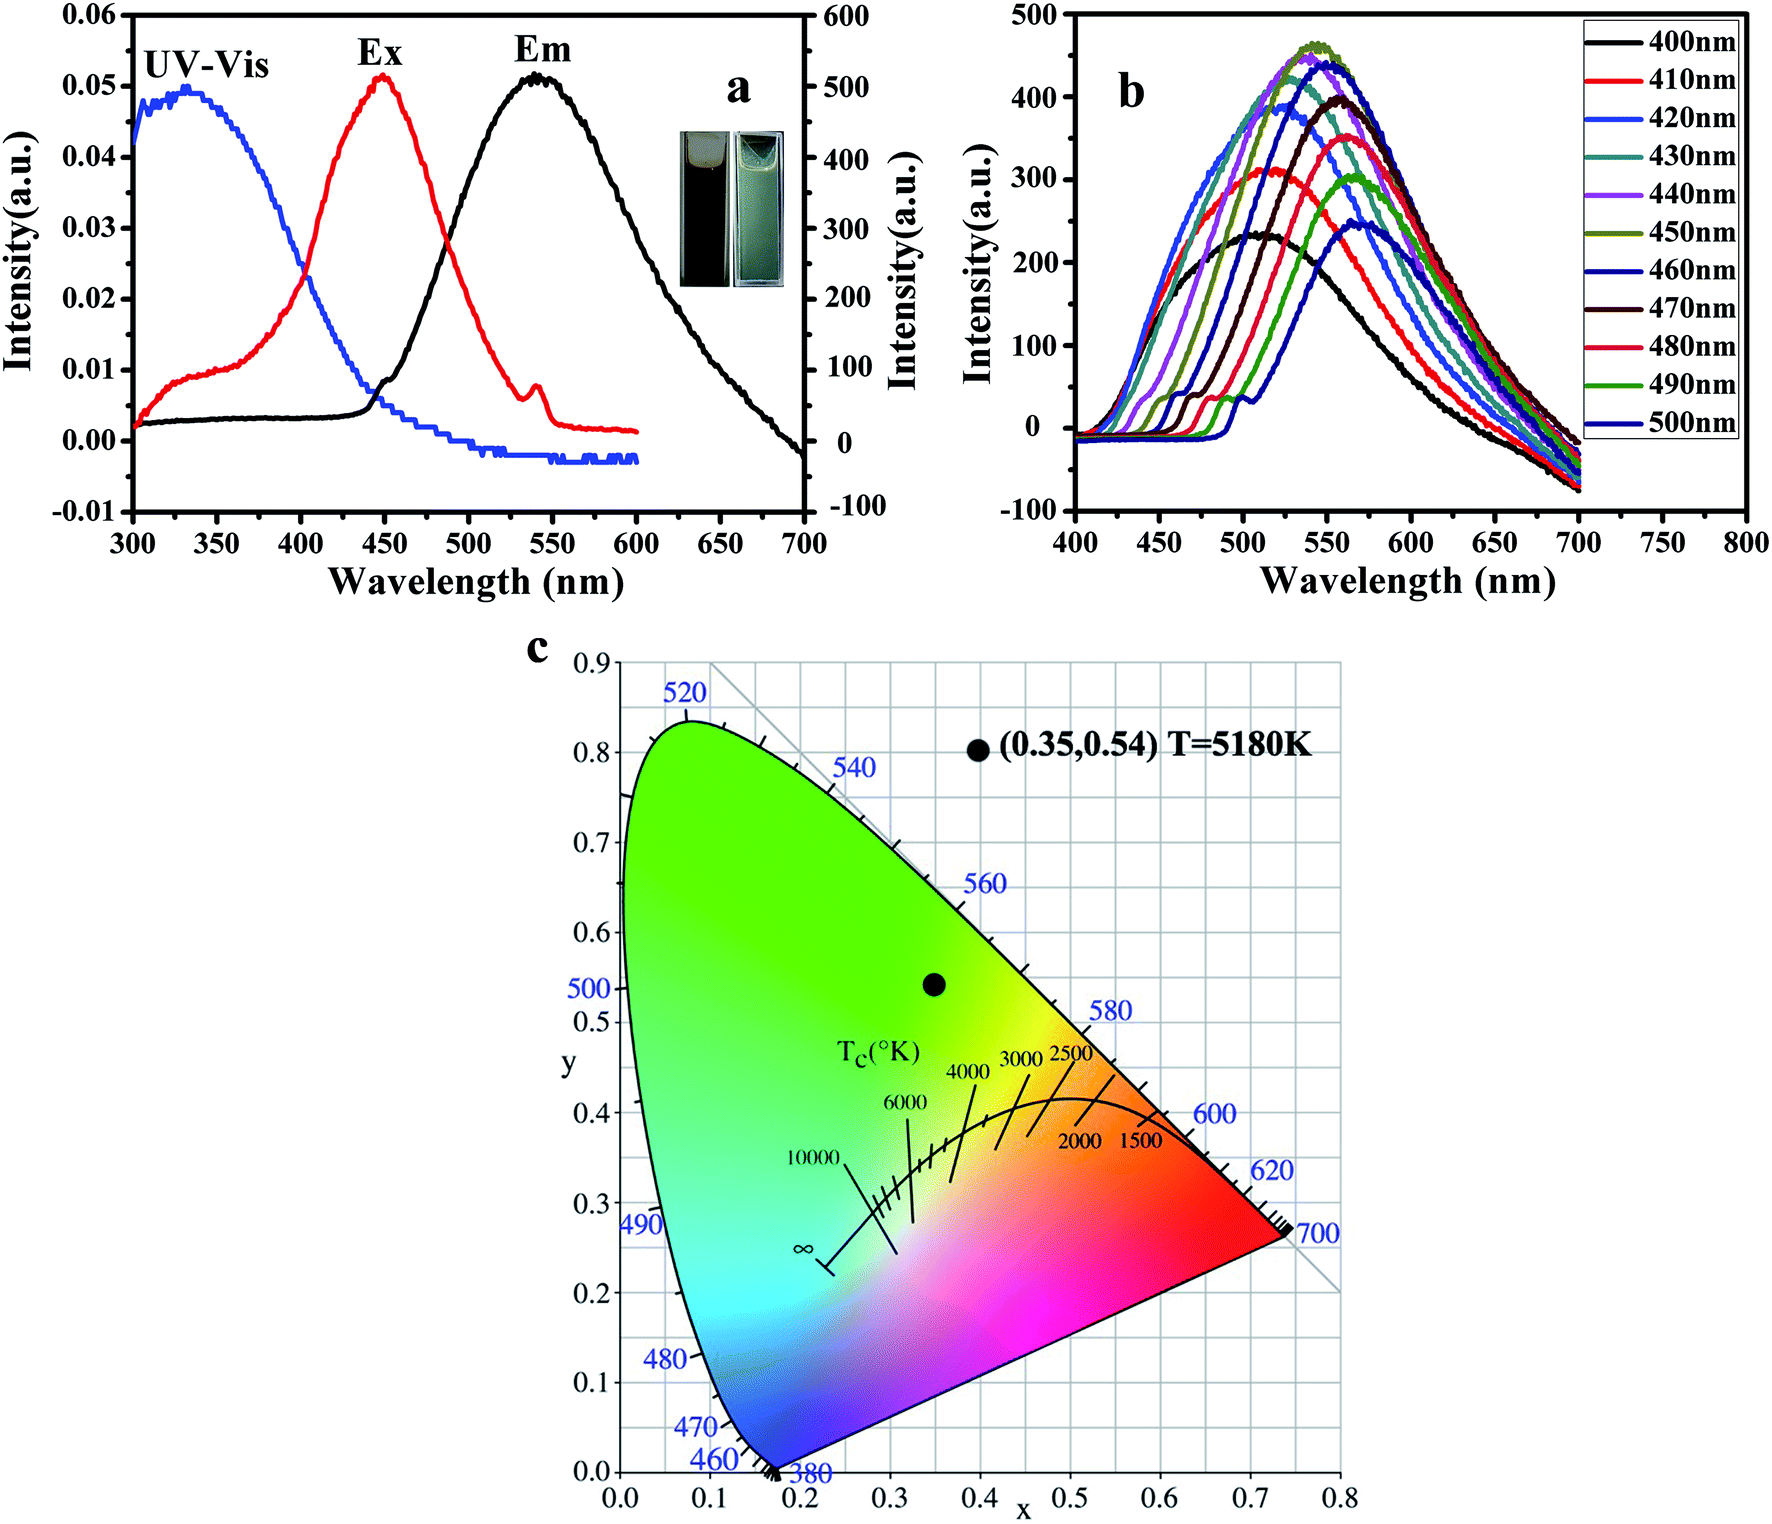 | ||
| Fig. 6 (a) UV-vis and PLE excitation spectra of G-CQDs (inset: B-CQDs: photographs taken under sunlight and UV light), (b) fluorescence emission spectra of G-CQDs at different excitation wavelengths, (c) color coordinates and color temperature of G-CQDs. | ||
Moreover, the effect of pH on the fluorescence intensity of G-CQDs was investigated (Fig. 7). As the pH increased from 3 to 8, the fluorescence intensity of G-CQDs remained basically unchanged, which means in the acid and alkali solution, the fluorescence intensity of G-CQDs only changed slightly. This might due to the surface of G-CQDs contains functional groups such as –OH, –NH, and the stability of the functional group is changed under different pH conditions, so that these functional groups are protonated or deprotonated, but only the charge transfer occurs on the surface of the G-CQDs, and the core structure is still stable. The above shows that G-CQDs are not pH dependent.35
 | ||
| Fig. 7 The effect of pH on the fluorescence intensity of G-CQDs. | ||
In this paper, based on the excellent PL performance and chemical stability of G-CQDs, we studied the application of G-CQDs in metal ion detection. So far, researchers have done a series of studies on the application of CQDs to detect Cu2+ ions. Liang et al. reported a kind of multicolor fluorescent N-CDots obtained by hydrothermal treatment, which can be used as a fluorescent probe for the detection of Fe3+ ions. And they found the N-CDots showed lower detection limit (7.6 nM) and higher selectivity during the concentration of Fe3+ ions in tap water.36 Wu et al. synthesized CQDs from vitamin B1 via a hydrothermal process and the B1-CQDs could be utilized as a reliable probe to detect of Fe3+ ions with the detection limit as low as 177 nM.37 Murugan et al. indicated the quenching efficiency and the concentration of Cu2+ ions possessed a linear distribution with the concentration range of 0–100 μM (R2 = 0.9918).38 The study of Moonrinta et al. presented that CDs were compound using edible yogurt via a solvothermal process and the CDs was employed as fluorescent probe to detect formic acid vapor and metal ions. The formic acid concentration was detected by adjusting the light transmission of CDs and the detection limit was 7.3% v/v.39
Cu2+ ions are kind of heavy metal ion. When a large amount of Cu2+ ions remain in the human body, it is easy to burden the organs in the body. Therefore, it is of vital important to select a simple and easy method to detect Cu2+ ions. The mechanism of CQDs and detection of Cu2+ ions is due to the coordination or complexation of functional groups such as hydroxyl groups (–OH) and carboxyl groups (–COOH) on the surface with Cu2+ ions, so that the fluorescence quenching of CQDs can realize the selectivity and sensitivity detection of Cu2+ ions. The reaction principle of G-CQDs reacting with Cu2+ is similar with that reported by Van,40 and the reaction mechanism diagram is shown in Fig. 8.
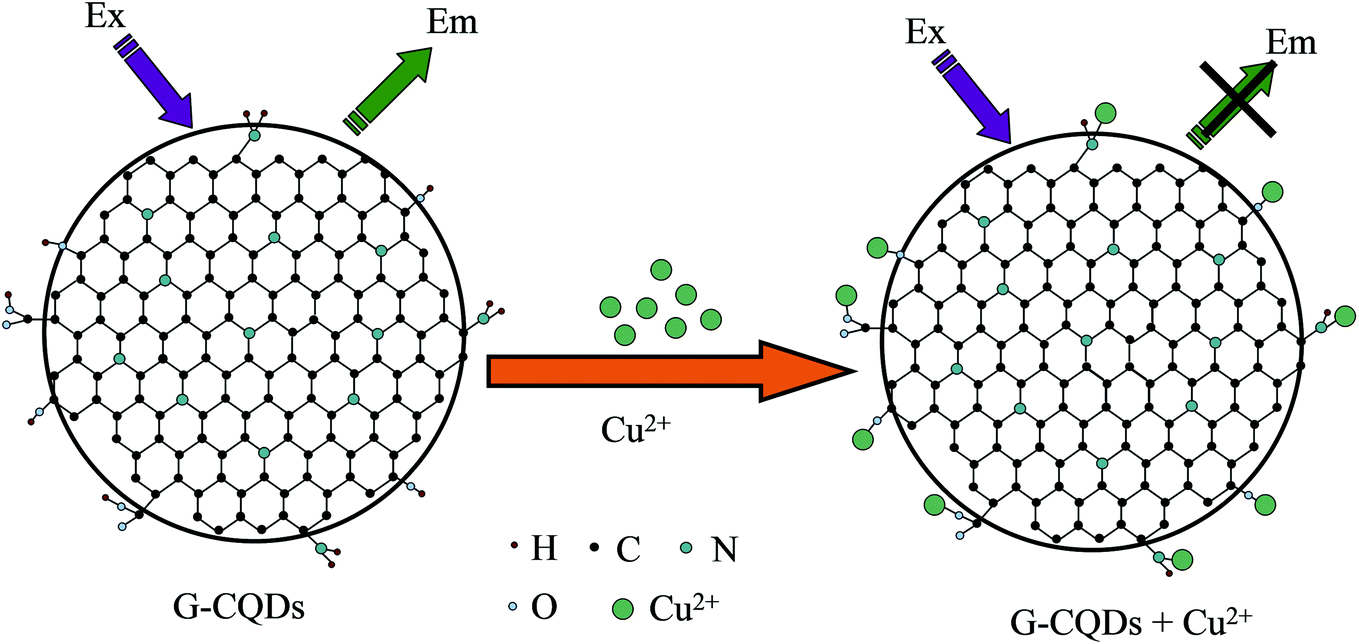 | ||
| Fig. 8 Fluorescence quenching mechanism of G-CQDs in the presence of Cu2+ ions. | ||
In this paper, the effects of different metal ions (K+, Na+, Li+, Mg2+, Zn2+, Ca2+, Cu2+, Fe2+, Fe3+, Al3+) on G-CQDs were investigated firstly (Fig. 9(a)). The concentration of each metal ion is 2 mM. Cu2+ ions have the highest degree of fluorescence quenching for G-CQDs, and the fluorescence quenching rate is as high as 94% (Fig. 9(b)). Other metal ions have almost no interference, indicating that G-CQDs as a fluorescent probe have good selectivity to Cu2+ ions.
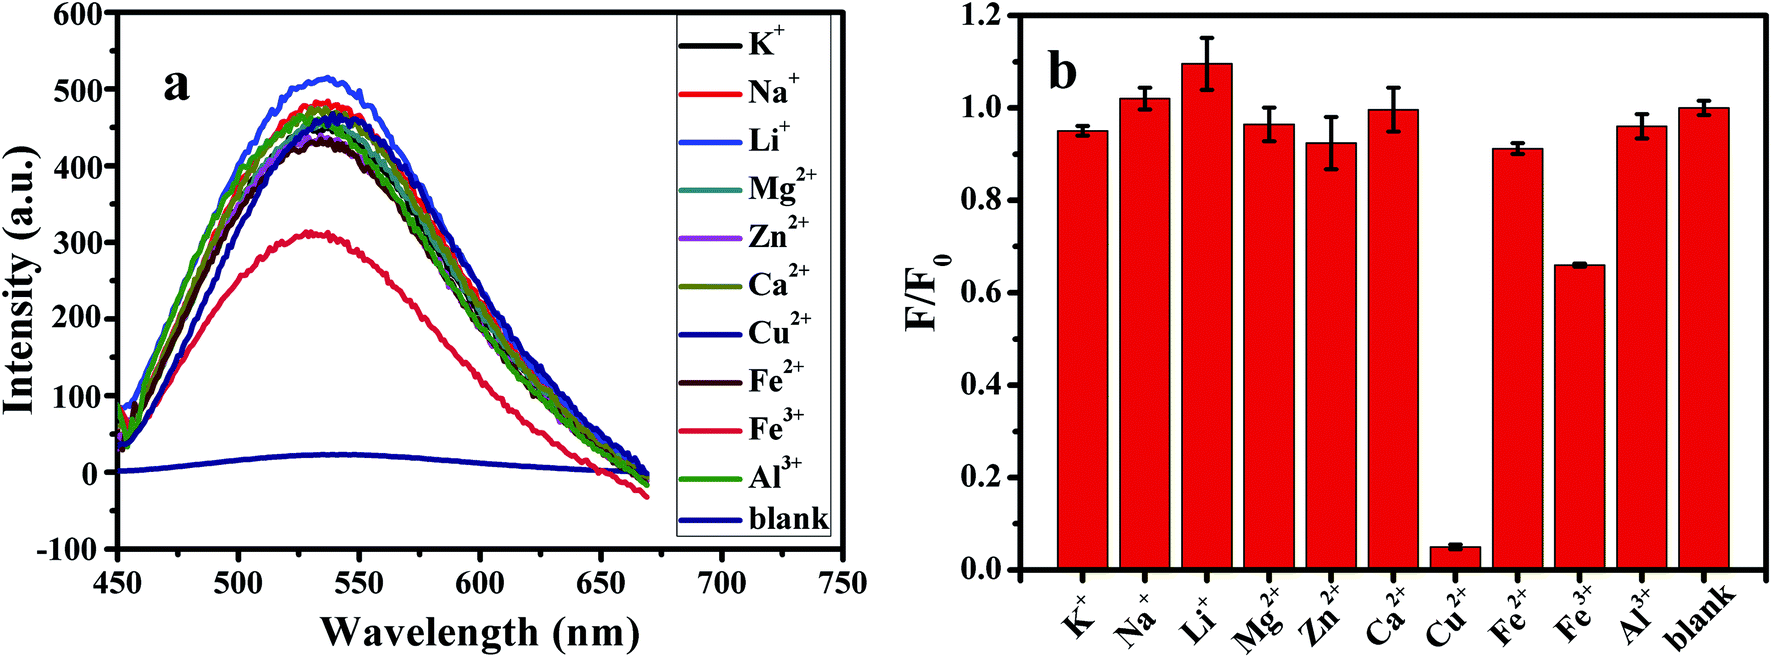 | ||
| Fig. 9 Effect of different metal ions on G-CQDs: (a) fluorescence intensity, (b) fluorescence quenching rate. | ||
Fig. 10(a) shows the spectrum of fluorescence quenching of different concentrations of Cu2+ ions and G-CQDs. Fig. 10(b) indicates a linear distribution between the concentration of Cu2+ ions and the fluorescence quenching rate of G-CQDs. The Cu2+ ions concentration in the range of 0–0.5 mM has a linear distribution with the quenching rate F/F0, where F0 is and F is the fluorescence intensities of after the addition Cu2+ ions. F/F0 = −1.213[Cu2+] + 1.0143, linear correlation coefficient (R2) is 0.9973, the detection limit is 0.0507 μM (according to the formula of 3S0/k, where S0 is the standard deviation of the blank sample (n = 11), and k is the slope of the linear equation).
 | ||
| Fig. 10 Effect of Cu2+ ions concentration on the fluorescence of G-CQDs: (a) fluorescence intensity, (b) linear relation graph. | ||
Table 1 shows the comparison of the detection limit of the G-CQDs to Cu2+ ions with other detection methods.41–45 We can see that the detection limit of G-CQDs for Cu2+ ions is relatively low, indicating that the prepared G-CQDs has excellent sensitivity to Cu2+ ions.
| Materials | Type of CQDs | Detection limit | Reference |
|---|---|---|---|
| O-Phenylendiamine | N-CDs | 0.28 μM | 41 |
| Citric acid and polyethylenimine (PEI) | N-CDs | 0.090 μM | 42 |
| Sulfuric acid and [C4mim][Cys] carbonization | N/S-CDs | 0.18 μM | 43 |
| CdTe and thioglycolic acid (TGA) | CD@SiO2@CdTe | 0.096 μM | 44 |
| Citric acid, ethylenediamine and 1,4,8,11-tetraazacyclo tetradecane | Cyclam-functionalized carbon dots | 0.13 μM | 45 |
| Tartaric acid and bran | N-CQDs | 0.0507 μM | This work |
To explore the effects of different concentrations of Cu2+ ions on the fluorescence lifetime of G-CQDs, we studied the fluorescence lifetime of G-CQDs under different concentrations of Cu2+ ions (Fig. 11). From Fig. 11, it can be seen that the G-CQDs' fluorescence life was 6.34 ns. The fluorescence life of G-CQDs decreased gradually with the increase of Cu2+ ions concentration, and the fluorescence life is 6.32 ns, 6.31 ns, 6.30 ns, 5.89 ns and 5.56 ns (the concentration Cu2+ ions is 0, 1, 2, 3, 4, 5 mM), respectively. The results of fluorescence life displays that the fluorescence quenching of the G-CQDs caused by Cu2+ ions may be due to the electron transfer from the excited state of the G-CQDs to Cu2+ ions.
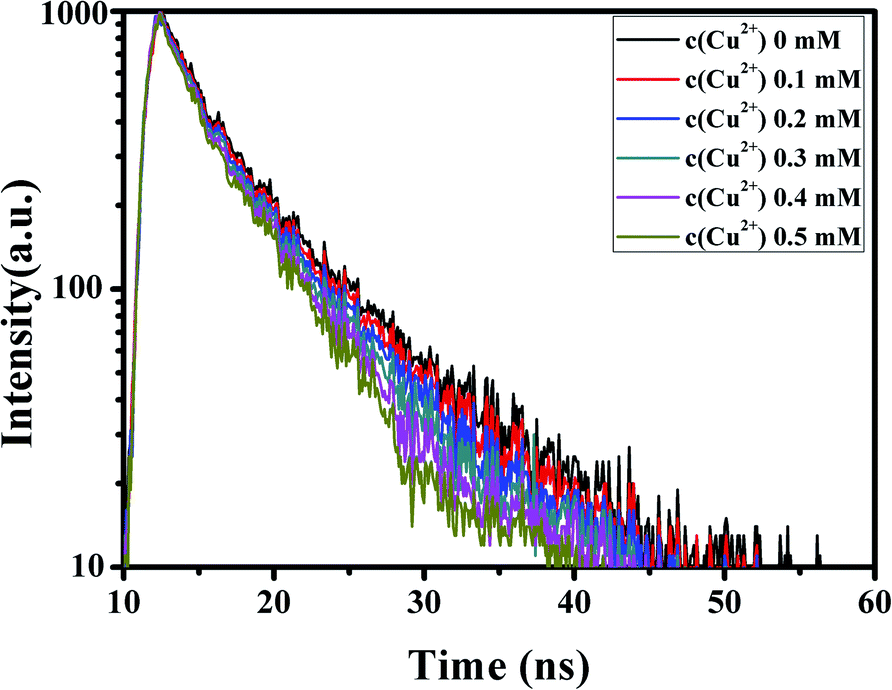 | ||
| Fig. 11 The effects of different concentrations of Cu2+ ions on the fluorescence lifetime of G-CQDs. | ||
To further illustrate the synthesized fluorescent G-CQDs can be used for detection Cu2+ ions, the standard recovery tests were conducted on mineral water, tap water and DI-water. The detect results are shown in Table 2. As we can see from Table 2, no matter in mineral water, tap water or DI-water, the synthesized fluorescent G-CQDs have a good recovery rate for detection (ranged from 107.72% to 111.80%) and a small relative standard deviation (ranged from 0.10% to 0.19%), indicating that this method has a high accuracy.
| Sample | Cu2+ added (μM) | Cu2+ found (μM) | RSD (n = 3, %) | Recovery (%) |
|---|---|---|---|---|
| Mineral water | 300 | 323.16 | 0.10 | 107.72 |
| Tap water | 300 | 335.41 | 0.19 | 111.80 |
| DI-water | 300 | 327.34 | 0.12 | 109.11 |
4. Conclusion
In summary, the N-doped G-CQDs (∼4.85 nm) were prepared through a simple solvothermal treatment from tartaric acid and bran. Based on this, the fluorescence properties and applications of the prepared G-CQDs were analyzed. The G-CQDs present green emission with the maximum peak centered at ∼539 nm at the ∼450 nm optimum excitation wavelength and the PL QY of the G-CQDs reach up to 46%. Under excitation of ∼450 nm, the color coordinates and color temperature of G-CQDs were calculated to be (∼0.35, ∼0.54) and ∼5180 K, respectively. The results indicated the color coordinates were consistent with the maximum emission wavelength of the G-CQDs. Furthermore, the G-CQDs were employed as fluorescent probe to detect Cu2+ ions with high selectivity and sensitivity, and the detection limit is 0.0507 μM. Meanwhile, we verified that the G-CQDs have high accuracy in the detection of Cu2+ ions in actual water samples. Thus, we expected that the G-CQDs synthesized in this paper will be widely applied in the detection fields.Conflicts of interest
The authors declare that they have no known competing financial interests or personal relationships that could have appeared to influence the work reported in this paper.The authors declare the following financial interests/personal relationships which may be considered as potential competing interests: we declare that we have no financial and personal relationships with other people or organizations that can inappropriately influence our work, there is no professional or other personal interest of any nature or kind in any product, service and/or company that could be construed as influencing the position presented in, or the review of, the manuscript entitled, “Synthesis of green-emitting carbon quantum dots with double carbon sources and their application as a fluorescent probe for selective detection of Cu2+ ions”.
Acknowledgements
The work was supported in part by the National Natural Science Foundation of China (No. 51402125), Shandong key research and development plan (No. 2017GGX20127).References
- X. Xu, R. Ray, Y. Gu, H. J. Ploehn, L. Gearheart, K. Raker and W. A. Scrivens, J. Am. Chem. Soc., 2004, 126, 12736–12737 CrossRef CAS PubMed.
- Y. P. Sun, B. Zhou, Y. Lin, K. A. S. Fernando, P. Pathak, M. J. Meziani, B. A. Harruff, X. Wang, H. Wang, P. G. Luo, H. Yang, M. E. Kose, B. Chen and L. M. Veca, J. Am. Chem. Soc., 2006, 128, 7756–7757 CrossRef CAS PubMed.
- H. Mattoussi, J. M. Mauro, E. R. Golaman and G. P. Anderson, J. Am. Chem. Soc., 2000, 122, 12142–12150 CrossRef CAS.
- X. Guo, Y. Zhu, L. Zhou, L. Zhang, Y. You, H. Zhang and J. Hao, RSC Adv., 2018, 8, 38091–38099 RSC.
- M. Chen, W. Wu, Y. Chen, Q. Pan, Y. Chen, Z. Zheng, Y. Zheng, L. Huang and S. Weng, RSC Adv., 2018, 8, 41432–41438 RSC.
- B. Wu, X. Liu, X. Shi, W. Han, C. Wang and L. Jiang, RSC Adv., 2019, 9, 8340–8349 RSC.
- S. Song, K. Wu, H. Wu, J. Guo and L. Zhang, RSC Adv., 2019, 9, 7362–7374 RSC.
- M. Geszke-Moritz and M. Moritz, Mater. Sci. Eng. C, 2013, 33, 1008–1021 CrossRef CAS PubMed.
- C. Guan, Y. Zhao, Y. Hou, G. Shan, D. Yan and Y. Liu, Talanta, 2018, 182, 314–323 CrossRef CAS PubMed.
- Y. Feng, D. Zhong, H. Miao and X. Yang, Talanta, 2015, 140, 128–133 CrossRef CAS PubMed.
- M. Amjadi, R. Shokri and T. Hallaj, Spectrochim. Acta, Part A, 2015, 153, 619–624 CrossRef PubMed.
- L. Rao, Y. Tang, Z. Li, X. Ding, G. Liang, H. Lu, C. Yan, K. Tang and B. Yu, Mater. Sci. Eng. C, 2017, 81, 213–223 CrossRef CAS PubMed.
- Q. Song, Y. Ma, X. Wang, T. Tang, Y. Song, Y. Ma, G. Xu, F. Wei, Y. Cen and Q. Hu, J. Colloid Interface Sci., 2018, 516, 522–528 CrossRef CAS PubMed.
- Z. Song, T. Lin, L. Lin, S. Lin, F. Fu, X. Wang and L. Guo, Angew. Chem., Int. Ed., 2016, 128, 2823–2827 CrossRef.
- S. N. Baker and G. A. Baker, Angew. Chem., Int. Ed., 2010, 49, 6726–6744 CrossRef CAS PubMed.
- M. Bottini, C. Balasubramanian, M. I. Dawson, A. Bergamaschi, S. Bellucci and T. Mustelin, J. Phys. Chem. B, 2005, 110, 831–836 CrossRef PubMed.
- R. L. Calabro, D. S. Yang and D. Y. Kim, J. Colloid Interface Sci., 2018, 527, 132–140 CrossRef CAS PubMed.
- S. Ahirwar, S. Mallick and D. Bahadur, ACS Omega, 2017, 2, 8343–8353 CrossRef CAS PubMed.
- H. Huang, S. Yang, Q. Li, Y. Yang, G. Wang, X. You, B. Mao, H. Wang, Y. Ma, P. He, Z. Liu, G. Ding and X. Xie, Langmuir, 2018, 34, 250–258 CrossRef CAS PubMed.
- J. D. Xie, G. W. Lai and M. M. Huq, Diamond Relat. Mater., 2017, 79, 112–118 CrossRef CAS.
- T. Shen, Q. Wang, Z. Guo, J. Kuang and W. Cao, Ceram. Int., 2018, 44, 11828–11834 CrossRef CAS.
- S. Zhang, L. Zhang, L. Huang, G. Zheng, P. Zhang, Y. Jin, Z. Jiao and X. Sun, J. Lumin., 2019, 206, 608–612 CrossRef CAS.
- Q. L. Chen, C. F. Wang and S. Chen, J. Mater. Sci., 2013, 48, 2352–2357 CrossRef CAS.
- H. Li, F. Q. Shao, H. Huang, J. J. Feng and A. J. Wang, Sens. Actuators, B, 2016, 226, 506–511 CrossRef CAS.
- Y. Wang and X. Jiang, Sci. China: Chem., 2016, 59, 836–842 CrossRef CAS.
- Y. Jiang, Q. Han, C. Jin, J. Zhang and B. Wang, Mater. Lett., 2015, 141, 366–368 CrossRef CAS.
- S. Sarkar, D. Banerjee, U. K. Ghorai, N. S. Das and K. K. Chattopadhyay, J. Lumin., 2016, 178, 314–323 CrossRef CAS.
- Q. Zhong, Y. Chen, A. Su and Y. Wang, Sens. Actuators, B, 2018, 273, 1098–1102 CrossRef CAS.
- Y. He, L. Liang, Q. Liu, J. Guo, D. Liang and H. Liu, RSC Adv., 2017, 7, 56087–56092 RSC.
- Y. Wang, Q. Chang and S. Hu, Sens. Actuators, B, 2017, 253, 928–933 CrossRef CAS.
- Y. Zhang, N. Jing, J. Zhang and Y. Wang, Int. J. Environ. Anal. Chem., 2017, 97, 841–853 CrossRef CAS.
- H. Zhu, X. Wang, X. Y. Li, Z. Wang, Z. F. Yang and X. Yang, Chem. Commun., 2009, 5118–5120 RSC.
- X. Deng, Y. Feng, H. Li, Z. Du, Q. Teng and H. Wang, Particuology, 2018, 41, 94–100 CrossRef CAS.
- H. Nie, M. Li, Q. Li, S. Liang, Y. Tan, L. Sheng, W. Shi and X. A. Zhang, Chem. Mater., 2014, 26, 3104–3112 CrossRef CAS.
- X. Li, H. Wang, Y. Shimizu, A. Pyatenko, K. Kawaquchi and N. Koshizaki, Chem. Commun., 2011, 47, 932–934 RSC.
- Y. Liang, Y. Liu, S. Li, B. Lu, C. Liu, H. Yang, X. Ren and Y. Hou, Opt. Mater., 2019, 89, 92–99 CrossRef CAS.
- F. Wu, M. Yang, H. Zhang, S. Zhu, X. Zhu and K. Wang, Opt. Mater., 2018, 77, 258–263 CrossRef CAS.
- N. Murugan, M. Prakash, M. Jayakumar, A. Sundaramurthy and A. K. Sundramoorthy, Appl. Surf. Sci., 2019, 476, 468–480 CrossRef CAS.
- S. Moonrinta, B. Kwon, I. In, S. Kladsomboon, W. Sajomsang and P. Paoprasert, Opt. Mater., 2018, 81, 93–101 CrossRef CAS.
- T. T. Van and C. W. Mook, Curr. Appl. Phys., 2018, 18, 1255–1260 CrossRef.
- W. Lv, M. Lin, R. Li, Q. Zhang, H. Liu, J. Wang and C. Huang, Chin. Chem. Lett., 2019, 7, 1410–1414 CrossRef.
- A. S. Castillo, M. A. Avidad, C. Pritz, M. C. Robles, B. Fernández, M. J. R. Rama, A. M. Fernández, A. L. Fernández, F. S. Gonzalez, A. S. Fischer and L. F. C. Vallvey, Chem. Commun., 2013, 49, 1103 RSC.
- P. P. Xu, C. F. Wang, D. Sun, Y. J. Chen and K. L. Zhuo, Chem. Res. Chin. Univ., 2015, 31, 730 CrossRef CAS.
- H. B. Rao, W. Liu, Z. W. Lu, Y. Y. Wang, H. W. Ge, P. Zou, X. X. Wang, H. He, X. Y. Zeng and Y. J. Wang, Microchim. Acta, 2016, 183, 581 CrossRef CAS.
- J. Chen, Y. Li, K. Lv, W. B. Zhong, H. Wang, Z. Wu, P. G. Yi and J. H. Jiang, Sens. Actuators, B, 2016, 224, 298 CrossRef CAS.
| This journal is © The Royal Society of Chemistry 2020 |