 Open Access Article
Creative Commons Attribution 3.0 Unported Licence
Production of green diesel from catalytic deoxygenation of chicken fat oil over a series binary metal oxide-supported MWCNTs†
N. Aliana-Nasharuddinab,
N. Asikin-Mijan *a,
G. Abdulkareem-Alsultanad,
Mohd Izham Saimanab,
Fahad A. Alharthi
 e,
Abdulaziz Ali Alghamdie and
Y. H. Taufiq-Yap*ac
aCatalysis Science and Technology Research Centre (PutraCAT), Faculty of Science, Universiti Putra Malaysia, 43400 UPM Serdang, Selangor, Malaysia. E-mail: ckin_mijan@yahoo.com; taufiq@upm.edu.my; Fax: +603-89466758; Tel: +603-89466809
bDepartment of Chemistry, Faculty of Science, Universiti Putra Malaysia, 43400, UPM Serdang, Selangor, Malaysia
cChancellery Office, Universiti Malaysia Sabah, 88400, Kota Kinabalu, Sabah, Malaysia
dInstitute of Advanced Technology, Universiti Putra Malaysia, 43400 UPM Serdang, Selangor, Malaysia
eChemistry Department Science College, King Saud University, PO Box 2455, Riyadh 11451, Saudi Arabia
First published on 2nd January 2020
Abstract
Deoxygenation processes that exploit milder reaction conditions under H2-free atmospheres appear environmentally and economically effective for the production of green diesel. Herein, green diesel was produced by catalytic deoxygenation of chicken fat oil (CFO) over oxides of binary metal pairs (Ni–Mg, Ni–Mn, Ni–Cu, Ni–Ce) supported on multi-walled carbon nanotubes (MWCNTs). The presence of Mg and Mn with Ni afforded greater deoxygenation activity, with hydrocarbon yields of >75% and n-(C15 + C17) selectivity of >81%, indicating that decarboxylation/decarbonylation (deCOx) of CFO is favoured by the existence of high amount of lower strength strong acidic sites along with noticeable strongly basic sites. Based on a series of studies of different Mg and Mn dosages (5–20 wt%), the oxygen free-rich diesel-range hydrocarbons produced efficiently by Ni10–Mg15/MWCNT and Ni10–Mn5/MWCNT catalysts yielded >84% of hydrocarbons, with n-(C15 + C17) selectivity of >85%. The heating value of the green diesel obtained complied with the ultra-low sulphur diesel standard.
1. Introduction
Growing demand for fossil fuels, finite fossil fuel resources and related environmental issues have directed global attention towards the development of alternative fuels from renewable sources. Accordingly, many studies have been carried out to produce more efficient and inexpensive renewable fuels from various liquid biomass-derived feedstocks. Recently, biodiesel or fatty acid methyl esters (FAMEs) produced by transesterification processes from vegetable oils and animal fats have been commonly used as fuels in diesel engine transportation.1 Unfortunately, biodiesel is composed predominantly of highly oxygenated compounds that result in undesirable properties such as high viscosity, low oxidative stability, a high cloud point, high nitrogen oxide (NOx) emissions, and low energy density.2 In particular, oxygen-free hydrocarbon fuel known as green diesel is considered promising in this regard. Even though green diesel has a similar molecular structure to petroleum diesel but it has greater cetane number ranging from 85 to 99 (compared to 45 to 55 for petroleum diesel).3Deoxygenation processes are particularly attractive for producing green diesel and the operational costs are relatively lower than the current upgrading process used in existing petroleum refineries, the hydrodeoxygenation (HDO) process. The hydrodeoxygenation process involves direct conversion of fatty acids via removal of oxygenated species, retaining the number of carbon atoms, with H2O as a by-product under H2 atmosphere.4,5 Meanwhile, deoxygenation processes involve the removal of oxygenated species in the forms of CO, CO2 and H2O via decarbonylation and decarboxylation (deCOx) under H2-free atmosphere.6,7 The hydrocarbon products formed typically contain one less carbon atom (Cn−1) than the original fatty acid chain. The green diesel produced from deoxygenation exhibits better fuel characteristics – high heating value (HV), high cetane number (80–90), lower viscosity and high fuel stability; thus, it has been widely accepted by many research studies that green diesel is the most promising substitute for fossil-based diesel.8
Selecting the appropriate feedstocks for green diesel production is important for industrial practices. Usually, vegetable oil feedstock used for biofuel production consists of edible and non-edible oils. However, edible oils face problems related to the competition between food and fuel issues. Non-edible oils, such as Jatropha oil, rubber oil, Ceiba oil, karanja oil, Sterculia oil and castor oil are expensive, so they are unsuitable for biofuel production.9 Thus, the production of green diesel derived from animal fats has been widely explored. Commonly used animal fats include beef tallows, chicken fat, mutton fat and pork lard.10–13 Amongst them, chicken fat oil (CFO) offers a better alternative renewable source. Commonly, chicken is known as a staple food worldwide, and its production reaches about 107.1 million metric tons. 14 Fat contents in chicken poultry range from 10% to 12%.15 Thus, approximately 10.7–12.9 million metric tons of chicken fat is produced per year. CFO is composed of C16 and C18 fatty acids,16 so CFO is considered as ideal feedstock for diesel-range hydrocarbon (n-C15 and n-C17) production via deCOx pathways.
A study by Yang et al.17 discovered that solid catalysts such as noble metal, metal oxide and sulphided catalysts were highly efficient in promoting deoxygenation of fatty acid. Among those catalysts, noble metals such as Pd, Pt, and Rh were proven to be the most active metal promoters of deoxygenation activity and possessed greater affinity towards C–O bond cleavage via deCOx pathways.18 However, the high cost constraints made them unattractive. Metal sulphided catalysts such as NiMo and CoMo are commonly used in deoxygenation reactions. Unfortunately, sulphide-based catalysts cause sulphur leaching, which deactivates catalysts and contaminates products.19 As such, nonsulphur-based, inexpensive and highly active catalyst for deoxygenation should be developed. Interestingly, metal oxides are inexpensive and essentially free of sulphur. Metal oxides seem to be realistic deoxygenation catalysts for the future. Metal oxide catalysts, especially Ni-based, show activity comparable to noble metals in converting lipid-based feeds to liquid hydrocarbons. As discussed by Morgan et al.20 Ni on carbon support catalysts showed similar activity to that of Pd- and Pt-promoted catalysts at higher concentration, which suggested that Ni has good performance in replacing noble metals in deoxygenation. Oxides of other metals, such as Ce, W, Co, Fe, Cu, Mo, Zn, Mg and Ca, have also been used in deoxygenation under H2-free conditions.21–24 Interestingly, Ce and Cu offer better deoxygenation reaction selectivity in diesel-like hydrocarbon production. Aysu et al.23 studied the deoxygenation of jojoba oil over Ce-promoted catalysts and the results showed that the reaction occurred exclusively via deCOx, which yielded higher percentages of aliphatic compound. A similar case, with Cu-promoted catalysts studied by Loe et al.24 whereby the Cu-promoted catalyst was demonstrated to be active in removing the oxygen atoms from free-fatty-acid-derived oxygenates and yielded >90% of diesel-range hydrocarbons. Additionally, a basic promotion catalyst (MgO) also favoured the deCOx reaction. Tani et al.22 discovered that MgO-supported catalysts resulted in enhanced triglyceride cracking via decarboxylation, and the green diesel produced resembled conventional liquid fuel. Moreover, use of basic metal catalysts can suppress coke formation and offer greater catalyst stability.25 Parenthetically, no study has reported the use of Mn as catalyst in deoxygenation reactions. However, Mn was found to be active in the pyrolysis of sawdust and produced 48.5% of H2 gas.26
Instead of catalyst promoter, the catalyst support always plays a critical role in promoting the deoxygenation reaction. This is due to support being able to enhance active metal dispersion, simultaneously increasing the active sites for catalysis of the reaction.27 Carbon is a promising support, which can be attributed to the high specific area and the nature of carbon itself, being thermally stable, thereby minimising the sintering of the active metal during the deoxygenation reaction.28 Nanosized carbon supports, such as multi-walled carbon nanotubes (MWCNTs) have specific pore structures that offer better thermal stability than micron-size activated carbon supports, and the use of MWCNTs as catalyst support in the deoxygenation reaction has been recognised.29 As discussed by Asikin-Mijan et al.30 MWCNTs were used as catalyst supports in the deoxygenation of Jatropha curcas oil, resulting in high selectivity towards C15 + C17 via the deCOx pathway and producing >80% hydrocarbon yield. However, the catalyst still favoured greater coke formation (4–5 wt%) than other carbon supported catalysts (∼2 wt%).31 Thus, in order to improve coke resistancy of MWCNT, hence this study highlighted the modification of MWCNTs through the incorporation of a series of binary metal oxide pairs (Ni–Mg, Ni–Mn, Ni–Cu, Ni–Ce) for CFO deoxygenation under H2-free conditions. The effect of metal concentration, within the range of 5–20 wt% on reaction activity was further investigated, and the green diesel produced was subjected to an HV test.
2. Experimental
2.1 Materials and methods
Multi-walled carbon nanotubes with purity > 95% were purchased from US Research Nanomaterials, Inc. Nickel(II) nitrate hexahydrate (Ni(NO3)2·6H2O) with purity > 99%, magnesium(II) nitrate hexahydrate (Mg(NO3)2·6H2O) with purity > 99%, and manganese(II) acetate tetrahydrate (C4H6MnO4·4H2O) with purity > 98% were obtained from R&M Company. Copper(II) nitrate trihydrate (Cu(NO3)2·3H2O) with purity > 99% and cerium(III) nitrate hexahydrate (CeH12N3O15) with purity > 99% were procured from Merck and Acros, respectively. Phosphoric acid (H3PO4) with purity > 85% was purchased from J.T Baker. The liquid products for standard gas chromatography (GC) analysis, C8–C20 alkene and alkane standard solutions and the internal standard 1-bromohexane were purchased from Sigma Aldrich and used without further purification. For dilution, n-hexane (GC grade) with purity > 98% from Merck was used. The feedstock involved was CFO obtained from raw chicken fat waste from a local Serdang market in Malaysia. The chicken fat waste was heated at 120 °C for 3 h and filtered to remove any solid residue. The resultant samples are referred to as CFO. The CFO was further treated at 120 °C in an oven to ensure the water content was <0.5 wt%. Water content was measured by using the ASTM E203-08 method. Table 1 shows that the CFO was composed of triglycerides (TGs, 83%), free fatty acids (FFAs, 17%) with a moisture content of 0.3 wt%. According to the analysis, the fatty acid composition of CFO was mainly saturated C16 (palmitic) and unsaturated C18 (oleic) fatty acids.| Properties | Value |
|---|---|
| Moisture content (wt%) | 0.30 |
| Acid value (mg KOH per g) | 33.66 |
| FFA value (%) | 16.83 |
| Fatty acid composition of oil (%) | |
| Palmitic acid (C16:0) | 29.56 |
| Stearic acid (C18:0) | 9.45 |
| Oleic acid (C18:1) | 57.61 |
| Linoleic acid (C18:2) | 3.38 |
2.2 Catalyst synthesis
All catalysts were synthesised via a wet-impregnation method. Initially, 6 g of MWCNT support was chemically activated with 90 mL of phosphoric acid (H3PO4) with reflux heating at a temperature of 150 °C for 24 h. Then, the H3PO4 was removed using hot distilled water until the solution reached pH 7. The activated MWCNTs were then dried in an oven at 120 °C. The activated MWCNTs were then impregnated with 10 wt% of Ni(NO3)2·6H2O and 10 wt% of C4H6MnO4·4H2O under continuous stirring for 6 h at ambient temperature. The solid was dried in an oven at 120 °C and further calcined at 550 °C for 4 h under inert conditions and the catalyst denoted as Ni10–Mn10/MWCNT. The procedures above were repeated, replacing the Mn salt with Mg(NO3)2·6H2O, CeH12N3O15 and Cu(NO3)2·3H2O. The catalysts were denoted Ni10–Mg10/MWCNT, Ni10–Ce10/MWCNT and Ni10–Cu10/MWCNT, respectively. Furthermore, Ni10/MWCNT was prepared via a similar preparation route. In addition, the optimisation of metal dosage of the most effective metals (Mg, Mn) was performed by varying the metal content from 5 to 20 wt% with Ni remaining constant at 10 wt%. The catalysts were denoted Ni10–Mgn/MWCNT and Ni10–Mnn/MWCNT, where n = 5, 10, 15 and 20.2.3 Catalyst characterisation
Powder X-ray diffraction (XRD) analysis was performed to determine the dispersion state and chemical composition of the modified MWCNT catalysts before and after reaction. The XRD analysis was carried out using Shimadzu diffractometer, model XRD-6000. The acidity and basicity of all catalysts were measured using temperature programmed desorption with NH3 and CO2 as the probe molecule (TPD-NH3 and TPD-CO2). The analysis was carried out using a Thermo Finnigan TPD/R/O 1100 instrument equipped with a thermal conductivity detector (TCD). The catalyst (∼0.05 g) was pre-treated in N2 gas flow for 30 min at 250 °C and then with NH3 gas for 1 h at ambient temperature to allow adsorption of NH3 onto the surfaces. Then, the excess NH3 was flushed with N2 gas flow at 20 mL min−1. The desorption of NH3 from the acid sites of the catalyst was detected by TCD under He gas flow (30 mL min−1) from 50 to 900 °C and held for 30 min. The adsorption and desorption of CO2 was carried out in a similar way to the TPD-NH3 method. The field emission scanning electron microscopy-energy dispersive X-ray (FESEM-EDX) analysis was used to investigate the morphology and to determine the elemental composition of the catalysts. The FESEM images were recorded on a LEO 1455 VP electron microscope. The FESEM connected to EDX used a Rayny EDX-720 spectrometer for determination of the elemental composition of C, O, Ni, Mg, Mn, Cu and Ce. The TGA instrument (TGA 1000i, Instrument Specialists Inc, USA) was used to determine the extent of coke/carbon deposition on the spent catalyst under atmospheric conditions. The powder samples were heated in the range of 25 to 1000 °C at a heating rate of 10 °C min−1 under 40 mL min−1 air flow.2.4 Catalytic deoxygenation of CFO
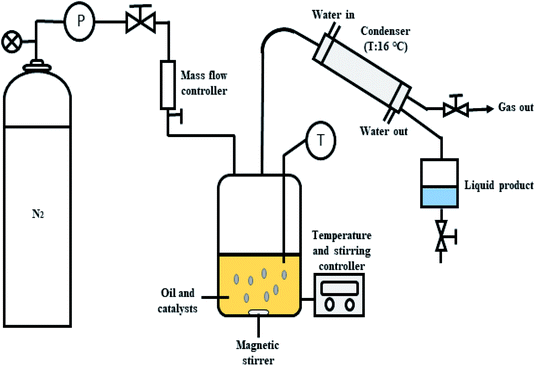
The deoxygenation of CFO was performed in a mechanically stirred 250 mL semi-batch reactor, as shown in Fig. 1. Initially, 10 g of CFO and 3 wt% of catalyst were added into the reactor. Before each reaction, the oxygen in the reactor produced by the heating process was removed by purging with N2 gas at flow rate of 20 mL min−1 with constant stirring of the reaction mixture. The temperature was increased to the desired temperature of 350 °C and the reaction maintained for 2 h under inert gas flow (N2, 50 mL min−1). The condensable liquid product was condensed using an external water-cooled circulator into a collection vessel. The liquid products were further weighed and analysed using total acid number (TAN) test, gas chromatography with flame ionisation detector (GC-FID) and gas chromatography-mass spectrometry (GC-MS). The gaseous products were collected in a gas bag 1 h before the reaction finished and the gases further analysed by GC-TCD. All the reactions were repeated three times and the results evaluated as the average of the three repetitions. Mass-balance analyses were conducted for all deoxygenation reactions. The solid catalysts were separated by mixing the liquid residue inside the reactor with hexane to determine the mass of the retained products (char and residue) after reaction. The hexane was removed via rotary evaporation and the dark viscous liquid identified as char + residue.2.5 Product analysis
The deoxygenated liquid products were identified using C8–C20 alkane and alkene standards. The liquid products were analysed quantitatively using GC (Agilent GC-14B equipped with an HP-5 capillary column, length 30 m × inner diameter 0.32 mm × film thickness 0.25 μm) operating at 300 °C. The liquid product was diluted with GC grade n-hexane prior to the yield analysis. 1-Bromohexane was used as internal standard. A 2 μL aliquot was injected into the GC column at an inlet temperature 250 °C and helium gas served as the carrier gas. The initial temperature of the oven was set at 40 °C and held for 6 min. Then, the oven temperature was ramped to 300 °C at a heating rate of 7 °C min−1. The TAN of the CFO and the liquid products were identified by following the standard procedure of AOAS Cd 3 d-63, which is referred to as the classical titration method eqn (1):
 | (1) |
The determination of hydrocarbon yield (X) on the catalyst performance were evaluated by GC-FID using eqn (2).30
 | (2) |
 | (3) |
Product distribution of CFO and deoxygenated liquid products were characterised qualitatively using GC-MS (Shimadzu model QP5050A) equipped with a non-polar DB-5HT column (30 m × 0.25 mm × I.D. μm) with splitless inlet. The samples were diluted with GC grade n-hexane of purity > 98%. The fraction peaks from the GC-MS spectra were identified using the National Institute of Standards and Testing (NIST) library. The major products identified by GC-MS (hydrocarbon fractions, carboxylic acids, alcohols, cyclic compounds and ketones) were compared with the probability match between 95 and 100%. The Fourier transform infrared spectrometry (FTIR) analysis was performed using a Nicolet 6700 spectrometer from Thermo Scientific. This analysis was used to identify the functional groups present in CFO and the liquid products. The spectrometer used a resolution of 4 cm−1 within the range 300–4000 cm−1. The gaseous products were analysed using a Shimadzu GC-8 A GC-TCD via an offline method with stainless steel adsorption column packed with molecular sieve. The higher HV of the liquid products were measured in a bomb calorimeter according to the ASTM D2015 standard method.
3. Results and discussion
3.1 Characterisation of the catalysts
The morphological structure and the elemental composition of the MWCNTs and MWCNT-supported metal oxide catalysts are shown in Fig. 2a–f and Table 2. The FESEM images showed that the MWCNTs exhibited a nanotube structure with diameter < 100 nm; meanwhile, the obtained MWCNT-supported metal catalysts were found to form compact aggregates, which might due to the dopant effect resulting in aggregation (Fig. 2b–f). This is consistent with previous findings; dopant species were reported assembled into aggregates on the MWCNTs when synthesised by a wet-impregnation method.32 It is noteworthy to observe that the nanotube structure of MWCNTs remained unchanged after introduction of the metal species. Notably, the NiO in Ni10/MWCNT displayed bulky dense aggregates (Fig. 2b); however, with further introduction of Mn, Cu, Ce and Mg the dense aggregates were no longer obvious (Fig. 2c–f). It is reasonable to state that the homogeneous morphology and the small size of metal particles on the MWCNT surface could be achieved by the introduction of the binary metal oxide system. The elemental composition showed that the carbon content was the highest (>75%) followed by oxygen (<19%). Thus, it is expected that the carbon-rich catalysts could act as effective barriers to sintering, providing excellent mechanical properties for the deoxygenation reaction, thereby improving catalyst stability.33 The high content of oxygen corresponds to the formation of the oxide phase. Overall, the metal species (Mg, Cu, Mn, Mg, Ni) were found in trace amounts (1.7–7.7%) in which the percentages were lower than the theoretical, which might due to the metal species being embedded within the MWCNTs and not fully dispersed on the MWCNT surface.34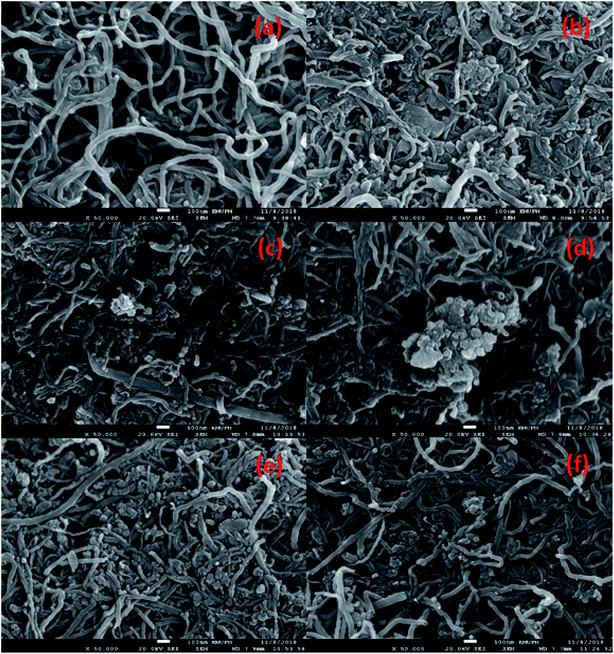 | ||
| Fig. 2 FESEM-EDX analysis for (a) MWCNT, (b) Ni10/MWCNT, (c) Ni10–Mg10/MWCNT, (d) Ni10–Mn10/MWCNT, (e) Ni10–Ce10/MWCNT and (f)Ni10–Cu10/MWCNT. | ||
| Catalysts | Elemental composition (%) | ||||||
|---|---|---|---|---|---|---|---|
| C | O | Ni | Mg | Mn | Ce | Cu | |
| MWCNT | 95.4 | 4.6 | — | — | — | — | — |
| Ni10/MWCNT | 91.14 | 7.19 | 1.67 | — | — | — | — |
| Ni10–Mg10/MWCNT | 75.26 | 19.73 | 2.64 | 2.37 | — | — | — |
| Ni10–Mn10/MWCNT | 84.90 | 9.53 | 2.56 | — | 3.01 | — | — |
| Ni10–Ce10/MWCNT | 83.90 | 11.66 | 2.65 | — | — | 1.79 | — |
| Ni10–Cu10/MWCNT | 79.84 | 9.39 | 7.72 | — | — | — | 3.04 |
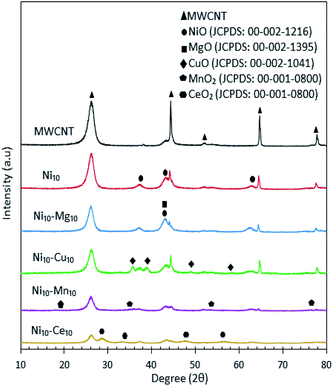
The XRD patterns for all catalysts are shown in Fig. 3, which showed that the MWCNT exhibits diffraction peaks at 2θ: 26.22°, 44.31°, 52.18°, 64.67° and 77.74°, which are assigned to the MWCNTs planes of (002), (100), (110), (004) and (006), respectively.30 Based on the XRD analysis, all the metal species were present in separate oxide phases. All Ni-containing catalysts exhibited XRD peaks corresponding to the cubic structure of NiO at 2θ: 37.05°, 43.14° and 62.89° (JCPDS file no.: 00-002-1216). The Ni10–Mg10/MWCNT catalysts exhibited a diffraction peak at 2θ: 42.92° (JCPDS file no.: 00-002-1395), which is assigned to the hexagonal structure of MgO. The XRD diffraction of Ni10–Cu10/MWCNT exhibited the monoclinic structure of CuO phase at 2θ: 35.71°, 38.98°, 48.93° and 58.17° (JCPDS file no.: 00-002-1041). In the case of Ni10–Mn10/MWCNT, the cubic structure of MnO was evident from the peaks at 2θ: 18.16°, 35.13°, 53.52° and 76.17° (JCPDS file no.: 00-001-0800). Furthermore, Ni10–Ce10/MWCNT displayed XRD diffraction peaks at 2θ: 28.74°, 33.27°, 47.55° and 56.36° (JCPDS file no.: 00-001-0800), corresponding to the cubic structure of CeO2. The crystalline peaks for MWCNT reduced remarkably after incorporation with the active metal species, attributed to the intercalation of metal oxides on the MWCNTs and thus promoting a higher dispersion of MWCNTs. The mean crystallite size of catalyst was determined by the Debye–Scherrer equation based on the highest intense peak centred at 2θ: 26.22°, and the results are tabulated in Table 3. The crystallite sizes follow the order Ni10–Ce10/MWCNT < Ni10–Mg10/MWCNT < Ni10/MWCNT < MWCNT < Ni10–Cu10/MWCNT < Ni10–Mn10/MWCNT. The crystallite size of Ni10–Ce10/MWCNT was the smallest (∼18 nm), suggesting a strong interaction between Ni and Ce species enhancing the MWCNT dispersion.35
| Catalysts | XRDa | TPD-NH3b | TPD-CO2c | ||
|---|---|---|---|---|---|
| Crystallite sizea (nm) | Temperature (°C) | Amount of NH3 absorbed (μmol g−1) | Temperature (°C) | Amount of CO2 absorbed (μmol g−1) | |
| a Measured by using Scherrer equation from XRD data.b Determined by TPD-NH3 analysis.c Determined by TPD-CO2 analysis. | |||||
| MWCNT | 64.99 | — | — | — | — |
| Ni10/MWCNT | 37.89 | 512 | 1822 | 506 | 2263 |
| Ni10–Mg10/MWCNT | 28.47 | 337, 620 | 775, 2026 | 337, 637 | 421, 782 |
| Ni10–Mn10/MWCNT | 75.83 | 535 | 2590 | 540 | 904 |
| Ni10–Ce10/MWCNT | 18.98 | 492 | 2090 | 491 | 804 |
| Ni10–Cu10/MWCNT | 75.75 | 643 | 2242 | 632 | 700 |
Fig. S1† shows the TGA profile for the thermal behaviour of MWCNTs and MWCNT-supported metal oxide catalysts. The MWCNT support was thermally stable up to 500 °C, while Ni10–Mn10/MWCNT, Ni10–Cu10/MWCNT, Ni10–Mg10/MWCNT and Ni10–Ce10/MWCNT showed weight loss changes at 400 °C. The weight loss within the temperature the range 400–650 °C is typically due to the oxidation of MWCNTs.36 The reduction in thermal stability of MWCNTs by incorporation of binary metal oxide promoters is due to the presence of structural imperfections (vacancies and dislocations).37 The Ni10–Mg10/MWCNT showed additional weight losses at a lower temperature (<300 °C), which is attributed to the vaporisation of physically adsorbed water.38 Although the Ni10–Mg10/MWCNT had been thermally calcined at 500 °C, the water weight loss stage still remained, suggesting that MgO is naturally hygroscopic in nature and tends to absorb moisture forming Mg(OH)2.39 Overall, Ni10–Mn10/MWCNT, Ni10–Cu10/MWCNT and Ni10–Ce10/MWCNT showed higher stability (decomposing at temperatures >400 °C), leading to a greater reaction stability during deoxygenation of CFO at 350 °C.
Acid sites typically provide active sites for promoting C–C bond cleavage via cracking reactions; however, catalysts with excessively acidic sites would initiate coke formation during deoxygenation and deactivation of the catalyst. Interestingly, incorporation of basic sites with acid sites have been found to be successful in suppressing coke formation, while simultaneously retaining deoxygenation activity. Olusola et al.40 reported that the presence of basic sites is necessary for enhancing C–O bond cleavage through decarboxylation. In this regard, it suggests that the acidic and basic sites play major roles in enhancing the deoxygenation reaction. Fig. S2a† and Table 3 show the acidity of the synthesised MWCNTs and MWCNT-supported metal oxide catalysts. Based on the TPD-NH3 profile obtained, no acidity was detected on the MWCNTs, which likely corresponds to the amphoteric properties of carbon in MWCNTs.30 Nevertheless, large desorption peaks were observed for MWCNT-supported metal oxide catalysts at temperatures within the range 300–910 °C, indicating the presence of medium (300–500 °C) and strong acid sites (>500 °C). The total acid densities are ranked in the increasing order MWCNT < Ni10/MWCNT < Ni10–Ce10/MWCNT < Ni10–Cu10/MWCNT < Ni10–Mn10/MWCNT < Ni10–Mg10/MWCNT. The high acidity produced by MWCNT-supported metal oxide catalysts affirmed the role of metal species in enhancing the acidic sites of MWCNTs. This also in agreement with Wan et al.41 who proposed that the acidity of the acid sites is increased remarkably with the addition of active metal species. The basicity profile and its strength were analysed using TPD-CO2, and the results are displayed in Fig. S2b† and Table 3. All catalysts exhibited similar desorption peaks at temperatures of 100–500 °C and >500 °C, which indicates the presence of weak, medium and strong basic sites. The trend of the basicity density is arranged as follows: MWCNT < Ni10–Cu10/MWCNT < Ni10–Ce10/MWCNT < Ni10–Mn10/MWCNT < Ni10–Mg10/MWCNT < Ni10/MWCNT. It is worthy of mention that all MWCNT-supported metal oxide catalysts exhibited strong basic sites with the exception of Ni10–Ce10/MWCNT. This finding was in agreement with Wang et al.42 who suggested that addition of Ce species results in minor effects in changing the basic sites. Based on the TPD-NH3 and TPD-CO2 findings, Ni10–Cu10/MWCNT showed highest strength of acid and basic sites, respectively. This can be attributed to the synergistic effect of the acid–base interaction between CuO and NiO on the MWCNT surface.30
3.2 Catalytic deoxygenation of CFO
Fig. 4a and b shows the hydrocarbon yield from catalytic deoxygenation of CFO over MWCNTs and MWCNT-supported metal oxide catalysts at 350 °C for 2 h reaction time using 3 wt% catalyst loading under N2 flow. As depicted in Fig. 4a, the blank reaction showed the lowest deoxygenation activity, confirming the occurrence of a catalytic reaction. MWCNT-supported metal oxides afforded greater hydrocarbon n-(C8–C20) yield than did MWCNTs in the deoxygenation reaction. This confirmed the necessity of the presence of the active metal in improving the deoxygenation activity for production of fuel-like hydrocarbons. The yield of hydrocarbons increased in the order blank < MWCNT < Ni10/MWCNT < Ni10–Mn10/MWCNT < Ni10–Cu10/MWCNT < Ni10–Mg10/MWCNT < Ni10–Ce10/MWCNT. Maximum hydrocarbon yield (∼84%) was observed over Ni10–Ce10/MWCNT, suggesting that the presence of cerium oxide contributed great catalytic activity due to the high dispersion of MWCNTs.43 Obviously, binary metal-oxide-promoted catalysts rendered higher formation of n-(C8–C20) than did Ni10/MWCNT, which is attributable to the remarkable increase in acidic sites (Table 3).44 CFO is mainly composed of C16 (palmitic) and C18 (stearic, oleic and linoleic) fatty acids (Table 1). Thus, deoxygenation of CFO via removal of oxygenated species (CO2, CO) via the deCOx reaction will lead to the formation of C15 and C17 hydrocarbon fractions.45,46 As demonstrated in Fig. 4b, n-C15 and n-C17 were obtained as the main hydrocarbon products from catalysed CFO deoxygenation. The n-(C15 + C17) selectivity increased in the order blank < MWCNT ∼ Ni10–Cu10/MWCNT < Ni10–Ce10/MWCNT < Ni10–Mn10/MWCNT < Ni10–Mg10/MWCNT < Ni10/MWCNT. As expected, the blank reaction resulted in lower n-(C15 + C17) selectivity (48%) and higher light-hydrocarbon-fraction n-(C9–C14) formation (∼42%). By contrast, metal oxide-supported MWCNT selectively deoxygenised the CFO to n-(C15 + C17). This finding suggested that C–O bond cleavage occurred via a deCOx reaction.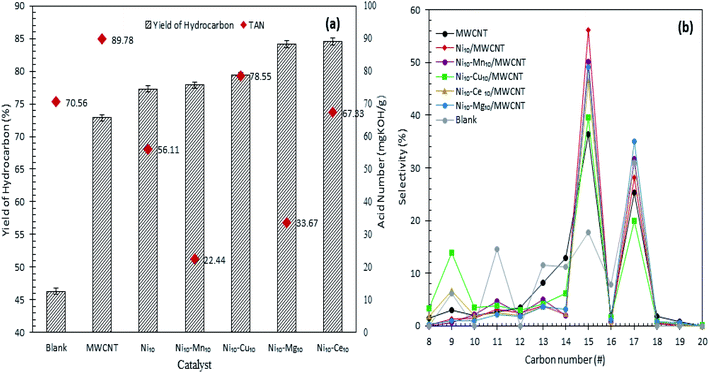 | ||
| Fig. 4 (a) Yield of hydrocarbon and (b) product selectivity of deoxygenized liquid product from catalysed deoxygenation. Reaction condition: T = 350 °C, 2 h reaction time, 3 wt% of catalyst loading. | ||
Interestingly, Ni10/MWCNT is more favourable towards deCOx reaction and produced the highest n-(C15 + C17) (84%) but lower hydrocarbon yield (77%), implying that the deCOx reaction is favoured by basic-site-rich catalysts (2263 μmol g−1). The low hydrocarbon yield indicated that NiO plays a critical role in increasing C–C bond cleavage via cracking and increasing the amount of volatile product, so proving that Ni10/MWCNT facilitated simultaneous cracking-deCOx reactions. It can be seen that Ni10–Mg10/MWCNT and Ni10–Mn10/MWCNT were also effective in the deCOx reaction, rendering high selectivity towards n-(C15 + C17) (81–83%). Similarly, these catalysts were also effective in converting the acidic compounds to non-acidic compounds, showing the lowest TAN value of 22–33 mg KOH per g (Fig. 4a) and outperformed Ni10–Ce10/MWCNT (TAN = 67 mg KOH per g, 77% n-(C15 + C17) selectivity). Indeed, the efficiency of the Ni10–Mg10/MWCNT and Ni10–Mn10/MWCNT catalysts in the deCOx reaction can be explained in terms of high basic (Tmax = 540–637 °C) and acid (Tmax = 535–620 °C) strengths.33,47 Similarly, high acidic and basic strengths were observed for Ni10–Cu10/MWCNT but the n-(C15 + C17) was lower (59%) and the percentage of light hydrocarbon fractions (C8, C9, C10, C11–C14) was highest. This can be inferred from the existence of strong acidic sites (Tmax = 643 °C) simultaneously rendering greater occurrence of C–C bond cleavage.45 Although CFO has higher C18 fatty acid content (>50%) the liquid product is rich in n-C15 hydrocarbons (deoxygenated C16 fatty acids), which is implies by the cracking of deoxygenation products or C18 fatty acids.31
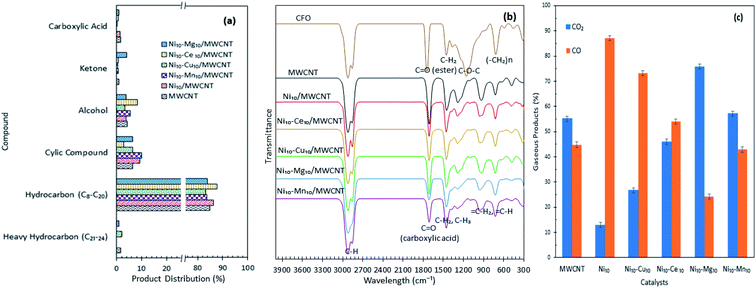
Product distribution of the deoxygenated liquid product are displayed in Fig. 5a. Based on the GC-MS result, all the catalysts showed higher n-(C8–C20) hydrocarbon distribution (>85%) and with almost identical hydrocarbon percentages, suggesting that MWCNT-supported metal oxide catalysts are highly promising for promoting the deoxygenation activity and converting the CFO to hydrocarbon-like structures. The Ni10–Ce10/MWCNT catalyst showed the highest n-(C8–C20) hydrocarbon distribution (88%), which is in line with the GC-FID result. Furthermore, the deoxygenated liquid product also showed the presence of non-oxygenated compounds (heavy C > 20 and cyclic hydrocarbons) (1–10%) and oxygenated intermediate compounds (ketones, alcohols, carboxylic acids) (0.4–8%) (Table S1†). Notably, cyclic compounds and alcohols were pronounced in all liquid products (3–10%). The result also revealed that Ni10–Mg10/MWCNT favoured ketonisation side reactions and yielded the highest formation of ketone compounds (4%). This corresponds to the basicity of MgO itself, which prompted the occurrence of ketonisation forming coupling products.48 The CFO and deoxygenated liquid products were further analysed by FTIR. The results are displayed in Fig. 5b. The FTIR spectra of CFO showed the main absorption bands at 2917 cm−1 and 2850 cm−1 (–CH stretching), 1741 cm−1 (–C![[double bond, length as m-dash]](https://www.rsc.org/images/entities/char_e001.gif) O ester stretching), 1455 cm−1 (–CH2 bending), 1148 cm−1 (C–O–C stretching) and 703 cm−1 (–(CH)n– bending). The liquid product rendered primarily alkane and alkene functional groups with absorption peaks at 2911 cm−1 and 2827 cm−1 (–CH stretching), 1458 cm−1 (–CH2 bending), 1281 cm−1 (–CH3 bending), 922 cm−1 (
O ester stretching), 1455 cm−1 (–CH2 bending), 1148 cm−1 (C–O–C stretching) and 703 cm−1 (–(CH)n– bending). The liquid product rendered primarily alkane and alkene functional groups with absorption peaks at 2911 cm−1 and 2827 cm−1 (–CH stretching), 1458 cm−1 (–CH2 bending), 1281 cm−1 (–CH3 bending), 922 cm−1 (![[double bond, length as m-dash]](https://www.rsc.org/images/entities/char_e001.gif) CH2 bending) and 719 cm−1 (–(CH)n− bending). It was notable that there was a significant shifting of the C
CH2 bending) and 719 cm−1 (–(CH)n− bending). It was notable that there was a significant shifting of the C![[double bond, length as m-dash]](https://www.rsc.org/images/entities/char_e001.gif) O stretching band from 1741 cm−1 (ester) in CFO to 1660 cm−1 (carboxylic acid) in the liquid products, indicating the formation of acid intermediates from esters via triglyceride cracking. In addition, the reduction in intensities of the C
O stretching band from 1741 cm−1 (ester) in CFO to 1660 cm−1 (carboxylic acid) in the liquid products, indicating the formation of acid intermediates from esters via triglyceride cracking. In addition, the reduction in intensities of the C![[double bond, length as m-dash]](https://www.rsc.org/images/entities/char_e001.gif) O peak were used to determine the efficiency of deoxygenation. The reductions in the peak intensities were comparable with the reduction in oxygen content in the product.49 By comparing the deoxygenised liquid product, Ni10–Mg10/MWCNT and Ni10–Mn10/MWCNT showed significant decreases in C
O peak were used to determine the efficiency of deoxygenation. The reductions in the peak intensities were comparable with the reduction in oxygen content in the product.49 By comparing the deoxygenised liquid product, Ni10–Mg10/MWCNT and Ni10–Mn10/MWCNT showed significant decreases in C![[double bond, length as m-dash]](https://www.rsc.org/images/entities/char_e001.gif) O intensity, suggesting higher deoxygenation activity. The absence of the C–O–C band at 1148 cm−1 indicated that a triglyceride ester bond was eliminated possibly to produce free fatty acids.
O intensity, suggesting higher deoxygenation activity. The absence of the C–O–C band at 1148 cm−1 indicated that a triglyceride ester bond was eliminated possibly to produce free fatty acids.
The gaseous products of the reaction were further analysed through GC-TCD (Fig. 5c), considering that the deCOx reaction favoured the removal of C–O-containing species in the forms of CO, CO2 and H2O. The results revealed that the gaseous products were composed mainly of CO2 and CO, which confirmed the removal of C–O-containing species via decarboxylation and decarbonylation pathways. Aside from these pathways, side reactions, such as water gas shift (WGS) and Boudouard reactions, may occur. WGS reaction is reversible, that is, CO and H2O are converted into CO2 and H2 as expressed in eqn (4), while Boudouard reaction is a reaction between C and CO2 to produce CO as presented in eqn (5):
| CO(g) + H2O(g) ⇌ CO2(g) + H2(g), | (4) |
| CO2 + C ⇌ 2CO. | (5) |
Ni10/MWCNT exhibited the highest CO gaseous (87%), indicating that decarbonylation is the predominantly involved route.50 Ni edges pose greater C affinity and are susceptible to the Boudouard reaction.51 Thus, a catalyst containing Ni may partially undergo a Boudouard reaction to form CO. Notably, the gaseous product from Ni10–Mg10/MWCNT-catalysed deoxygenation contained the highest amount of CO2 species. This result suggested that numerous basic sites present in the Ni10–Mg10/MWCNT catalyst can lead to CO2 formation via decarboxylation.22 In Table 3 (TPD-CO2), the trend of the basic sites exhibited the following order: Ni10–Mg10/MWCNT > Ni10–Mn10/MWCNT > Ni10–Ce10/MWCNT > Ni10–Cu10/MWCNT. For instance, the CO2 production followed the same trend. This finding implies that more basic sites promote decarboxylation, thus producing high amounts of CO2.
3.3 Effect of Mg and Mn dosage on deoxygenation of CFO
Based on the screening of MWCNT-supported metal oxide catalysts in the deoxygenation reaction, it was found that incorporation of Mg and Mn on Ni/MWCNTs resulted in higher deoxygenation activity with product selectivity towards n-(C15 + C17) hydrocarbons. Hence, the effects of Mg and Mn promotion on CFO deoxygenation were further studied by varying the metal dosage within the range of 5 to 20 wt%. Based on XRD analysis, the Ni10–Mgn/MWCNT and Ni10–Mgn/MWCNT (n = 5, 10, 15, 20) exhibited the presence of cubic NiO, hexagonal MgO, and cubic MnO structures (Fig. S3†). The peak intensity for MWCNTs decreased with the increased of dosage of MgO and MnO species, which is due to the intercalation of metal oxides on the MWCNTs, hence promoting higher dispersion of MWCNTs. In worthy of mention that the NiO peak intensified with the incorporation of a high dosage of Mg and reduced with the addition of Mn-rich species, indicating that at high Mn loading, the NiO was present in small particles. NiO agglomeration took place at bulk at high Mg loading.52 As expected, the crystallite size of NiO determined at 2θ: 62.89° in Ni–Mn/MWCNT revealed a decrease in size from 17 nm to 10 nm with the increase in Mn dosage (Table 4). Meanwhile, NiO crystallite size increased to >78% with the addition of Mg species within the range of 5 to 20 wt%.| Catalysts | XRDa | TPD-NH3b | TPD-CO2c | ||
|---|---|---|---|---|---|
| Acid sites (μmol g−1) | Basic sites (μmol g−1) | ||||
| Crystallite sizea of NiO (nm) | Weak + medium, 50–500 °C | Strong, >500 °C | Weak + medium, 50–500 °C | Strong, >500 °C | |
| a Measured by using Scherrer equation from XRD data of NiO peak.b Determined by TPD-NH3 analysis.c Determined by TPD-CO2 analysis. | |||||
| Ni10–Mg5/MWCNT | 13.68 | — | 3013 | 473 | 1387 |
| Ni10–Mg10/MWCNT | 15.38 | 775 | 2026 | 421 | 782 |
| Ni10–Mg15/MWCNT | 17.56 | 436 | 2142 | 957 | 1205 |
| Ni10–Mg20/MWCNT | 17.63 | 1815 | 2909 | 1199 | 876 |
| Ni10–Mn5/MWCNT | 17.59 | — | 3121 | 242 | 2683 |
| Ni10–Mn10/MWCNT | 12.32 | — | 2590 | — | 904 |
| Ni10–Mn15/MWCNT | 10.28 | — | 1845 | — | 1170 |
| Ni10–Mn20/MWCNT | 10.27 | — | 515 | — | 1590 |
The acidity sites changed remarkably with different metal dosage (Fig. S4a, b† and Table 4). All the Ni–Mg-containing catalysts showed weak + medium and strong acid strength, whereas Ni–Mn containing catalysts exhibited predominantly strongly acid sites. As the amount of Mg increased, weak + medium acidic sites increased remarkably to a maximum of 1815 μmol g−1, attributed to basic metal ion (Mg2+) that lowered the acid strength of the catalyst.53 Accordingly, the acidic strength of Ni–Mgn/MWCNT reduced upon increased Mg species. Similarly, Ni–Mn-containing catalysts showed a reduction in density of strong acidic sites with the increase in Mn dosage. The basicity of Ni–Mg- and Ni–Mn-containing catalysts are displayed in Fig. S4c, d† and Table 4. All the Ni–Mg-containing catalysts exhibited weak + medium and strong basic sites; meanwhile, the majority of Ni–Mn-containing catalysts exhibited predominantly strongly basic sites. The weakly basic sites in Ni–Mg-containing catalysts indicated the presence of hydroxyl groups on the surface, whereas medium basic sites correlated with the existence of Mg2+ and O2−. The high basic strength found in all catalysts is due to the isolated O2− species.54 Overall, 5 wt% Mg and Mn yielded the highest amount of strongly acidic and basic sites. Thus, these catalysts facilitated cracking instead of the deCOx pathway and increased the formation of light hydrocarbons.55
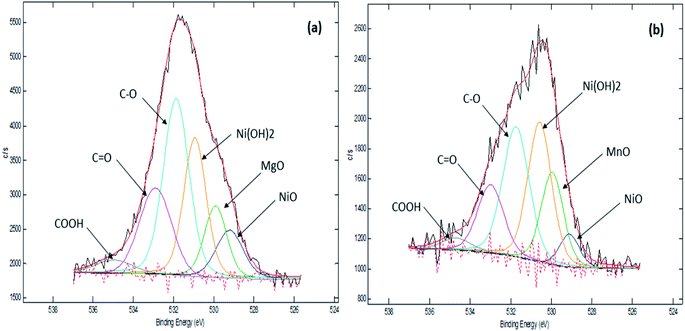
Our previous TPD-CO2 analysis (Table 4) showed that Ni10–Mg15/MWCNT and Ni10–Mn5/MWCNT produced a high total amount of basic sites with 2162 and 2925 μmol g−1, respectively. Other studies have also indicated that basic sites play a major role in promoting decarboxylation by retarding coke formation via a decrease in the deactivation rate of acidic catalysts.56 Therefore, the XPS characteristics of Ni10–Mg15/MWCNT and Ni10–Mn5/MWCNT were examined in our study (Fig. 6). As expected, all the catalysts recorded binding energies (BE) of 284.67, 285.43 and 288.58 eV, which are characteristics of a C species linked to C–C, C–O and C![[double bond, length as m-dash]](https://www.rsc.org/images/entities/char_e001.gif) O. The XPS results proved that the surface of the metal-modified MWCNTs is grafted with oxygen-containing groups.57 Indeed, Ni10–Mg15/MWCNT and Ni10–Mn5/MWCNT had nickel as Ni2+ (529.11 eV, 529.22 eV), magnesium as Mg2+ (BE: 529.22 eV) and manganese as Mn2+ at BEs of 529.95 eV, respectively. These results were attributed to the existence of NiO, Ni(OH)2, MgO and MnO phases, and these findings revealed that an active metal exists in oxide and hydroxide forms.58 Overall, the corresponding BE of Ni2+ in all binary metal oxide-supported MWCNT catalyst shifts toward a lower energy than that of the corresponding NiO bulk.59 A shift in the BE of Ni2+ towards lower energies indicates that the metal–support interaction between Ni and MWCNT is strong. A weak metal–support interaction promotes the sintering of Ni and can contribute negatively to the active surface area characteristic under long-term deoxygenation.60 This finding suggested that incorporating the Mg and Mn promoters into Ni/MWCNT strongly improves the stability of catalysts during deoxygenation and favours C–O bond cleavage.
O. The XPS results proved that the surface of the metal-modified MWCNTs is grafted with oxygen-containing groups.57 Indeed, Ni10–Mg15/MWCNT and Ni10–Mn5/MWCNT had nickel as Ni2+ (529.11 eV, 529.22 eV), magnesium as Mg2+ (BE: 529.22 eV) and manganese as Mn2+ at BEs of 529.95 eV, respectively. These results were attributed to the existence of NiO, Ni(OH)2, MgO and MnO phases, and these findings revealed that an active metal exists in oxide and hydroxide forms.58 Overall, the corresponding BE of Ni2+ in all binary metal oxide-supported MWCNT catalyst shifts toward a lower energy than that of the corresponding NiO bulk.59 A shift in the BE of Ni2+ towards lower energies indicates that the metal–support interaction between Ni and MWCNT is strong. A weak metal–support interaction promotes the sintering of Ni and can contribute negatively to the active surface area characteristic under long-term deoxygenation.60 This finding suggested that incorporating the Mg and Mn promoters into Ni/MWCNT strongly improves the stability of catalysts during deoxygenation and favours C–O bond cleavage.
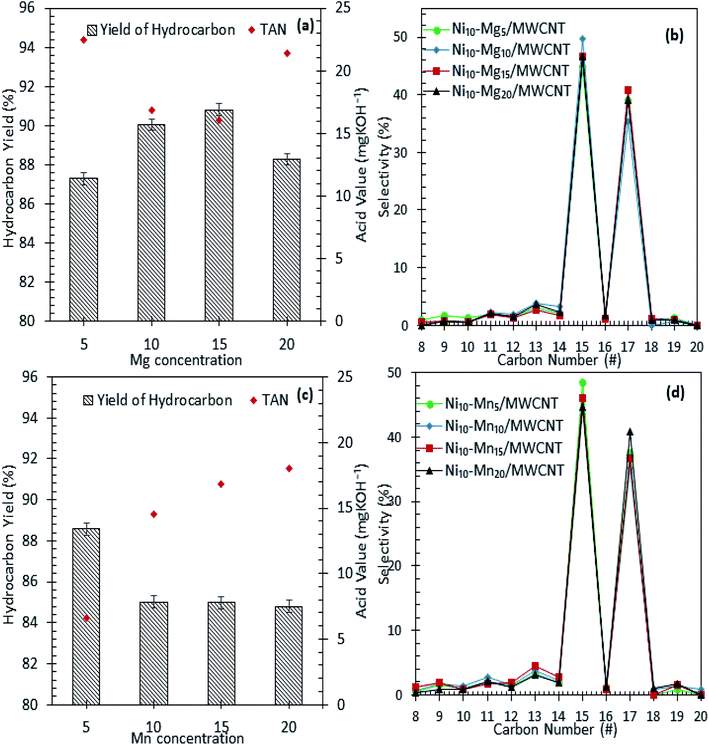
The results of the deoxygenation activity with different dosages of Mg and Mn on Ni/MWCNT were studied catalytically under the reaction conditions of 350 °C, 2 h and 3 wt% catalyst loading under inert conditions. The results are shown in Fig. 7a–d. It can be observed that the hydrocarbon yield over Ni–Mg-promoted catalysts showed a volcano-shaped curve with respect to the increase in Mg dosage (Fig. 7a). This result indicates that the hydrocarbon fraction is favoured by Mg-species-rich catalysts, yet an excess of Mg species dosage (20 wt%) reduces the hydrocarbon yield, suggesting an increase in C–C bond cleavage of the deoxygenated product via cracking.61 The maximum hydrocarbon yield (91%) was obtained by Ni10–Mg15/MWCNT. This result contrasts with the Ni–Mn finding, in which lowest dosage of Mn was shown to result in better deoxygenation performance with a hydrocarbon yield of ∼89% (Fig. 7c). Overall, Ni10–Mg15/MWCNT rendered more efficient deoxygenation activity than Ni10–Mn5/MWCNT. A similar trend was observed for n-(C15 + C17) selectivity. The highest n-(C15 + C17) selectivity was reported for Ni10–Mg15/MWCNT, with a selectivity of 87% (Fig. 7b); meanwhile, Ni10–Mn5/MWCNT yielded 85% of n-(C15 + C17) (Fig. 7d). It appeared that the catalyst containing 15 wt% Mg species better promoted the deCOx reaction, while it was suppressed by catalysts containing 5 wt% Mn. By comparing the acidity trend of Ni10–Mg15/MWCNT and Ni10–Mn5/MWCNT catalysts, it can be inferred that the deCOx reaction is more favoured by catalysts rich in weak + medium acid sites and by the nature of active Mg itself, which induces the decarboxylation pathway.22 Parenthetically, the TAN analysis also proved that Ni10–Mg15/MWCNT rendered the lowest TAN value (16 mgKOH/g). The chemical composition of the liquid product is shown in Fig. 8a and b. It can be seen that the main products were hydrocarbon fractions, cyclic compounds, alcohols and ketones. As expected, Ni10–Mg15/MWCNT resulted in the highest C8–C20 hydrocarbon chain (saturated and unsaturated) content (85%). Interestingly, noticeable ketone compounds were detected for Ni10–Mg20/MWCNT and Ni10–Mn5/MWCNT, which simultaneously confirmed that ketonisation promotion was facilitated by greater catalyst basicity.
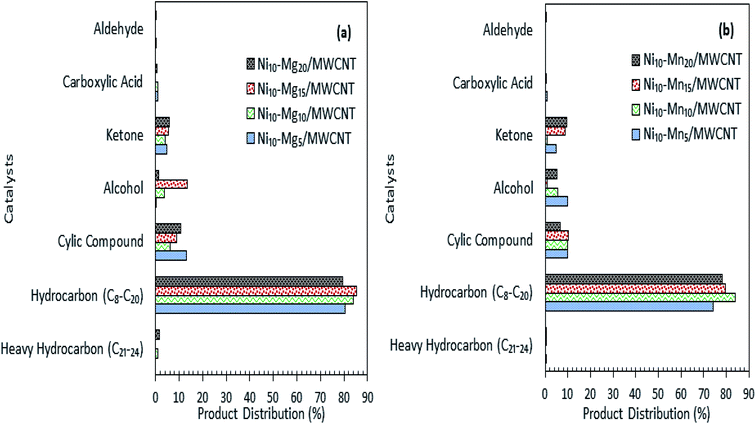 | ||
| Fig. 8 Product distribution of deoxygenated liquid product (a) Ni–Mgn/MWCNT (b) Ni–Mnn/MWCNT with different Mg and Mn concentration (n = 5–20 wt%). | ||
3.4 Mass-balance profile for catalytic deoxygenation of CFO
The mass-balance profile for catalytic deoxygenation of CFO over a series of Mg and Mn dosages on Ni/MWCNT were determined and results are tabulated in Table 5. Theoretically, CFO will catalytically deoxygenise via the deCOx route to produce liquid product along with emission of CO2 and CO gases with formation of water as by-product. Based on the results, the experimental mass fraction of liquid product produce from all MWNCT-supported catalysts were within the range of 12–37 wt%. Ni10–Mg15/MWCNT and Ni10–Mn5/MWCNT yielded the highest liquid mass fractions, of 37 and 22 wt%, respectively. Regarding the mass fraction of liquid product, the experimental result deviated from the theoretical value, suggesting the formation of undesired char and residue (by-product) produced via extensive cracking activity.62 Indeed, all deoxygenations showed large amount of gaseous mass fractions (33–55 wt%), which is comparable to the lower liquid product mass fraction. It is worthy of mention that all the catalysed deoxygenation reactions formed negligible amounts of water (<4 wt%). Overall, the mass-balance profile proposed that the most effective and selective catalysts for the deoxygenation of CFO were Ni10–Mg15 and Ni10–Mn5, which is in agreement with the above discussion. HV indicates the energy present in a fuel and defines the efficiency of the fuel. Fig. 9 shows the HV of all the green diesels produced by catalysed deoxygenation of CFO over Ni10–Mn5/MWCNT and Ni10–Mg15/MWCNT, where the value (41.65–41.98 MJ kg−1) is close to ultra-low sulphur diesel (ULSD) specifications (42.5 MJ kg−1). Even though the green diesel exhibited lower HV than the standard ULSD, green diesel is a greener biofuel as it produced from products of triglyceride-based biomass and a former study discovered that the green diesel obtained shows greater energy efficiency with lower CO2 emissions.8 Besides, the product is known to be environmentally friendly and has lower impacts on environment during use than diesel. Thus, the green diesel obtained can be used in diesel engines and is comparable with the ULSD standard.| Theoretical deCOx: CFO → liquid (oil) + 3 mol CO2/CO (g) + 3 mol H2O (aq) + by product | (6) | ||||||||
|---|---|---|---|---|---|---|---|---|---|
| Reactiona | Feedstock (g) | Liq-productb | Gasc | Waterd | Char + residuee | ||||
| (g) | (wt%) | (g) | (wt%) | (g) | (wt%) | (g) | (wt%) | ||
| a Deoxygenation condition: reaction temperature of 350 °C, 2 h reaction time, 3 wt% of catalyst, under N2 environment with stirring at 400 ppm.b Mass fraction for liq-product = [(mass of liq-product/mass of feedstock) × 100].c Material fraction for gas = [(mass of feedstock − mass of liq-product − mass of (char + residue) − mass of water)/mass of feedstock × 100].d Material fraction for water = [(mass of water/mass of feedstock) × 100].e Material fraction for (char + residue) = [(mass of (char + residue)/mass of feedstock) × 100]. | |||||||||
| Theoretical data (deCOx) | 10.00 | 6.89 | 68.90 | 2.49 | 24.90 | 0.62 | 6.20 | — | — |
| Ni10–Mg5 | 10.00 | 1.51 | 15.10 | 5.06 | 50.6 | 0.04 | 0.40 | 3.39 | 33.90 |
| Ni10–Mg10 | 10.01 | 1.51 | 15.08 | 4.55 | 45.45 | 0.16 | 1.60 | 3.79 | 37.86 |
| Ni10–Mg15 | 10.05 | 3.72 | 37.01 | 4.45 | 44.28 | 0.01 | 0.10 | 1.87 | 18.61 |
| Ni10–Mg20 | 10.02 | 2.08 | 20.76 | 3.78 | 37.72 | 0.32 | 3.19 | 3.84 | 38.32 |
| Ni10–Mn5 | 10.03 | 2.22 | 22.13 | 5.54 | 55.23 | 0.03 | 0.30 | 2.24 | 22.33 |
| Ni10–Mn10 | 10.01 | 1.65 | 16.48 | 3.84 | 38.36 | 0.07 | 0.70 | 4.45 | 44.46 |
| Ni10–Mn15 | 10.01 | 1.10 | 10.99 | 5.09 | 50.85 | 0.05 | 0.50 | 3.77 | 37.66 |
| Ni10–Mn20 | 10.05 | 1.24 | 12.34 | 3.35 | 33.33 | 0.04 | 0.40 | 5.42 | 53.93 |
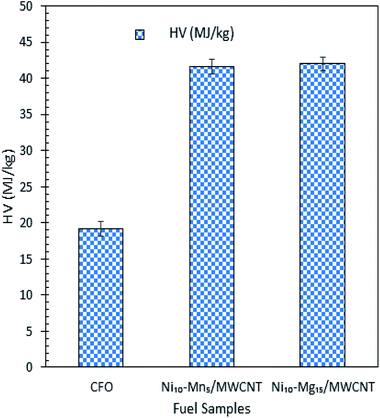 | ||
| Fig. 9 HV test for CFO and green diesel obtained from CFO deoxygenation reaction over Ni10–Mg15/MWCNT and Ni10–Mn5/MWCNT catalysts. | ||
3.5 Proposed reaction scheme for catalytic deoxygenation of CFO to diesel-range hydrocarbons over Ni10–Mn5/MWCNT and Ni10–Mg15/MWCNT catalysts
Table 1 shows that CFO is predominantly composed of long chains of fatty acids, i.e. C16 (∼29%) and C18 (∼69%). It is a triglyceride-based oil composed of a triglycerol molecule attached to three fatty acids via an ester bond.63 Thus, CFO deoxygenation starts with ester hydrolysis, resulting in the breaking down of triglycerides into C16 and C18 fatty acids (reaction A, Fig. 10). Fatty acids are further deoxygenised via decarboxylation, forming n-heptadecanes (saturated; C17H36), n-heptadecenes (mono-unsaturated, C17H34; di-unsaturated, C17H32) and n-pentadecanes (saturated, C15H32; reaction B). This reaction also yields gaseous CO2 as a byproduct. Simultaneously, fatty acids undergo decarbonylation via the removal of CO and H2O as byproducts, thereby producing hydrocarbons with extra double bonds in the form of mono-unsaturated (C15H30, C17H34), di-unsaturated (C17H32) and poly-unsaturated (C17H28) compounds (reaction C). In our discussion, WGS and Boudouard reactions (eqn (4) and (5)) may occur and produce CO2, CO and H2. Indeed, the obtained H2 should be used for the hydrogenation of unsaturated hydrocarbon to form saturated hydrocarbons.64 Thus, the amount of n-heptadecanes as products increased (Table S2†). Although the content of C16 fatty acids in CFO was 70% lower than that of C18 fatty acids, the n-C15 hydrocarbon fraction dominated in all catalysed reactions. This is probably due to the further cracking of C18 fatty acids leading to the formation of C16 fatty acid products (reaction D). Furthermore, that cracking of deoxygenated liquid products may also tends to form n-C15 compounds (reaction E). This phenomenon is in agreement with Kareem's finding in the deoxygenation of waste cooking oil over walnut-shell-derived nanorod-activated carbon supporting Cao-La2O3, which produced primarily the n-C15 fraction via the deCOx pathway.33 Additionally, light hydrocarbons (n-(C8–C9), Fig. 7b and d) were also formed by C–C bond cleavages of the deoxygenated product (reaction F).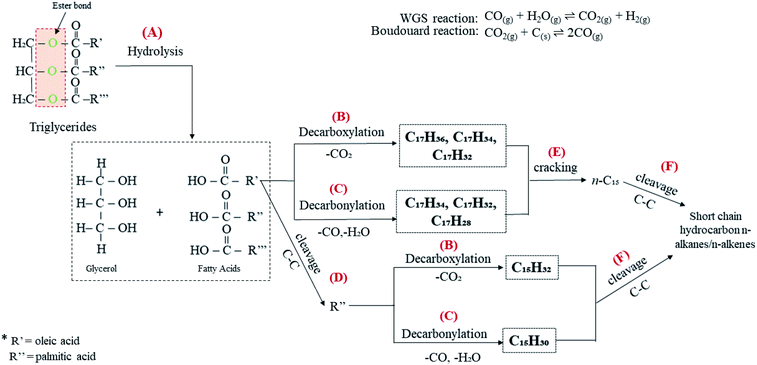 | ||
| Fig. 10 Proposed reaction scheme for catalytic deoxygenation of CFO to hydrocarbon over Ni10–Mg15/MWCNT and Ni10–Mn5/MWCNT catalysts. | ||
3.6 Deactivation of the catalyst by coke formation
Typically, deoxygenation catalysts are prone to deactivation due to coke deposition. Therefore, the coke deposited on the spent Ni10–Mn5/MWCNT and Ni10–Mg15/MWCNT catalysts were studied using TGA and the results shown in Fig. S5.† The coke formation was determined by the difference in weight loss between the spent and the fresh catalyst.65 The spent catalysts were simply reactivated by hexane washing. The result showed that both of the fresh and spent catalysts experienced major weight loss between 350 and 840 °C. The weight loss at 500–650 °C was assigned to the combustion of MWCNT nanorods, while the extra weight loss at 350–499 °C was due to oxidation of the hard coke in air.66 In can be seen that both spent Ni10–Mg15/MWCNT and Ni10–Mn5/MWCNT catalysts favoured hard coke formation. Hard coke is typically formed at high temperature and has a lower H/C ratio. Interestingly, spent Ni10–Mg15/MWCNT exhibits two other minor weight losses at <180 °C and 180–330 °C, which can be attributed to the removal of H2O + volatile matter (alcohols) (see Fig. 8a) and soft coke. Soft coke is preferentially formed at low reaction temperatures and has high hydrogen-to-carbon ratio and is rich in polyaromatic species,66 suggesting that MgO favours polymerisation reactions. In total, spent Ni10–Mn5/MWCNT catalyst showed higher coke formation (11 wt%) than did Mg-containing catalysts (5 wt%), thereby indicating that Ni10–Mg15/MWCNT provided greater stability.3.7 Reusability and stability profile for Ni10–Mg15/MWCNT
Our findings revealed that Ni10–Mg15/MWCNT showed high resistancy toward coke formation (coke < 5 wt%). Thus, the reusability and stability of Ni10–Mg15/MWCNT catalyst were examined using 3 wt% catalyst loading at a reaction temperature of 350 °C within a reaction time of 2 h under inert conditions. After each cycle of deoxygenation was completed, the spent catalyst was reactivated by simply washing with hexane multiple times and reused for the next cycle under the same condition. Hexane washing is the most appropriate technique for reactivating the spent carbon-based catalyst because the nature of the carbon support would preclude the removal of coke deposited on the spent Ni10–Mg15/MWCNT catalysts via a thermal treatment process. Hexane washing has also been commonly practiced to regenerate catalysts because it effectively removes organic species adsorbed on the surface of catalysts and increases the active phase.67 Our reusability analysis showed that the Ni10–Mg15/MWCNT catalyst could be consistently reused by up to five cycles with hydrocarbon yield and n-(C15 + C17) selectivity of 89–73% and 82–66%, respectively (Fig. 11a and b). The deoxygenation activity noticeably decreased at the fifth cycle because of active metal species leaching and coke formation.68 This finding agreed with our XRD results. In particular, the cubic structure of NiO at 2θ: 37.05°, 43.14° and 62.89° and the hexagonal structure of MgO at 2θ: 42.92° disappeared in the spent Ni10–Mg15/MWCNT catalyst after the fifth cycle (Fig. 12a). This phenomenon might be attributed to the leaching of active metal species in the catalyst. Furthermore, this finding was strongly affirmed by a decrease in the Ni% and the absence of Mg species in FESEM-EDX mapping (Fig. 12b). Nevertheless, the C% on the spent Ni10–Mg15/MWCNT surfaces also increased to 19% after the fifth cycle, suggesting that coke was deposited on the exterior of the spent catalyst upon deoxygenation. The TGA analysis of the fresh and spent Ni10–Mg15/MWCNT catalysts (Fig. 12c) showed that both catalysts experienced a major weight loss between 350 °C and 550 °C. The main decomposition peak at 350–499 °C was due to the oxidation of the hard coke in air, whereas the peak at 500–650 °C was attributed to the combustion of MWCNT nanorods. Approximately 26 wt% of hard coke was formed after the fifth cycle. In low-quality feedstock deoxygenation, catalysts remain highly stable in four to six cycles without a noticeable loss of reaction activity,33 and the amount of coke formed is minimal (<4 wt%).69 The comparison of the performance of their catalysts with that of the Ni10–Mg15/MWCNT catalyst used in our study indicated that deoxygenation was sensitive to coke formation.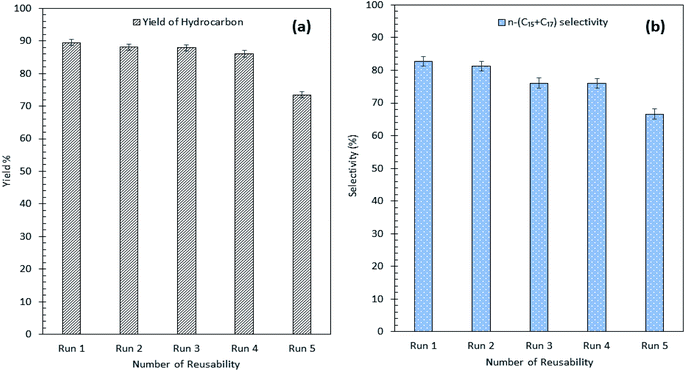 | ||
| Fig. 11 (a) Yield of hydrocarbon and (b) product selectivity of Ni10–Mg15/MWCNT deoxygenized product from reusability reaction. | ||
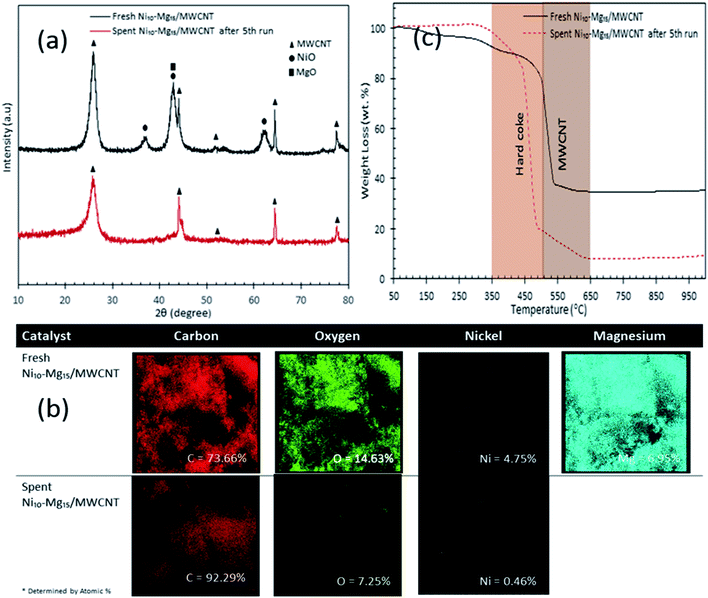 | ||
| Fig. 12 (a) X-ray diffraction patterns, (b) elemental mapping and (c) TGA profile for fresh and spent Ni10–Mg15/MWCNT catalyst after 5th cycles. | ||
The comparison of the catalytic deoxygenation of various feeds is summarised in Table 6. The results indicated that Ni10–Mg15/MWCNT showed an excellent deoxygenation activity through which the total hydrocarbon fraction was 90%, and the diesel range selectivity n-(C15 + C17) was 87% compared with that of other catalysts.16,47,70,71 Ni- and Mg-supported AC resulted in a low deoxygenation activity through which Ni/AC produced 64–72% hydrocarbon with 51–82% (n-C15 + C17); by comparison, Mg/AC yielded 90% hydrocarbon and ∼50% of n-C15 + C17 selectivity.16,31,47 Interestingly, the hydrocarbon yield of Mg/AC was closer to the value obtained via the Ni10–Mg15/MWCNT-catalysed reaction, but the n-(C15 + C17) selectivity was low (∼50%).31 This variation was due to the presence of weak + medium acidic sites in Ni10–Mg15/MWCNT and the high surface area/volume ratio of the Ni10–Mg15/MWCNT catalyst.33,69 This finding agreed with that of Asikin-Mijan et al.30 who demonstrated that the use of a strongly acidic Ni20–Co10/MWCNT catalyst produces a high hydrocarbon yield (80%), but the n-(C15 + C17) selectivity of this catalyst is lower than that of Ni10–Mg15/MWCNT. This finding strongly affirmed that weakly or moderately acidic sites in Ni10–Mg15/MWCNT catalyst promoted C–O bond cleavage to a greater extent than strong acidic sites in Ni20–Co10/MWCNT catalyst did. Another study has also shown that H2 is beneficial to the hydrogenation of an unsaturated species to a saturated compound and directly prevents the unsaturated species from deactivating the active sites of catalysts.72 However, the use of H2 could induce a competitive reaction between deCOx and hydrogenation, thus decreasing the catalytic activity. Evidently, Kaewmeesri and co-worker studied the deoxygenation of CFO under a H2 atmosphere but only obtained 72% of hydrocarbon and 82% n-(C15 + C17) selectivity compared with that of Ni10–Mg15/MWCNT-catalysed CFO.16 The presence of H2 results in limited surface active sites for hydrogen and feedstock molecules, concurrently decreasing the deCOx reaction.73 In conclusion, a reaction in a H2-free environment provided an effective condition for an efficient deoxygenation activity to produce high-quality green diesel.
| No. | Catalyst | Support | Reaction | Feed | Hydrocarbon yield (%) | Selectivity (%) | References |
|---|---|---|---|---|---|---|---|
| a AC = activated carbon.b WCO = waste cooking oil.c JCO = Jatropha curcas oil. | |||||||
| 1 | 10%Mg/ACa | ACa (commercial) | DO | WCOb | 90 | <50 (n-C15 + C17) | 70 |
| 2 | 20%Ni/C | ACa (commercial) | DO H2 (39 bar) | Stearic acid | 64 | 51 (n-C15 + C17) | 47 |
| 3 | Ni/γ-Al2O3 | γ-Al2O3 (commercial) | DO H2 (50 bar) | CFO | 72 | 82 (n-C15 + C17) | 16 |
| 4 | Ni20–Co10/MWCNT | MWCNT (commercial) | DO | JCOc | 80 | 64 (n-C15 + C17) | 46 |
| 5 | Ni10–Mg15/MWCNT | MWCNT (commercial) | DO | CFO | 90 | 87 (n-C15 + C17) | Present study |
4. Conclusions
In the present work, oxides of binary metal pairs (Ni–Mg, Ni–Mn, Ni–Cu, Ni–Ce) supported on MWCNTs showed promising catalytic activity in improving the deoxygenation of CFO for the formation of diesel-like hydrocarbons, yielding 72–84% of n-(C8–C20) hydrocarbon fractions with a product selectivity towards n-(C15 + C17) of 59–84%. In total, the binary Ni10–Mg10/MWCNT and Ni10–Mn10/MWCNT catalysts rendered highest deoxygenation activity favourable towards the deCOx reaction. The carbon number range of hydrocarbons produced is pragmatically tuneable by varying the active metal concentrations. Mg-rich species (15 wt%) and low-Mn species (5 wt%) afforded greater deoxygenation performance via deCOx pathways, with product selectivities towards n-(C15 + C17) of 87% and 85%, respectively. The high reactivity of Ni10–Mg15/MWCNT was due mainly to the presence of weak + medium acid sites and to the nature of active Mg itself, which induced the decarboxylation pathway. Ni10–Mg15/MWCNT showed greater stability than Ni10–Mn5/MWCNT, suggested due to the presence of coke inhibitor promoter (MgO).Conflicts of interest
There are no conflicts to declare.Acknowledgements
The authors acknowledge the financial support from Ministry of Higher Education Malaysia for Fundamental Research Grant Scheme (FRGS 2014-1), Geran Putra Berimpak (GPB) UPM/800-3/3/1/GPB/2018/9658700 and Geran Putra Berimpak GBP/2019/9674500. The authors extend their appreciation to the International Scientific Partnership Program ISPP at King Saud University for funding this research work through ISPP-142.References
- B. Gurunathan and A. Ravi, Bioresour. Technol., 2015, 188, 124–127 CrossRef CAS PubMed.
- S. Bezergianni, A. Dimitriadis, T. Sfetsas and A. Kalogianni, Bioresour. Technol., 2010, 101, 7658–7660 CrossRef CAS PubMed.
- R. W. Gosselink, S. A. W. Hollak, S. W. Chang, J. Van Haveren, K. P. De Jong, J. H. Bitter and D. S. Van Es, ChemSusChem, 2013, 6, 1576–1594 CrossRef CAS.
- W. Wang, Z. Qiao, K. Zhang, P. Liu, Y. Yang and K. Wu, RSC Adv., 2014, 4, 37288–37295 RSC.
- N. Asikin-Mijan, H. V. Lee, T. S. Marliza and Y. H. Taufiq-Yap, J. Anal. Appl. Pyrolysis, 2018, 129, 221–230 CrossRef CAS.
- S. Echaroj, T. Sahasakmontri and M. Suntikunaporn, Int. Proc. Chem., Biol. Environ. Eng., 2015, 100, 118–123 Search PubMed.
- N. Asikin-Mijan, H. V. Lee, Y. H. Taufiq-Yap, G. Abdulkrem-Alsultan, M. S. Mastuli and H. C. Ong, Energy Convers. Manage., 2017, 141, 325–338 CrossRef CAS.
- S. L. Douvartzides, N. D. Charisiou, K. N. Papageridis and M. A. Goula, Energies, 2019, 12, 1–42 CrossRef.
- T. M. Y. Khan, A. E. Atabani, I. A. Badruddin, A. Badarudin, M. S. Khayoon and S. Triwahyono, Renewable Sustainable Energy Rev., 2014, 37, 840–851 CrossRef CAS.
- V. Mutreja, S. Singh and A. Ali, Renewable Energy, 2011, 36, 2253–2258 CrossRef CAS.
- P. L. Boey, G. P. Maniam, S. A. Hamid and D. M. H. Ali, J. Am. Oil Chem. Soc., 2011, 88, 283–288 CrossRef CAS.
- G. T. Jeong, H. S. Yang and D. H. Park, Bioresour. Technol., 2009, 100, 25–30 CrossRef CAS PubMed.
- M. E. Hoque, A. Singh and Y. L. Chuan, Biomass Bioenergy, 2011, 35, 1582–1587 CrossRef CAS.
- A. R. Seidavi, H. Zaker-Esteghamati and C. G. Scanes, World's Poult. Sci. J., 2019, 75, 55–68 Search PubMed.
- E. Alptekin, M. Canakci and H. Sanli, Waste Manag., 2014, 34, 2146–2154 CrossRef CAS PubMed.
- R. Kaewmeesri, A. Srifa, V. Itthibenchapong and K. Faungnawakij, Energy Fuels, 2015, 29, 833–840 CrossRef CAS.
- Y. Yang, Q. Wang, X. Zhang, L. Wang and G. Li, Fuel Process. Technol., 2013, 116, 165–174 CrossRef CAS.
- G. Onyestyák, S. Harnos, Á. Szegedi and D. Kalló, Fuel, 2012, 102, 282–288 CrossRef.
- O. I. Şenol, E. M. Ryymin, T. R. Viljava and A. O. I. Krause, J. Mol. Catal. A: Chem., 2007, 268, 1–8 CrossRef.
- T. Morgan, D. Grubb, E. Santillan-Jimenez and M. Crocker, Top. Catal., 2010, 53, 820–829 CrossRef CAS.
- Y. Rezgui and M. Guemini, Appl. Catal., A, 2005, 282, 45–53 CrossRef CAS.
- H. Tani, T. Hasegawa, M. Shimouchi, K. Asami and K. Fujimoto, Catal. Today, 2011, 164, 410–414 CrossRef CAS.
- T. Aysu, M. M. Maroto-Valer and A. Sanna, Bioresour. Technol., 2016, 208, 140–148 CrossRef CAS.
- R. Loe, E. Santillan-Jimenez, T. Morgan, L. Sewell, Y. Ji, S. Jones, M. A. Isaacs, A. F. Lee and M. Crocker, Appl. Catal., B, 2016, 191, 147–156 CrossRef CAS.
- N. Asikin-Mijan, Y. H. Taufiq-Yap and H. V. Lee, Chem. Eng. J., 2015, 262, 1043–1051 CrossRef CAS.
- M. N. Uddin, W. M. A. W. Daud and H. F. Abbas, RSC Adv., 2014, 4, 10467–10490 RSC.
- G. Murali Dhar, B. N. Srinivas, M. S. Rana, M. Kumar and S. K. Maity, Catal. Today, 2003, 86, 45–60 CrossRef.
- C. Zhao, T. Brück and J. A. Lercher, Green Chem., 2013, 15, 1720–1739 RSC.
- H. Zhang, C. Lancelot, W. Chu, J. Hong, A. Y. Khodakov, P. A. Chernavskii, J. Zheng and D. Tong, J. Mater. Chem., 2009, 19, 9241–9249 RSC.
- N. Asikin-Mijan, H. V. Lee, G. Abdulkareem-Alsultan, A. Afandi and Y. H. Taufiq-Yap, J. Cleaner Prod., 2018, 167, 1048–1059 CrossRef.
- G. Abdulkareem-Alsultan, N. Asikin-Mijan, N. Mansir, H. V. Lee, Z. Zainal, A. Islam and Y. H. Taufiq-Yap, J. Anal. Appl. Pyrolysis, 2019, 137, 171–184 CrossRef CAS.
- E. Kalantar, K. Kabir, F. Gharibi, S. Hatami and A. Maleki, J. Med. Bacteriol., 2013, 2, 20–26 CAS.
- G. A. Alsultan, N. Asikin-Mijan, H. V. Lee, A. S. Albazzaz and Y. H. Taufiq-Yap, Energy Convers. Manage., 2017, 151, 311–323 CrossRef CAS.
- B. C. Ang, I. I. Yaacob and I. Nurdin, J. Nanomater., 2013, 3, 2–5 Search PubMed.
- J. Wu, Q. Xia, H. Wang and Z. Li, Appl. Catal., B, 2014, 156–157, 265–272 CrossRef CAS.
- L. A. A. Rodríguez, M. Pianassola and D. N. Travessa, Mater. Res., 2017, 20, 96–103 CrossRef.
- D. Bom, R. Andrews, D. Jacques, J. Anthony, B. Chen, M. S. Meier and J. P. Selegue, Nano Lett., 2002, 2, 615–619 CrossRef CAS.
- Z. Mirghiasi, F. Bakhtiari, E. Darezereshki and E. Esmaeilzadeh, J. Ind. Eng. Chem., 2014, 20, 113–117 CrossRef CAS.
- R. P. Ponminiessary, Stud. Prep. Support. Nickel Catal. Using Bis(Ethylenediamine) Nickel(II) Complexes as Precursors, 2013, vol. 1–32 Search PubMed.
- J. O. Olusola, M. M. Adediran, A. K. Oluseyi and U. L. Ajao, Energy Environ., 2010, 20, 1325–1341 Search PubMed.
- Y. Wan, W. Zhao, Y. Tang, L. Li, H. Wang, Y. Cui, J. Gu, Y. Li and J. Shi, Appl. Catal., B, 2014, 148–149, 114–122 CrossRef CAS.
- W. Wang, C. Zhang, G. Chen and R. Zhang, Appl. Sci., 2019, 9, 1–15 Search PubMed.
- B. Jothi Thirumal, E. James Gunasekaran, Loganathan and C. G. Saravanan, J. Eng. Sci. Technol., 2015, 10, 1404–1421 Search PubMed.
- P. Mierczynski, M. Mosinska, M. Zakrzewski, B. Dawid, R. Ciesielski, W. Maniukiewicz and T. Maniecki, React. Kinet., Mech. Catal., 2017, 121, 453–472 CrossRef CAS.
- K. B. Baharudin, Y. H. Taufiq-Yap, J. Hunns, M. Isaacs, K. Wilson and D. Derawi, Microporous Mesoporous Mater., 2019, 276, 13–22 CrossRef CAS.
- N. Asikin-Mijan, H. V. Lee, J. C. Juan, A. R. Noorsaadah and Y. H. Taufiq-Yap, RSC Adv., 2017, 7, 46445–46460 RSC.
- E. Santillan-Jimenez, T. Morgan, J. Shoup, A. E. Harman-Ware and M. Crocker, Catal. Today, 2014, 237, 136–144 CrossRef CAS.
- M. Renz, Eur. J. Org. Chem., 2005, 979–988 CrossRef CAS.
- R. Putra, W. W. Lestari, F. R. Wibowo and B. H. Susanto, Bull. Chem. React. Eng. Catal., 2018, 13, 245–255 CrossRef CAS.
- S. Sharifvaghefi and Y. Zheng, Can. J. Chem. Eng., 2018, 96, 231–240 CrossRef CAS.
- D. C. Gardner and C. H. Bartholomew, Ind. Eng. Chem. Prod. Res. Dev., 1981, 20, 80–87 CrossRef CAS.
- P. Biswas and D. Kunzru, Int. J. Hydrogen Energy, 2007, 32, 969–980 CrossRef CAS.
- M. Gabrovska, M. Bankova, V. Idakiev, R. Edreva-Kardjieva and I. Uzunov, in Proceeding of the 9th International Symposium of Heterogeneous Catalysis, 2000, pp. 513–518 Search PubMed.
- J. Hu, K. Zhu, L. Chen, C. Kübel and R. Richards, J. Phys. Chem. C, 2007, 111, 12038–12044 CrossRef CAS.
- N. Krobkrong, V. Itthibenchapong, P. Khongpracha and K. Faungnawakij, Energy Convers. Manage., 2018, 167, 1–8 CrossRef CAS.
- Z. Si, X. Zhang, C. Wang, L. Ma and R. Dong, Catalysts, 2017, 7, 1–22 CrossRef.
- N. G. Akalework, C.-J. Pan, W.-N. Su, J. Rick, M.-C. Tsai, J.-F. Lee, J.-M. Lin, L.-D. Tsai and B.-J. Hwang, J. Mater. Chem., 2012, 22, 20977 RSC.
- P. Castaño, B. Pawelec, J. L. G. Fierro, J. M. Arandes and J. Bilbao, Fuel, 2007, 86, 2262–2274 CrossRef.
- J. Liu, J. He, L. Wang, R. Li, P. Chen, X. Rao, L. Deng, L. Rong and J. Lei, Sci. Rep., 2016, 6, 1–11 CrossRef.
- Y. Lou, P. He, L. Zhao and H. Song, Fuel, 2016, 183, 396–404 CrossRef CAS.
- I. Kim, A. A. Dwiatmoko, J. W. Choi, D. J. Suh, J. Jae, J. M. Ha and J. K. Kim, J. Ind. Eng. Chem., 2017, 56, 74–81 CrossRef CAS.
- S. Vitolo, M. Seggiani, P. Frediani, G. Ambrosini and L. Politi, Fuel, 1999, 78, 1147–1159 CrossRef CAS.
- R. Sotelo-Boyas, F. Trejo-Zarraga and F. de Jesus Hernandez-Loyo, Hydrogenation, 2012, ch. 8, pp. 187–215 Search PubMed.
- S. Zulkepli, J. C. Juan, H. V. Lee, N. S. A. Rahman, P. L. Show and E. P. Ng, Energy Convers. Manage., 2018, 165, 495–508 CrossRef CAS.
- S. Asplund, J. Catal., 1996, 158, 267–278 CrossRef CAS.
- S. K. Sahoo, S. S. Ray and I. D. Singh, Appl. Catal., A, 2004, 278, 83–91 CrossRef CAS.
- A. Wahyudi, W. Kurniawan and H. Hinode, Green Sustainable Chem., 2017, 07, 247–258 CrossRef CAS.
- I. Istadi, U. Mabruro, B. A. Kalimantini, L. Buchori and D. D. Anggoro, Bull. Chem. React. Eng. Catal., 2016, 11, 34–39 CrossRef CAS.
- G. Abdulkareem-alsultan, N. Asikin-mijan, N. Mansir, H. V Lee and Z. Zainal, J. Anal. Appl. Pyrolysis, 2018, 137, 171–184 CrossRef.
- P. Natewonga, Y. Murakamib, H. Tanic and K. Asami, Am. Sci. Res. J. Eng. Technol. Sci., 2016, 22, 153–165 Search PubMed.
- N. Asikin-mijan, H. V. Lee, G. Abdulkareem-alsultan and A. Afandi, J. Cleaner Prod., 2017, 167, 1048–1059 CrossRef CAS.
- A. Srifa, K. Faungnawakij, V. Itthibenchapong and S. Assabumrungrat, Chem. Eng. J., 2015, 278, 249–258 CrossRef CAS.
- W. C. Wang, N. Thapaliya, A. Campos, L. F. Stikeleather and W. L. Roberts, Fuel, 2012, 95, 622–629 CrossRef CAS.
Footnote |
| † Electronic supplementary information (ESI) available. See DOI: 10.1039/c9ra08409f |
| This journal is © The Royal Society of Chemistry 2020 |

