
 Open Access Article
 This Open Access Article is licensed under a Creative Commons Attribution-Non Commercial 3.0 Unported Licence
Immunochromatographic assay for melamine based on luminescent quantum dot beads as signaling probes
Quan Chen†
 a,
Meifang Qie†b,
Xusheng Pengc,
Yan Chend and
Yulin Wang*e
a,
Meifang Qie†b,
Xusheng Pengc,
Yan Chend and
Yulin Wang*e
aSchool of Remote Sensing and Information Engineering, Wuhan University, China
bChangzhou Sirrim Hospital, China
cMedical School of Chinese PLA, China
dJiangsu Health Vocational College, China
eSchool of Computer Science, Wuhan University, China. E-mail: wangyulinwh@qq.com
First published on 20th January 2020
Abstract
To screen and detect the harmful substance melamine (MEL), a quantum-dot-bead-based immunochromatographic assay (QB-ICA) was formulated. After optimization, calibration was performed within the linear range from 0.06 to 0.28 ng mL−1, with limit of detection (LOD) of 0.04 ng mL−1. The LOD was 35 times lower than that of ICA that used colloidal gold nanoparticles (LOD = 1.4 ng mL−1) and 40 times lower than that of the assay based on quantum dots (LOD = 1.6 ng mL−1). In the detection of MEL in spiked pure milk using the proposed QB-ICA strategy, the LOD (LOD = 0.19 ng mL−1) of the samples with the proposed pretreatment was 18.4 times lower than those of the samples without pretreatment (LOD = 3.5 ng mL−1). The performance and practicability of the proposed QB-ICA system was validated; the obtained results reveal that QB-ICA is comparable with the conventional enzyme-linked immunosorbent assay (ELISA) method, but with enhanced applicability. Given its high sensitivity and practicability, the QB-ICA strategy could become a worthwhile alternative for the rapid, sensitive, and quantitative onsite detection of harmful substances, facilitating food safety monitoring.
Introduction
Melamine (MEL), a nitrogen-rich industrial compound, has been widely used in the industry for manufacturing polymer resins, flame retardants, fertilizers, and kitchenware.1,2 Unfortunately, due to its high nitrogen content (66% by mass), MEL is deliberately added into dairy products (e.g., infant formula) to artificially inflate their protein levels for illegal commercial profit.3 The prolonged intake of MEL can lead to the formation of insoluble melamine cyanurate crystals in the kidneys and reproductive system, leading to health hazards such as nephrolithiasis, bladder carcinoma, and chronic kidney inflammation, particularly in infants and adolescents.4 Nowadays, the harmful influences of MEL in milk on human health have started to concern an increasing number of people, particularly after the occurrence of the MEL incident in 2008 in China.5 China and US have set the maximum residue limit (MRL) for infant formula at 1.0 and 2.5 mg kg−1, respectively, for milk and other milk products.6 MEL, as an additive, has been banned in any food or feed in China and listed in the Food Illegal Additives Monitoring Program for daily surveillance.Several studies have been carried out for MEL monitoring to guarantee the safety of milk products. The confirmation and screening methods for MEL includes electrochemistry, capillary electrophoresis, gas chromatography/mass spectrometry (GC/MS), surface-enhanced Raman spectroscopy (SERS), enzyme-linked immunosorbent assay (ELISA), UVSERS, and other spectroscopic methods.7–10 Although they have high sensitivity, all these techniques are difficult to emulate for real-time and onsite MEL testing due to drawbacks such as high-cost and labor-intensive instruments and the requirement of well-trained operators. Hence, it has become imperative to develop a sensitive, rapid, and effective method for MEL detection.
Among all the rapid detection methods, colloidal gold nanoparticle (AuNP)-based methods have been the most widely adopted due to the MEL-induced color change of AuNPs solutions. MEL and AuNPs can form hydrogen bonds, inducing the aggregation and optical signal variations of AuNPs, based on which MEL can be detected in a colorimetric way.11 However, the repeatability and stability of colorimetric methods are limited in practical home use or infield applications.12 An alternative AuNPs-labeling-based MEL detection method is the lateral flow immunochromatographic assay (ICA) system. However, AuNPs-ICA is usually not sufficiently sensitive, and several efforts have been devoted toward sensitivity enhancement.13–15 Among the novel labels applied in ICA (e.g., magnetic nanoparticles, upconverting phosphors, and time-resolved fluorescence), quantum dots (QDs) have attracted considerable attention owing to their unique optical properties. QDs exhibit broad absorption spectra, narrow photoluminescence spectra, size tunability due to quantum confinement, and excellent photostability.16,17 It has been further proven that by the doping of numerous QDs inside polybeads, quantum dot nanobeads (QB) could be prepared and ICA sensitivity could be substantially improved.18 However, the ICA detection of MEL based on QB has not been reported.
In this study, the QB-ICA of MEL in milk was established with the proposed pretreatment strategy. After optimization, calibration was established, with LOD of 0.04 ng mL−1. As a result, the LOD of QB-ICA using the proposed pretreatment was approximately 18.4 times lower than that of ICA without pretreatment and 35 times lower than that of ICA using AuNPs. In addition, QB-ICA is comparable to conventional ELISA methods. Hence, the proposed QB-ICA strategy could be used as an alternative for the rapid, sensitive, and quantitative detection of the analyte. Furthermore, a quantitative result could be integrated into the big data network for the online dynamic monitoring of food safety.
Experimental section
Materials
MEL and skimmed milk powder were purchased from Sigma-Aldrich (St. Louis, MO, USA). The consumptive materials in the ICA strip, namely, glass fiber and absorbent pad, were purchased from Jinbiao Biotech Co., Ltd (Shanghai, China). The nitrocellulose (NC) membrane filter was supplied by Millipore Corporation (Millipore, Bedford, MA). Ingredients for preparing phosphate buffer (PB) such as sucrose, Tween 20, PEG-20000, disodium hydrogen phosphate, sodium dihydrogen phosphate, and glycine were purchased from Beijing Chemical Reagent Company (Beijing, China). The anti-MEL monoclonal antibody (anti-MEL-mAb), coating antigen of MEL (MEL-BSA), goat anti-mouse IgG antibodies, and commercial MEL ELISA kit were purchased from Shandong Landu Bio-Science & Technology Co., Ltd (Shandong, China). The labeling probe was carboxylate-modified QB with an excitation wavelength of 365 nm and emission wavelength of 610 nm, which was supplied by Beijing Nanjing Biological Technology Co., Ltd (Beijing, China). Pure milk was collected from the local supermarket. All the other reagents were of the analytical grade and obtained from the National Pharmaceutical Group Chemical Reagent Co., Ltd (Shanghai, China).Apparatus
The cutting module CM4000 and XYZ3000 dispensing platform were purchased from BioDot Inc. (Irvine, CA, USA). The ICA strip reader was obtained from Beijing Nanjing Biological Technology Co., Ltd (Beijing, China). A vortex mixer (CAT: HQ-60-II) was purchased from Beijing North TZ-Biotechnology Development Co. (Beijing, China), and the centrifuge (CAT: 5804R) was supplied by Eppendorf AG (Hamburg, Germany). High-purity deionized water used throughout the research was obtained using a Milli-Q water purification system (Millipore, Bedford, MA).Preparation of QBs-mAbs
The preparation of anti-MEL-mAb covalently conjugated to QB was carried out by an active ester method. Briefly, EDC and NHS (molar ratio of 1![[thin space (1/6-em)]](https://www.rsc.org/images/entities/char_2009.gif) :1) were added into a QB solution to activate the carboxyl group under 37 °C for 15 min. Then, a certain amount of anti-MEL-mAbs (0.3 mg per 1 mL of QB solution) was added into the above mixture under gentle stirring (600 rpm) and incubated for 90 min under 37 °C. Then, the glycine solution containing 10% skimmed milk powder (0.1 M, pH 6.0) was added to block the QB-mAbs conjugation overnight at 4 °C. After centrifugation at 5000 rpm for 15 min, the supernatant was discarded and the precipitates were resuspended in the PB buffer (0.04 moL L−1 containing 5% sucrose, 2% fructose, 1% PEG 20000, and 5% Tween 20) and stored at 4 °C until further use.
:1) were added into a QB solution to activate the carboxyl group under 37 °C for 15 min. Then, a certain amount of anti-MEL-mAbs (0.3 mg per 1 mL of QB solution) was added into the above mixture under gentle stirring (600 rpm) and incubated for 90 min under 37 °C. Then, the glycine solution containing 10% skimmed milk powder (0.1 M, pH 6.0) was added to block the QB-mAbs conjugation overnight at 4 °C. After centrifugation at 5000 rpm for 15 min, the supernatant was discarded and the precipitates were resuspended in the PB buffer (0.04 moL L−1 containing 5% sucrose, 2% fructose, 1% PEG 20000, and 5% Tween 20) and stored at 4 °C until further use.
Fabrication of QB-ICA system
The MEL-BSA (0.25 mg mL−1) antigen was coated in the NC membrane as the test line (T line) and the goat anti-mouse IgG antibodies (0.5 mg mL−1) were coated as the control line (C line) by means of the BioDot XYZ 3000 instrument at densities of 1 μL cm−1. The ICA strip was assembled by pasting the NC membrane on the center of the PVC backing card, and the glass fiber and absorption pads were pasted on both the ends with a nearly 2 mm overlap with the NC membrane. The assembled ICA strip was then dried in a dry oven at 37 °C for 2 h and cut into a width of 3.5 mm by means of an automatic cutter and stored under dry conditions at room temperature until use. The schematic description of MEL-detecting QB-ICA is shown in Fig. 1.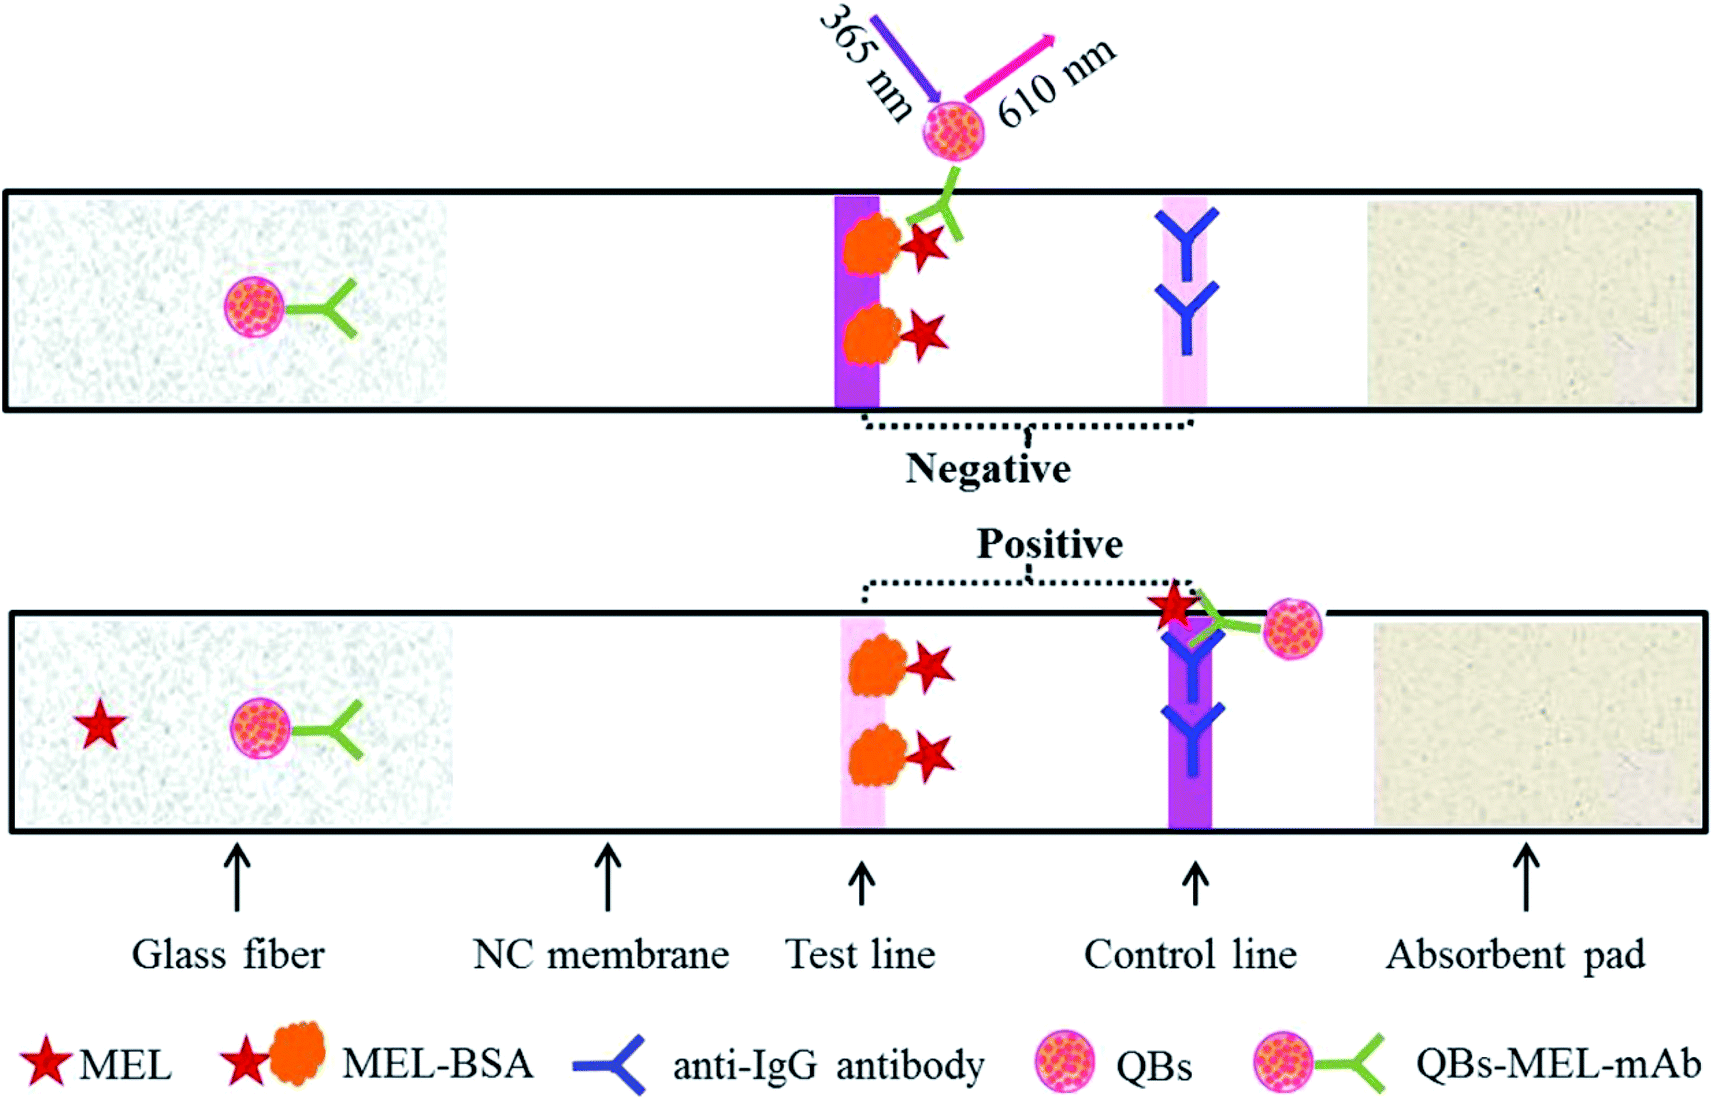 | ||
| Fig. 1 Schematic diagram of QB-ICA for MEL detection. | ||
Test procedure of QB-ICA
Here, 100 μL standard solution or sample solution was premixed with a certain amount of QB-MEL-mAb and added onto the glass fiber on the QB-ICA strip. The mixture migrated under capillary force through the QB-ICA strip. The result was read out by a strip reader at an excitation wavelength of 365 nm. For the MEL-free sample, the QB-mAb in the mixture would be captured by the antigen coating (MEL-BSA) in the T line to form a detectable fluorescent signal (FIT), and the result would be reported as “negative.” However, for the MEL-containing sample, QB-mAb would react with MEL in the premixed solution, forming the QB-mAb-MEL complex, which would not be captured by the T line but by the C line, and the fluorescent signal in the C line (FIT) would be reported as “positive.” The FIT value is inversely proportional to the MEL concentration. The higher the MEL concentration, the higher is the amount of QB-mAb-MEL complex formed and the lower is the FIT, based on which a calibration curve is established and the exact amount of MEL can be calculated. For the best ICA results, the QB-ICA system was optimized and the calibration curve was plotted as B/B0 × 100% against the MEL concentration in the logarithmic scale, where B and B0 represent the FIT value with and without MEL, respectively. The standard MEL solutions were prepared by dissolving MEL standard in methanol and diluted with serial PB buffer at pH 5.6 (0.04 mol L−1 containing 5% sucrose, 2% fructose, 1% PEG 20000, and 5% Tween 20) to a final concentration of 0 (as negative control), 0.02, 0.04, 0.08, 0.16, 0.31, 0.63, and 1.25 ng mL−1. Six standard solutions were applied to evaluate the cross-reaction (CR). Structural analogs, namely, atrazine (ATZ), cyromazine (CMZ), and other common pollutants such as chloramphenicol (CAP), kanamycin (KNM), streptomycin (SPM), and aflatoxin M1 (AFM1), were separately spiked under the aforementioned optimal conditions.Spiked milk samples and pretreatment
Pure milk contains high-quality protein that is good for the human body and forms the core material of yogurt, cheese, and other milk products. Therefore, QB-ICA in this work was established for detecting pure milk; pure milk samples were obtained from a local supermarket. Through LC-MS/MS, the purchased samples were confirmed to contain no MEL. The pretreatment procedures involving pure milk were operated according to a general procedure and then simplified.19 Briefly, 10 mg trichloroacetic acid was added to 1 mL pure milk for milk protein precipitation. After denaturation for 2 min, the mixture was centrifuged at 5000 rpm for 3 min and the pH of the obtained supernatant was neutralized by NaOH (5 mol L−1) to pH 5.6; the resultant mixture was directly subjected to ICA.The accuracy and precision analyses of the proposed QB-ICA for MEL were performed in triplicate by using standard MEL solution samples with spiked concentrations of 0.04, 0.08, and 0.16 ng mL−1. The QB-ICA results were compared between the MEL spiked samples in standard solutions and those in the milk samples with the proposed pretreatment or no pretreatment; further, the QB-ICA results were also compared with the reported MEL-detecting ICA using AuNPs as the signal probe as well as the assay based on color changes using AuNPs and fluorescent material.
Comparative evaluation
A comparative study was carried out between QB-ICA and commercial MEL-ELISA kit for MEL detection. MEL was spiked into blank pure milk samples over the concentration range of 0.15–0.6 ng mL−1 and determined. All the samples used in the QB-ICA system were pretreated with the proposed acid-based method as mentioned above, and the sample pretreatment using the commercial ELISA kit was carried out according to the guideline of the manufacturer's instructions. All the tests were carried out in triplicate.Results and discussion
Optimization of the QB-ICA system
The optimization of the QB-ICA system was carried out in the competitive mode under MEL spiked concentrations of 0 and 1 ng mL−1; the parameter that could result in the most obvious inhibition, namely, FIT/FIC difference, was selected.Firstly, the amount of anti-MEL antibody modified on the QB surface was optimized. Different QB-mAb complexes were prepared and compared. Fig. 2A shows that the anti-MEL mAb amount of 0.3 mg per mL of QB led to the strongest FIT/FIC difference. Higher or lower concentrations of anti-MEL mAb conjugated onto QBs resulted in weaker FIT and lower inhibition. Therefore, 0.3 mg anti-MEL mAb per mL QB was selected.
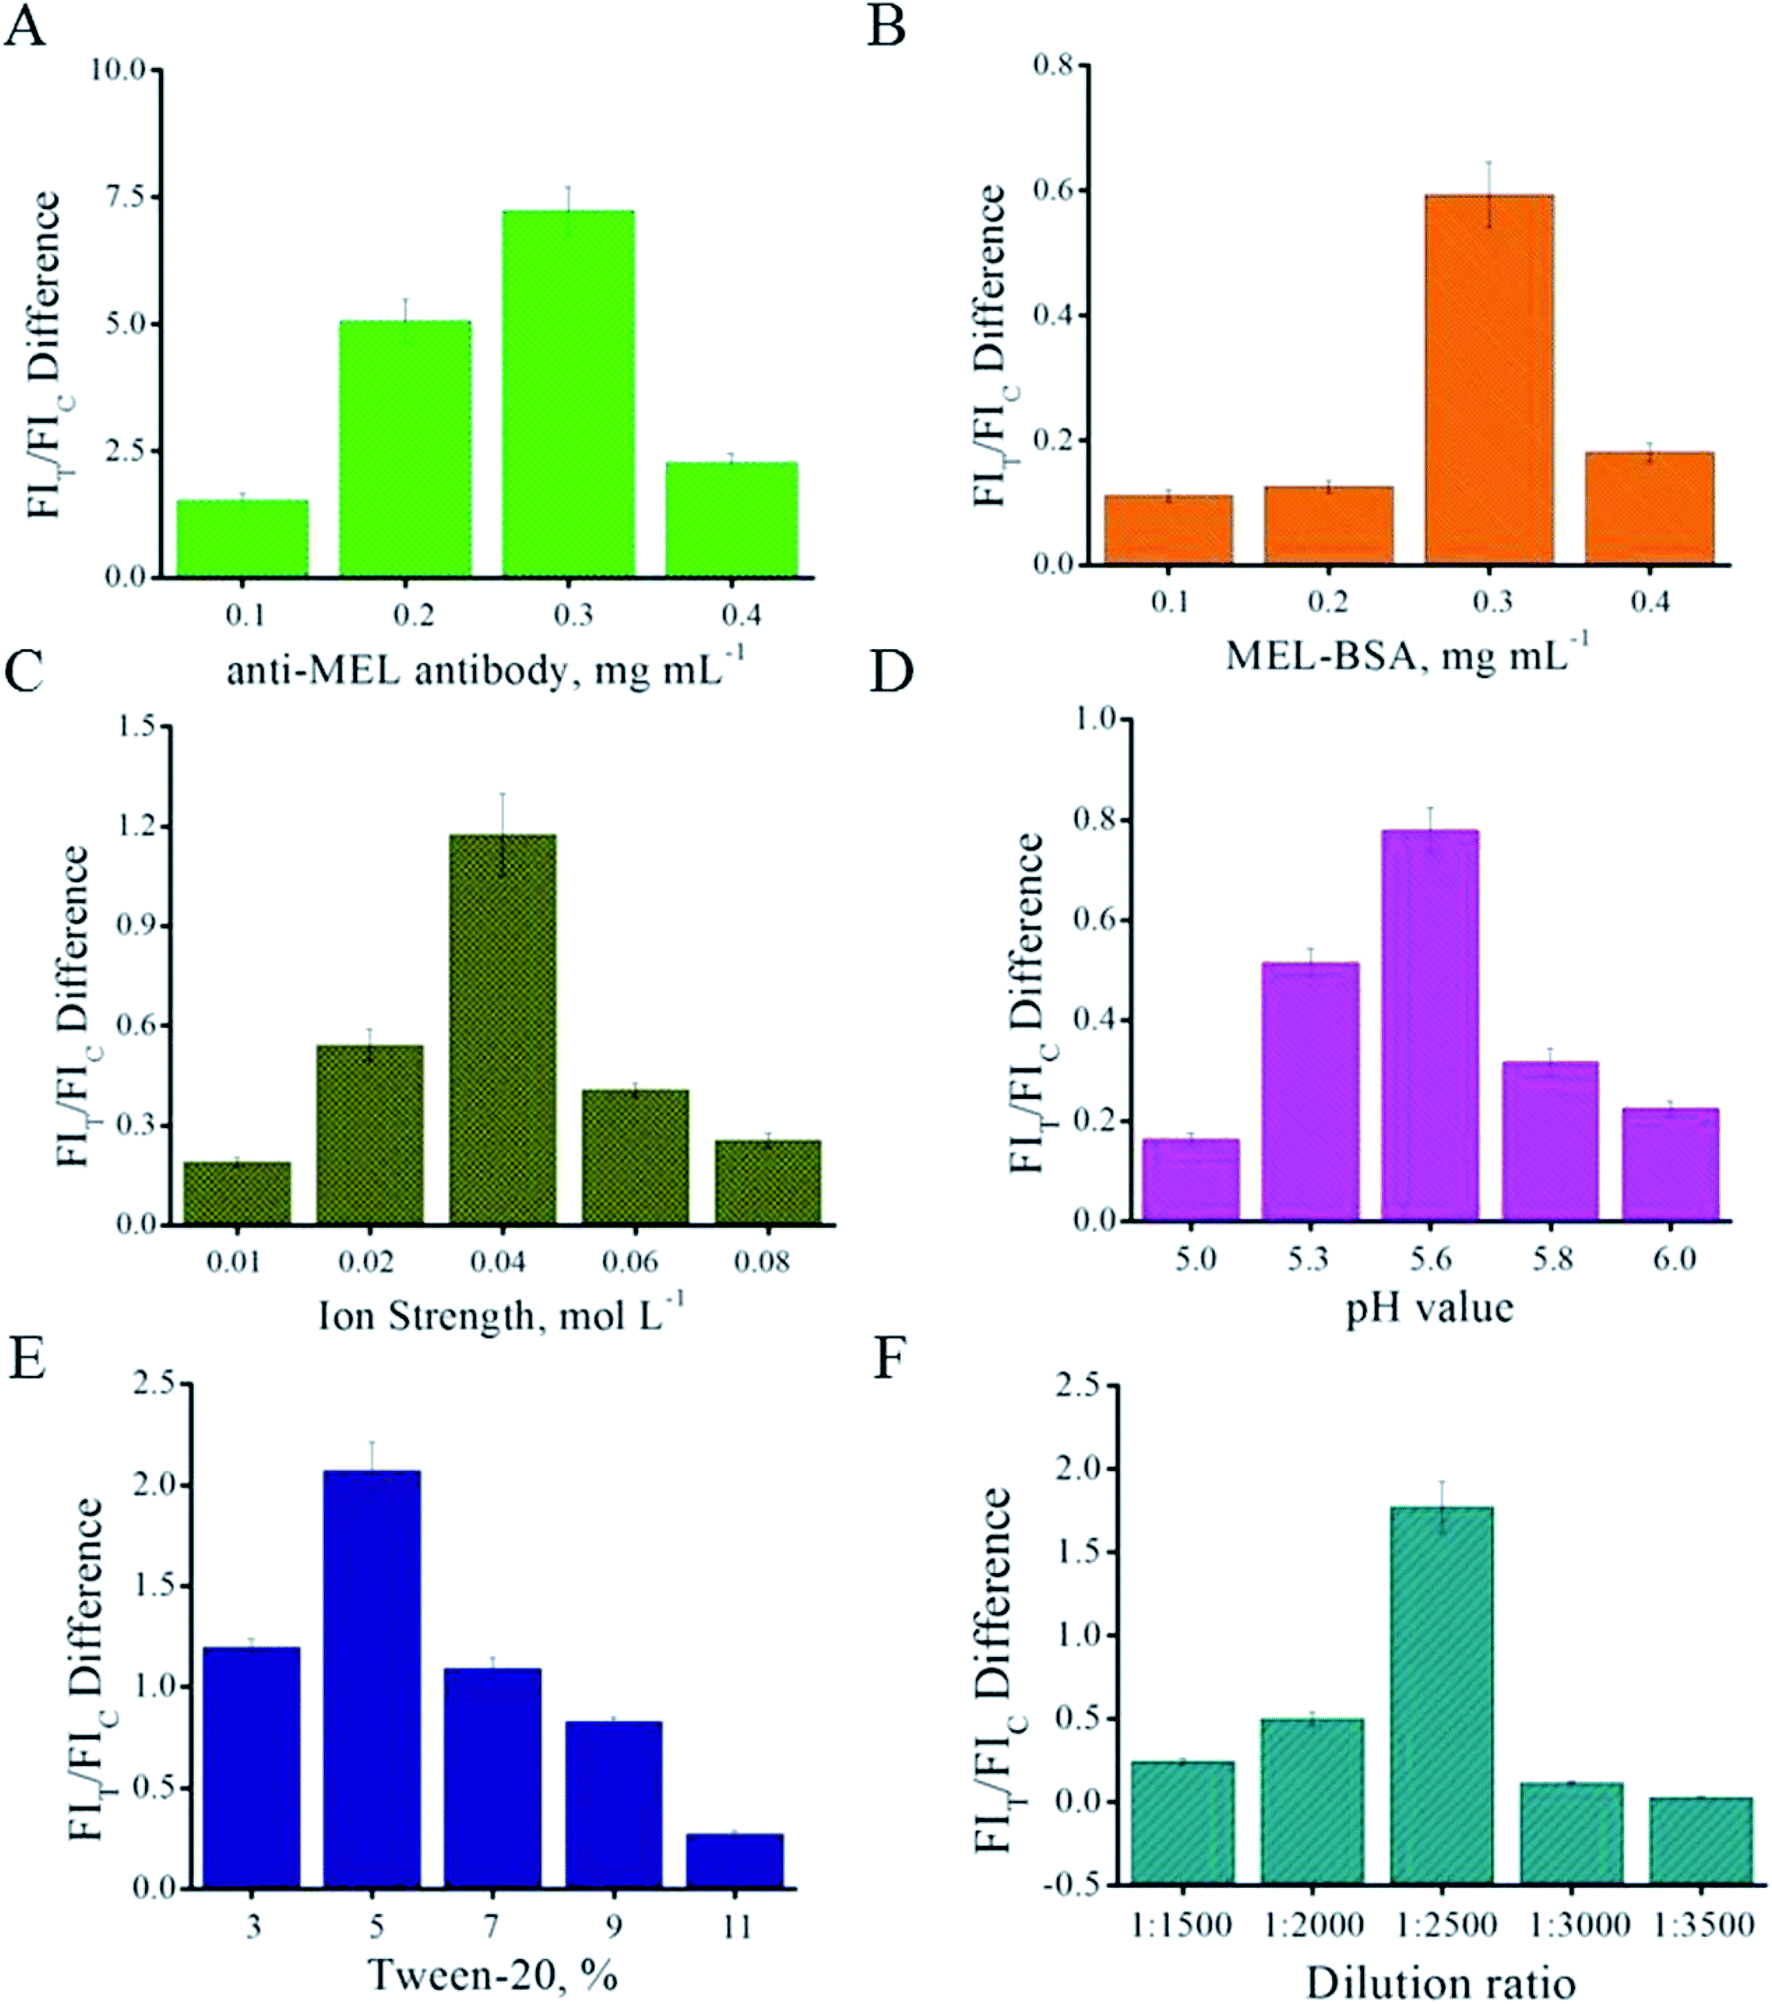 | ||
| Fig. 2 Effect of (A) proper amount of anti-MEL antibody on QB surface; (B) MEL-BSA in the T line; (C) ion strength; (D) pH value; (E) Tween 20; (F) dilution ratio of QB-mAb. | ||
Fig. 2B shows that 0.3 mg mL−1 MEL-BSA on the T line is the optimal concentration yielding the strongest FIT difference; therefore, this concentration was chosen and applied in the subsequent experiment for further optimization.
Instead of locating the QB-mAbs on the glass fiber, the QB-mAbs were premixed with the sample solution before ICA to improve reproducibility.18 The core parameters affecting the ICA results were systematically optimized, such as ion strength of the PB buffer, pH value, Tween 20 surfactant, dilution ratio of signaling probe QB-mAbs, and ICA time interval. The optimal parameters were determined based on the competitive inhibition mode and expressed as the FI difference in the T line (FIT difference). The ion strength of the PB buffer was evaluated from 0.01 to 0.08 mol L−1. As shown in Fig. 2C, the FIT difference sharply increases from 0.01 to 0.04 mol L−1, and the most obvious inhibition can be observed at the ion strength of 0.04 mol L−1 of the PB solutions. Higher ion strength might disturb specific recognition and lower ion strength might lead to nonspecific recognition, both of which would result in a weaker FIT difference. Therefore, the ion strength of 0.04 mol L−1 of the PB buffer was chosen. The pH value can directly influence the electric charge on the proteins and their immune reaction. The pH values of 5.0, 5.3, 5.6, 5.8, and 6.0 of the PB buffer were compared to determine the optimal pH value for use in the QB-ICA system. As shown in Fig. 2D, the FIT difference reached its peak at pH 5.6; therefore, pH 5.6 was selected. Tween 20 is one of the most common surfactants in the ICA system that can be used to improve dissolution and specific recognition. As shown in Fig. 2E, Tween 20 of 5% (v/v) was chosen; a higher concentration would increase the viscosity of the PB buffer, ultimately leading to weaker FIT and FIT difference. A proper QB-mAb dilution ratio was determined, and 1:2500 was chosen as the ratio at which the FIT difference was the strongest (Fig. 2F) and the T line on the ICA system was sufficiently bright (Fig. 3A) to be visible and read out by the strip reader. After optimization, the optimal parameters were 0.3 mg anti-MEL mAb modified on 1 mL QB, 0.3 mg mL−1 MEL-BSA immobilized on the T line, ion strength of 0.04 moL L−1, pH value at 5.6, Tween 20 of 5% (v/v), and QB-mAbs dilution ratio of 1:2500.
 | ||
| Fig. 3 (A) Photo of the test strips obtained using a Gel Imager for different dilution ratios of QB-mAb under UV excitation of 365 nm; (B) effect of immunoreaction dynamics of FIT, FIc, and FIT/FIC; (C) photograph of the test strips with increasing spiked MEL concentrations under UV excitation of 365 nm from a handheld UV electric torch; (D) standard inhibition curve for MEL. | ||
Under the abovementioned optimized parameters, immunological kinetics analysis was performed to evaluate the ICA process.20 The development of FIT, FIC, and FIT/FIC against QB-ICA time was plotted. Fig. 3B shows that the FIT value gradually decreases from the starting point of the 6th min, and the FIC line increases in the first 10 min and began to decrease thereafter. On the contrary, the FIT/FIC ratio reached a relatively constant value at 18 min and was relatively stable thereafter. For better reproducibility, the FIT/FIC ratio at 18 min was chosen for establishing the subsequent calibration; further, the advantage of the FIT/FIC ratio over FIT and FIC was also proven in another report.18
Analytical performance of the QB-ICA system
Fig. 3C shows that FIT decreased with an increase in the MEL concentration from 0.039 (left) to 0.64 (right) ng mL−1. A calibration curve was established by plotting the (1 − B/B0) × 100% values against the MEL concentrations from 0 to 1.25 ng mL−1 in the logarithmic scale, where B0 and B represent the competitive inhibition rates based on the FIT/FIC ratio value of the negative control (MEL of 0 ng mL−1) and a MEL concentration of 1.25 ng mL−1 in a standard PB buffer solution (Fig. 3D), respectively. All the measurements were carried out in triplicate and the linear range of the fitting equation y = 100.90 − 103.90/(1 + (x/0.13)1.78) ranged from 0.06 to 0.28 ng mL−1. The QB-ICA results of the spiked MEL standard solutions were also compared among the proposed ICA based on AuNPs and a quanta-sensor using QD as the signaling probe, as shown in Table 1. MEL-induced color change results from the interaction between negatively charged materials, like QD or AuNPs, and positively charged MEL; this color change was proportional to the MEL concentration, usually within a wide linear range.17,19 However, the sensitivity is limited when compared with the other ICA methods, as listed in Table 1. Meanwhile, the LOD improved by 3.5 times when using QB as the signaling probe when compared with that of ICA that used AuNPs as the signaling probe. In this study, the LOD was defined as the MEL concentration, which leads to 10% inhibition (IC10) of the negative control.| Methods | Analytical range (ng mL−1) | LOD (ng mL−1) | IC50 (ng mL−1) | Reference |
|---|---|---|---|---|
| a Not reported. | ||||
| QB-ICA | 0.06–0.28 | 0.04 | 0.13 | This work |
| GNPs-ICA | 1–200 | 1.4 | NRa | Zhong et al., 2016 (ref. 15) |
| Silver microarray chip | 16.3–152.6 | 16.3 | 49.9 | Li et al., 2017 (ref. 21) |
| GNPs- sensor | 126–126 × 106 | 132.3 | NR | Chen et al., 2019 (ref. 19) |
| QD-sensor | 1.26–7560 | 1.6 | NR | Singh et al., 2018 (ref. 17) |
The CR value was calculated by using the following equation:22 CR% = [(IC50 MEL)/(IC50 analog)] × 100. The results showed that the structural ATZ and CMZ analogs, as well as other common pollutants such as CAP, KNM, SPM, and AFM1, show no CR, which confirms the specificity of the proposed ICA (Fig. 4).
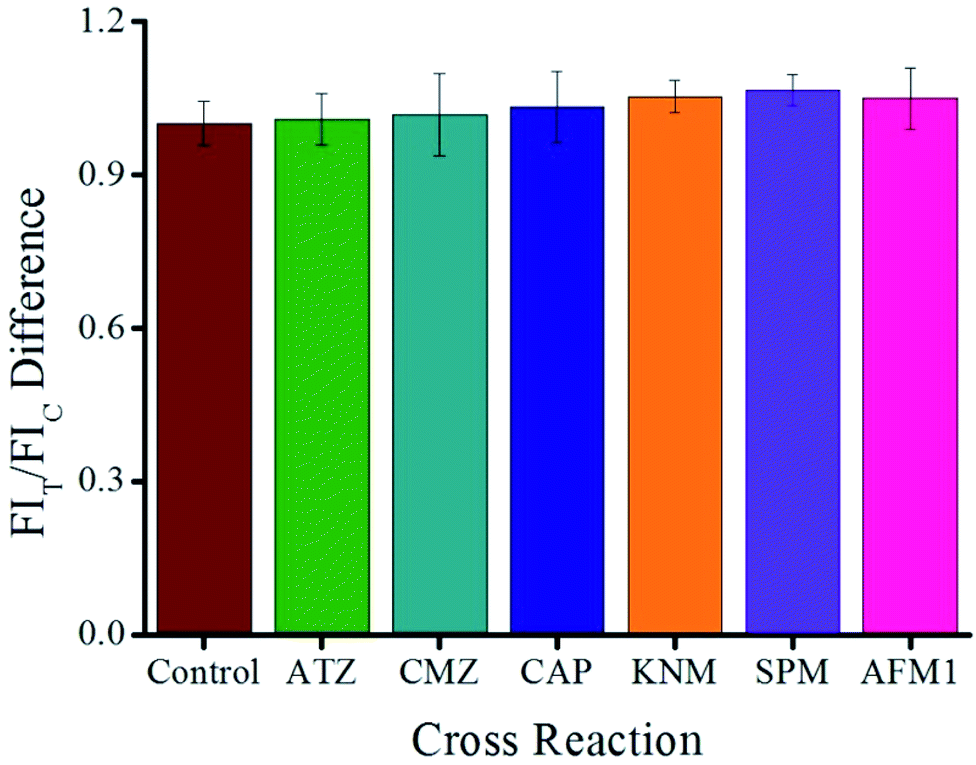 | ||
| Fig. 4 Selectivity evaluation of the proposed QB-ICA for MEL against other analogs at a concentration of 10 ng mL−1. | ||
The accuracy and precision of the proposed QB-ICA were evaluated by the intra-assay and inter-assay recoveries, respectively; the spiked concentrations were 0.04, 0.08, and 0.16 ng mL−1. The intra-assay was carried out by using three replicates; the inter-assay was performed by using the three replicates obtained from the intra-assay. As shown in Table 2, the average recoveries ranged from 85.1 to 110.4%, which are acceptable for ICA.23,24
| MEL concentration (ng mL−1) | Intra-assay | Inter-assay | ||||
|---|---|---|---|---|---|---|
| Mean (n = 3) | Recovery (%) | CV (%) | Mean (n = 3) | Recovery (%) | CV (%) | |
| 0.04 | 0.044 | 110.4 | 6.6 | 0.038 | 95.3 | 5.4 |
| 0.08 | 0.068 | 85.1 | 9.1 | 0.076 | 95.9 | 6.1 |
| 0.16 | 0.15 | 93.8 | 8.2 | 0.17 | 106.3 | 6.6 |
Determination of MEL in spiked milk samples and comparative study
The established QB-ICA was applied to detect MEL-spiked milk samples with or without pretreatment. The results listed in Table 3 reveal that the LOD values could improve by about 18.4 times than those of the ICA performed without pretreatment, which proves the strong matrix effect of pure milk. In this study, the trichloroacetic-acid-based pretreatment took about 5 min and was practicable for onsite use.For the comparative study, the QB-ICA system was compared with a commercial ELISA kit when using MEL-spiked pure milk samples. The results shown in Table 4 suggest that the two systems yield similar data. Furthermore, the proposed QB-ICA took nearly 23 min including pretreatment, while the same for the ELISA kit was 90 min. The results validated the applicability of the proposed QB-ICA strategy.
Conclusions
A QB-ICA for MEL detection was established in this work. Under optimal conditions, the LOD for MEL under standard solutions was 0.04 ng mL−1, which is an improvement of approximately 35 times when compared with that of the ICA for MEL based on AuNPs; further, the LOD of ICA with the proposed pretreatment is 18.4 times better than that obtained from ICA without pretreatment. The recoveries of the QB-ICA system were comparable with those of a commercial ELISA kit. In conclusion, the proposed QB-ICA system was a worthwhile alternative assaying strategy for the onsite quantitative detection of trace MEL for food safety monitoring. Moreover, quantitative ICA results could be further uploaded to a database, paving the way for the dynamic monitoring of food safety based on artificial intelligence networks.Conflicts of interest
The authors declare that the research was conducted in the absence of any commercial or financial relationships that could be constructed as a potential conflict of interest.Acknowledgements
This work was supported by the National Key Special Plan Projects (No. 2018YFC1604000).References
- I. E. Paul, A. Rajeshwari, T. C. Prathna, A. M. Raichur, N. Chandrasekaran and A. Mukherjee, Anal. Methods, 2015, 7, 1453–1462 RSC.
- M. Yin, L. Zhao, Q. Wei and H. Li, RSC Adv., 2015, 5, 32897–32901 RSC.
- T. Lang, S. Pang and L. He, Anal. Methods, 2015, 7, 6426–6431 RSC.
- F. Gao, Q. Ye, P. Cui and L. Zhang, J. Agric. Food Chem., 2012, 60, 4550–4558 CrossRef CAS PubMed.
- G. Venkatasami and J. R. Jr Sowa, A rapid, acetonitrile-free, Anal. Chim. Acta, 2010, 665, 227–230 CrossRef CAS PubMed.
- N. Kumar, R. Seth and H. Kumar, Anal. Biochem., 2014, 456, 43–49 CrossRef CAS PubMed.
- J. Du, Z. Wang, X. Peng and J. Fan, Ind. Eng. Chem. Res., 2015, 54, 12011–12016 CrossRef CAS.
- J. Du, S. Yin, L. Jiang, B. Ma and X. Chen, Chem. Commun., 2013, 49, 4196–4198 RSC.
- Q. Lu, J. Zhao, S. Xue, P. Yin, Y. Zhang and S. Yao, Analyst, 2015, 140, 1155–1160 RSC.
- C. Xiao, X. Zhang, J. Liu, A. Yang, H. Zhao, X. Li, Y. He and Z. Yuan, Anal. Methods, 2015, 7, 924–929 RSC.
- H. Kuang, W. Chen, W. J. Yan, L. G. Xu, Y. Y. Zhu and L. Q. Liu, Biosens. Bioelectron., 2011, 26, 2032–2037 CrossRef CAS PubMed.
- Q. Q. Zhou, N. Liu, Z. W. Qie, Y. Wang, B. A. Ning and Z. X. Gao, J. Agric. Food Chem., 2011, 59, 12006–12011 CrossRef CAS PubMed.
- J. Song, F. Y. Wu, Y. Q. Wan and L. H. Ma, Microchim. Acta, 2014, 181, 1267–1274 CrossRef CAS.
- W. Zhou, X. Gao, D. B. Liu and X. Y. Chen, Chem. Rev., 2015, 115, 10575–10636 CrossRef CAS PubMed.
- Y. H. Zhong, Y. J. Chen, L. Yao, D. P. Zhao, L. Zheng, G. D. Liu, Y. W. Ye and W. Chen, Microchim. Acta, 2016, 183(6), 1989–1994 CrossRef CAS.
- R. Bilan, F. Fleury, I. Nabiev and A. Sukhanova, Bioconjugate Chem., 2015, 26, 609–624 CrossRef CAS PubMed.
- S. Singh, V. Kaur, N. Kumar, M. Garg, S. K. Pandey and V. K. Meena, Sens. Actuators, B, 2018, 273, 505–510 CrossRef CAS.
- M. Ren, H. Xu, X. Huang, M. Kuang, Y. Xiong, H. Xu, Y. Xu, H. Chen and A. Wang, ACS Appl. Mater. Interfaces, 2014, 6, 14215–14222 CrossRef CAS PubMed.
- X. Y. Chen, W. Ha and Y. P. Shi, Talanta, 2019, 194, 475–484 CrossRef CAS PubMed.
- X. Huang, Z. P. Aguilar, H. Li, W. Lai, H. Wei, H. Xu and Y. Xiong, Anal. Chem., 2013, 85, 5120–5128 CrossRef CAS PubMed.
- Z. H. Li, Z. M. Li, J. D. Jiang and D. K. Xu, Food Control, 2017, 73, 994–1001 CrossRef CAS.
- C. Li, W. Luo, H. Xu, Q. Zhang, H. Xu, Z. P. Aguilar, W. Lai, H. Wei and Y. Xiong, Food Control, 2013, 34, 725–732 CrossRef CAS.
- V. Semenova, J. Schiffer, E. Steward-Clark, S. Soroka, D. Schmidt, M. Brawner, F. Lyde, R. Thompson, N. Brown and L. Foster, J. Immunol. Methods, 2012, 376, 97–107 CrossRef CAS PubMed.
- Y. Bai, Z. Liu, Y. Bi, X. Wang, Y. Jin, L. Sun, H. Wang, C. Zhang and S. Xu, J. Agric. Food Chem., 2012, 60, 11618–11624 CrossRef CAS PubMed.
Footnote |
| † The authors contribute equally to the work. |
| This journal is © The Royal Society of Chemistry 2020 |