
 Open Access Article
 This Open Access Article is licensed under a Creative Commons Attribution-Non Commercial 3.0 Unported Licence
Suspended anode-type microbial fuel cells for enhanced electricity generation
Yiyang Liua,
Xiaoyan Sunb,
Di Yina,
Lankun Caia and
Lehua Zhang *ac
*ac
aState Environmental Protection Key Laboratory of Environmental Risk Assessment and Control on Chemical Process, School of Resources and Environmental Engineering, East China University of Science and Technology, Shanghai 200237, China. E-mail: lezhanghua@163.com; Fax: +86 21 6425 3321; Tel: +86 21 6425 3321
bInstitute of Hydrobiology, Chinese Academy of Sciences, Wuhan 430072, China
cShanghai Institute of Pollution Control and Ecological Security, Shanghai 200092, P. R. China
First published on 9th March 2020
Abstract
Electricity generation in microbial fuel cells can be restricted by a few factors, such as the effective area of the anode for biofilm attachment, diffusion limitation of substrates and internal resistance. In this paper, a suspended anode (carbon-based felt granule)-type microbial fuel cell was developed to make full use of the volume of the anode chamber and provide a larger surface area of the anode for the growth of exoelectrogenic bacteria. The current collector was rotated in the anodic chamber to contact with the suspended granules intermittently and achieve better mixing. The open-circuit voltage reached steady state at around 0.83 V. The maximum power density obtained from each scenario increased steadily with the increase in mixing rate. The internal resistance decreased when the rotational rate and the content of the carbon granules were increased. The maximum power density reached 951 ± 14 mW m−3 with a corresponding minimum internal resistance of 162.9 ± 3.5 Ω when the mass of carbon granules was 50 g and the rotational rate was 300 rpm. The suspended microbes made negligible contribution to the power density. The microbial fuel cell with a higher content of carbon granules had lower coulombic efficiency and lower relative abundance of exoelectrogenic bacteria.
1. Introduction
Typical domestic wastewater contains about 1.23 kW h m−3 of energy, which is mainly in the form of biodegradable organics. Microbial fuel cells (MFCs) have received much attention because of their potential applications in wastewater treatment and energy generation.1–5 An exoelectrogen is an essential part of MFCs and has many special properties, including the metabolism of organics and the generation of electrons.6 The electrons generated by exoelectrogenic bacteria spontaneously transfer to the anode, which generates a low current flow in an external circuit in a clean and mild condition. However, the practical applications of MFCs are restricted by many issues including the low voltage output and the difficulty of scaling up, which are discussed in more detail below.7Anode performance is one of the key factors affecting the MFC performance. It has been investigated extensively in many previous studies.8 The internal resistance of MFCs, effective area of biofilms attached to the anode surface, and mass transfer rate of substrates play important roles in anode performance. However, high internal resistance increases the loss of electrical energy during transfer, the effective area of biofilms can directly affect the electricity generation, and the low mass transfer rate causes concentration polarization, especially in large-scale reactors.9–11
Special configurations of MFCs have been studied to solve these issues. For example, membrane electrode assembly-type MFCs were applied to reduce the internal resistance,12 and fluidized electrodes or packed-bed electrodes acting as three-dimensional electrodes were used to overcome the diffusion limitations of substrates and enhance the effective area of biofilms in large reactors.13–18 A fluidized electrode-type MFC was analyzed to assess the capacitive characteristics of granular activated carbon (GAC) particles.19 Electrons can be stored in the GAC particles in the form of an electric double layer, and a continuous current can be generated with intermittent contact between the GAC particles and the current collector.20 In these MFCs, the electrode acts as a filter and can be easily clogged by suspended solids or biofilms, which can block the mass-transfer channel frequently during the operation. These issues need to be solved before building a large reactor using these electrodes. A carbon-based flow-through composite anode configuration was constructed as carbon-based particles have been proved to enhance the power generation in microbial fuel cells.21
In our study, a novel configuration of MFC reactor was developed, which indicated the untapped potential of larger MFCs. Specifically, charges were stored in carbon-based felt granules suspended in the anodic chamber, while the current flowed with the intermittent contact between the carbon-based felt granules and a rotational current collector. In order to solve the problems of flow blockage in previous fluidized electrode-type MFCs, the anode was suspended in a large reactor rather than flowing in a channel. Compared to the traditional 3D porous anode material with magnetic stirring, the current collector could contact with the anode better but did not assemble and block. The suspended anode-typed MFC was designed to make full use of the reactor volume, to overcome diffusion limitations, and to reduce the internal resistance. Furthermore, we investigated the bio-capacitor characterization of the electrodes and the performance of the MFCs, including the maximum power density, internal resistance, and coulombic efficiency (CE). In addition, the community structure of the microbes was investigated.
2. Material and methods
2.1 MFC construction
Two bottles with a volume of 1000 mL were used as the anodic and cathodic chambers of the MFC (Fig. 1). The anode and cathode chambers were separated by a cation exchange membrane (CEM, CMI7000, DuPont, USA) with an effective area of 11.7 cm2. In the anodic chamber, a titanium rod in a tree-like structure was used as an agitator blade and a current collector. The anode consisted of 50 g (dry weight) of carbon felt granules with the diameter of about 5 mm. The cathode was a piece of graphite felt (Beihai Carbon Co., Ltd. China) with a working area of 50 cm2 (5 cm × 10 cm). The two electrodes were connected by a slip ring (Senring Electronics Co., Ltd. China), which provided a continuous electrical connection through brushes on stationary contacts. The external resistance was 1000 Ω.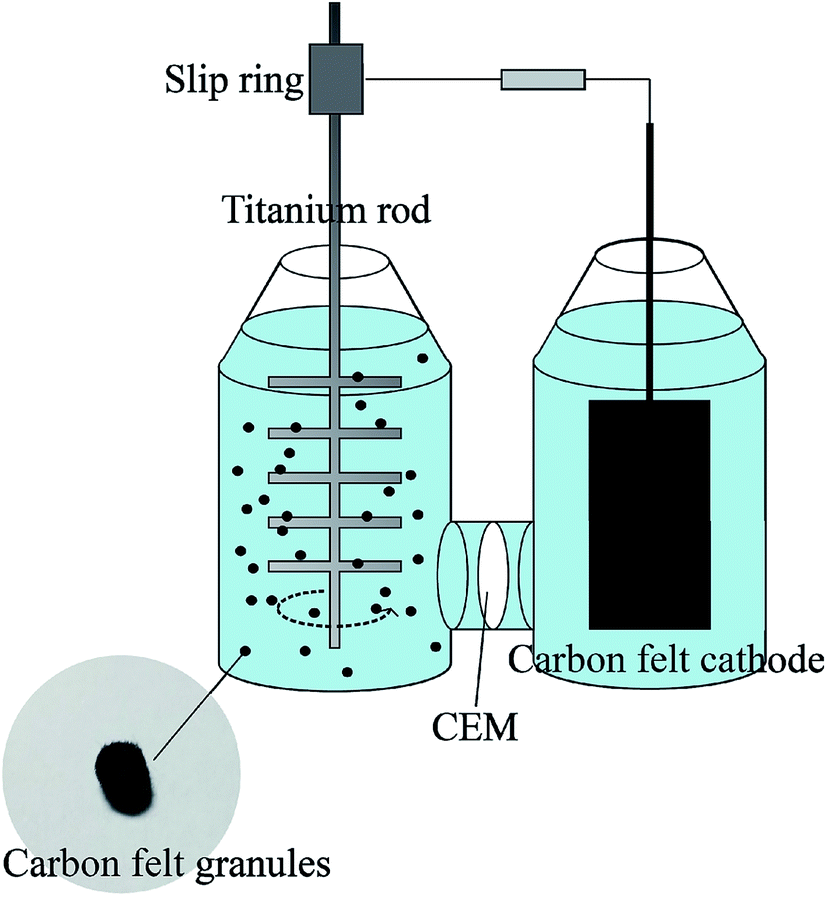 | ||
| Fig. 1 Schematic diagram of the suspended anode-type microbial fuel cell. | ||
2.2 MFC inoculation
The granules of carbon felt were inoculated with activated sludge from the bioreactor of a municipal wastewater treatment plant (Yangchen Co., Ltd. Shanghai, China). The nutrient medium of the anolyte contained (per liter) 1.64 g NaAc, 0.5 g NH4Cl, 0.1 g MgSO4, 0.08 g CaC12, 0.1 g KCl, 1.0 g NaCl, 12.54 g Na2HPO4·12H2O, 2.45 g NaH2PO4·2H2O, and 1.0 mL trace elements (pH = 7.0).22 The activated sludge was added into the medium (1![[thin space (1/6-em)]](https://www.rsc.org/images/entities/char_2009.gif) :4) and mixed at 200 rpm for 30 min. The supernate was taken out and purged with N2 for 10–15 min to achieve anaerobic conditions,23 and this bacterial suspension was used to acclimate the anode. The cathode solution contained 32.92 g K3[Fe(CN)6], 12.54 g Na2HPO4·12H2O, and 2.45 g NaH2PO4·2H2O per liter (pH = 7.0). All the MFCs were operated at room temperature (28 ± 1 °C).
:4) and mixed at 200 rpm for 30 min. The supernate was taken out and purged with N2 for 10–15 min to achieve anaerobic conditions,23 and this bacterial suspension was used to acclimate the anode. The cathode solution contained 32.92 g K3[Fe(CN)6], 12.54 g Na2HPO4·12H2O, and 2.45 g NaH2PO4·2H2O per liter (pH = 7.0). All the MFCs were operated at room temperature (28 ± 1 °C).
2.3 MFC operation
Two reactors were constructed as specified above, and were designated as MFC-1 and MFC-2 (as parallel experiments), respectively. The voltage output was measured and recorded using a data acquisition system (RBH8223, RBH, Beijing, China). The current was calculated from the voltage and external resistance. Electricity generation in the two reactors showed similar effects, so the power density and internal resistance data for the different contents of granules and the rotating rate are reported as in MFC-1.An on–off experiment was employed in this study to investigate whether the granules of carbon felt with biofilm could store electrons. After running steadily for 6 h, the agitator of the anodic chamber in the MFCs was switched off for 2 h and then switched on again, while the voltage output was recorded.
2.4 Analyzes and calculation
After start-up of the MFC, the anode granules covered by biofilms were imaged using scanning electron microscopy (SEM) (JSM-6360LV, JEOL, Japan) after achieving a steady performance. The energy dispersive X-ray spectroscopy system (EDS) (Falcon, EDAX, USA) equipped with the SEM was employed for elemental analysis. The samples were pre-treated by glutaraldehyde and were dehydrated by ethanol prior to analysis.Power density curves and polarization curves were obtained by a steady state discharging method to determine the internal resistance and power density,10 with the volume of the anolyte used to calculate the power density. Briefly, the external resistance was changed stepwise from 10000 Ω to 10 Ω and maintained at each resistance for 5 min to keep steady while the voltage was recorded.24 The maximum power density was the peak of the power density curves. The slope of the polarization curves in the ohmic polarization region represented the internal resistance.
The suspended anode was added into the anodic chamber step by step and for each period it took 2 weeks to remain stable. The microbes at different periods of the same reactor after stable operation was achieved were sampled to investigate the community structure of the microbes by 16S rDNA sequences (Sangon Biotech, Shanghai, China). Here, 5 pieces of the anode were taken out from anodic chamber under sterile conditions and immersed in a sterile medium. Then, they were magnetically mixed at 200 rpm for 5 min, and 2 mL of the medium was sampled. The sequencing platform was Miseq 2 × 300 bp and the amplified region was V3–V4. The taxonomic tree was drawn up and the top 20 microbes with the highest relative abundances were marked by an asterisk and different phylum were indicated by different colors. The outer ring represents a thermodynamic chart in which the samples were marked by different colors and the samples with higher relative abundance are shown in a darker color.
The coulombic efficiency (CE) was calculated of the different contents of granules in 200 rpm according to the following equation:
 485 C mol−1), and V is the volume of the anodic chamber (L). The chemical oxygen demand (COD) of the samples was measured by the potassium dichromate titration method and the concentration of NaAc was calculated.
3. Results and discussion
3.1 MFC start-up
The voltage output during the acclimatization is shown in Fig. 2. The initial voltage was around 0.10 V and fluctuated in the first 30 h, then steadily increased to 0.25 V within 20 h and maintained this level for 100 h. After 150 h, the voltage output was increased rapidly, which means the exoelectrogens were in a logarithmic growth phase. This was accompanied by a rapid increase in the voltage to around 0.63 V after 200 h. Simultaneously, the open-circuit voltage reached 0.83 V. The start-up time was longer than that of the traditional two-chamber MFCs because of the scouring from stirring by the current collector, which meant it was hard for the biofilm to attach to the anode. | ||
| Fig. 2 Temporal profiles of the voltage output during the acclimatization. | ||
3.2 Biocapacitor characterization of the electrodes
The anodic granules of the MFCs were characterized by SEM-EDS, and the results are shown in Fig. 3 and Table 1. As shown in Fig. 3a and b, the biofilm was attached to the carbon felt. From the morphology, it was indicated that microorganisms, like bacillus and coccus, were attached to the granules. The EDS results show the element ratio difference from the carbon felt before and after acclimatization. The percentages of N, O, and other trace element in the microbes were significantly higher than in the control, which indicated that the biofilm was attached.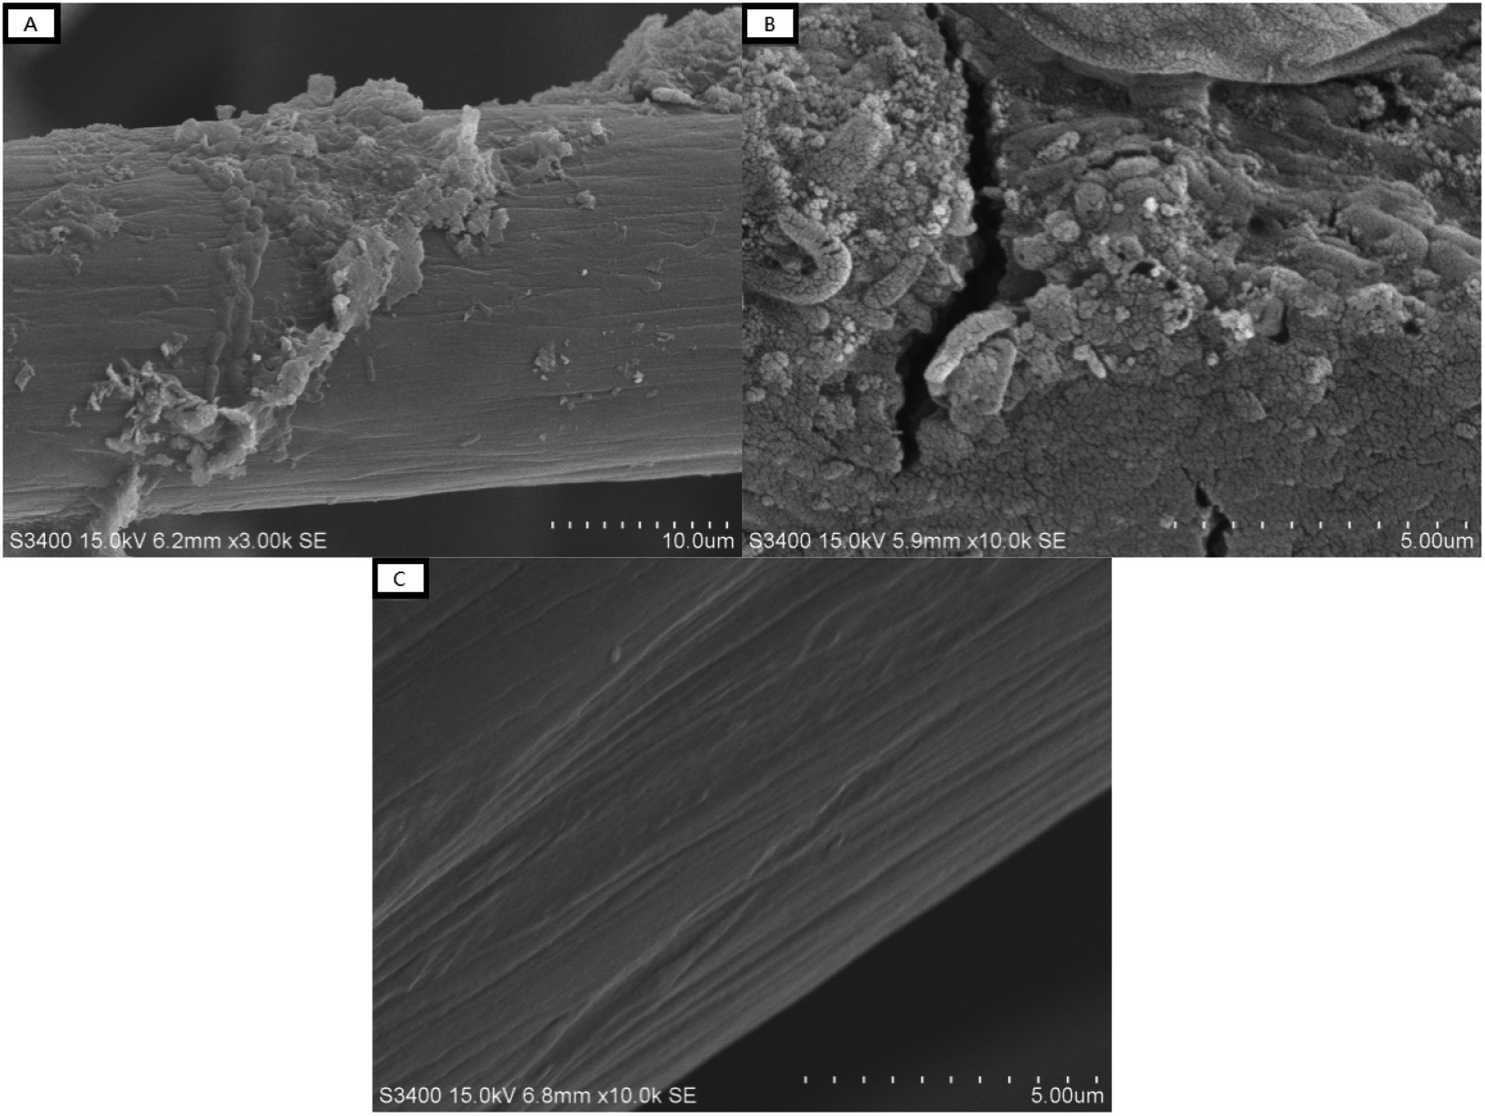 | ||
| Fig. 3 Images obtained by SEM of the anodic granules after acclimatization ((A) at 3000×, (B) at 10000×) and the granules without microorganisms (i.e., the control, (C) at 10000×). | ||
| Element | Anodic granules (%) | Control group (%) |
|---|---|---|
| C | 69.88 | 91.33 |
| N | 8.83 | 03.84 |
| O | 15.66 | 04.82 |
| Na | 0.29 | — |
| Mg | 0.32 | — |
| P | 2.22 | — |
| S | 0.33 | — |
| K | 0.16 | — |
| Ca | 0.75 | — |
| Fe | 1.57 | — |
3.3 Voltage output from the on–off experiment
The voltage output from the on–off experiment is shown in Fig. 4. When the agitator was off, the voltage output immediately decreased from 0.45 V to about 0.15 V. This could be because without mixing only a few bioanodes were contacted with the current collector and the internal resistance increased. As a consequence, electrons generated by the biofilms could not transfer to the current collector, and were stored in the granules of the carbon felt. Borsje et al. found that the charge could be stored in the electric double layer of single carbon granules.19 When the agitator was restarted, a peak value with around 50 mV variations appeared in the voltage output curve, which verified the capacitance characteristic of the carbon felt granules and that the current was not only produced at the moment of contact. A similar finding was reported by Liang et al., who reported that the power density of MFCs instantly increased by applying transient-state regulation (i.e., alternating open-circuit and closed-circuit) because of the anode capacitance.24 Carbon-based capacitive anodes were used in the MFCs in some pervious studies to enhance the performance of the MFCs, as the capacitance of carbon-based granules mainly consists of electrode double-layer capacitance.18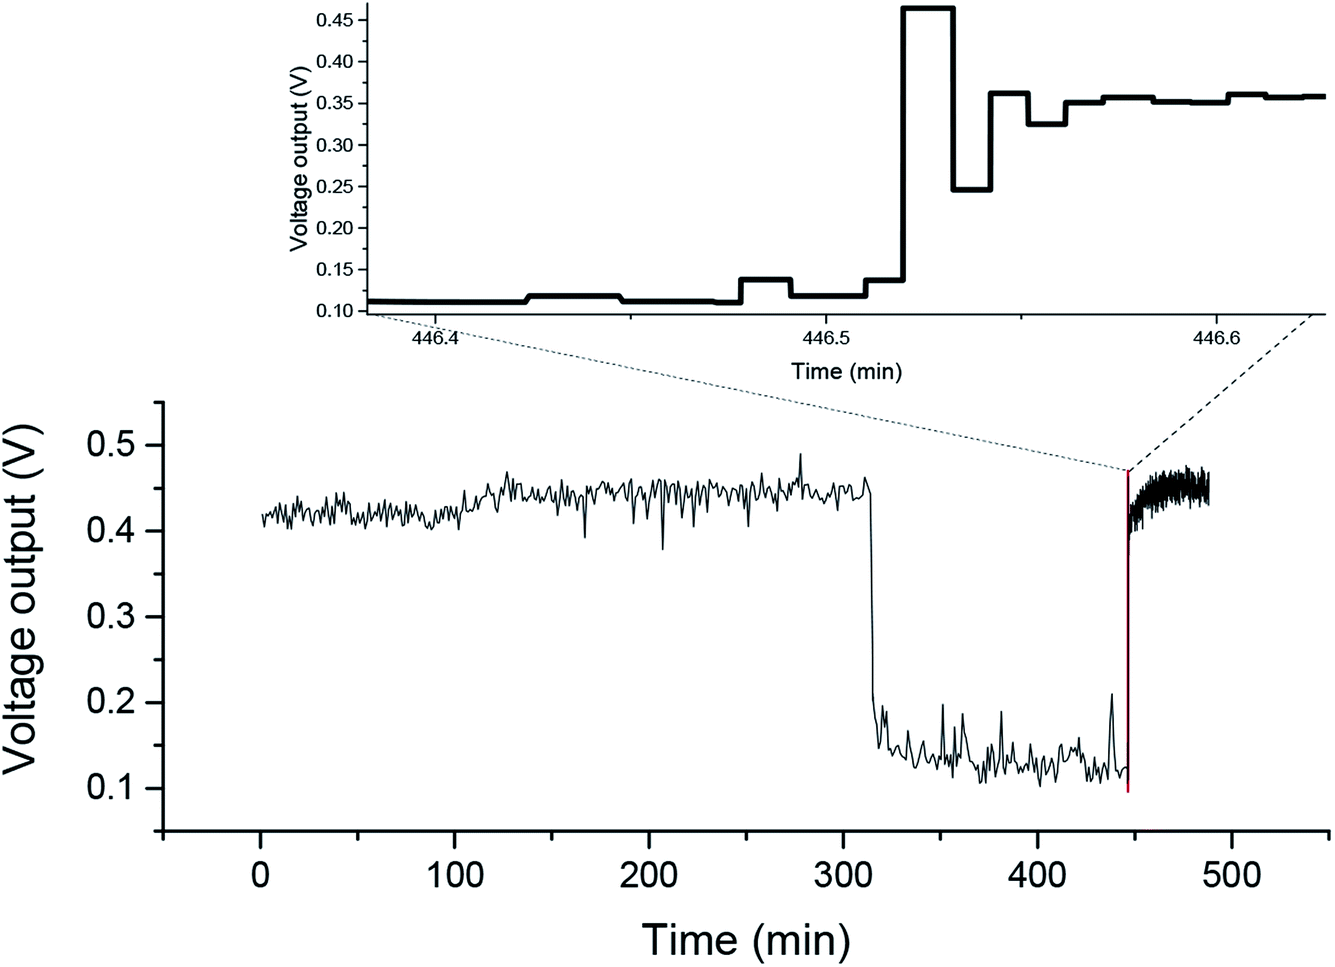 | ||
| Fig. 4 Temporal profiles of the voltage output from the on–off experiment, and the changing portions of 0.2 min intervals after switching on are enlarged (top). | ||
3.4 Electricity generation of the microbial fuel cells
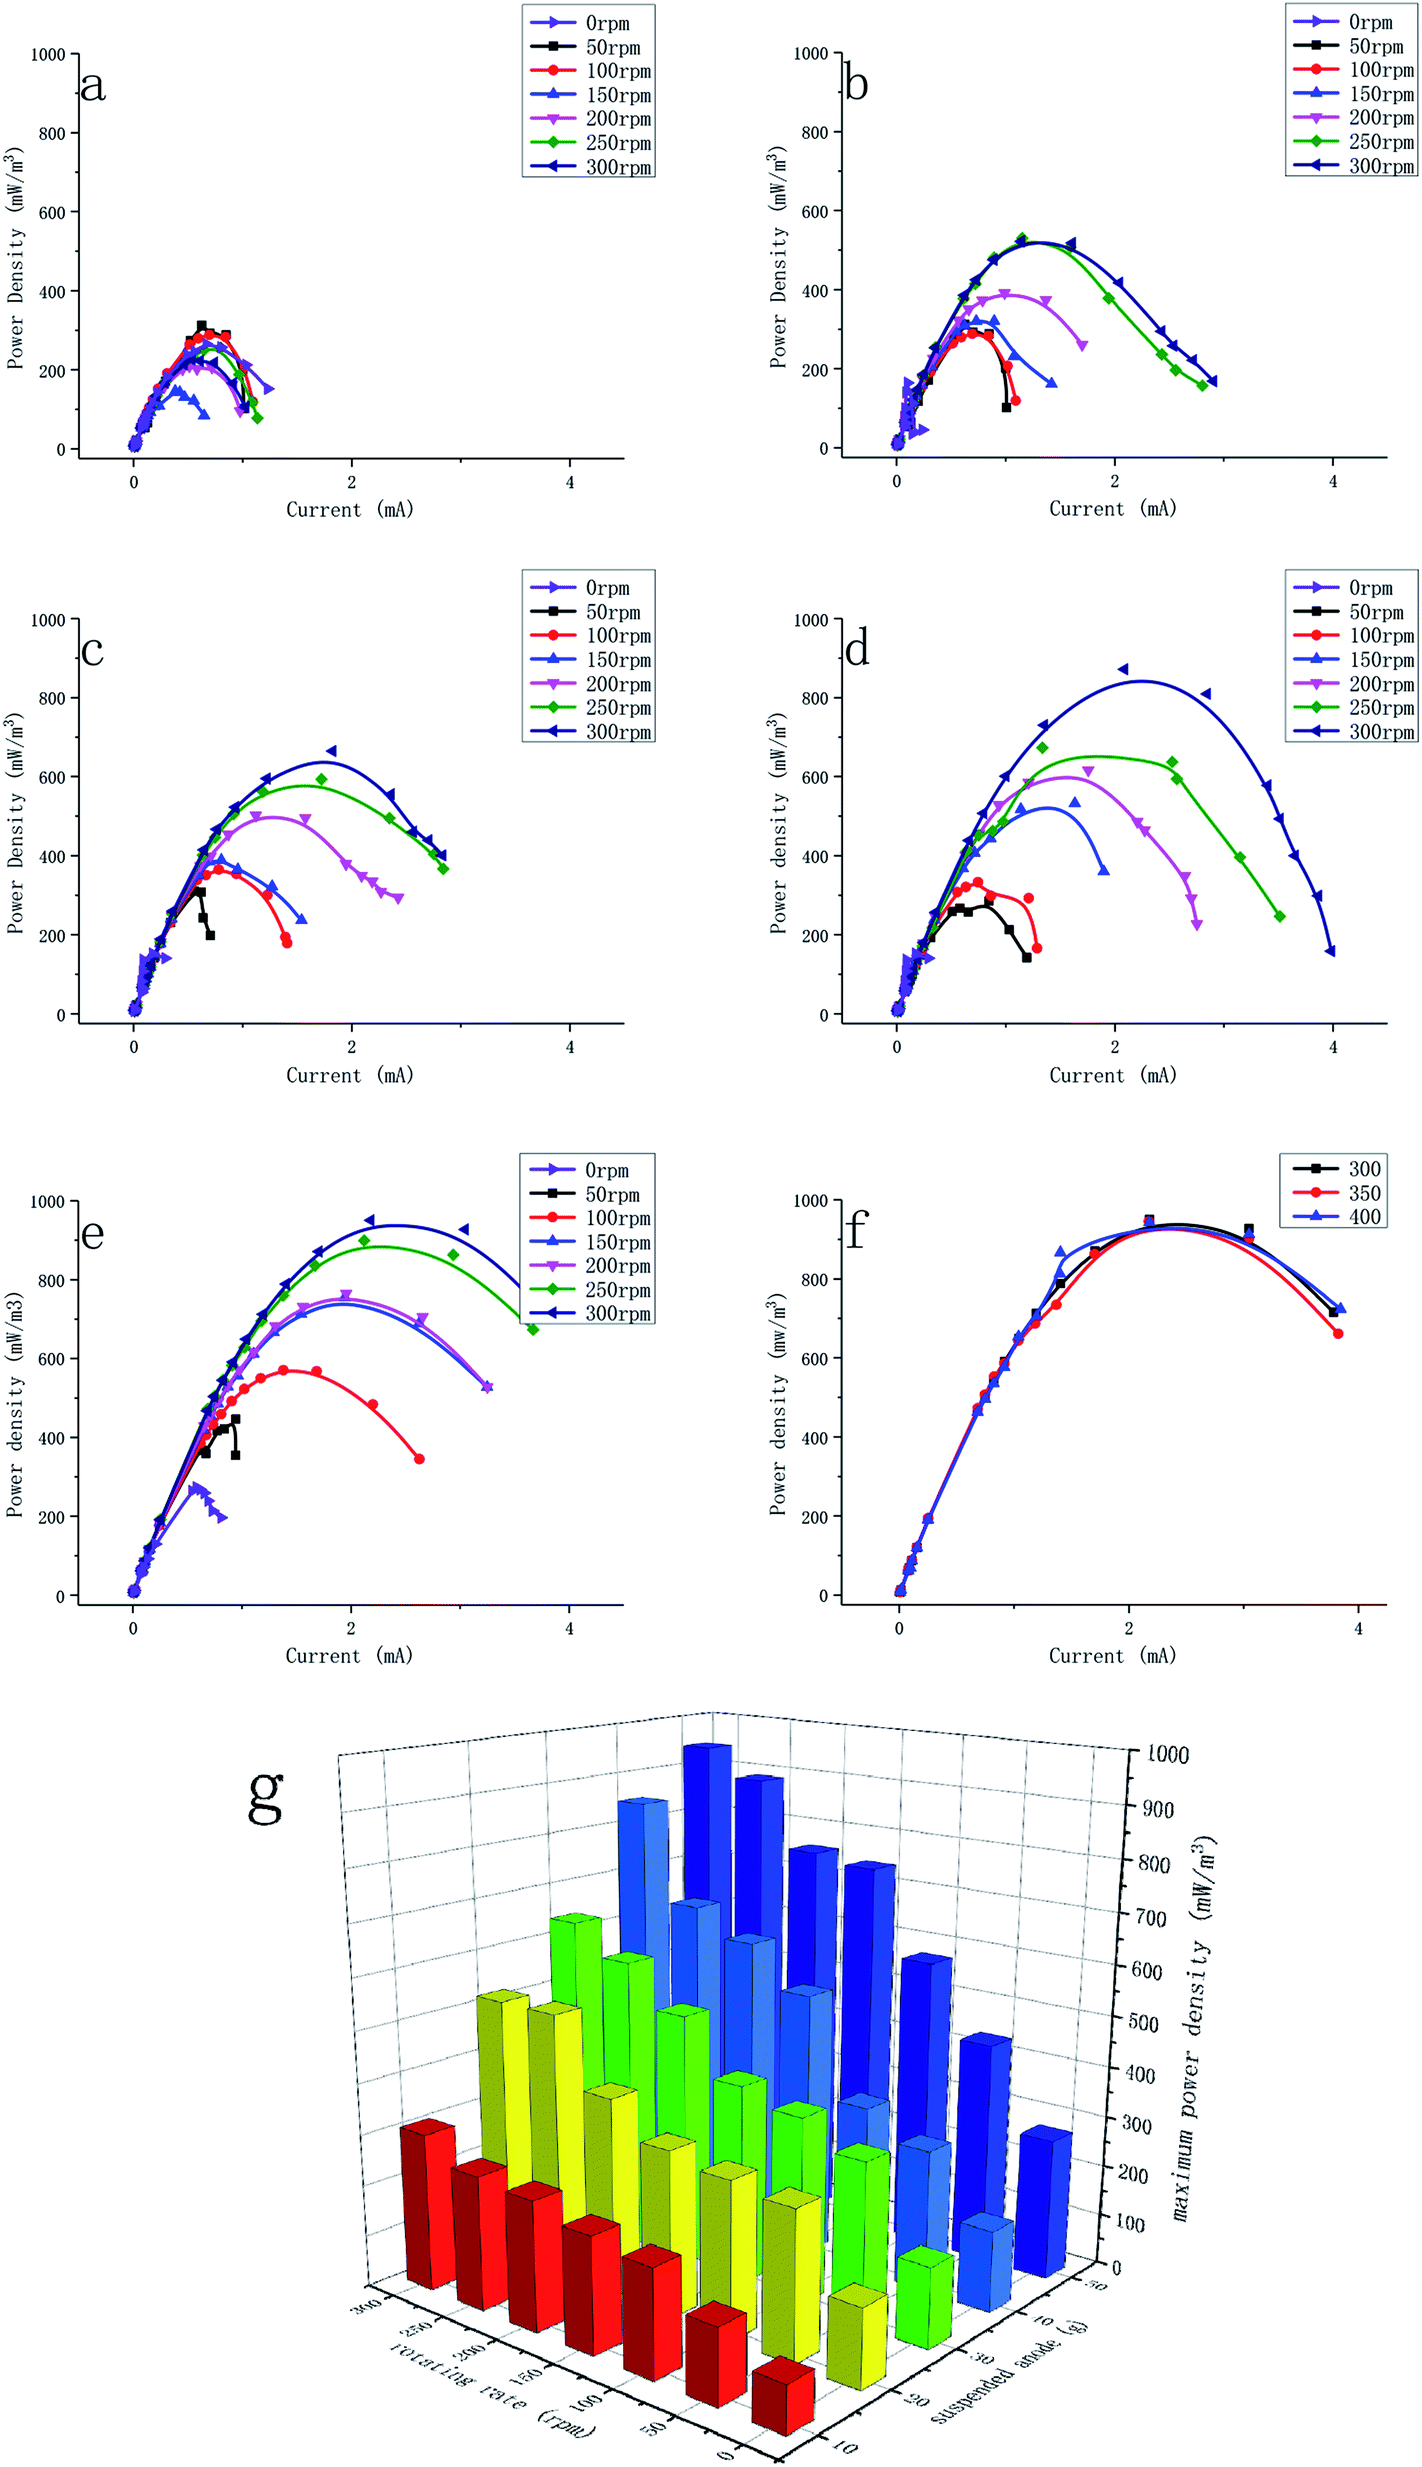 | ||
| Fig. 5 Power density curves obtained at different rotational rates with 10 g (a), 20 g (b), 30 g (c), 40 g (d), and 50 g (e) of suspended anode and at a high rotational rate with 50 g of suspended anode (f). The maximum power density of each condition is shown (g). | ||
There was a positive correlation between the power density and the amount of carbon granules. The power density reached 951 ± 14 mW m−3 with 50 g of the suspended anode and 300 rpm, while the current density was 2.18 A m−3. The current density of 0 rpm with 50 g of anode was 0.58A m−3. When the rotating rate was 0 rpm, the anode granules were deposited at the bottom of anodic chamber and were in continuous contact with the current collector. It could be found that the suspension plays an important role in the performance. The Imax values from similar studies are compared in Table 2, but it is to be noted that these researchers used different methods to make the capacitive anode contact with current collector intermittent. It was found that the gas lift, liquid pump, and stirring rate all increased the performance of MFCs. A larger amount of carbon granules could provide more sites for biofilm attachment and hence could increase the exoelectrogen concentration, which is beneficial for electron transfer. In addition, having more carbon granules provides a larger capacitance, which allows the electrons generated by exoelectrogens to be stored more effectively. However, when higher than 50 g, agitation in the MFCs became hard and some granules could not have continuous contact with the current.
| Reactor type | Vtotal (mL) | Imax (A m−3 at Pmax) | Reference |
|---|---|---|---|
| Suspended carbon felt granules anode MFC with stirring | 1000 | 2.18 | This work |
| MFC-fluidized bed membrane bioelectrochemical reactor with liquid pump | 1700 (700 in MFC) | 20 (13 in MFC) | 26 |
| Membrane-free fluidized-bed MFC with pump | 1000 | 0.8 | 27 |
| Fluidized capacitive bioanode (GAC) MFC with gas lift | 2102 | 0.7 | 14 |
| Fluidized GAC anode with stirring | 7 | 260 | 20 |
To make a comparison between power generation and stirring, the stirring power was calculated in theory by the following equation:28
| P = Npρn3d5 |
After calculating, the power was 4.19 W with 50 g of the suspended anode and 300 rpm when the power density reached the maximum. In fact, the power generated by the MFC could not offset the power of stirring, while the maximum total power of this reactor was 0.93 W. This study focused on the effect of stirring on the performance of this anode. Furthermore, in further applications, low-grade energy, like wind energy, could be used to offset the power consumption.
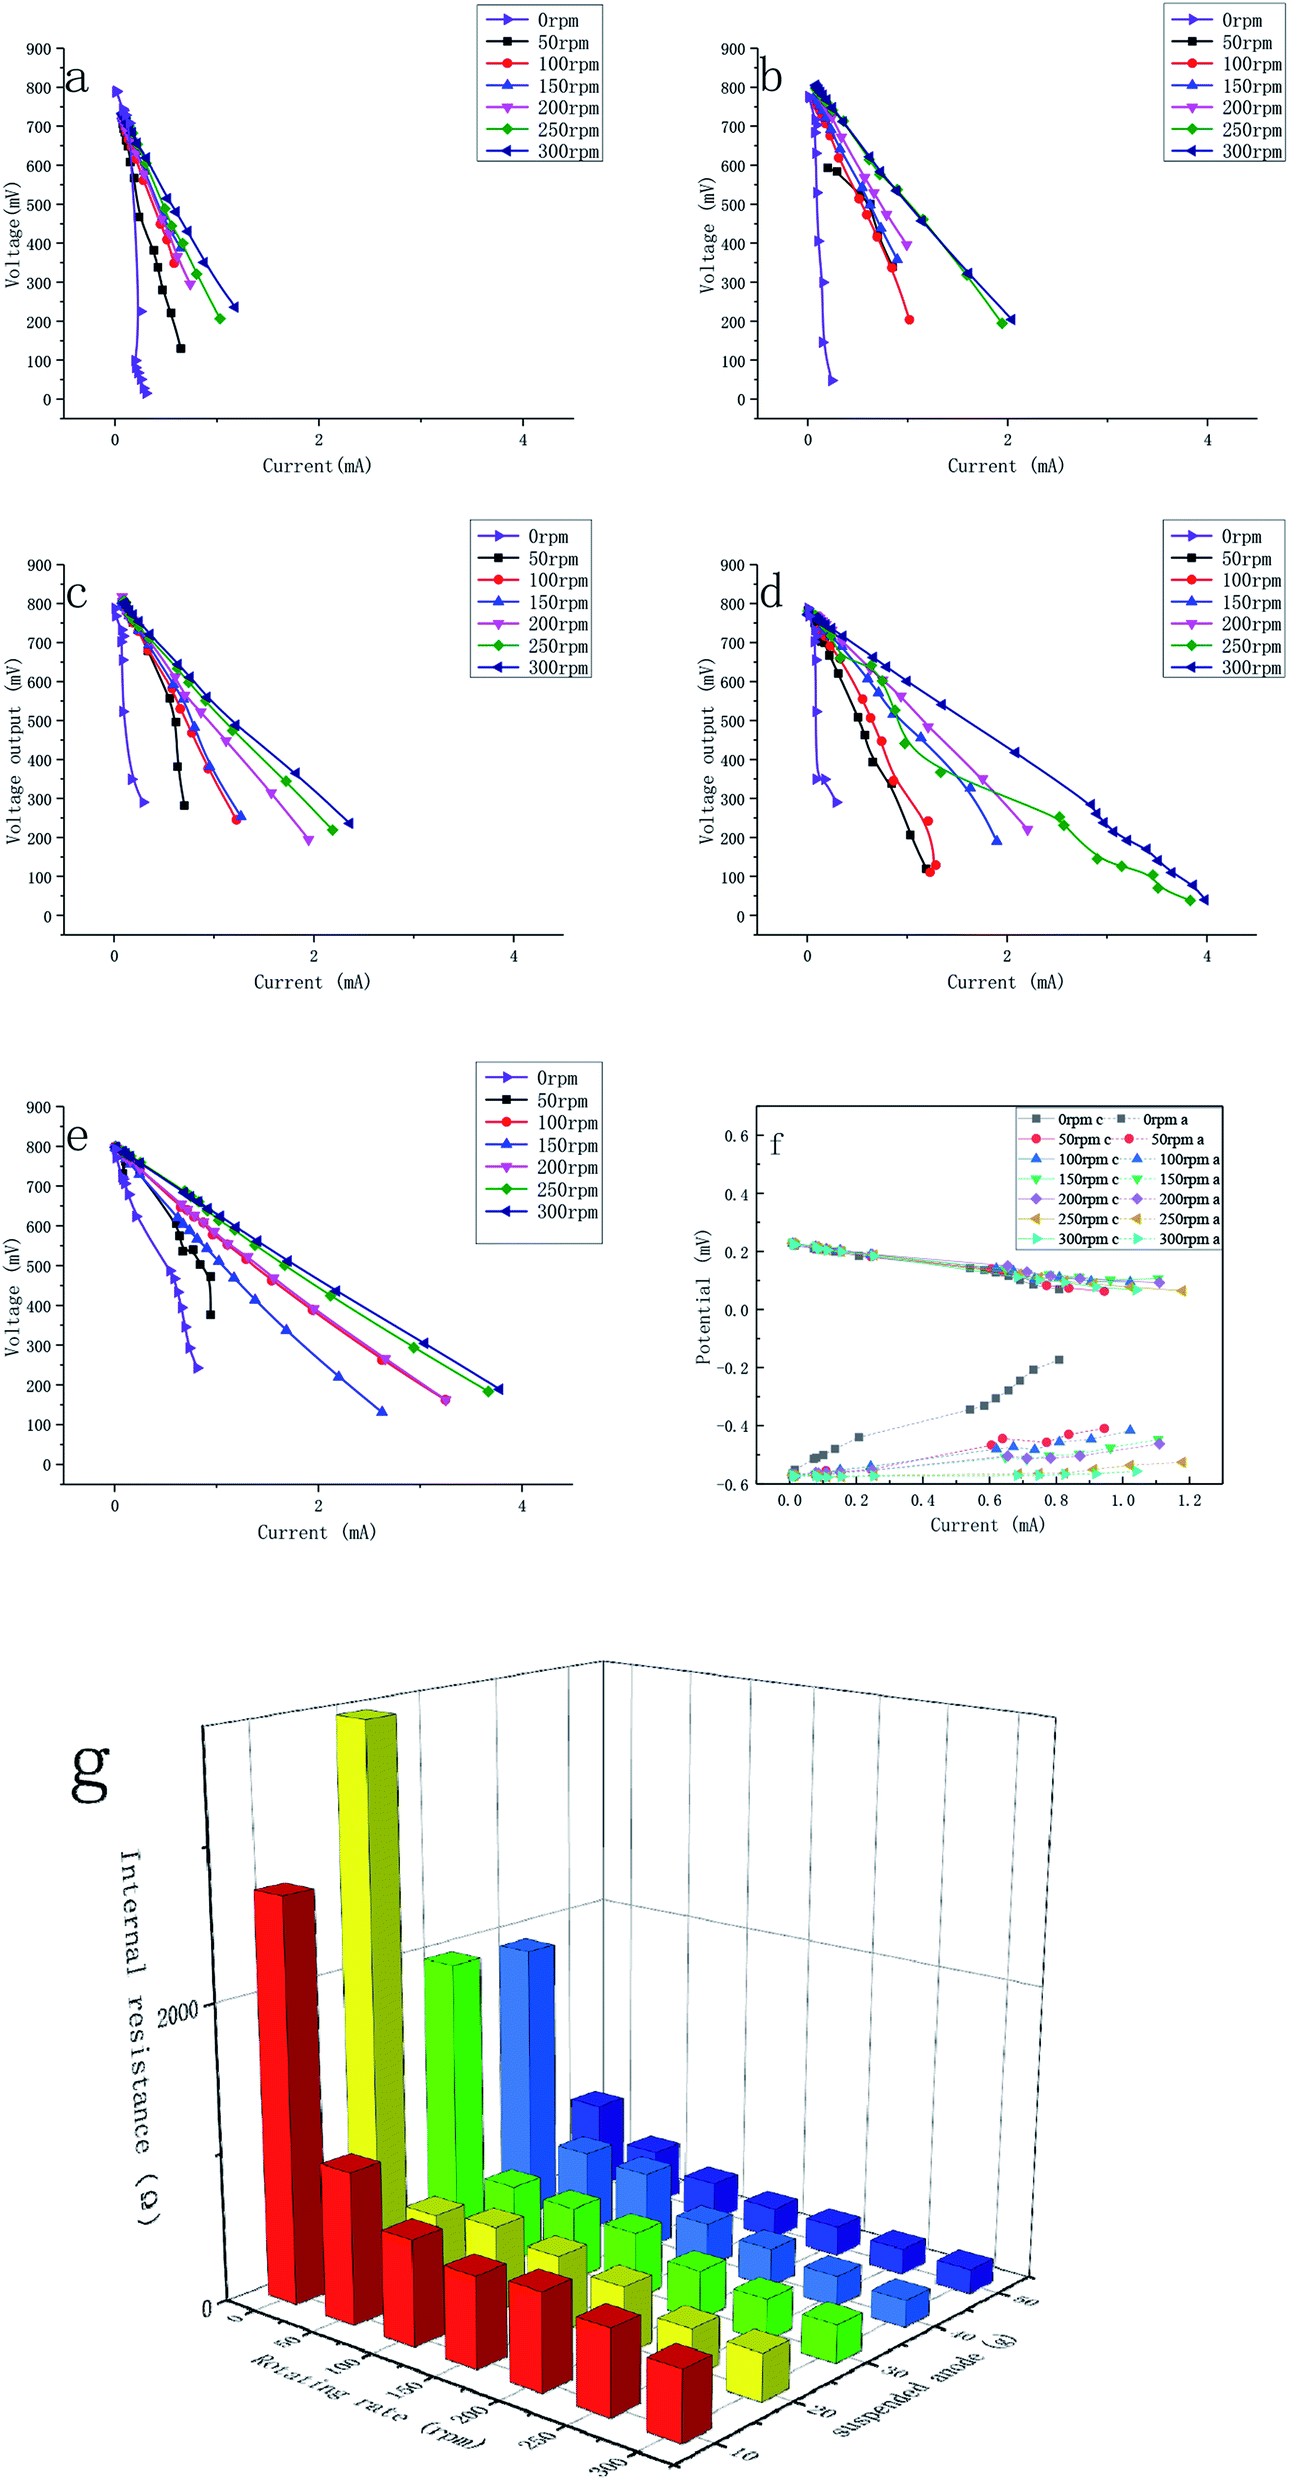 | ||
| Fig. 6 Polarization curves obtained at different rotational rates and contents of suspended anode ((a) 10 g, (b): 20 g, (c) 30 g, (d) 40 g, (e) 50 g). (f) The cathode potential (solid line) and anode potential (dotted line) (vs. Ag/AgCl) in a 50 g batch. (g) The internal resistance of each condition is shown. | ||
In the low current density range, the activation polarization affected the polarization predominantly. We can find that it had no discernible effects on the polarization in this experiment. That was attributed to the high temperature of 28 °C and high roughness and specific surface of the electrodes, which were proven to decrease the activation polarization in a previous study.7
In the middle current density range, the ohmic polarization played a dominant role. The internal resistance between the suspended anode and cathode was used to describe the resistance between the suspended anode and current collector since the resistance between the current collector and cathode was stable. The internal resistance decreased when the rotational rate and the content of carbon granules increased (Fig. 6f). In the MFCs (Fig. 6a–e), the polarization was intense when the rotational rate was zero, which could be related to the high internal resistance. Without mixing, the current collector could not contact with the suspended anode efficiently, and thus the internal resistance was large. The minimum internal resistance was 162.9 ± 3.5 Ω, which was achieved with 300 rpm and 50 g of suspended anode. The decrease in internal resistance was because the higher rotational rate enabled a better contact between the carbon granules and the current collector, and thus quicker electron transfer. The higher the content of carbon granules was, the higher the electrical conductivity. However, the current became higher not only because of the low internal resistance, but also because of the greater contact and higher electron flow. It is more accurate to describe this parameter as the apparent internal resistance. There is little discussion of the internal resistance in fluidized anode-type MFCs because the actual internal resistance is hard to identify due to the complex contact. The minimum apparent internal resistance of a membrane-free fluidized-bed MFC that used a pump to maintain intermittent contact was 902 Ω, which had a similar volume to our reactor.27
In the high current density range, some batches, e.g., 0 rpm in both batches and 50 rpm in the 30 g (c), 40 g (d), and 50 g (e) batches of carbon granule, were affected by concentration polarization, especially at a low rotational rate and high content of carbon granules. When the rotational rate was low, the diffusion rate in the anolyte was lower. High shear forces led to faster diffusion in biofilms, and thus no pronounced concentration polarization occurred.29 A high content of carbon granules caused concentration polarization because faster agitation was needed to achieve a homogeneous distribution of the granules.
725 ± 10943 Ω. This indicated that the suspended bacteria had a negligible effect on the electricity generation. The following reasons can account for this phenomenon: (1) the bacteria in suspension had no place to attach and were scoured by agitation, making it difficult to form stable biofilms; (2) the carbon granules acted as capacitors in the MFCs. Electrons generated by microbes had no place to be stored without the suspended granules and thus the electrons were hard to be transferred to the current collector.3.5 Coulombic efficiency
The coulombic efficiency was calculated to investigate the performance of the suspended anode-type MFCs. As shown in Fig. 7, the CE of the MFCs was 20.6 ± 2.2% in the test with 10 g of suspended carbon granules and decreased gradually with the increase in the amount of carbon granules. The CE was relatively low in this experiment and could be affected by many operational parameters.30 The intermittent contact between the anode and the current collector could be one of the key reasons for the low CE given the higher biodegradation rate of non-exoelectrogens.31 The electron transfer could only happen when the anode is in contact with the current collector, otherwise the electrons generated by the MFCs are temporarily stored in the carbon granule anode, but there are some energy losses too during the charge period and storage. Volume also plays an important role in CE since a large volume involves a complex microbial community. Considering the large concentration of microbes, especially non-exoelectrogens, in these experiments, the electron-transfer resistance was low under the suspended set-up for the anode. Suspending the anode causes another issue in MFCs: the direct contact between the suspended anode and the current collector is reduced, which could affect the community structure of the microbes in MFCs. In general, the CE of MFCs with mixed strains was lower than that with pure cultures because the energy was partially consumed by bacteria that could not generate electrons.32,33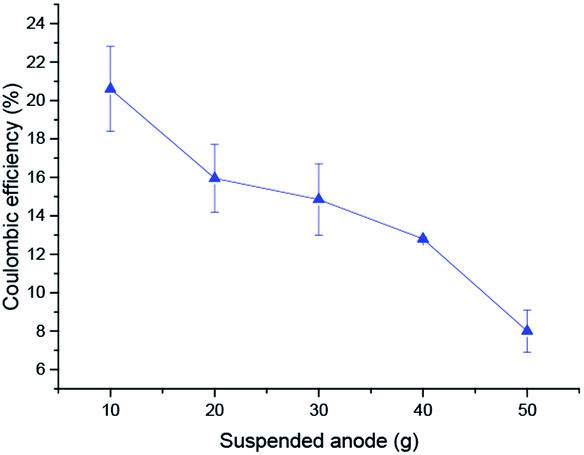 | ||
| Fig. 7 Coulombic efficiency tests with different amounts of suspended anode. The coulombic efficiency was determined in a full batch experiment with a rotational rate of 200 rpm. | ||
3.6 Microbial communities
In order to investigate the decrease of CE, the community structure of the microbes was determined by 16S rDNA analysis. The taxonomic tree of 100 kinds of microbes with the highest relative abundance in MFCs is shown in Fig. 8, where A1 is the sample of inoculated sludge, B1 is from sampling when the granules content was 20 g L−1 in MFC-1, while C1 was 40 g L−1.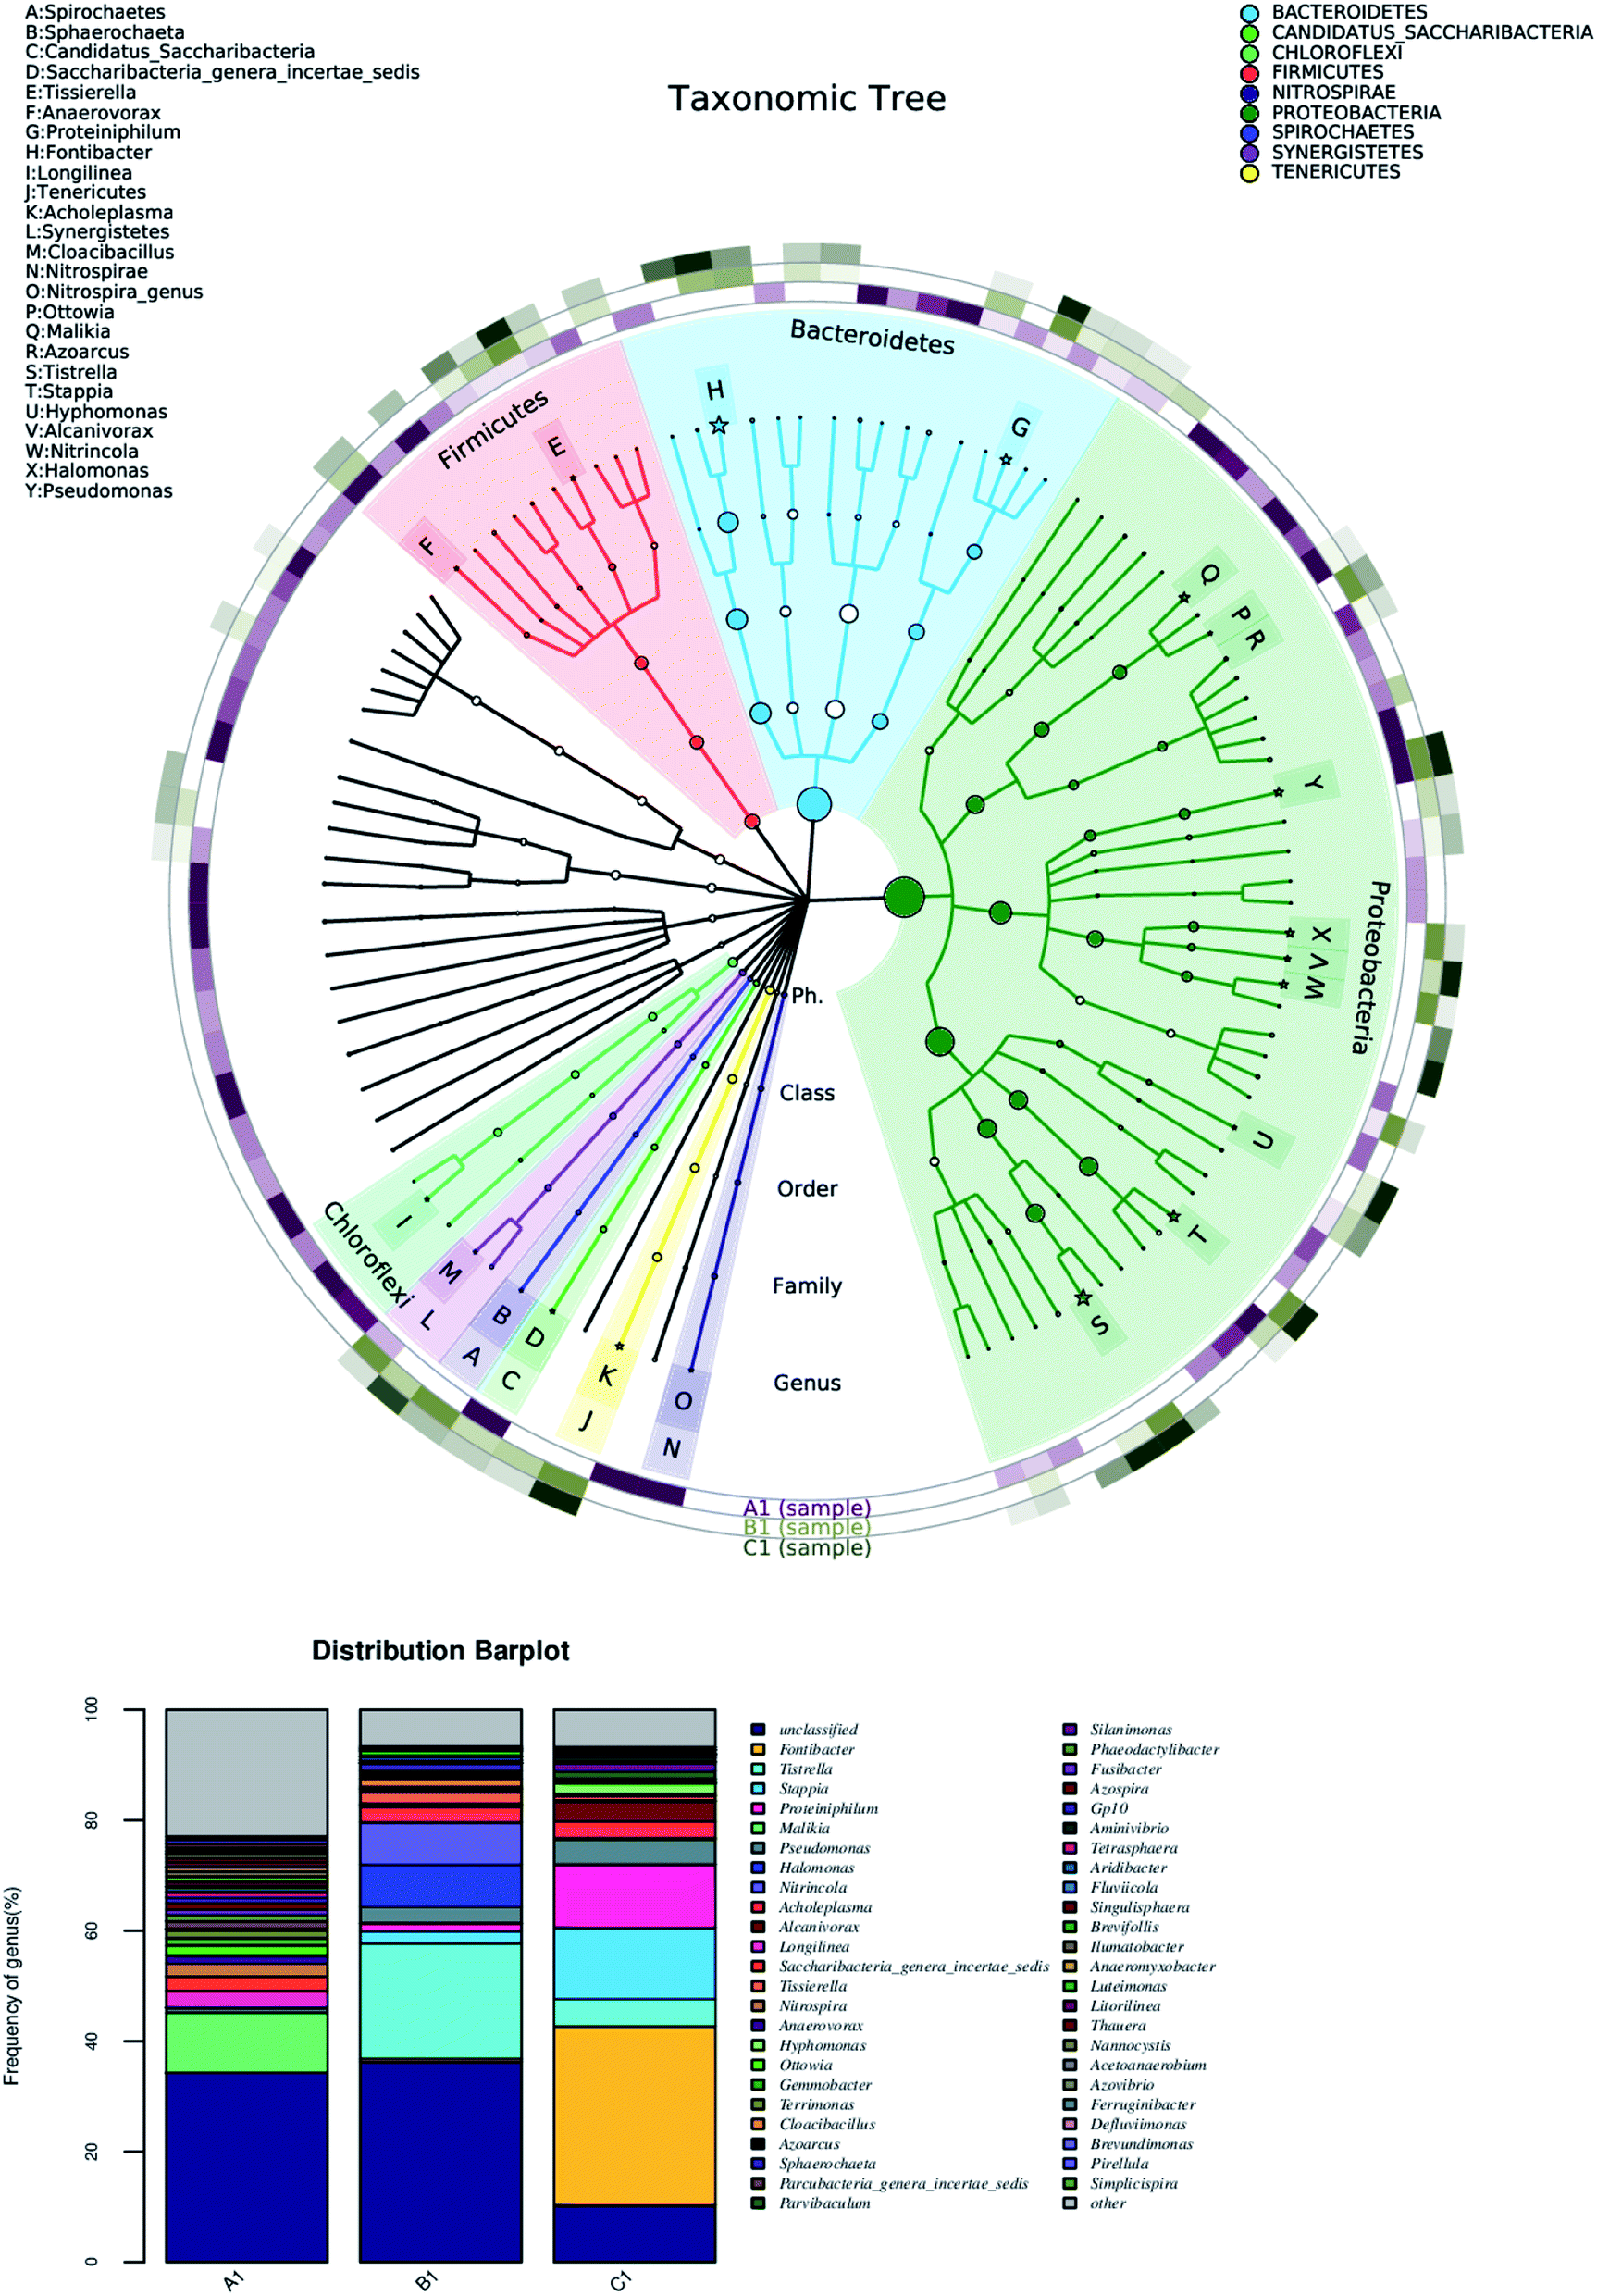 | ||
| Fig. 8 Taxonomic tree of 100 kinds of microbes with the highest relative abundances and distribution bar plot of the inoculated sludge (A1), 20 g L−1 granules in MFC-1 (B1) and 40 g L−1 granules in MFC-1 (C1). Top 20 microbes with the highest relative abundances are marked by asterisk and different phyla are indicated by different colors. The outer ring is a thermodynamic chart in which the samples are marked by different colors and the samples with a higher relative abundance are shown in a darker color. | ||
The abundances of the microbiological species or strains are shown in the outer ring of the taxonomic tree. There were more species in the inoculated sludge (i.e., A1) than in the granules of the MFCs (i.e., B1 and C1). This indicated that the microbes in samples B1 and C1 were screened by acclimatization and hence had lower diversity. There were many species of electrogenesis bacteria, such as Ottowia, Malikia, Tistrella, Pseudomonas, and Fontibacter, which was similar to in previous studies.34–37 Tistrella in Rhodospirillales was widely found in the anodic chambers of the MFCs and was in high abundance. In addition, the abundance of Tistrella increased when the content of granules increased. As the distribution bar plot shows, the kinds of microbial species decreased substantially when the content of granules increased. The dominant strains were screened by the reaction. However, there was an increase in many non-electricity-production species with the increase in granules, e.g., Proteiniphilum, Longilinea, Acholeplasma, and so on. An entire circuit contributed to the accumulation of exoelectrogens in MFCs. The total number of granules contacted with the current collector, which is equal to an entire circuit, increased with increasing the number of granules, and thus the performance and exoelectrogens increased. The intermittent contact between the anode and the current collector was unfavorable for the growth of the electrogenesis bacteria and hence its relative abundance. Thus, the exoelectrogens in the biofilms attached to the anode found it difficult to be the dominant bacteria. This also caused the lower CE with the higher content of carbon granules.
4. Conclusions
A novel configuration of microbial fuel cell was constructed for enhanced electricity generation from wastewater. The main conclusions are:• A suspended carbon felt granule anode in MFCs was used to overcome the diffusion limitations of the substrates and increased the effective area of the biofilms.
• The performance of the MFCs with the carbon granules was better than that of the control without carbon granules. The suspended bacteria had a negligible effect on the electricity generation.
• The maximum power density reached 951 ± 14 mW m−3 with a corresponding minimum internal resistance of 162.9 ± 3.5 Ω when the mass of carbon granules was 50 g and the rotational rate was 300 rpm.
• The CE of MFC was lower with the higher content of carbon granules because the relative abundance of exoelectrogenic bacteria decreased and contact between the anode and current collector occurred less frequently.
Conflicts of interest
There are no conflicts to declare.Acknowledgements
This work was supported by the National Natural Science Foundation of China (NSFC) (21876050), the National Key Research and Development Plans of a special project for site soils (2018YFC1800600) and the Special Fund from the State Key Joint Laboratory of Environment Simulation and Pollution Control (18K10ESPCT).References
- P. L. Mccarty, B. Jaeho and K. Jeonghwan, Environ. Sci. Technol., 2011, 45, 7100–7106 CrossRef CAS PubMed.
- B. E. Logan, B. Hamelers, R. Rozendal, U. Schröder, J. Keller, S. Freguia, P. Aelterman, W. Verstraete and K. Rabaey, Environ. Sci. Technol., 2006, 40, 5181–5192 CrossRef CAS PubMed.
- Y. Sharma and B. Li, Int. J. Hydrogen Energy, 2010, 35, 3789–3797 CrossRef CAS.
- L. Peng, J. C. Wei, L. Ming and H. Xia, Front. Environ. Sci. Eng., 2013, 7, 913–919 CrossRef.
- S. Mohan, S. Srikanth and P. Sarma, Bioelectrochemistry, 2009, 75, 130–135 CrossRef CAS PubMed.
- M. H. Zhou, H. Y. Wang, D. J. Hassett and T. Y. Gu, J. Chem. Technol. Biotechnol., 2013, 88, 508–518 CrossRef CAS.
- A. Janicek, Y. Fan and H. Liu, Biofuels, 2014, 5, 79–92 CrossRef CAS.
- I. H. Park, Y. H. Heo, P. Kim and K. S. Nahm, RSC Adv., 2013, 3, 16665–16671 RSC.
- A. Elmekawy, H. M. Hegab, X. Dominguezbenetton and D. Pant, Bioresour. Technol., 2013, 142, 672–682 CrossRef CAS PubMed.
- P. Liang, X. Huang, M. Z. Fan, X. X. Cao and C. Wang, Appl. Microbiol. Biotechnol., 2007, 77, 551–558 CrossRef CAS PubMed.
- J. Liu, F. Zhang, W. He, W. Yang, Y. Feng and B. E. Logan, J. Power Sources, 2014, 271, 530–533 CrossRef CAS.
- B. Kim and I. S. Chang, Bioresour. Technol., 2018, 262, 338–341 CrossRef CAS PubMed.
- C. Wei, T. Zhang, C. Feng, H. Wu, Z. Deng, C. Wu and B. Lu, Biodegradation, 2011, 22, 347–357 CrossRef CAS PubMed.
- A. Deeke, T. H. Sleutels, T. F. Donkers, H. V. Hamelers, C. J. Buisman and H. A. Ter, Environ. Sci. Technol., 2015, 49, 1929–1935 CrossRef CAS PubMed.
- J. Y. Nam, H. W. Kim, K. H. Lim and H. S. Shin, Bioresour. Technol., 2010, 101, S33–S37 CrossRef CAS PubMed.
- F. Li, Y. Sharma, Y. Lei, B. Li and Q. Zhou, Appl. Biochem. Biotechnol., 2010, 160, 168–181 CrossRef CAS PubMed.
- D. Q. Jiang and B. K. Li, Biochem. Eng. J., 2009, 47, 31–37 CrossRef CAS.
- L. Caizán-Juanarena, C. Borsje, T. Sleutels, D. Yntema, C. Santoro, I. Ieropoulos, F. Soavi and A. Heijne, Biotechnol. Adv., 2019, 39, 107456 CrossRef PubMed.
- C. Borsje, D. Liu, T. H. J. A. Sleutels, C. J. N. Buisman and A. T. Heijne, J. Power Sources, 2016, 325, 690–696 CrossRef CAS.
- J. Liu, F. Zhang, W. He, X. Zhang, Y. Feng and B. E. Logan, J. Power Sources, 2014, 261, 278–284 CrossRef CAS.
- B. Fu, X. Ting, X. Guo, P. Liang, X. Huang and X. Zhang, J. Cleaner Prod., 2019, 229, 542–551 CrossRef CAS.
- I. Rabaey, W. Ossieur, M. Verhaege and W. Verstraete, Water Sci. Technol., 2005, 52, 515–521 CrossRef CAS PubMed.
- S. Choi, J. R. Kim, J. Cha, Y. Kim, G. C. Premier and C. Kim, Bioresour. Technol., 2013, 128, 14–21 CrossRef CAS PubMed.
- P. Liang, C. Zhang, Y. Jiang, Y. Bian, H. Zhang, X. Sun, X. Yang, X. Zhang and X. Huang, Appl. Energy, 2017, 185, 582–588 CrossRef CAS.
- L. Shen, J. Ma, P. Song, Z. Lu, Y. Yao, Y. Liu, L. Cai and L. Zhang, Bioprocess Biosyst. Eng., 2016, 39, 1–8 CrossRef PubMed.
- J. Li, Z. Ge and Z. He, Bioresour. Technol., 2014, 167, 310–315 CrossRef CAS PubMed.
- X. Y. Wang, X. H. Yue and Q. J. Guo, Appl. Mech. Mater., 2015, 713–715, 2807–2810 Search PubMed.
- H. Ameur and M. Bouzit, Energy, 2013, 50, 326–332 CrossRef.
- H. T. Pham, N. Boon, P. Aelterman, P. Clauwaert, S. L. De, O. P. Van, K. Verbeken, K. Rabaey and W. Verstraete, Microb. Biotechnol., 2010, 1, 487–496 CrossRef PubMed.
- T. H. J. A. Sleutels, L. Darus, H. V. M. Hamelers and C. J. N. Buisman, Bioresour. Technol., 2011, 102, 11172–11176 CrossRef CAS PubMed.
- S. Wu, H. Li, X. Zhou, P. Liang, X. Zhang, Y. Jiang and X. Huang, Water Res., 2016, 98, 396–403 CrossRef CAS PubMed.
- J. L. Han, C. T. Wang, Y. C. Hu, Y. Liu, W. M. Chen, C. T. Chang, H. Z. Xu and B. Y. Chen, J. Taiwan Inst. Chem. Eng., 2010, 41, 606–611 CrossRef CAS.
- V. R. Nimje, C. Y. Chen, H. R. Chen, C. C. Chen, Y. M. Huang, T. Minjen, K. C. Cheng and Y. F. Chang, Bioresour. Technol., 2012, 104, 315–323 CrossRef CAS PubMed.
- S. K. Chaudhuri and D. R. Lovley, Nat. Biotechnol., 2003, 21, 1229–1232 CrossRef CAS PubMed.
- G. Stary, Appl. Environ. Microbiol., 2004, 70, 5373–5382 CrossRef PubMed.
- D. F. Xing, Z. Yi, S. A. Cheng, J. M. Regan and B. E. Logan, Environ. Sci. Technol., 2008, 42, 4146–4151 CrossRef CAS PubMed.
- D. Xing, S. Cheng, B. E. Logan and J. M. Regan, Appl. Microbiol. Biotechnol., 2010, 85, 1575–1587 CrossRef CAS PubMed.
| This journal is © The Royal Society of Chemistry 2020 |