DOI:
10.1039/C9RA08115A
(Paper)
RSC Adv., 2020,
10, 6098-6108
Synthesis of nanomagnetic sulphonated impregnated Ni/Mn/Na2SiO3 as catalyst for esterification of palm fatty acid distillate
Received
7th October 2019
, Accepted 23rd January 2020
First published on 10th February 2020
Abstract
The deterioration of the environment due to anthropogenic disturbances has become a major concern to scientists and engineers. This study responds to the concern by developing a novel nanomagnetic carbonaceous solid acid catalyst using empty fruit bunches (EFBs) as a precursor. The EFB was sulphonated to obtain acidic EFBs (AEFBs). The impregnation method was performed to incorporate metal oxides, namely, NiO, MnO and Na2SiO3, on the AEFBs. This process resulted in three nanomagnetic catalysts, namely, Na2SiO3–NiO–MnO/AC, NiO–MnO/AC and NiO/AC. According to X-ray diffraction analysis, the crystal size of the NiO/AC, NiO–MnO/AC and Na2SiO3–NiO–MnO/AC catalysts were 13.87, 28.38 and 39.64 nm, respectively, whereas their Brunauer–Emmett–Teller surface areas were 23.78, 12.69 and 16.8 m2 g−1, respectively. To confirm the incorporation of active metallic species (Ni, Mn, Na and SiO) into the carbon surface, we performed X-ray photoelectron spectroscopy. TPD-NH3 absorption showed that the Na2SiO3–Ni–MnO/AC catalysts substantially increased in the active sites and exhibited higher acidity. FESEM images showed the morphology of the surface, pore sizes and agglomeration of the catalysts. Moreover, the vibrating sample magnetometer depicted that the Na2SiO3–Ni–MnO/AC catalyst was ferrimagnetic with magnetisation and magnetic saturation values of 40.27 and 86.04 emu g−1, respectively. The optimal reaction conditions were as follows: PFAD/methanol ratio of 16![[thin space (1/6-em)]](https://www.rsc.org/images/entities/char_2009.gif) :1, 2 wt% mass of the catalyst, temperature of 120 °C and time of 4 h. Using the synthesised nanomagnetic catalyst exhibited 96% conversion of PFAD to methyl esters. Furthermore, the Na2SiO3–Ni–MnO/AC catalyst was easily separated from the reaction mixture using an external magnet and was recycled six times. The modified nanomagnetic catalyst could be an efficient catalyst for discarded feedstocks for biodiesel production.
:1, 2 wt% mass of the catalyst, temperature of 120 °C and time of 4 h. Using the synthesised nanomagnetic catalyst exhibited 96% conversion of PFAD to methyl esters. Furthermore, the Na2SiO3–Ni–MnO/AC catalyst was easily separated from the reaction mixture using an external magnet and was recycled six times. The modified nanomagnetic catalyst could be an efficient catalyst for discarded feedstocks for biodiesel production.
Introduction
Fossil fuel is the primary source of energy at present, but this fuel is nonrenewable and nonbiodegradable. However, biodiesel is a natural source of energy, environmentally friendly, renewable, carbon-neutral, nontoxic and biodegradable.1–3 Biodiesel production from palm fatty acid distillate (PFAD) using methanol and acid is realised by esterification and, to a lesser extent, via a trans-esterification method.4 Massive amounts of waste are accumulated from industrial organic and inorganic materials, and this waste has to be recycled or reused for other purposes. The common secondary products from processing the remains of refined edible palm oil are PFAD by-products. In 2016, about 17.4 million metric tons of waste from the palm oil industries in Malaysia were generated.5 The current methods of waste removal are recycling and waste treatment. However, these methods are expensive, difficult to implement and time consuming.6 The handling process degrades the fat in the fruit accompanied with taste, odour and colour. This fat has to be removed by distillation before the crude palm oil is ready for consumption. Moreover, PFAD is used in other industries that make various commodities, such as soap, candles and other oleochemical products.7 Other palm wastes include empty fruit bunches (EFBs) and palm kernel shells,8 which can be used as raw materials for producing other useful products and as sources of carbon-based precursors because of their high percentage of carbon content. These carbon-based materials are used as supporters for catalysts.7,9
A homogeneous catalyst has good catalytic activity but has some drawbacks, such as separation difficulties, poses environmental hazards, corrodes equipment and high cost.10,11 A possible solution for these limitations is to use a heterogeneous catalyst instead because of its effective activity, recyclability, non-corrosion and easy separation ability from the reaction.12,13 However, heterogeneous catalysts are characterised by their long reaction time (>24 hours) and high reaction temperature (>170 °C).14 Magnetic nanoparticle catalysts are often utilised to address these issues because of their ease of separation from products and large surface area.15–17 Nanomaterial catalysts, such as NiO, MnO and SiO2, are considered as links between the gaps of homogeneous and heterogeneous catalysts.18 Several researchers used nanomagnetic catalysts to evaluate the production of biodiesel from crude jatropha oil, and they reached efficiency of up to 96.7%.19 Another study was conducted to clarify the function of magnetic Fe–Ca oxide catalysts for the biodiesel production from hemp oil using co-precipitation method to reach a magnetisation saturation rate of 45.6 emu g−1, and the result was a conversion rate via trans-esterification reaction of up to 92.16%.20 Li et al.21 produced biodiesel by the trans-esterification reaction of Na2SiO3 on Fe3O4 nanoparticles and found that the magnetic catalysts have high activity with ease of separation and recyclability.
To the authors' knowledge, this unique catalyst has never been synthesised and used for biodiesel production. The nanomagnetic solid acid catalyst with active groups on the carbonaceous support from EFB was synthesised and characterised by X-ray diffraction (XRD), Brunauer–Emmett–Teller (BET) method, X-ray photoelectron spectroscopy (XPS), temperature-programmed desorption of ammonia (TPD-NH3), field emission scanning electron microscopy (FESEM), vibrating sample magnetometer (VSM) and thermal gravimetric analysis (TGA). The uniquely synthesised catalyst was successfully tested to produce biodiesel from PFAD via esterification. The reusability and leaching of the catalyst were determined. The spent catalyst was also characterised.
Experimental
Materials
EFB was obtained from a nearby wastage field in Selangor, Malaysia. The feedstock PFAD, a by-product of palm oil refinery, was provided by Jomalina R&D, Bhd., Malaysia. Methanol and ethanol (purity of 99%) were purchased from J.T. Baker. H2SO4 condensation (purity of 98.0%), phenolphthalein and potassium hydroxide (purity of 99.9%) were obtained from Sigma-Aldrich, Malaysia. Ni(NO3)2·6H2O and Na2SiO3·9H2O (purity of 98.0%) were purchased from Friendemann Schmidt, Malaysia. Urea (99.5%) was supplied by R&M Chemicals, Malaysia. Mn(NO3)2·4H2O (purity of 99.9%) was purchased from Merck, Germany.
Catalyst synthesis
Preparation of acidic EFB (AEFB). About 30 g of the EFB powder was mixed with 400 ml water and 12 ml H2SO4. The solution underwent hydrolysis by suspension at 150 °C for 2 h with stirring at a speed of 350 rpm. The solution was filtered, and the solid was washed with hot water (80 °C). The sample was dried at 75 °C and sieved with a 200-mesh sieve (Endecotts) to produce AEFB.
Synthesis of nanomagnetic catalysts. The first catalyst (NiO/AC) was prepared by mixing 200 ml deionised water, 30 g solid urea and 12 g AEFB as obtained earlier with 2%, 5%, 10% and 15% Ni(NO3)2·6H2O, relevant weight of which was calculated using eqn (1).| |
 | (1) |
The mixture was reacted at 135 °C in a 500 ml three-neck flask equipped with a condenser. The solution was stirred at 500 rpm for 10 h. At the end of the process, a solid product with Ni(OH)2 was collected and dried in an oven at 100 °C for 24 h and calcined at 700 °C for 2 h. A total of four nanomagnetic catalysts consisting of four NiO/AC catalysts based on the 2%, 5%, 10% and 15% of Ni (NO3)2·6H2O were obtained.
The second catalyst (NiO–MnO/AC) was prepared by mixing the optimised 5% nano Ni(NO3)2·6H2O, 200 ml deionised water, 30 g solid urea and 12 g AEFB doped with 2%, 5%, 10% and 15% of Mn(NO3)2·4H2O, whose weights were determined using eqn (1). The preparation of NiO–MnO/AC catalyst was similar to that the first catalyst. Screening procedure was performed to determine the best-performing catalyst.
The third catalyst (Na2SiO3–NiO–MnO/AC) was prepared by mixing 10 g of each of the four catalysts with 2%, 5%, 10% and 15% NiO–MnO/AC, 30 g Na2SiO3·9H2O and 5 ml deionised water. The solution was heated to 85 °C until it was converted to gel-like solid and dried in an oven at 70 °C for 24 h. The solid was calcined at 400 °C for 2 h and crushed with ball milling for 2 h and at spinning of 230 rpm to produce Na2SiO3–NiO–MnO/AC (Fig. 1), which was finally screened.
 |
| | Fig. 1 Synthesis procedure of the magnetic catalysts. | |
Catalyst characterisation
XRD (Shimadzu XRD-6000 with anode Cu-Kα radiation) was conducted to estimate the crystal structure and phase composition of the catalysts. The thermal gravimetric method was performed to determine the change in sample mass as a function of temperature. Mettler Toledo TGA-SDTA was used with a temperature range of 25–1000 °C and nitrogen flow of 30 ml min−1. Surface characteristics of the catalyst relative to the number and size of the active sites on the surface were determined via TPD-NH3 (Thermo Scientific TPDRO 1100). The magnetic saturation (MS) of the catalysts was measured using VSM (Lake Shore 7407). The test was performed at room temperature with external magnetic range of −20000 to 20000 G. The ratio of elements C, Ni, Mn, Na and SiO were determined using XPS and recorded using achromatic Al Kα (1486.6 eV) X-ray source that operated at 15 kV. The morphology of the adsorbents was observed through FESEM (Nova NanoSEM 230, FEI, USA). Specific surface area, total pore volume and average pore size were measured by the adsorption and desorption of N2 at 77 K using an automated device (Micromeritics ASAP 2020). Prior to analysis, the samples were outgassed at 250 °C for 4 h. The surface area and pore size distribution were obtained via BET and Barrett–Joyner–Halenda calculations.
PFAD methyl ester
As a precautionary step, the Na2SiO3–NiO–MnO/AC catalyst was dried in an oven at 10 °C for 60 min to remove the moisture present. Catalyst performance was analysed via esterification using various methanol-to-PFAD ratios (6–24) mixed in a 250 ml flask at different temperatures (80–120 °C) under constant stirring at 350 rpm for a maximal period (1–6 h) and catalyst loading (0.5–6.0 g) before cooling down to room temperature. After the reaction, the mixture was poured into a separation funnel. When the reaction cooled down, the separation process was started by separating the magnetic catalyst using an external magnet. The biodiesel and methanol were taken to another flask where the methanol was removed by heating the solution at 70 °C until the layer that contained methanol was completely removed, thereby leaving the biodiesel. The biodiesel produced was subjected to conversion factor test to measure the percentage of free fatty acid (FFA) in the biodiesel. Eqn (2) depicts the conversion factor in terms of the initial acid value (Av0) and the acid value at the time of terminating the reaction (Avt).| |
 | (2) |
Reusability and leaching analysis
The catalyst was separated from the reaction mixture by using an external magnet and was initially washed with hexane to remove nonpolar compounds, such as methyl esters, from the catalyst surface. The catalysts were washed with methanol to remove polar compounds, such as glycerol, and dried at 100 °C for 8 h. The leaching of the catalyst into the reaction mixture was investigated by inductively coupled plasma-mass spectrometry (ICP-MS). The sample was vaporised, atomised and partially ionised in plasma. The atoms and ions were excited and emitted light at characteristic wavelengths in the ultraviolet or visible region of the spectrum. The emission line intensities were proportional to the concentration of each element in the sample. The elemental composition of the samples was determined by digesting each sample (0.025 g) in 5% nitric acid.
Results and discussion
XRD
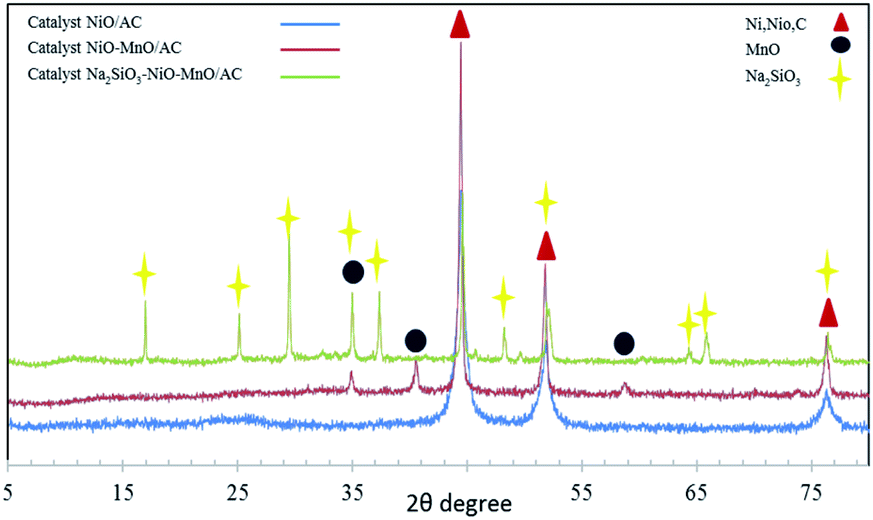
XRD was performed to examine the crystallinity of the nanomagnetic catalysts NiO/AC, NiO–MnO/AC and Na2SiO3–NiO–MnO/AC, as shown in Fig. 2. Three strong characteristic peaks for Ni, NiO and carbon in the NiO/AC catalyst appeared at 2θ-reflections of 44.5°, 51.5° and 76.3°. This result is concordant with that of previous works.22,23 The peaks from NiO/AC appeared on the NiO–MnO/AC peaks plus the new MnO peaks at 2θ of 35°, 40.5° and 58.7°, as reported previously.24 Six extra peaks of the Na2SiO3–NiO–MnO/AC catalyst appeared that can be attributed to Na2SiO3 at new 2θ-reflections of 16.9°, 25.1°, 29.5°, 37.3°, 48.1°, 64.5° and 66.3°. All reflections were matched with the JCPDS files of the respective dopants, starting with NiO (JCPDS-ICDD: 00-014-0481), MnO (JCPDS-ICDD: 01-082-8819) and Na2SiO3 (JCPDS-ICDD: 01-072-0079).
 |
| | Fig. 2 XRD patterns of NiO/AC, NiO–MnO/AC and Na2SiO3–NiO–MnO/AC catalysts. | |
Further, crystal size (d) was calculated in terms of θ and the constants K, λ and β, as depicted in eqn (3).
| |
 | (3) |
The crystal size of the NiO/AC catalyst was estimated to be 13.87 nm. However, the size increased to 28.38 nm when MnO was added, an expected result because the insertion of MnO in the carbon lattice enlarges crystallite sizes.25 Finally, the crystalline size of the Na2SiO3–NiO–MnO/AC catalyst was estimated to be 39.64 nm. The increase in crystal size was likely caused by the increase in the effective surface area of the crystal formed that can be achieved by either increasing the number or size of the pores or both.26 The various crystal sizes were calculated using Scherrer's equation, as shown in Table 1.
Table 1 Crystallite size of catalysts NiO/AC, NiO–MnO/AC and Na2SiO3–NiO–MnO/AC
| Catalyst |
Crystalline size (nm) |
| NiO/AC |
13.87 |
| NiO–MnO/AC |
28.35 |
| Na2SiO3–NiO–MnO/AC |
39.64 |
XPS
XPS was performed to characterise the surface species through a survey scan of Na2SiO3–NiO–MnO/AC catalyst up to 1200 eV (Fig. 3a). The following peaks were detected: 285.7 (C1s), 641.5 (MnO 3/2), 652.7 (MnO 1/2), 855.6 (NiO 3/2), 873.2 (NiO 1/2), 1071.5 (Na1s), 532.4 (O1s) and 102.1 eV (Si2p). The C1s peak at 284.8 eV that appeared in the whole spectra was narrowly fitted, as shown in Fig. 3a. This peak consisted of three peaks corresponding to C–C/C![[double bond, length as m-dash]](https://www.rsc.org/images/entities/char_e001.gif) C (284.8 eV), carbonyl groups (288.8 eV) and C–O hydroxyl groups (285.8 eV). Ni appeared at peaks 855.6 (NiO 3/2) and 873.2 eV (NiO 1/2). As a close fit in Fig. 3b to these two peaks, results showed that these two peaks are standard, and no subsequent peaks can be observed. These two Ni peaks can be assigned to 2p3/2 Ni(OH)2 (855.6 eV) and 2p1/2 NiO (873.2 eV). However, the spectrum showed two satellites at 861.7 and 870.0 eV corresponding to 2p3/2 and 2p1/2, respectively. The satellite peaks were attributed to the existence of multi-electron excitation.27 In terms of Mn, the XPS spectra showed two standard peaks at 641.5 and 652.7 eV. A close fit curve for these two peaks suggested a satellite peak at 645.1 eV, which corresponded to 641.5 eV, as shown in Fig. 3c.28 The XPS spectra also showed a strong peak at 1071.5 eV corresponding to Na1s, which supported the existence of Na in the catalyst (Fig. 3d). Na1s peak was tested according to the best fitting program, and a single Na peak appeared, a result that agrees with that of a previous study.29 This peak at 102.7 eV based on XPS is attributed to SiO2 in Fig. 3e.
C (284.8 eV), carbonyl groups (288.8 eV) and C–O hydroxyl groups (285.8 eV). Ni appeared at peaks 855.6 (NiO 3/2) and 873.2 eV (NiO 1/2). As a close fit in Fig. 3b to these two peaks, results showed that these two peaks are standard, and no subsequent peaks can be observed. These two Ni peaks can be assigned to 2p3/2 Ni(OH)2 (855.6 eV) and 2p1/2 NiO (873.2 eV). However, the spectrum showed two satellites at 861.7 and 870.0 eV corresponding to 2p3/2 and 2p1/2, respectively. The satellite peaks were attributed to the existence of multi-electron excitation.27 In terms of Mn, the XPS spectra showed two standard peaks at 641.5 and 652.7 eV. A close fit curve for these two peaks suggested a satellite peak at 645.1 eV, which corresponded to 641.5 eV, as shown in Fig. 3c.28 The XPS spectra also showed a strong peak at 1071.5 eV corresponding to Na1s, which supported the existence of Na in the catalyst (Fig. 3d). Na1s peak was tested according to the best fitting program, and a single Na peak appeared, a result that agrees with that of a previous study.29 This peak at 102.7 eV based on XPS is attributed to SiO2 in Fig. 3e.
 |
| | Fig. 3 (a) Survey scan, (b) NiO (3/2, 1/2) spectrum, (c) MnO (3/2, 1/2) spectrum, (d) Na1s spectrum and (e) Si2p of Na2SiO3–NiO–MnO/AC catalyst. | |
TPD-NH3 analysis
The amount of acid sites present in the catalysts was estimated by calculating the desorption peak area of ammonia, which was used to determine acid strength as a function of the maximum temperature (Tmax). The number and size of the pores on the surface of the crystal and the vacancies inside the bulk play an important role in determining the amount of NH3 absorbed by the surface.30 Three distinct regions appeared at 450 °C, 700 °C and 950 °C in the NiO/AC catalyst (Fig. 4). The first desorption of NH3 is attributed to those pores located directly on the surface. The high-temperature NH3 desorption at 700 °C and 950 °C belonged to the vacancies located underneath the surface. As NiO was doped with the catalyst NiO/AC, the desorption features remarkably changed. The first and most important change was the disappearance of the low-temperature NH3 desorption at 450 °C. This occurrence was caused by the reduction in the pores on the NiO–MnO/AC catalyst surface by the MnO molecules, thereby leaving the vacancies underneath the surface intact.31 The desorption of NH3 started as the temperature increased to 650 °C, suggesting that NH3 was more confined (bonded) to the bulk of the catalyst. The second peak of NH3 desorption from the NiO–MnO/AC catalyst required high temperature to overcome the bond of NH3 to the bulk.32 The addition of Na2SiO3 to the NiO–MnO/AC catalyst produced the Na2SiO3–NiO–MnO/AC catalyst. The shift of the first peak toward lower temperature (from 450 °C in NiO–MnO/AC to about 500 °C in the Na2SiO3–NiO–MnO/AC catalyst) could be attributed to the demographic changes in the number and size of the pores. The peak appeared broader than its corresponding peak in NiO–MnO/AC, indicating that more pores were created on the surface. The peak was less intense than its corresponding peak on the surface of NiO–MnO/AC, suggesting that the peak was smaller in size, thereby resulting in higher surface area. The last peak that appeared at about 1000 °C was very broad and less intense. Na2SiO3 seemed to influence the number and size of these underneath vacancies.33 The effect of doping NiO, MnO and Na2SiO3 on the surface of the carbon substrate was clear and could be described as remarkable changes in the behaviour of the substrate.
 |
| | Fig. 4 TPD-NH3 profile of NiO/AC, NiO–MnO/AC and Na2SiO3–NiO–MnO/AC catalysts. | |
FESEM with energy dispersive X-ray (EDX) analysis
The FESEM image of the raw EFB is shown in Fig. 5a. Large irregular aggregate fibres with different sizes can be seen as a result of the effect of moisture and the method of handling the raw bunch.34 As illustrated in Fig. 5b, the surface of AEFB appeared smoother than that of EFB due to the effect of H2SO4. The NiO/AC catalyst is shown in Fig. 5c. When Ni(NO3)2·6H2O was used with Mn(NO3)2·4H2O, the morphology of the surface and the number and size of the pores varied. As shown in Fig. 5d, the effect of developing the NiO–MnO/AC catalyst substantially affected the surface as numerous pores were created with different sizes. The surface contained several areas of agglomeration, whereas small pores were still noticeable on the other areas (Fig. 5d). In the Na2SiO3–NiO–MnO/AC catalyst, the morphology and pores were also affected when Na3SiO2 was added (Fig. 5e), a result similar to that obtained by Zhang et al.32 The most important difference was the surface appeared to be covered by a large amount of the combined material of NiO, MnO and SiO2, as these three oxides are all magnetic in nature. Moreover, the pores were heavily covered by a layer that appeared to be thin in some parts of the surface due to the power construction. In other parts, a thick layer based on the agglomeration of the three nanomagnetic oxides was observed.
 |
| | Fig. 5 FESEM image of (a) EFB, (b) AEFB, (c) NiO/AC, (d) NiO–MnO/AC and (e) Na2SiO3–NiO–MnO/AC catalysts. | |
EDX analysis was performed to determine the chemical composition of the NiO/AC, NiO–MnO/AC and Na2SiO3–NiO–MnO/AC catalysts, and the results are presented in Table 2. In the NiO/AC catalyst, a high percentage of Ni (5.8%) was observed with the presence of carbon (80.69%) and oxygen (13.51%). However, the percentage of Ni declined 5.8 to 4.22% on the catalyst surface because of doping with 9.6% Mn. Accordingly, the percentages of C and O changed. However, the Na2SiO3–NiO–MnO/AC catalyst showed a considerable change in C and a slight change in Mn and Ni percentages with the addition of 24.4% Na and 12.8% silica. This result proved that the pores on the C surface of the Na2SiO3–NiO–MnO catalyst had different concentration of Ni, Mn, Na and Si.
Table 2 Elemental compositions (C, O, Ni, Mn, Ni, Si) of NiO/C, NiO–MnO/AC and Na2SiO3–NiO–MnO/C catalysts using EDX and ICP
| wt% |
NiO/AC |
NiO–MnO/AC |
Na2SiO3–NiO–MnO/C |
| Analysed by EDX. Analysed by ICP. |
| Ca |
80.69 |
71.89 |
33.81 |
| Oa |
13.51 |
14.29 |
15.9 |
| Nia |
5.8 |
4.22 |
4.1 |
| Mna |
— |
9.6 |
8.99 |
| Naa |
— |
— |
24.4 |
| Sia |
— |
— |
12.8 |
| Nib |
5.3 |
4.72 |
4.48 |
| Mnb |
— |
9.37 |
9.65 |
| Nab |
— |
— |
2.4 |
| Sib |
— |
— |
1.1 |
ICP represents the metal analysis of the NiO/AC, NiO–MnO/AC and Na2SiO3–NiO–MnO/AC catalysts. The NiO/AC catalyst showed Ni content (5.3%), whereas, decrease in nickel concentration (4.72%) was observed in NiO–MnO/AC catalyst due to the addition of manganese (9.37%) which were accumulated significantly by penetrating into the pores of the NiO–MnO/AC catalyst. Additionally, the accumulation of sodium (24.4%) and silica (12.8%) is evident in the Na2SiO3–NiO–MnO/AC catalyst as can be observed in Fig. 5e and also in Table 2.
VSM
The magnetization properties of the NiO/AC, NiO–MnO/AC and Na2SiO3–NiO–MnO/AC catalysts were measured at room temperature via VSM between 2 and −2 T, as shown in Fig. 6 and Table 3. The MS levels of the three catalysts were recorded at 26.97, 51.32 and 40.27 emu g−1, respectively. The increase in magnetization level of NiO–MnO/AC from 26.97 emu g−1 to 51.32 emu g−1 was expected because MnO is another magnetic material added to the original matrix. The MS of Na2SiO3–NiO–MnO/AC was 40.27 emu g−1, which was lower than that of NiO–MnO/AC but higher than that of NiO/AC. The presence of the nanomagnetic SiO2 in the Na2SiO3 induced a negative effect on the magnetic field caused by the ferromagnetic materials of NiO and MnO. The effect of SiO2 was discussed previously,35 which showed that the presence of SiO2 as coating to Fe3O4 reduces the MS of Fe3O4. The MS of Fe3O4–SBA-15–SO3H and graphene oxide Fe3O4 nanocomposite catalysts were previously reported16,36 as 12.1 and 7.62 emu g−1, respectively. These MS values were less than that of the produced Na2SiO3–NiO–MnO/AC catalyst in the present study (40.27 emu g−1).
 |
| | Fig. 6 VSM magnetization curves of NiO/AC, NiO–MnO/AC and Na2SiO3–NiO–MnO/AC catalysts at room temperature. | |
Table 3 Magnetic properties (VSM) and surface area measurement (BET) results of NiO/AC, NiO–MnO/AC and Na2SiO3–NiO–MnO/AC catalysts
| Catalyst |
VSM |
BET |
| MS (emu g−1) |
Hc (Or) |
Surface area (m2 g−1) |
Pore size (Å) |
Pore volume (cm3 g−1) |
| NiO/AC |
26.97 |
28.05 |
23.78 |
5.76 |
0.0256 |
| NiO–MnO/AC |
51.32 |
67.3 |
12.69 |
18.79 |
0.0062 |
| Na2SiO3–NiO–MnO/AC |
40.27 |
86.04 |
16.80 |
21.27 |
0.0092 |
BET surface area analysis
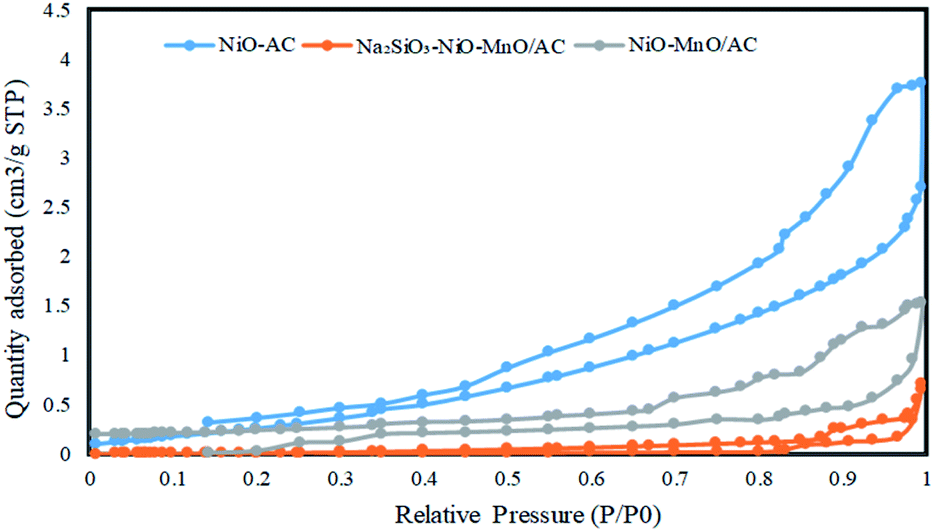
Fig. 7 illustrates the nitrogen adsorption–desorption plot of the three catalysts. The highest surface area was obtained from the NiO/AC catalyst, suggesting that its surface had more pores and active sites to support the reaction. When NiO/AC was modified by the addition of Mn(NO3)2·4H2O, the surface area was covered with more materials, resulting in lesser surface area than the NiO/AC catalyst. When NiO–MnO/AC was doped with Na2SiO3 to produce the Na2SiO3–NiO–MnO/AC catalyst, the surface area of the catalyst was reduced due to the blockage of several pores by the Na2SiO3 molecules.32 The N2 adsorption–desorption isotherm plot exhibited a typical type IV adsorption–desorption isotherm, which is a characteristic of a mesoporous material.37 Table 2 shows the surface area, pore size and pore volume of the catalysts.
 |
| | Fig. 7 N2 adsorption–desorption isotherms of NiO/AC, NiO–MnO/AC and Na2SiO3–NiO–MnO/AC catalysts. | |
TGA
Weight loss was determined using the TGA curves of the NiO/AC, NiO–MnO/AC and Na2SiO3–NiO–MnO/AC catalysts (Fig. 8). The data were obtained under nitrogen atmosphere at the intermediate temperature rate of 25 °C min−1. The TGA curve of the NiO/AC catalyst also displayed two events where the first event represented mass loss within the temperature range of 23.8–204 °C caused by the removal of water and the second loss within the range of 568–656 °C, which is attributed to the decomposition of NiO in addition to insignificant impurities.38–40
 |
| | Fig. 8 TGA profile of NiO/AC, NiO–MnO/AC and Na2SiO3–NiO–MnO/AC catalysts. | |
According to the TGA analysis of the NiO–MnO/AC catalyst, the weight loss appeared between 452.8 °C and 655.3 °C, which can be attributed to the decomposition of MnO and NiO.41,42 The TGA analysis of the Na2SiO3–NiO–MnO/AC catalyst showed a decomposition at 289.4 °C and 569.2 °C.
Screening of catalysts for PFAD
During the esterification of PFAD conversion to FFA by the catalyst NiO/AC at different Ni concentrations (2%, 5%, 10% and 15%), the reaction condition was fixed at a reaction time of 3 h, catalyst loading of 0.5% wt, temperature of 60 °C and methanol-to-PFAD ratio of 16:1. The esterification reaction by the 5% NiO/AC achieved the highest FFA conversion of 70% ± 2.1%, whereas the 15% NiO/AC catalyst showed the lowest biodiesel conversion of 56% ± 2.1%. The biodiesel conversion was reduced when the amount of Ni was increased to >15%. Subsequently, the best-performing catalyst (NiO/AC, 5%) was doped with Mn to prepare the other catalyst (NiO–MnO/AC) with different Mn concentrations of 2%, 5%, 10% and 15% under the same reaction conditions. The conversion rate was increased by the 2%, 5% and 10% NiO–MnO/AC catalysts to 62%, 78% and 84%, respectively, but the conversion rate decreased to 65% when the catalyst was doped with >15% Mn. The 10% NiO–MnO/AC catalyst performed the best and was used to synthesise another catalyst by doping NiO (5%)–MnO/AC (10%) with Na2SiO3 to yield Na2SiO3–NiO–MnO/AC under the same reaction conditions. As illustrated in Fig. 9, the 10% Na2SiO3–NiO–MnO/AC achieved the highest conversion rate of 92% among other concentrations (2%, 5% and 15%), which showed conversion rates of 68%, 89% and 79%, respectively.
 |
| | Fig. 9 Screening of catalysts (NiO/AC, NiO–MnO/AC and Na2SiO3–NiO–MnO/AC) for FFA conversion at the following reaction conditions: reaction temperature of 120 °C, reaction time of 2 h, methanol-to-PFAD ratio of 16:1 and catalyst loading of 0.5 wt%. | |
Optimization of reaction process parameters
The optimization process was performed using the conversion factor for PFAD to produce esters, as shown in Fig. 9. Several factors affected the conversion factor. However, only four important parameters were considered in this study according to the approach adopted previously.43 The first parameter, the PFAD/methanol ratio, was set at 6:1, 9:1, 12:1, 16:1 and 24:1 (Fig. 10a). Results showed that increasing the ratio beyond 24:1 had almost no effect on yield. The 74% conversion rate was obtained at 16:1, whereas the 75% conversion rate of PFAD to esters was obtained at 24:1. The ratio of 16:1 was selected considering the economic factor as the cost of extra methanol and the small difference in yield of about 1% have no economic benefit. Thus, the 16:1 ratio was better than the 24:1 ratio.
 |
| | Fig. 10 Optimization studies for FFA conversion to esters by manipulating (a) PFAD/methanol ratio, (b) catalyst mass, (c) reaction temperature and (d) reaction time. | |
The second parameter, which is mass of the Na2SiO3–NiO–MnO/AC catalyst, was used in the conversion process (Fig. 10b). The mass of the Na2SiO3–NiO–MnO/AC catalyst varied at 0.5, 1.0, 2.0, 4.0 and 6.0 g. Results showed that with 0.5 g, the conversion rate was 28% and it increased as the mass of Na2SiO3–NiO–MnO/AC increased, attaining 84% when the mass was 2 g. As the mass increased beyond 2 g, the conversion factor decreased until it reached 72% when the mass was 6 g. The saturation level at which the mass of the catalyst has no effect was not tested because the conversion slightly decreased between 4 and 6 g. The optimum conversion rate was reached at 2 g, which can be explained by the amount needed to convert PFAD into biodiesel as a result of reducing the activation surface of the catalyst by closing more pores.44 The saturation was studied for each catalyst, and the results differed according to the type, synthesis and usage of the catalyst.45
The third parameter, temperature, varied between 80 °C, 100 °C, 120 °C, 140 °C and 150 °C (Fig. 10c). The maximum conversion rate of 95% was achieved at 120 °C, suggesting that yield is temperature dependent and increases with temperature to a certain point beyond which conversion rate decreases due to increased volatility and miscibility.46
The fourth parameter, which is reaction time, is illustrated in Fig. 10d. The maximum yield was obtained after using the Na2SiO3–NiO–MnO/AC catalyst for 2 h where the yield was 96% for usage times of 1, 2, and 6 h. This result is an important economic consideration because contact time is required and critical for optimum FFA conversion. Moreover, saving energy and reducing any further reaction are imperative.
Proposed mechanism of Na2SiO3–NiO–MnO/AC catalyst involving PFAD for esterification reaction
Briefly, as per Fig. 11 in proposed mechanism, (a) FFA accepts a proton from acid catalyst, (b) the alcohol molecule attacks the protonated carbonyl group to yield an intermediate, (c) the intermediate loses a water molecule and produces a protonated ester and (d) a proton is transferred to the acid catalyst to produce an ester.
 |
| | Fig. 11 Proposed mechanism. | |
Catalyst reusability
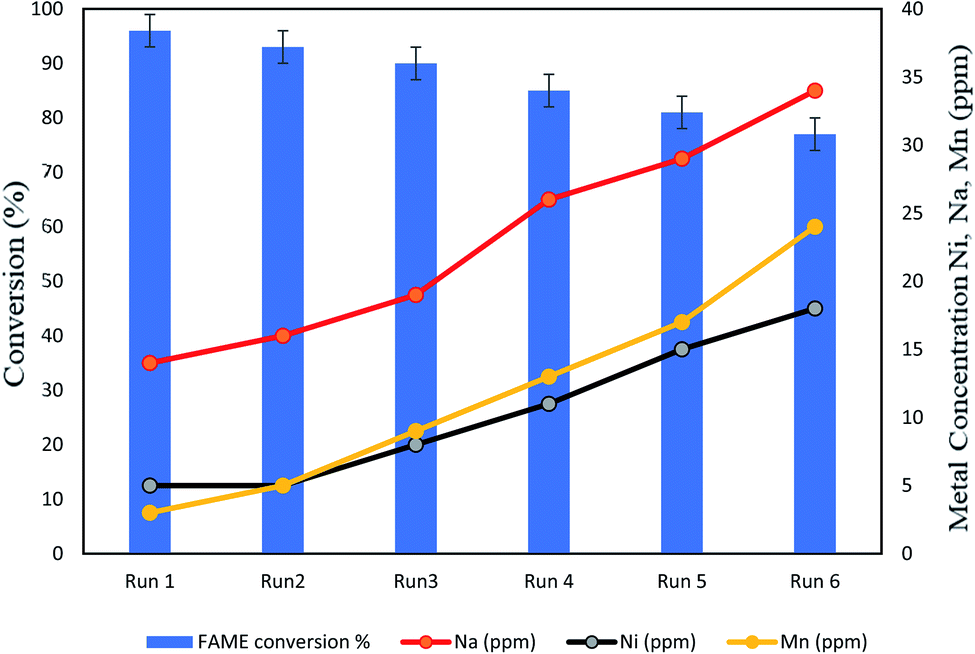
The reusability of the Na2SiO3–NiO–MnO/AC catalyst was determined by conducting the reaction cycles at optimised conditions (2 wt% catalyst loading, 16:1 methanol-to-PFAD ratio, 120 °C reaction temperature and 2 h reaction time) through which the catalyst was washed and dried again for the next cycle (Fig. 12). The reusability of the catalyst depended on the amount of leached Na, Ni and Mn in biodiesel conversion, which corresponded with the amount of these elements lost from the catalyst during the usage. The amount of these three elements in the conversion increased from 14 ppm to 34 ppm, 5 ppm to 18 ppm, and 3 ppm to 24 ppm, respectively. The amount of leached Na in the reaction mixture substantially increased due to the disruption and dissolution of active metals during the multiple cycles. The activity of esterification decreased during the reaction because of the release of Na from the catalyst. This release might be attributed to the active sites filled by the intermediate types produced within the reaction. The final yield of 77% on the sixth run under optimum reaction conditions was similar to that obtained by Zhang et al.32 The amount of Ni and Mn leaching was less than that of Na. The reusability of the Na2SiO3–NiO–MnO/AC catalyst in terms of Ni and Mn particles showed that this catalyst could be used economically up to six times.
 |
| | Fig. 12 Reusability of Na2SiO3–NiO–MnO/AC catalyst in esterification of PFAD. | |
Comparison of sulphonated activated carbon-based catalysts
Table 4 presents the comparison between suphonated activated carbon-based catalysts and the catalyst produced in the present study. Li et al.47 reported a low biodiesel conversion percentage of 75% with high catalyst loading (20 wt%) under high reaction temperature (80 °C) at 3 h. The FAME yield was influenced by the reaction conditions, as stated by Bureros et al.48 A typical rise in biodiesel yield (93%) when the time was increased to 24 h was demonstrated. However, the catalytic activity of cacao shell-derived solid acid catalyst declined after four consecutive runs. Huang et al.49 identified a 95.4% conversion rate at a high reaction time of 7 h. By contrast, the present study achieved a 96% conversion rate in less than 2–3 h. The catalytic activity of the pyrolyzed lignin sulphonated catalyst declined after five cycles probably because of the leaching of the –SO3H groups linked with relatively unstable aliphatic groups. Shu et al.50 obtained an 80.5% FFA conversion rate using high reaction temperature of 220 °C and long reaction time of 4.5 h. In another study, Shuit et al.51 used carbonised vegetable oil asphalt-based catalyst and demonstrated promising results in the esterification of PFAD with 93.5% yield. However, this result was achieved at a high reaction temperature of 170 °C. In the present study, 96% biodiesel yield was achieved at 2 wt% catalyst loading, 16:1 methanol-to-PFAD ratio, 120 °C reaction temperature and 2 h reaction time. The Na2SiO3–NiO–MnO/AC catalyst also showed better reusability (six times) than the other sulphonated catalysts.
Table 4 Comparison among the yield and reaction parameters of sulphonated-based catalysts using different oils
| Catalysts |
Reaction conditions |
Catalytic activity (% yield) |
Feedstock |
Reusability (no. of cycle) |
| Sulphonated activated carbon fibre catalyst (SACF)47 |
Esterification: 1.5 h, 20 wt%, 80 °C |
75 |
Acetic acid |
— |
| Cacao shell-derived solid acid catalyst (CS-SAC)48 |
Esterification: 24 h, 45 °C, 7:1; 5 wt% |
93 |
Oleic acid |
3 |
| Pyrolysed lignin sulphonated catalyst49 |
Esterification: 7 h, 80 °C, 5 wt%, 12:1 |
95.4 |
Oleic acid |
5 |
| Carbonised vegetable oil asphalt-based catalyst50 |
Esterification and trans-esterification: 4.5 h; 220 °C; 0.2 g, 16.8 |
80.5 |
Waste vegetable oil |
5 |
| Sulphonated multi-walled carbon nanotubes51 |
Esterification: 2 h, 170 °C, 20:1; 3 wt% |
93.5 |
PFAD |
4 |
| Nanomagnetic carbonaceous solid acid catalyst (present study) |
Esterification: 2 h, 120 °C, 16:1; 2 wt% |
96 |
PFAD |
6 |
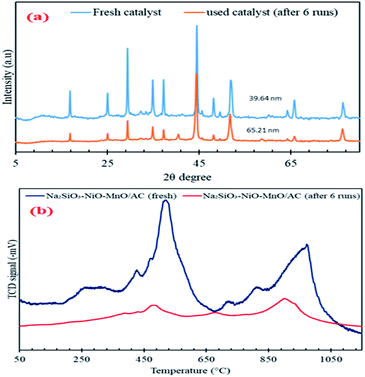
Spent Na2SiO3–NiO–MnO/AC catalyst characterisation
The used catalyst was characterised using XRD and TPD-NH3. The catalyst stability agreed with the XRD pattern of the used catalyst after six runs. Fig. 13a shows the pattern that was typical of the fresh Na2SiO3–NiO–MnO/AC, indicating that it retained its active metal phase structures. The average crystallite size of the spent catalyst was calculated using the diffraction peak of NiO at 2θ = 45° (111) (JCPDS card no. 00-014-0481), which became significantly larger after six reaction runs. This finding confirmed that the active metal on AC underwent sintering during the esterification reaction, which might result in decreased surface area.52,53
 |
| | Fig. 13 (a) XRD result and (b) TPD-NH3 profile of the fresh and spent Na2SiO3–NiO–MnO/AC catalyst. | |
The ICP-MS results showed that the total metal leaching of 209 ppm prevented further reaction on the surface of the catalyst, which simultaneously resulted in the lowering of biodiesel production. The metal leaching from the surface of the catalyst was inevitable and generally acknowledged to be the main reason for deactivation of the catalyst in esterification reaction.54,55 The small amount of metals leaching from the AC surface led to the decrease in catalyst acidity, which resulted in the rapid deactivation of the catalyst in each run. The TPD-NH3 results in Fig. 13b showed that the catalyst acidity was reduced from 4391 μmol g−1 to 1248 μmol g−1, and the catalyst strength also decreased to lower temperature because of the metal centering during the biodiesel reaction.
Conclusions
In this work, EFB was doped with nanomagnetic oxides to produce three different magnetic catalysts that were used in PFAD conversion to esters. These catalysts, namely, NiO/AC, NiO–MnO/AC and Na2SiO3–Ni–MnO/AC, were characterised by XRD. The reflection peaks for the constituent materials with crystalline sizes of 13.87, 28.38 and 39.64 nm were found. The TPD-NH3 analysis showed two states of the NiO/AC and NiO–MnO/AC catalysts and three states of the Na2SiO3–Ni–MnO/AC catalyst with all peaks shifted toward high temperatures, thereby suggesting the effect of doping of the magnetic materials on the surface. The morphology of the surface and the agglomeration of the magnetic oxides on the surface were tested via FESEM. The magnetization of the catalysts was measured via VSM, which showed that the MS of Na2SiO3–NiO–MnO/AC was 40.27 emu g−1. Such MS was sufficient to ensure the recovery of the nanomagnetic catalyst by an external magnet. The BET results demonstrated that the N2 adsorption–desorption isotherm was type IV. The TGA results showed that NiO/AC, NiO–MnO/AC and Na2SiO3–Ni–MnO/AC lost weight at 568–618 °C, 568.8–673.8 °C and 452.88–655.39 °C, respectively. The influential variables for the best catalyst (i.e., Na2SiO3–Ni–MnO/AC) were PFAD/methanol ratio of 16:1, catalyst mass of 2 wt%, temperature of 120 °C and reaction time of 2 h. The Na2SiO3–Ni–MnO/AC catalyst was tested for reusability; results showed that it can be used for six cycles. In conclusion, the nanomagnetic catalysts are effective, easy to handle with high conversion factor of about 96% and economical because of their potential reusability and use of cheap waste raw material.
Conflicts of interest
The authors declare no conflict of interest.
Acknowledgements
The authors would like to extend their sincere appreciation to The World Academy of Sciences (TWAS) and to Italy for funding this research through RG Code 17-076 RG/REN/AS_C of TWAS-COMSTECH research grant. The authors acknowledge their gratitude to King Saud University (Riyadh, Saudi Arabia) for support this research through Researchers Supporting Project (RSP-2019/80).
References
- S. E. Onoji, S. E. Iyuke, A. I. Igbafe and D. B. Nkazi, Energy Convers. Manage., 2016, 110, 125–134 CrossRef CAS.
- U. Rashid, H. A. Rehman, I. Hussain, M. Ibrahim and M. S. Haider, Energy, 2011, 36, 5632–5639 CrossRef CAS.
- N. A. Ibrahim, U. Rashid, Y. H. Taufiq-Yap, T. C. S. Yaw and I. Ismail, Energy Convers. Manage., 2019, 195, 480–491 CrossRef CAS.
- F. A. P. Voll, C. da Silva, C. C. R. S. Rossi, R. Guirardello, F. de Castilhos, J. V. Oliveira and L. Cardozo-Filho, Biomass Bioenergy, 2011, 35, 781–788 CrossRef CAS.
- V. Sathia, Essential Palm Oil Statistics, Palm Oil analytics, 2017, pp. 1–33 Search PubMed.
- M. F. Awalludin, O. Sulaiman, R. Hashim and W. N. A. W. Nadhari, Renewable Sustainable Energy Rev., 2015, 50, 1469–1484 CrossRef CAS.
- I. M. Lokman, U. Rashid, R. Yunus and Y. H. Taufiq-Yap, Catal. Rev.: Sci. Eng., 2014, 56, 187–219 CrossRef CAS.
- K. M. Sabil, M. A. Aziz, B. Lal and Y. Uemura, Biomass Bioenergy, 2013, 56, 351–360 CrossRef CAS.
- N. B. Osman, N. Shamsuddin and Y. Uemura, Procedia Eng., 2016, 148, 758–764 CrossRef CAS.
- L. J. Konwar, J. Wärnå, P. Mäki-Arvela, N. Kumar and J. P. Mikkola, Fuel, 2016, 166, 1–11 CrossRef CAS.
- S. Soltani, U. Rashid, R. Yunus and Y. H. Taufiq-Yap, Fuel, 2016, 178, 253–262 CrossRef CAS.
- J. Gupta and M. Agarwal, AIP Conf. Proc., 2016, 1724, 020066 CrossRef.
- A. H. West, D. Posarac and N. Ellis, Bioresour. Technol., 2008, 99, 6587–6601 CrossRef CAS.
- M. K. Lam, K. T. Lee and A. R. Mohamed, Biotechnol. Adv., 2010, 28, 500–518 CrossRef CAS PubMed.
- S. Hu, Y. Guan and H. Han, Appl. Energy, 2011, 88, 2685–2690 CrossRef CAS.
- Y. Fan, F. Su, K. Li, C. Ke and Y. Yan, Sci. Rep., 2017, 7, 1–13 CrossRef.
- S. Erdem, R. M. Öksüzoǧlu, S. B. Avşar and B. Erdem, Acta Phys. Pol., A, 2017, 132, 763–766 CrossRef CAS.
- S. Shylesh, V. Schünemann and W. R. Thiel, Angew. Chem., Int. Ed., 2010, 49, 3428–3459 CrossRef CAS PubMed.
- F. Zhang, X. F. Tian, Z. Fang, W. Jiang and M. Yao, Energy Convers. Manage., 2017, 142, 107–116 CrossRef CAS.
- K. Ullah, M. Ahmad, S. Sultana, L. K. Teong, V. K. Sharma, A. Z. Abdullah, M. Zafar and Z. Ullah, Appl. Energy, 2014, 113, 660–669 CrossRef CAS.
- C. Liu, P. Lv, Z. Yuan, F. Yan and W. Luo, Renew. Energy, 2010, 35, 1531–1536 CrossRef CAS.
- J. Guo, J. Liang, Y. Chu, Y. Huaqiang and Y. Chen, Chin. J. Catal., 2010, 31, 278–282 CrossRef CAS.
- L. Jin, X. Zhao, J. Ye, X. Qian and M. Dong, Catal. Commun., 2018, 107, 43–47 CrossRef CAS.
- S. H. H. Al-jaberi, U. Rashid, F. A. J. Al-doghachi and G. Abdulkareem-alsultan, Energy Convers. Manage., 2017, 139, 166–174 CrossRef CAS.
- Q. Ai, P. Chen, Y. Feng and Y. Xu, Cryst. Growth Des., 2017, 17, 2473–2477 CrossRef CAS.
- K. Jacobson, R. Gopinath, L. C. Meher and A. K. Dalai, Appl. Catal., B, 2008, 85, 86–91 CrossRef CAS.
- K. W. Park, J. H. Choi, B. K. Kwon, S. A. Lee, Y. E. Sung, H. Y. Ha, S. A. Hong, H. Kim and A. Wieckowski, J. Phys. Chem. B, 2002, 106, 1869–1877 CrossRef CAS.
- F. H. Alhassan, U. Rashid and Y. H. Taufiq-Yap, Fuel, 2015, 142, 38–45 CrossRef CAS.
- J. Wang, Z. Wang, L. Yang, G. Yang, C. Miao and P. Lv, Energy, 2017, 141, 1650–1660 CrossRef CAS.
- M. Vijayaraj, R. Gadiou, K. Anselme, C. Ghimbeu, C. Vix-Guterl, H. Orikasa, T. Kyotani and S. Ittisanronnachai, Adv. Funct. Mater., 2010, 20, 2489–2499 CrossRef CAS.
- C. Cannilla, G. Bonura, E. Rombi, F. Arena and F. Frusteri, Appl. Catal., A, 2010, 382, 158–166 CrossRef CAS.
- F. Zhang, X. H. Wu, M. Yao, Z. Fang and Y. T. Wang, Green Chem., 2016, 18, 3302–3314 RSC.
- S. Larumbe, J. I. Pérez-Landazábal, J. M. Pastor and C. Gómez-Polo, J. Appl. Phys., 2012, 111, 103911 CrossRef.
- P. Lu and Y. Hsieh, Carbohydr. Polym., 2010, 82, 329–336 CrossRef CAS.
- S. Laumbe, C. Gomez-Polo, J. I. Perez-Landazabal and J. M. Pastor, Condens. Matter, 2012, 266007, 0953–8984 Search PubMed.
- W. Xie and M. Huang, Energy Convers. Manage., 2018, 159, 42–53 CrossRef CAS.
- K. Silas, W. A. W. A. K. Ghani, T. S. Y. Choong and U. Rashid, Environmental Technology & Innovation, 2018, 12, 273–285 Search PubMed.
- Q. Shu, J. Gao, Z. Nawaz, Y. Liao, D. Wang and J. Wang, Appl. Energy, 2010, 87, 2589–2596 CrossRef CAS.
- F. Y. Sheng, Biodiesel production from palm fatty acid distillate (PFAD) catalyzed by acid catalysts and biodiesel purification via polymeric membranes, Master of Engineering, Unviersiti Tunku Abdul Rahman, Malaysia, 2016.
- M. Pudukudy, A. Kadier, Z. Yaakob and M. S. Takriff, Int. J. Hydrogen Energy, 2016, 41, 18509–18521 CrossRef CAS.
- F. H. Alhassan, U. Rashid and Y. H. Taufiq-Yap, J. Oleo Sci., 2015, 64, 505–514 CrossRef CAS PubMed.
- F. Lian, B. Sun, Z. Song, L. Zhu, X. Qi and B. Xing, Chem. Eng. J., 2014, 248, 128–134 CrossRef CAS.
- H. H. Mardhiah, H. C. Ong, H. H. Masjuki, S. Lim and Y. L. Pang, Energy Convers. Manage., 2017, 144, 10–17 CrossRef CAS.
- W. Wang, W. Chu, N. Wang, W. Yang and C. Jiang, Int. J. Hydrogen Energy, 2016, 41, 967–975 CrossRef CAS.
- K. Narasimharao, A. Lee and K. Wilson, J. Biobased Mater. Bioenergy, 2008, 1, 301–314 Search PubMed.
- E. C. Abbah, G. I. Nwandikom, C. C. Egwuonwu and N. R. Nwakuba, Am. J. Energy Eng., 2016, 3, 16–20 Search PubMed.
- Q. Li, S. Chen, L. Zhuang, X. Xu and H. Li, J. Mater. Res., 2012, 27, 3083–3089 CrossRef CAS.
- G. Mae, A. Bureros, A. A. Tanjay, D. Elmer, S. Cuizon, A. W. Go, L. K. Cabatingan, R. C. Agapay and Y. Ju, Renew. Energy, 2019, 138, 489–501 CrossRef.
- M. Huang, J. Luo, Z. Fang and H. Li, Appl. Catal., B, 2016, 190, 103–114 CrossRef CAS.
- Q. Shu, J. Gao, Z. Nawaz, Y. Liao, D. Wang and J. Wang, Appl. Energy, 2010, 87, 2589–2596 CrossRef CAS.
- S. H. Shuit and S. H. Tan, BioEnergy Res., 2015, 8, 605–617 CrossRef CAS.
- G. Abdulkareem-Alsultan, N. Asikin-Mijan, N. Mansir, H. V. Lee, Z. Zainal, A. Islam and Y. H. Taufiq-Yap, J. Anal. Appl. Pyrolysis, 2018, 137, 171–184 CrossRef.
- C. S. Castro, C. Ferreti, J. I. Di Cosimo and J. M. Assaf, Fuel, 2013, 103, 632–638 CrossRef CAS.
- S. Echeandia, B. Pawelec, V. L. Barrio, P. L. Arias, J. F. Cambra, C. V Loricera and J. L. G. Fierro, Fuel, 2014, 117, 1061–1073 CrossRef CAS.
- N. Asikin-Mijan, H. V. Lee, J. C. Juan, A. R. Noorsaadah, H. C. Ong, S. M. Razali and Y. H. Taufiq-Yap, Appl. Catal., A, 2018, 552, 38–48 CrossRef CAS.
|
| This journal is © The Royal Society of Chemistry 2020 |
Click here to see how this site uses Cookies. View our privacy policy here. 
 Open Access Article
 This Open Access Article is licensed under a Creative Commons Attribution-Non Commercial 3.0 Unported Licence
 *a,
Thomas Shean Yaw Choongb and
Imededdine Arbi Nehdicd
*a,
Thomas Shean Yaw Choongb and
Imededdine Arbi Nehdicd