DOI:
10.1039/C9RA08105D
(Paper)
RSC Adv., 2020,
10, 4156-4165
Electrical conductivity of anisotropic PMMA composite filaments with aligned carbon fibers – predicting the influence of measurement direction
Received
6th October 2019
, Accepted 16th December 2019
First published on 24th January 2020
Abstract
In order to study the electrical conductivity of anisotropic PMMA/carbon fiber (CF) composites, cylindrical PMMA/CF filaments were extruded through a capillary rheometer, resulting in an induced CF orientation along the extrusion direction. The aspect ratios of the CFs in the filaments were accurately regulated using a two-step melt mixing process. By measuring the vertical and horizontal resistances of filaments where the outermost layer was successively peeled off, the anisotropic conductivities could be calculated. This was done using a novel analytical model where each cylindrical composite filament was defined as a structure consisting of three concentric cylinders with potentially different conductivities and CF orientations. The electrical conductivity increased with the degree of fiber orientation along the voltage direction and the effects of anisotropy and measurement direction were incorporated into the (isotropic) McLachlan equation. The required distance for electrical contact between the CFs was calculated to be 16 nm. Finite element (FEM) simulations were successfully utilized to confirm the data.
1. Introduction
Conductive polymer composites (CPCs) have attracted extensive scientific attention due to their high electrical conductivity and good mechanical properties.1–4,28–35 They are utilized in many applications, such as sensors, fuel cell electrodes, and batteries.5–7 The CPCs are usually obtained by mixing a polymer matrix with conductive fillers, such as carbon fibers (CFs) or carbon nanotubes (CNTs) or carbon black (CB), etc. The conductivity of the CPCs depends on the number of “conductive pathways” which are formed by the conductive fillers. When the volume fraction of the fillers increases, a certain critical value (the percolation threshold φc) can be reached when the conductivity of the CPCs increases by several orders of magnitude.8,9
The electrical conductivity of a CPC is not only influenced by the filler volume fraction and the filler- and matrix conductivities, but also by the shape and geometrical arrangement of the fillers. For example, the aspect ratio (AR) of the carbon fibers must be considered when designing CF composites. It has been reported that a larger AR leads to a lower percolation threshold.10 Moreover, the orientation of the CFs inside the CPCs also influences the composite conductivity significantly. In our previous work an equation for predicting the percolation threshold of anisotropic fiber composites was presented, which accounts for the influence of the AR and orientation of the fibers.11 It was also proved that a greater orientation leads to a higher percolation threshold.11 The main challenge when studying CPCs is to predict the conductivity precisely. Due to the shear gradient across the channel section, the average angle between the CFs and the extrusion direction decreases from the outer part of the composite to the center such that the CFs in the middle part of the composite cylinder becomes less oriented. The composite conductivity for a section of an extruded filament is thus depending on the radial position of the material. In this study, the radial dependence of the CB orientation will be exploited for revealing a relationship between the CF orientation and the composite conductivity for PMMA/CF composites.
For anisotropic CPCs, Weber and Kamal proposed the “contact model”12 to predict the longitude conductivity (measuring voltage direction parallel to the fibers orientation, eqn (1)) and transverse conductivity (measuring voltage direction perpendicular to the fibers orientation, eqn (2)):
| |
 | (1a) |
| |
 | (2a) |
where
σc,long and
σc,trans are the longitude and transverse conductivities of the composite, respectively.
d = diameter of the fibers,
L = average length of the fibers,
θ = average angle between the inclination of fibers and the direction of the applied voltage.
φf and
σf are the volume fraction of the fillers and the conductivity of the fillers, respectively.
dc is the diameter of the circle of contact, which depends on the applied voltage.
13,14 β is a coefficient to describe the participating fillers in the conductive network. For fillers with volume fraction
φf below percolation threshold
φc,
β = 0; when the filler volume fraction
φf reaches a saturated volume fraction
φt,
β = 1; for fillers volume fraction in the range
φc <
φf <
φt,
β follows:
| |
 | (3) |
X is a factor depending on the contact number of fibers:
| |
 | (4) |
It can be noted that eqn (1a) and (2a) becomes zero when φf = 0. In a real composite the conductivity will rather approach the polymer conductivity σm when the filler fraction decreases towards zero. The equations thus become significantly more realistic by adding the contribution of σm, such that:
| |
 | (1b) |
| |
 | (2b) |
2. Experimental section
2.1 Sample preparation
The matrix material was PMMA Plexiglas 7N (Evonik Röhm GmbH, Germany), with mass average  and polydispersity index = 1.52. Chopped CFs were obtained from Tenax® – JHT C493 6 mm (Toho Tenax Europe GmbH) with a diameter of 7 μm, an initial length of 6 mm and a specific resistance of 1.7 × 10⁻³ Ω cm.
A two-step mixing procedure was applied in this study (Fig. 1). Prior to processing, all the materials were dried under vacuum at 80 °C for 24 hours. PMMA/CF composites were prepared by melt mixing in an internal kneader PolyDrive (Haake, 557-8310) at a temperature of 200 °C and a rotation speed of 60 rpm for 20 minutes. The composites (50 vol%) produced according to this process are referred as 1st-step mixing.11
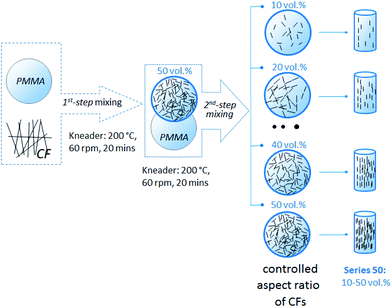 |
| | Fig. 1 Process flow chart of the two-step melt mixing method, in order to control the AR of the CFs.11 | |
Composites from 1st-step mixing were treated as master batches (MB), and portions of these batches were further diluted with pure PMMA to the required concentration (2nd-step mixing): 10 vol%; 20 vol%; 30 vol%; 35 vol%; 40 vol%. After melt mixing, all the composites, with controlled aspect ratio of CFs, were ground into granules and dried under vacuum at 80 °C for 24 h. After drying, the composite granules were extruded at 200 °C in a capillary rheometer (Göttfert, Rheograph 2003) at a constant extrusion speed of 0.08 mm s−1, with a die of 10 mm in length, 3 mm in diameter, to induce the orientation of CFs in the extruded composites filament.
2.2 Investigation of the CF orientation
In order to investigate the statistical distribution of the CFs orientation in the extruded CPC sample, the composite filaments were set in an epoxy resin and polished until the width of the exposed section of the sample was equal to the original diameter of the filament, i.e. 3 mm. The CF orientation was then studied using a light microscope (Leitz, Orthoplan P). The obtained images were then analyzed using the JMicrovision image analysis freeware. At least 1200 fibers per concentration were measured.
2.3 Longitudinal volume resistivity (RL) measurements in the extrusion direction
The longitudinal volume resistivity along the extrusion direction was measured as illustrated in Fig. 3. Both ends of the cylindrical filament (with length L and diameter D) were polished and coated with silver paste in order to improve the contact between the sample and the electrodes. A constant voltage of 1 V was applied parallel to the extrusion direction of the filament, i.e., the CFs orientation, using a Keithley 6487 Pico ammeter.
 |
| | Fig. 2 Polishing approach to assess the orientation of CFs in the CPC filament, in order to reveal the CFs orientation. | |
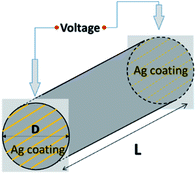 |
| | Fig. 3 Longitude volume resistivity measurement on the PMMA/CFs filament in vertical direction. | |
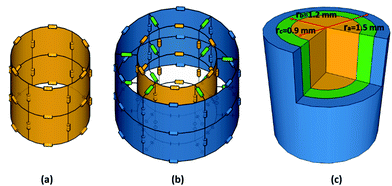
Afterwards, a “peeling-off” procedure was applied for further investigation of the longitudinal resistivity of the cylindrical filaments. As described in Fig. 4, the original extruded cylindrical filament (with 1.5 mm radius) was approximated as a composite object consisting of a thin cylinder (yellow in Fig. 4(c), with radius 0.9 mm) covered by two cylindrical shells (green and blue) with thickness 0.3 mm, respectively. The conductivity inside each of the three geometrical sub-domains was assumed to be approximately constant. In order to reveal these local conductivities, the outermost radial layer of each sample was step-by-step peeled off. After each peeling step, the samples were ultrasonic washed with ethanol, dried at 80 °C for 12 hours, the end-sections were covered with silver and the longitudinal resistivity was measured. Consequently, for each CF volume fraction, four longitudinal resistances (RL,a to RL,c) were measured, from which the local longitudinal conductivities could be calculated.
 |
| | Fig. 4 “Peeling-off” procedure to obtain the longitudinal resistivity of the different regions from the CPC filament. (a) Original extruded filament with 1.5 mm radius; (b) peeled-off filament with 1.2 mm radius; (c) peeled-off filament with 0.9 mm radius. The light-colored discs at the bottom only indicate the original geometry of the filament. | |
2.4 Transversal volume resistivity (RT) measurements in the horizontal direction
The transversal volume resistivity of samples with length L was measured as illustrated in Fig. 5. The CPC filament sample was embedded into an epoxy resin, subsequently cured at room temperature for 24 hours, and then polished until the widths of the two exposed surfaces (W × L) were equal to the desired width W. The sample thickness h was computed from:| |
 | (5) |
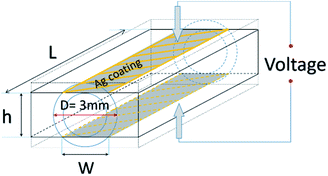 |
| | Fig. 5 Transverse volume resistivity measurement on the PMMA/CFs filament in the horizontal direction. | |
The exposed rectangular areas of the cylindrical filament were then coated with silver paste and the resistivity between the faces was measured with a constant (1 V) voltage without heating the sample. The direction of the voltage was applied perpendicular to the extrusion direction of the filament, i.e. the direction of CFs orientation, also using a Keithley 6487 Pico ammeter.
During each polishing step, the sample was polished until the target width (1, 1.8 or 2.4 mm) of the exposed surfaces was reached, as shown in Fig. 6. The subdomain coloring of the filament in Fig. 6 corresponds to the coloring of Fig. 4. Between each polishing step, the sample was ultrasonic washed with ethanol and dried. Both sides of the sample were coated with silver and the resistance between the coated surfaces was measured. Four transversal resistances (RT,a to RT,c) were thus measured from each specimen. These resistances were in turn used to estimate the local transversal conductivity of each subdomain.
 |
| | Fig. 6 A four-step polishing procedure for obtaining the local transversal conductivities of a CPC filament. Each filament is polished until the desired width (W) of the exposed sample is reached. (a) Wa = 1 mm, (b) Wb = 1.8 mm, (c) Wc = 2.4 mm. | |
3. Experimental results
3.1 Investigation of the CF orientation
Fig. 7(a) shows the middle section of a cylindrical 3 mm PMMA/CF filament with 35 vol% CFs. The figure is intended as an illustration of how the CF-orientation is determined in this study and the sample was polished as presented in Fig. 2. The CFs can be seen as bright segments in the micrograph. 1200 CFs were randomly chosen from the picture and the inclination between each CF and the extrusion direction were determined (Fig. 7(b)), resulting in an averaged inclination angle θ which can be inserted in eqn (1b) and (2b). The marked areas A (blue), B (green) and C (yellow) in Fig. 7(b) correspond to the assumed structure in Fig. 4 and 6. It should be noted that these inclination angles are taken from a two-dimensional (2-D) image, which differs from the real circumstance in a 3-D system, however in the chosen plane this effect is negligible. Due to the shear gradient across the channel section, the average angle between the CFs and the extrusion direction decreases from the outer part of the composite to the center. The CFs in the center part of the composite cylinder are thus less oriented. Moreover, the scattering in the CF orientation (Fig. 7(b)) is symmetric around the center due to axisymmetric geometry (r = 0), resulting in a uniform CF-orientation distribution in the extruded filament samples. The 1200 data points in Fig. 7(b) are subsequently divided into 15 intervals according to the X-position, and the average value of absolute CFs inclination as a function of distance from the center axis is presented is Fig. 7(c), which is consistent with the shear stress distribution in the capillary.
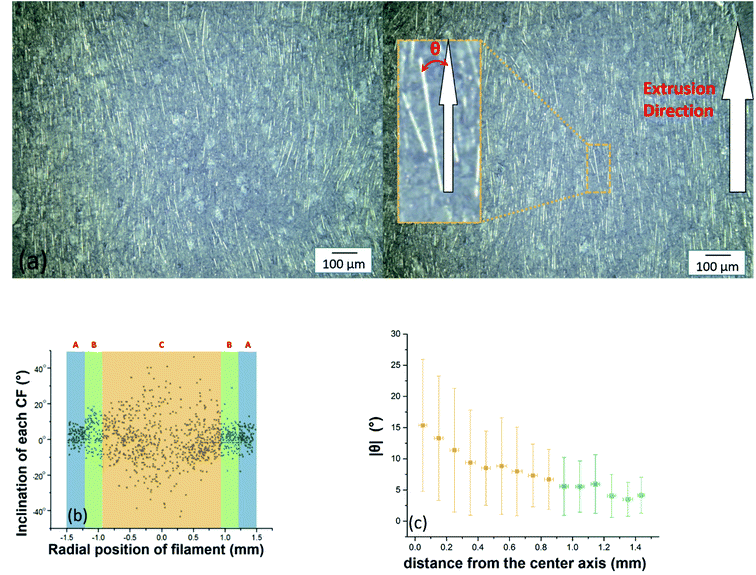 |
| | Fig. 7 (a) The middle section of the 3 mm diameter anisotropic PMMA/CF filament with 35 vol% CF. (b) The 1200 CFs inclination vs. radical position of the sample. (c) Average value of absolute CFs inclination as a function of the CF distance from the center axis. | |
Measured CF-orientations 〈cos2![[thin space (1/6-em)]](https://www.rsc.org/images/entities/char_2009.gif) θ〉 were gathered for 6 different CF vol% and 3 different radial positions (layers A–C) in Table 1. The CF-orientation is generally reduced from the rim part (A) to the center part (C), indicating that these regions were subject to a corresponding decreasing shear stress during the extrusion process.
θ〉 were gathered for 6 different CF vol% and 3 different radial positions (layers A–C) in Table 1. The CF-orientation is generally reduced from the rim part (A) to the center part (C), indicating that these regions were subject to a corresponding decreasing shear stress during the extrusion process.
Table 1 The average orientation of CFs 〈cos2![[thin space (1/6-em)]](https://www.rsc.org/images/entities/char_2009.gif) θ〉 in the different position of the 3 mm diameter anisotropic PMMA/CF filament with different CFs concentration
θ〉 in the different position of the 3 mm diameter anisotropic PMMA/CF filament with different CFs concentration
| Region |
cos2![[thin space (1/6-em)]](https://www.rsc.org/images/entities/char_2009.gif) θ θ |
| 10 vol% |
20 vol% |
30 vol% |
35 vol% |
40 vol% |
50 vol% |
| A (blue) |
0.991 |
0.989 |
0.988 |
0.990 |
0.987 |
0.943 |
| B (green) |
0.986 |
0.987 |
0.977 |
0.984 |
0.979 |
0.976 |
| C (yellow) |
0.985 |
0.964 |
0.978 |
0.954 |
0.947 |
0.938 |
3.2 Model explanation
A CPC filament with a radially uniform filler fraction, which is assumed in this study, can be modeled as a resistor network (Fig. 8(a)). A filament for example consisting of two radially separated material layers (i.e. one inner region and one outer region) can be represented by the resistor network of Fig. 8(b), where the colors of the resistors (blue, green, yellow) indicate different resistance values. The radial (green) resistors are neglectable for the conductivity, which means that the CPC filaments of this study can be modeled as resistive networks with three (non-connected) concentric cylinders (Fig. 8(c)). The electrical properties of the CPCs were (among others) analyzed using this model.
 |
| | Fig. 8 The assumed structure of a CPC filament in this study. (a) A simple resistor network mimicking a filament with radially independent conductivity; (b) a resistor network with two concentric layers, connected radially with green resistors; (c) a resistor network with three concentric layers, where the radial resistors were omitted. | |
3.2.1 Analysis on the longitude conductivity σ∥. For each CF-concentration, four longitudinal resistances (RL,a–RL,d) had been measured. The next objective was thus to convert the (global) resistance data to the (local) conductivities of the concentric filament layers. It was observed that the geometry of Fig. 4(c) can be considered as a parallel coupling (resistivity RL,b) between the green cylindrical shell (resistivity RL,green) and the yellow solid cylinder (resistivity RL,c). Since the longitudinal resistances RL,b and RL,c are known, the unknown RL,green of the green shell can be calculated from:| |
 | (6) |
The same procedure was used to calculate the resistance RL,blue for the blue cylindrical shell. Since the dimensions of the three cylinders were known, the longitudinal electrical conductivity of each region σ∥,A (blue region), σ∥,B (green region) and σ∥,C (yellow region) from the 3 mm filament could thus be calculated. If L is the length of the sample, S is the area of the sample, and R is the corresponding resistance, then the conductivity σ was calculated as follows:
| |
 | (7) |
3.2.2 Analysis of the transverse conductivity σ⊥. In order to determine the transversal volume resistance (RT) in the horizontal direction, the samples were polished as presented in Fig. 6. Since the length of the investigated samples in Fig. 6 always remain the same, therefore, only the cross section of the samples are presented in this section. The three cross sections of the sample (with three different polished width Wa, Wb, Wc), as well as the three corresponding measured resistances RT,a, RT,b, RT,c are presented in Fig. 9(a). Three concentric circles are assumed, with a constant resistivity ρ1, ρ2, and ρ3 in each region (blue, green and yellow, respectively). This section presents the strategy on calculating the resistivity ρ1–ρ3 from the experimental resistances RT,a–RT,c.
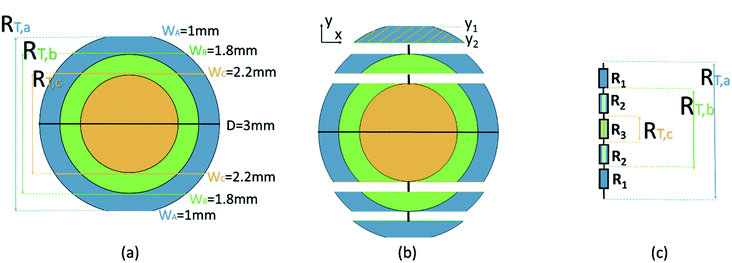 |
| | Fig. 9 (a) Collection of three cross sections of the sample from Fig. 6. (b) A rough assumption on the resistance, based on a series connection, to calculate R1. (c) The schematic diagram of the resistors series connection based on (b). | |
The applied voltage direction is given along the Y-axis, thus the measured resistance RT,a is roughly considered as a series connection between the resistors in Fig. 9(b) and (c). Therefore, the resistance of the shadowed area R1:
| |
 | (8) |
where
W(
y) is the width of the sample at the position
y,
L is the length of the sample as presented in
Fig. 6. Thus, the resistivity
ρ1 can be obtained. Similarly, the resistance of structure
R2 presented in
Fig. 10(a) is given by:
| |
 | (9) |
which is further assumed as a parallel connection between
RL (left),
RC (center) and
RR (right), as presented in
Fig. 10(b):
| |
 | (10) |
 |
| | Fig. 10 (a) The resistor R2 and the corresponding structure. (b) A rough assumption of the resistor R2 based on a parallel connection. (c) A rough estimation on the resistance of RR, based on a series connection. | |
Combining eqn (9) and (10), yields:
| |
 | (11) |
Since the resistivity ρ1 (blue material, as presented in Fig. 10(c)) is known, the resistor RR in Fig. 10(b) is considered as a series connection of infinite thin layers of material, which can be obtained by the area calculated by integral. Thus, the resistance of RC can be calculated using eqn (11), as well as the resistivity ρ2 (green material) using similar strategy as eqn (8).
As all the resistivity ρ1–ρ3 are obtained, the transverse conductivity σ⊥ of each four region can be calculated. All the logarithmic values of the longitudinal electrical conductivity σ∥ and the transversal electrical conductivity σ⊥ are presented in different color in Fig. 11. The 〈cos2![[thin space (1/6-em)]](https://www.rsc.org/images/entities/char_2009.gif) θ〉 values in the corresponding region are also shown.
θ〉 values in the corresponding region are also shown.
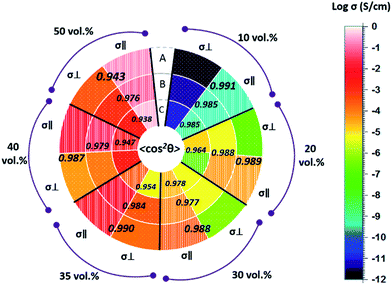 |
| | Fig. 11 The logarithm longitude electrical conductivity σ∥ and transverse electrical conductivity σ⊥ are presented in different colors, as well as the 〈cos2![[thin space (1/6-em)]](https://www.rsc.org/images/entities/char_2009.gif) θ〉 value in each corresponding region. θ〉 value in each corresponding region. | |
It can be noted that the longitudinal electrical conductivity σ∥ is always higher than transverse σ⊥. Presumably it is because that a parallel orientation of CFs to the voltage applied is a more effective in building an electrical pathway, which has also been reported in the open literature.15–18
3.3 Validation using computer simulation on the model results
Since the analytical model for computing the longitudinal conductivity from available resistivity data is trivial, assuming a linear voltage decrease in the extrusion direction, no additional verification of that model is needed. However, since the analytical model for computing the transversal conductivity is quite complex, finite element modeling (FEM) with the software Comsol Multiphysics was used in order to verify the reliability and validity of the ‘polishing’ procedure for transverse conductivity. Four different FEM models were constructed (Fig. 12), corresponding to the four geometries of Fig. 6.
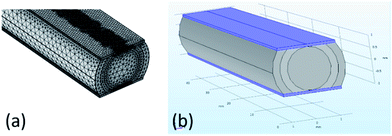 |
| | Fig. 12 (a) The mesh size in the finite element analysis of software Comsol Multiphysics; (b) the simulated model of the sample, the blue plate present electrode. | |
As shown in Fig. 12, the geometry of each model consists of the mid-section of a horizontal cylinder comprising three concentric cylindrical layers. The conductivity of each cylindrical layer is taken from the theoretical approach in Chapter 3.2 while the conductivity of the gold-plated electrodes, shown as blue regions in Fig. 12(b), is set to 4.1 × 10⁷. The electrode on the upper surface provides a voltage of 1 V and the electrode on the lower surface is grounded, i.e. set to 0 V. No-flux boundary conditions were used on remaining external boundaries and continuity boundary conditions were used for all internal boundaries. A sufficiently dense computational mesh was constructed and the static transverse DC resistivity of the composite objects was finally computed and compared with the corresponding experimental data.
The simulation results based on the proposed transverse conductivity σ⊥ are presented in Fig. 13, together with the experimental resistance measurement. The simulation results are presented by solid circles. The simulated data are always a bit lower, but the deviation is less than 10% and thus negligible to the large scale. It can be seen that the simulation results demonstrating an agreement with the experimental measurement.
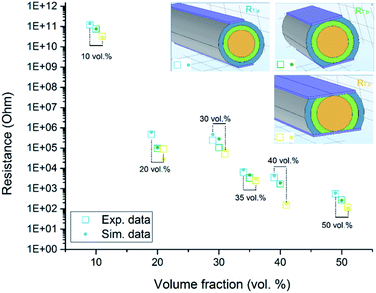 |
| | Fig. 13 The logarithm value of transverse resistance versus the volume fraction of the CFs in the sample. The experimental data are presented in hollow squares and simulation results are presented by solid circle. For sample with each CF vol%, three different resistance RT,a, RT,b, RT,c are presented in different colors as shown in the inset. | |
3.4 Model discussion
The longitudinal and transverse conductivities of the different CPC layers are presented in Fig. 14(a) and (b), respectively. The measured conductivity of the pure PMMA matrix, which is marked with grey points in both figures, is higher than the conductivity of all composites with 10 vol% CFs. On one hand, it should be noted that the measured conductivity of the pure PMMA was several orders of magnitudes higher than the corresponding values from the literature.2 On the other hand, several studies have reported that the addition of small amounts of well-dispersed (nano) particles can result in a decreased conductivity.26,27 Balberg18,19 has predicted that the percolation threshold of a CPC depends on the filler aspect ratio (AR) and the orientation of the fillers. The percolation thresholds of the transverse samples and longitude samples were therefore expected to be equal in this study, a hypothesis which was confirmed by the experimental data in Fig. 14, showing percolation around 10–20 vol% for all systems. According to the McLachlan equation,20–23 the conductivity can be precisely predicted once the percolation threshold as well as the matrix- and filler conductivities are determined. A direct usage of the McLachlan equation would however result in identical transversal and longitudinal conductivities also for anisotropic composites, which is unrealistic and in contrast to the results of this study. The discrepancy is most probably explained by the fact that the McLachlan equation assumes isotropic composites and that neither McLachlan nor Balberg considered the measuring direction, i.e. the direction of applied voltage on the samples.
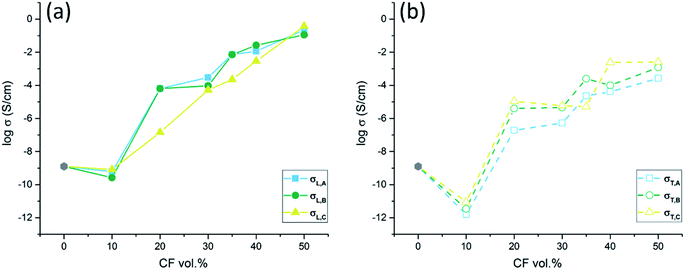 |
| | Fig. 14 (a) The logarithm longitudinal electrical conductivity σL and (b) the logarithm transverse electrical conductivity σT in different shells of the cylindrical filament. | |
A distinct vertical shift (∼2 magnitudes) was observed between the longitudinal conductivity (solid conductivity curve, Fig. 14(a)) and the transverse conductivity (dashed conductivity curve, Fig. 14(b)). This shift was expected since the presence of highly conducting CFs primarily enhances the current flow (and thus the conductivity) along the fiber direction. A less pronounced vertical shift was also observed between the conductivities of the three radial layers in Fig. 14(a) and (b). The longitudinal conductivity was typically lowest for the innermost layer (C) while the transverse was typically lowest for the outermost shell (A). The explanation is that the CFs are highly anisotropic in the outer shells of the composite cylinder (layers A) but less oriented in the central part of the cylinder (layers B and C). The dominant vertical shift factor, which is increasing with increasing degree of CPC anisotropy, can be used to improve the McLachlan equation such that it (1) works better for anisotropic composites and (2) includes the effect of measurement direction. For typical composites, where the composite conductivity is dominated by the contribution from the fibers, the improved contact eqn (1b) and (2b) will coincide with the original contact eqn (1a) and (2a). A predicted ratio between the transverse and longitudinal conductivities can be achieved for such systems by combining eqn (1a) and (2a):
| |
 | (12) |
In Fig. 15, experimentally measured values for the ratio between the transversal- and the longitudinal conductivities are plotted versus tan2(θ). The experimental data points are shown as symbols in different colors, where each color corresponds to one of the shells A–C and each symbol corresponds to a specific CF filler concentration. The best linear fit (dashed line) leads to a slope of 1.03, which closely resembles eqn (12), i.e. a slope of 1.00.
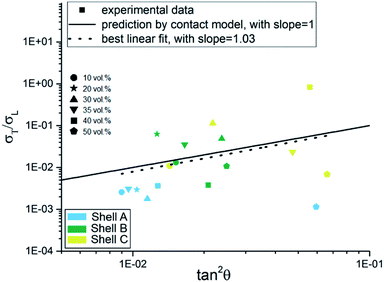 |
| | Fig. 15 The ratio between σtrans/σlong as a function of tan2![[thin space (1/6-em)]](https://www.rsc.org/images/entities/char_2009.gif) θ according to eqn (12). The solid line shows eqn (12), while the dashed line indicates the best linear fit. θ according to eqn (12). The solid line shows eqn (12), while the dashed line indicates the best linear fit. | |
Considering the large scattering at the experimental data points, the theoretical prediction is in reasonable agreement with the experimental data. It should also be noted that the CF orientations in this study were measured from 2D micrographs, resulting in slightly different angles than the correct 3D angles. Moreover, rewriting eqn (1)–(3) yields:
| |
 | (13) |
The best fit line of eqn (13) is presented in Fig. 16 together with corresponding experimental data. A value of 18 vol% was obtained for φc. The φt became 0.84, indicating a saturated CF concentration of 84 vol%, after which all the CFs were participating in the conductive network. The diameter of the circle of contact between CFs was determined to 0.016 μm (illustrated as inset in Fig. 16), which is much higher than the reported value 2.1 × 10⁻⁴ μm,12 1.4 × 10⁻⁷ μm (ref. 13) and 2.1 × 10⁻⁶ μm,14 indicating a much closer contact between highly oriented CFs in the anisotropic extruded filament. Since the theoretical predictions are promising, it is reasonable to calculate the difference Δf = σlong − σtrans from eqn (13) such that:
| | |
Δf = σlong − σtrans = σlong(1 − tan2(θ))
| (14) |
where
σ* is the predicted conductivity from the unmodified (isotropic) McLachlan equation and
θ* is the average angle in a perfectly isotropic composite. With this modification the McLachlan equation can most probably predict both longitudinal and longitudinal composite conductivities for anisotropic composites with average angle
θ of filler against the electrical field. Additional experimental measurements and modeling results
24,25 will however be needed to further strengthen the revealed effect and hypotheses for explanation.
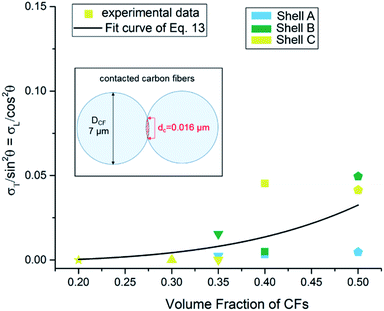 |
| | Fig. 16 Fit curve in order to investigate the saturated concentration of CFs and the contact distance. | |
4. Conclusions
This study examined how the electrical conductivity of anisotropic PMMA/CFs cylindrical composites filament was affected by fiber orientation and measurement direction. The aspect ratio of the CFs was kept constant whereas the orientation of the CFs was systematically investigated. Novel ‘peeling-off’ and ‘polishing’ procedures were proposed to investigate the longitudinal and transversal conductivities, respectively. Finite element (FEM) modelling of the ‘polishing’ procedure was utilized, demonstrate consistency with the experimental results. By comparing the longitudinal and transversal conductivities, it was observed that a higher orientation of the fillers led to a higher conductivity along the voltage direction, a phenomenon which could be captured by introducing a single vertical shift constant. An analytical expression for the shift function was obtained by combining two equations from an existing contact model, which was improved such that the contact model now works also for low particle filler fractions. The shift function expression was (to some extent) validated by experimental data. Finally, the shift factor was incorporated into the (isotropic) McLachlan equation, which is currently the most efficient model for predicting the (isotropic) composite conductivity when the constituent conductivities and the percolation threshold are known. With this improvement, the McLachlan equation can also be used for anisotropic composites and the effect of measurement direction is included. Additional experimental measurements for validating the hypothesis are anticipated in future studies.
Conflicts of interest
There are no conflicts to declare.
Acknowledgements
The technical support from Marko Heyder and Harald Rost (Institute of Polymer Materials, Friedrich-Alexander-University Erlangen-Nuremberg) is acknowledged. Yijing Qin acknowledges the financial support for her PhD study from China Scholarship Council, China. Dr Muchao Qu would like to thank Emerging Fields Initiative (EFI) funding supported from Friedrich-Alexander-University Erlangen-Nuremberg, Germany. Qun Gao and Wei Xu would like to thank the Science and Technology Planning Projects of Guangzhou, China (No. 201905010007).
References
- X. Liang, L. Ling, C. Lu and L. Liu, Resistivity of carbon fibers/ABS resin composites, Mater. Lett., 2000, 43(3), 144–147 CrossRef CAS.
- A. Motaghi, A. Hrymak and G. H. Motlagh, Electrical conductivity and percolation threshold of hybrid carbon/polymer composites, J. Appl. Polym. Sci., 2015, 132(13), 41744 CrossRef.
- B. Chen, K. Wu and W. Yao, Conductivity of carbon fiber reinforced cement-based composites, Cem. Concr. Compos., 2004, 26(4), 291–297 CrossRef CAS.
- G. Wu, S. Asai and M. Sumita, A self-assembled electric conductive network in short carbon fiber filled poly (methyl methacrylate) composites with selective adsorption of polyethylene, Macromolecules, 1999, 32(10), 3534–3536 CrossRef CAS.
- F. Nilsson and M. Unge, Conductivity simulations of field-grading composites, J. Phys. D: Appl. Phys., 2016, 49(33), 335303 CrossRef.
- M. Qu, F. Nilsson, Y. Qin, G. Yang, Y. Pan, X. Liu and D. W. Schubert, Electrical conductivity and mechanical properties of melt-spun ternary composites comprising PMMA, carbon fibers and carbon black, Compos. Sci. Technol., 2017, 150, 24–31 CrossRef CAS.
- N. Athanasopoulos and V. Kostopoulos, Prediction and experimental validation of the electrical conductivity of dry carbon fiber unidirectional layers, Composites, Part B, 2011, 42(6), 1578–1587 CrossRef.
- N. Athanasopoulos, D. Sikoutris, N. J. Siakavellas and V. Kostopoulos, Electrical resistivity prediction of dry carbon fiber media as a function of thickness and fiber volume fraction combining empirical and analytical formulas, Composites, Part B, 2015, 81, 26–34 CrossRef CAS.
- W. S. Bao, S. A. Meguid, Z. H. Zhu, Y. Pan and G. J. Weng, A novel approach to predict the electrical conductivity of multifunctional nanocomposites, Mech. Mater., 2012, 46, 129–138 CrossRef.
- M. Qu, F. Nilsson and D. W. Schubert, Effect of Filler Orientation on the Electrical Conductivity of Carbon Fiber/PMMA Composites, Fibers, 2018, 6(1), 3 CrossRef.
- M. Qu and D. W. Schubert, Conductivity of melt spun PMMA composites with aligned carbon fibers, Compos. Sci. Technol., 2016, 136, 111–118 CrossRef CAS.
- M. Weber and M. R. Kamal, Estimation of the volume resistivity of electrically conductive composites, Polym. Compos., 1997, 18(6), 711–725 CrossRef CAS.
- P. Tsotra and K. Friedrich, Electrical and mechanical properties of functionally graded epoxy-resin/carbon fibre composites, Composites, Part A, 2003, 34(1), 75–82 CrossRef.
- R. Taipalus, T. Harmia, M. Q. Zhang and K. Friedrich, The electrical conductivity of carbon-fibre-reinforced polypropylene/polyaniline complex-blends: experimental characterisation and modelling, Compos. Sci. Technol., 2001, 61(6), 801–814 CrossRef CAS.
- S. Gong, Z. H. Zhu and S. A. Meguid, Anisotropic electrical conductivity of polymer composites with aligned carbon nanotubes, Polymer, 2015, 56, 498–506 CrossRef CAS.
- Q. Wang, J. Dai, W. Li, Z. Wei and J. Jiang, The effects of CNT alignment on electrical conductivity and mechanical properties of SWNT/epoxy nanocomposites, Compos. Sci. Technol., 2008, 68(7–8), 1644–1648 CrossRef CAS.
- L. Guadagno, M. Raimondo, U. Vietri, L. Vertuccio, G. Barra, B. De Vivo and G. Cosentino, Effective formulation and processing of nanofilled carbon fiber reinforced composites, RSC Adv., 2015, 5(8), 6033–6042 RSC.
- S. H. Munson-McGee, Estimation of the critical concentration in an anisotropic percolation network, Phys. Rev. B: Condens. Matter Mater. Phys., 1991, 43(4), 3331 CrossRef PubMed.
- I. Balberg, N. Binenbaum and N. Wagner, Percolation thresholds in the three-dimensional sticks system, Phys. Rev. Lett., 1984, 52(17), 1465 CrossRef.
- I. Balberg, et al., Excluded volume and its relation to the
onset of percolation, Phys. Rev. B: Condens. Matter Mater. Phys., 1984, 30(7), 3933 CrossRef.
- S. M. David and G. Sauti, The AC and DC conductivity of nanocomposites, J. Nanomater., 2007, 2007(1), 15 Search PubMed.
- D. S. McLachlan, Equations for the conductivity of macroscopic mixtures, J. Phys. C: Solid State Phys., 1986, 19(9), 1339 CrossRef.
- I. Johannsen and K. Jaksik, et al., Electrical conductivity of melt-spun thermoplastic poly(hydroxyl ether of bisphenol A) fibres containing multi-wall carbon nanotubes, Polymer, 2016, 97, 80–94 CrossRef CAS.
- D. W. Schubert, Novel Theoretical Self-Consistent Mean-Field Approach to Describe the Conductivity of Carbon Fiber Filled Thermoplastics—PART I—Theory, Macromol. Theory Simul., 2018, 1700104 CrossRef.
- G. Yang, D. W. Schubert, M. Qu and F. Nilsson, Novel Theoretical Self-Consistent Mean-Field Approach to Describe the Conductivity of Carbon Fiber–Filled Thermoplastics: PART II. Validation by Computer Simulation, Macromol. Theory Simul., 2018, 1700105 CrossRef.
- L. K. H. Pallon, A. T. Hoang, A. M. Pourrahimi, M. S. Hedenqvist, F. Nilsson, S. Gubanski and R. T. Olsson, The impact of MgO nanoparticle interface in ultra-insulating polyethylene nanocomposites for high voltage DC cables, J. Mater. Chem. A, 2016, 4(22), 8590–8601 RSC.
- F. Nilsson, M. Karlsson, L. Pallon, M. Giacinti, R. T. Olsson, D. Venturi and M. S. Hedenqvist, Influence of water uptake on the electrical DC-conductivity of insulating LDPE/MgO nanocomposites, Compos. Sci. Technol., 2017, 152, 11–19 CrossRef CAS.
- N. A. M. Radzuan, A. B. Sulong and J. Sahari, A review of electrical conductivity models for conductive polymer composite, Int. J. Hydrogen Energy, 2017, 42(14), 9262–9273 CrossRef.
- N. A. M. Radzuan, A. B. Sulong and M. Rao Somalu, Electrical properties of extruded milled carbon fibre and polypropylene, J. Compos. Mater., 2017, 51(22), 3187–3195 CrossRef CAS.
- F. Lux, Models proposed to explain the electrical conductivity of mixtures made of conductive and insulating materials, J. Mater. Sci., 1993, 28(2), 285–301 CrossRef CAS.
- Z. Li, L. Wang, Y. Li, Y. Feng and W. Feng, Carbon-based functional nanomaterials: preparation, properties and applications, Compos. Sci. Technol., 2019, 178, 10–40 Search PubMed.
- L. Wang and Q. Li, Photochromism into nanosystems: towards lighting up the future nanoworld, Chem. Soc. Rev., 2018, 47(3), 1044–1097 RSC.
- F. Zhai, Y. Feng, K. Zhou, L. Wang, Z. Zheng and W. Feng, Graphene-based chiral liquid crystal materials for optical applications, J. Mater. Chem. C, 2019, 7(8), 2146–2171 RSC.
- L. Dong, Y. Feng, L. Wang and W. Feng, Azobenzene-based solar thermal fuels: design, properties, and applications, Chem. Soc. Rev., 2018, 47(19), 7339–7368 RSC.
- L. Wang, H. K. Bisoyi, Z. Zheng, K. G. Gutierrez-Cuevas, G. Singh, S. Kumar and Q. Li, Stimuli-directed self-organized chiral superstructures for adaptive windows enabled by mesogen-functionalized graphene, Mater. Today, 2017, 20(5), 230–237 CrossRef CAS.
|
| This journal is © The Royal Society of Chemistry 2020 |
Click here to see how this site uses Cookies. View our privacy policy here.  Open Access Article
 ac,
Fritjof Nilsson*b,
Yijing Qinac,
Guanda Yangac,
Qun Gaod,
Wei Xud,
Xianhu Liu
 e and
Dirk W. Schubertac


 and polydispersity index = 1.52. Chopped CFs were obtained from Tenax® – JHT C493 6 mm (Toho Tenax Europe GmbH) with a diameter of 7 μm, an initial length of 6 mm and a specific resistance of 1.7 × 10⁻³ Ω cm.


![[thin space (1/6-em)]](https://www.rsc.org/images/entities/char_2009.gif) θ〉 were gathered for 6 different CF vol% and 3 different radial positions (layers A–C) in Table 1. The CF-orientation is generally reduced from the rim part (A) to the center part (C), indicating that these regions were subject to a corresponding decreasing shear stress during the extrusion process.
θ〉 were gathered for 6 different CF vol% and 3 different radial positions (layers A–C) in Table 1. The CF-orientation is generally reduced from the rim part (A) to the center part (C), indicating that these regions were subject to a corresponding decreasing shear stress during the extrusion process.![[thin space (1/6-em)]](https://www.rsc.org/images/entities/char_2009.gif) θ〉 in the different position of the 3 mm diameter anisotropic PMMA/CF filament with different CFs concentration
θ〉 in the different position of the 3 mm diameter anisotropic PMMA/CF filament with different CFs concentration
![[thin space (1/6-em)]](https://www.rsc.org/images/entities/char_2009.gif) θ
θ


![[thin space (1/6-em)]](https://www.rsc.org/images/entities/char_2009.gif) θ〉 values in the corresponding region are also shown.
θ〉 values in the corresponding region are also shown.
![[thin space (1/6-em)]](https://www.rsc.org/images/entities/char_2009.gif) θ〉 value in each corresponding region.
θ〉 value in each corresponding region.


![[thin space (1/6-em)]](https://www.rsc.org/images/entities/char_2009.gif) θ according to eqn (12). The solid line shows eqn (12), while the dashed line indicates the best linear fit.
θ according to eqn (12). The solid line shows eqn (12), while the dashed line indicates the best linear fit.


