
 Open Access Article
 This Open Access Article is licensed under a Creative Commons Attribution-Non Commercial 3.0 Unported Licence
Palladium-coated narrow groove plasmonic nanogratings for highly sensitive hydrogen sensing
Senthil Subramanian†
,
Kamal Kumar† and
Anuj Dhawan *
*
Department of Electrical Engineering, Indian Institute of Technology Delhi, Hauz Khas, New Delhi 110016, India. E-mail: adhawan@ee.iitd.ac.in
First published on 24th January 2020
Abstract
In this paper, we propose novel plasmonic hydrogen sensors based on palladium coated narrow-groove plasmonic nanogratings for sensing of hydrogen gas at visible and near-infrared wavelengths. These narrow-groove plasmonic nanogratings allow the incident light to be coupled directly into plasmonic waveguide modes thereby alleviating the need for bulky coupling methods to be employed. We carried out numerical simulations of the palladium coated narrow-groove plasmonic nanogratings using rigorous coupled wave analysis (RCWA). When palladium is exposed to varying concentrations of hydrogen gas, palladium undergoes phase transition to palladium hydride (PdHx), such that there are different atomic ratios ‘x’ (H/Pd) of hydrogen present in the palladium hydride (PdHx) depending on the concentration of the hydrogen gas. RCWA simulations were performed to obtain the reflectance spectral response of the Pd coated nanogratings in both the absence and presence of hydrogen, for various atomic ratios ‘x’ (x ∼ 0.125 to 0.65) in palladium hydride (PdHx). The results of the RCWA simulations showed that as the dielectric permittivity of the palladium (Pd) thin film layers in between the adjacent walls of the plasmonic nanogratings changes upon exposure to hydrogen, significant shifts in the plasmon resonance wavelength (maximum Δλ being ∼80 nm for an increase in the value of the atomic ratio ‘x’ from 0 to 0.65) as well as changes in the differential reflection spectra are observed. The structural parameters of these Pd coated narrow groove nanogratings—such as the nanograting height, gap between the nanograting walls, thickness of the palladium layer, periodicity of the nanogratings—were varied to maximize the shift in the plasmon resonance wavelength as well as the differential reflectance when these nanostructures are exposed to different concentrations of hydrogen (i.e. for different atomic ratios ‘x’ in PdHx).
Introduction
Over the last decade, hydrogen has emerged as a promising clean and sustainable alternative to fossil fuels. One of the risks in employing hydrogen in fuel cells and energy-storage systems is that it is explosive at concentrations above 4%. Hence, the development of highly sensitive and specific sensors for detection of hydrogen is imperative. Conventional hydrogen sensing is primarily carried out by employing electrochemical sensors.1,2 On the other hand, optical sensing of hydrogen is intrinsically safer and has immunity to electromagnetic interference.In contrast to traditional optical technologies,3,4 hydrogen sensors that employ plasmonic properties of metallic nanostructures (such as surface plasmon resonance (SPR) and localized surface plasmon resonance (LSPR)5–17) have recently gained a lot of attention. In the past few years, several plasmonic sensors for detection of hydrogen have been proposed such as SPR sensors based on prism coupling and grating coupling as well as optical fibre based SPR sensors.9,11,12,15,18–21 Several LSPR based hydrogen sensors8,10,16—based on plasmonic nanostructures such as nanoantennas, nanoshells, nanodisks, nanocylinders dimer etc.—have also recently been proposed. Sensors based on plasmonic nanostructures and thin films are characterized by highly sensitivity to minute changes of dielectric permittivity of the surrounding medium and very small sensing volumes. Additionally, strong enhancement of the electromagnetic fields at the metallic surface enables sensitive detection.
Palladium has been employed as an active sensing element in hydrogen sensing due to its attractive features such as ability to selectively adsorb hydrogen22,23 and to reversibly form palladium hydride. Plasmonic sensors based on LSPR of only palladium nanoparticles or nanostructures suffer from broad plasmon resonance spectra. On the other hand, plasmonic sensors based on a combination of palladium and gold nanostructures have recently gained importance, and high sensitivities have been demonstrated in these sensors.8,10,14,16,24,25
In this work, we present numerical modelling and analysis of plasmonic sensors based on palladium coated narrow groove plasmonic nanogratings for sensing of hydrogen gas at visible and near-infrared wavelengths. As narrow groove plasmonic nanogratings allow the incident light to be coupled directly into plasmonic waveguide modes (in the gaps between the adjacent walls of the plasmonic nanogratings), there is no need for bulky coupling methods (such as prism coupling) to be employed. Moreover, for certain dimensions of the narrow groove plasmonic nanogratings, multiple plasmonic waveguide modes can be excited in these nanogratings for both normal and angular incidence of light, leading to multiple plasmon resonance related dips in the reflection spectra. The excellent plasmonic properties of narrow groove plasmonic nanogratings have attracted immense research interest in the last few years. Narrow groove plasmonic nanogratings have been employed for the highly sensitive detection of the dielectric permittivity of the medium surrounding the plasmonic films.26
The plasmonic waveguide modes of narrow groove plasmonic nanogratings lead to high confinement of EM fields inside the gap between the nanogratings. As the dielectric permittivity of the region in between the adjacent walls of the plasmonic nanogratings is varied, significant changes in the plasmon resonance wavelength as well as in the differential reflection spectra are observed. Placing a thin film layer of an active sensing element such as palladium on the surface of the plasmonic nanogratings is expected to lead to a significant shift in the plasmon resonance wavelength spectra (as well as higher values of differential reflectance) when palladium hydride is reversibly formed upon exposure to hydrogen gas. This results from the changes in the dielectric permittivity of the palladium thin film layer (when it reversibly changes to palladium hydride) occurring in the region of high EM fields confined inside the narrow grooves of the nanograting. Moreover, varying the structural parameters of the narrow groove plasmonic nanogratings allows tuning of the plasmonic modes, such that these plasmonic sensors could be employed for hydrogen detection at multiple spectral regions (visible and infrared).
The sensitivity of our sensors was calculated by determining the shift in the plasmon resonance wavelength (Δλ) for a 4 vol% increase in the concentration of H2 gas around the sensor, which has been used traditionally for comparing sensitivities of plasmonic hydrogen sensors.8,10,14 In this paper, the maximum value of the plasmon resonance wavelength shift (Δλ) of ∼80 nm was obtained for a change of the atomic ratio ‘x’ (in PdHx) from x = 0 to x = 0.65 (x = 0.65 corresponds to a concentration of 4 vol% H2 gas). The values of Δλ (for change of x from 0 to 0.65) reported in this paper are higher than those reported thus far for plasmonic hydrogen sensors and illustrate that the plasmonic sensors being proposed by us are highly sensitive.8,10,14–16 The narrow groove plasmonic nanogratings being proposed by us allow normally incident light (or light at angled incidence) to be coupled directly into plasmonic waveguide modes. Therefore, there is no need for employing bulky prism coupling mechanisms to couple light into surface plasmon polaritons (such as those used in Kretschmann or Otto configurations). Moreover, the stringent requirements for coupling of the light into surface plasmon polaritons in the Kretschmann or Otto configurations are relaxed as both normally incident light and light incidence at an angle to the normal (for a large range of angles) can couple to surface plasmon modes in the narrow groove nano-gratings. Hence, the hydrogen sensors based palladium coated narrow-groove plasmonic nanogratings are expected to be highly sensitive and robust.
Methods
Fig. 1(a) shows the schematic of the nanoplasmonic hydrogen sensors being proposed in this paper, with a thin layer of palladium (Pd) coated on narrow-groove Au nanogratings (with the gap or groove size lying between 2 nm and 20 nm). The thin Pd layer adsorbs and desorbs gas upon exposure to hydrogen, and undergoes phase change to palladium hydride (PdHx), where x is the atomic ratio (H/Pd) in PdHx and depends on the concentration of the hydrogen gas. Consequently, its optical properties like the dielectric permittivity also change upon phase change to PdHx. It has to be noted that normally or angularly incident light couples directly to multiple plasmonic waveguide modes inside the plasmonic nanograting structure. As can be seen from Fig. 1, light can be directly coupled to plasmonic waveguide modes inside the narrow grooves, thereby enhancing the electric field intensity inside the grooves. These waveguide-modes are highly localized inside the gaps between the walls of the plasmonic nanogratings. Hence, one can observe a significant shift in the reflection spectra and an increase in the differential reflectance spectra, when the Pd thin film layer undergoes a phase change to form a PdHx layer.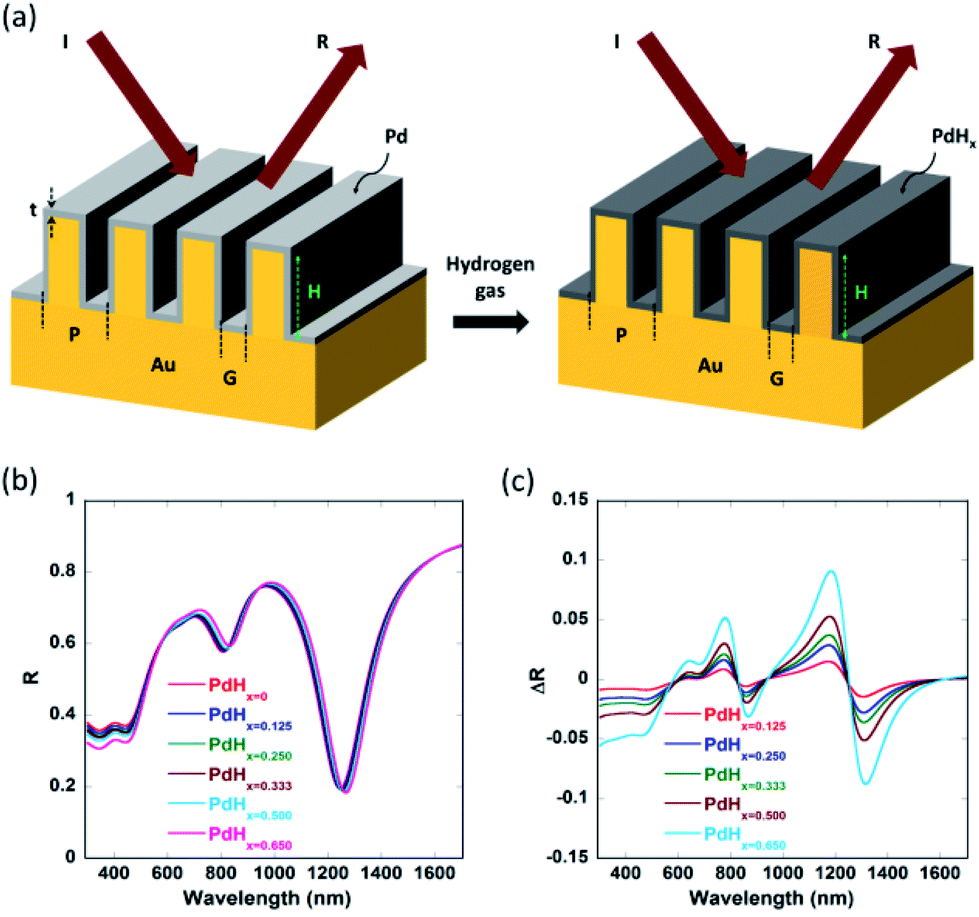 | ||
| Fig. 1 (a) Schematic of a palladium (Pd) coated narrow groove gold nanogratings employed for hydrogen sensing. The schematic illustrates the important structural parameters of these nanogratings. ‘P’, ‘H’ and ‘t’ indicate the nanograting periodicity, the nanograting height, and the thickness of the Pd layer, respectively, while ‘G’ indicates the gap between the nanogratings. The incident and reflected radiations are indicated by symbols ‘I’ and ‘R’, respectively. When Pd is exposed to varying concentrations of hydrogen gas, it undergoes phase transition to palladium hydride (PdHx), such that there are different atomic ratios ‘x’ (H/Pd) of hydrogen present in PdHx depending on the concentration of the hydrogen gas. (b) Reflectance (R) spectra from the nanogratings calculated before any hydrogen exposure (i.e. for PdHx=0) and after exposure to varying concentrations of hydrogen, i.e. for different atomic ratios ‘x’ in PdHx (x varying from 0.125 to 0.65). (c) Differential reflectance (ΔR) spectra from the nanogratings for different atomic ratios ‘x’ present in PdHx (x varying from 0.125 to 0.65). In (b) and (c), periodicity, P = 100 nm, groove height, H = 250 nm, groove gap G = 5 nm, and thickness, t = 4 nm were taken. | ||
1-D rigorous coupled wave analysis (RCWA), a semi-classical numerical modelling approach, was employed for modelling of the narrow-groove plasmonic nanogratings being proposed in this paper. In our simulations, TM polarized light (for different wavelengths of interest) was incident normally on the top surface of the narrow groove nanogratings. Simulations using RCWA were performed to obtain the reflectance spectral response of the nanostructures in both the absence and presence of hydrogen, for various atomic ratios ‘x’ (x ∼ 0.125 to 0.65). The total reflected power—reflectance (diffraction efficiency)—of pure palladium exposed to varying concentrations of hydrogen were computed for the narrow-groove nanogratings. Hydrogen detection in the nanograting is primarily based on the measure of changes in reflectance signal in the presence and absence of hydrogen. In this work the different dimensions of the nanogratings—such as gap, height, thickness and periodicity—were varied, to study the effect of these parameters on the coupling of the incident light into plasmonic waveguide modes.
The narrow-groove plasmonic nanogratings being proposed in this paper consist of groove gaps ‘G’ lying between 3 nm and 10 nm. The thicknesses of thin palladium layers were taken to be ‘t’ = 2 nm, 3 nm, 4 nm, and 6 nm. Similarly, the groove height ‘H’ was taken to be 25 nm, 50 nm, 100 nm, and 250 nm. The number of harmonics in the simulations was taken to be 5. Moreover, we accounted for the material dispersion for the metallic materials (gold and palladium) employed in our nanogratings. In our simulations, a broad band polychromatic light source (λ = 380 nm to 1699 nm, with a resolution of 0.1 nm) was incident normally on the nanogratings and the intensity spectrum of the reflected light is investigated in the presence and absence of hydrogen on palladium. The tunability of the nanogratings allows the usage of different light sources such as light emitting diodes (LEDs) and lasers. Through the output of the simulations (i.e. through reflectance spectra), certain parameters such as plasmon resonance wavelength shift (Δλ) and differential reflectance (ΔR) as a function of the wavelength were computed for varying concentrations of hydrogen as these parameters provide a measure of sensitivity of the plasmonic hydrogen sensors.
Results and discussion
It can be observed from Fig. 2(a) that the real part of the refractive index (n) of palladium hydride is larger than that of palladium for short wavelengths (in the range from 400 nm to 650 nm) and smaller for long wavelengths (650 nm to 1600 nm). Moreover, it can be observed from Fig. 2(b) that the imaginary part of the refractive index (k) of palladium decreases upon hydrogenation. Therefore, palladium hydride has a higher real part of the permittivity (ε1 = n2 − k2) as compared to palladium and a lower imaginary part of the permittivity (ε2 = 2nk). This can be explained on the basis of the fact that the adsorption of hydrogen in palladium, resulting in the formation of palladium hydride, leads to an increase in its volume and an ensuing decrease in the free electron density.27 The formation of palladium hydride also leads to a decrease in the plasma frequency and an increase in the Fermi energy.28 The free electron density decreases as the concentration of hydrogen in palladium hydride increases. Hence, the formation of palladium hydride leads to an increase in the real part and a decrease in the imaginary part of the permittivity.18 We can observe from Fig. 3 that the plasmon resonance related dips in the reflectance spectra shift to longer wavelengths upon hydrogenation of palladium. It can be seen that the dips in the reflectance spectra red-shift as the atomic ratio of hydrogen to palladium (x) in palladium hydride (PdHx) increases from x = 0 to x = 0.65. The red-shift in position of the plasmon resonance related dips in the reflection spectra can be attributed to a change in the dielectric permittivity of the palladium layer upon adsorption of hydrogen.14,18 Moreover, we can observe from Fig. 3 that the plasmon resonance related dips in the reflectance spectra red-shift as the gaps between the adjacent walls of the narrow groove nanogratings decrease.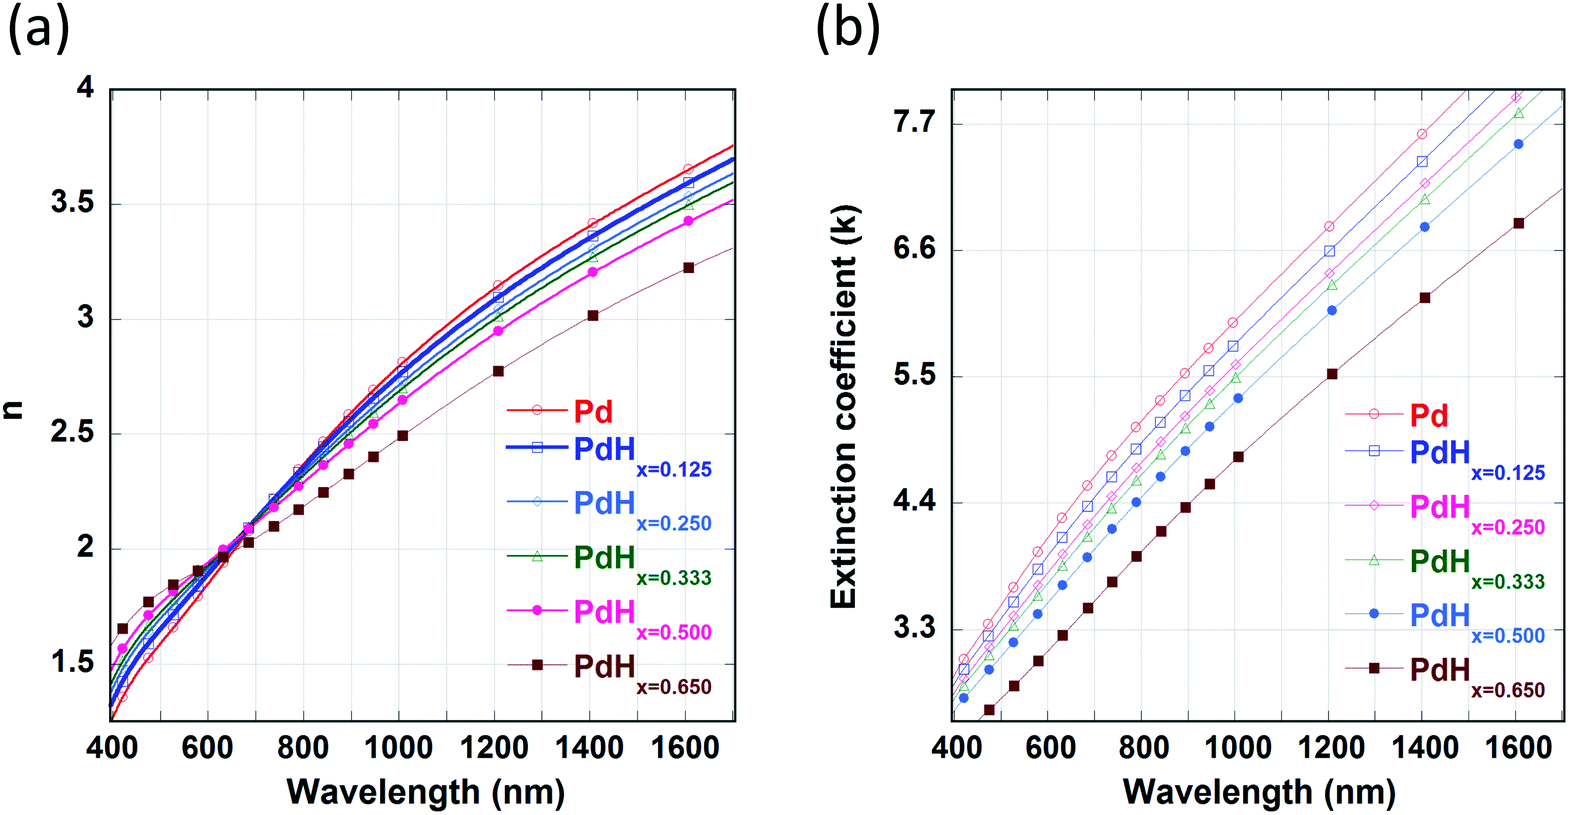 | ||
| Fig. 2 Optical constants of Pd in the unhydrided and hydrided states. Spectral dependence of: (a) the refractive index (n) and (b) the extinction coefficient (k) of the unhydrided state of Pd (PdHx=0) and hydrided states of Pd (x varying from 0.125 to 0.65). The values of n and k of pure Pd (α phase) and PdHx=0.65 (β phase) are taken from ref. 29. The values of n and k for other concentrations of palladium hydride (PdHx) are calculated from Bruggeman's effective medium approximation. | ||
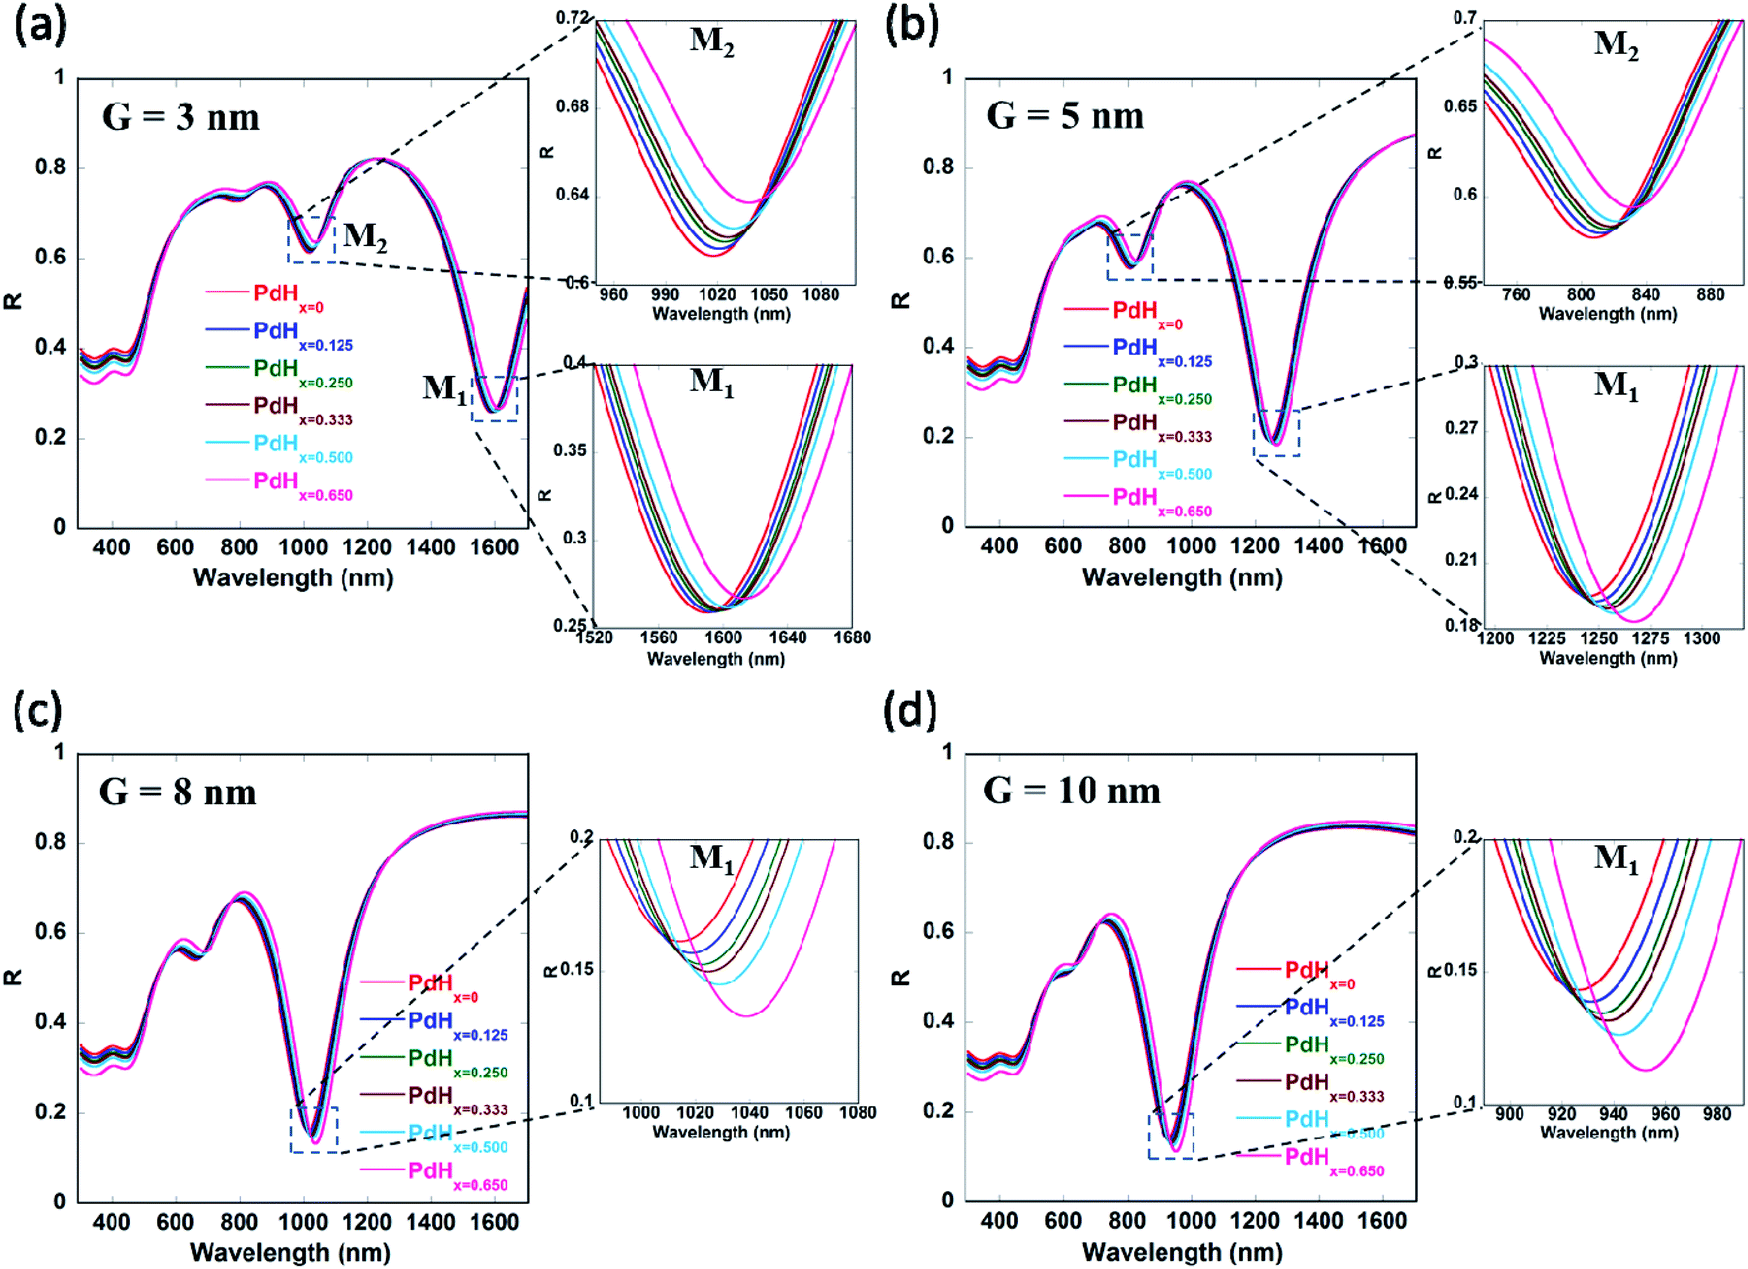 | ||
| Fig. 3 Effect of groove gap ‘G’ on the plasmon resonance dips in the reflectance spectra for narrow groove nanogratings before and after exposure to varying concentrations of hydrogen. These reflectance spectra show different plasmon waveguide modes (M1 and M2) that are coupled into the nanogratings. Effect of nanograting groove gap on the reflectance spectra is shown for the following values of ‘G’: (a) 3 nm, (b) 5 nm, (c) 8 nm, (d) 10 nm. In all the cases above periodicity, P = 100 nm, groove height, H = 250 nm and thickness, t = 4 nm were taken. | ||
As the gap between the nanogratings is decreased, the distance between the adjacent plasmonic nanograting walls also decreases, thereby leading to a decrease in the restoring force acting on the conduction band electrons of the plasmonic materials. This result in a decrease in plasma frequency, which in turn leads to an increase in the plasmon resonance wavelength associated with the nanogratings. We also observe from Fig. 3(a)–(d) that the number of plasmon resonance related dips in the reflectance spectra increase as the gaps between the adjacent walls of the narrow groove nanograting are decreased. As the gaps between the plasmonic nanogratings is decreased, the incident light can effectively get coupled into a greater number of plasmonic waveguide (MIM) modes in the plasmonic waveguides formed by palladium-coated gold nanogratings. Hence, hydrogen sensing using the narrow-groove plasmonic nanogratings can be carried out in the near-infrared and visible wavelengths. Moreover, hydrogen sensing can be carried out at multiple wavelengths, which allows the use of multiple lasers (or LEDs) and photodetectors to be employed for carrying out sensing without the use of spectrometer.
It can be seen from Fig. 4 and Table 1 (see Appendix A) that the red-shifts (Δλ) in the plasmon resonance related dips as well as the differential reflectance (ΔR)—for the different plasmonic modes as the ratio of hydrogen to palladium (x) in palladium hydride (PdHx) increases from x = 0 to x = 0.65—increase with an increase in the gap between the nanogratings, ‘G’ up to a certain value of G = 10 nm and decrease after that. It has to be noted that the differential reflectance (ΔR) can be calculated by taking a difference of the reflectance spectra of Pd-coated gold nanogratings from that of PdHx-coated gold nanogratings. As the gap increases above 10 nm, incident light does not couple well into the plasmonic waveguide (MIM) modes, which leads to less enhancement of the EM fields in between the walls of the plasmonic nanogratings. This explains the decrease in the values of both the Δλ and the differential reflectance (ΔR). On the other hand, there is an optimal value of gap ‘G’ (10 nm) below which the coupling of the incident light to the plasmonic waveguide modes is not effective, thereby leading to a lower value of Δλ and ΔR.
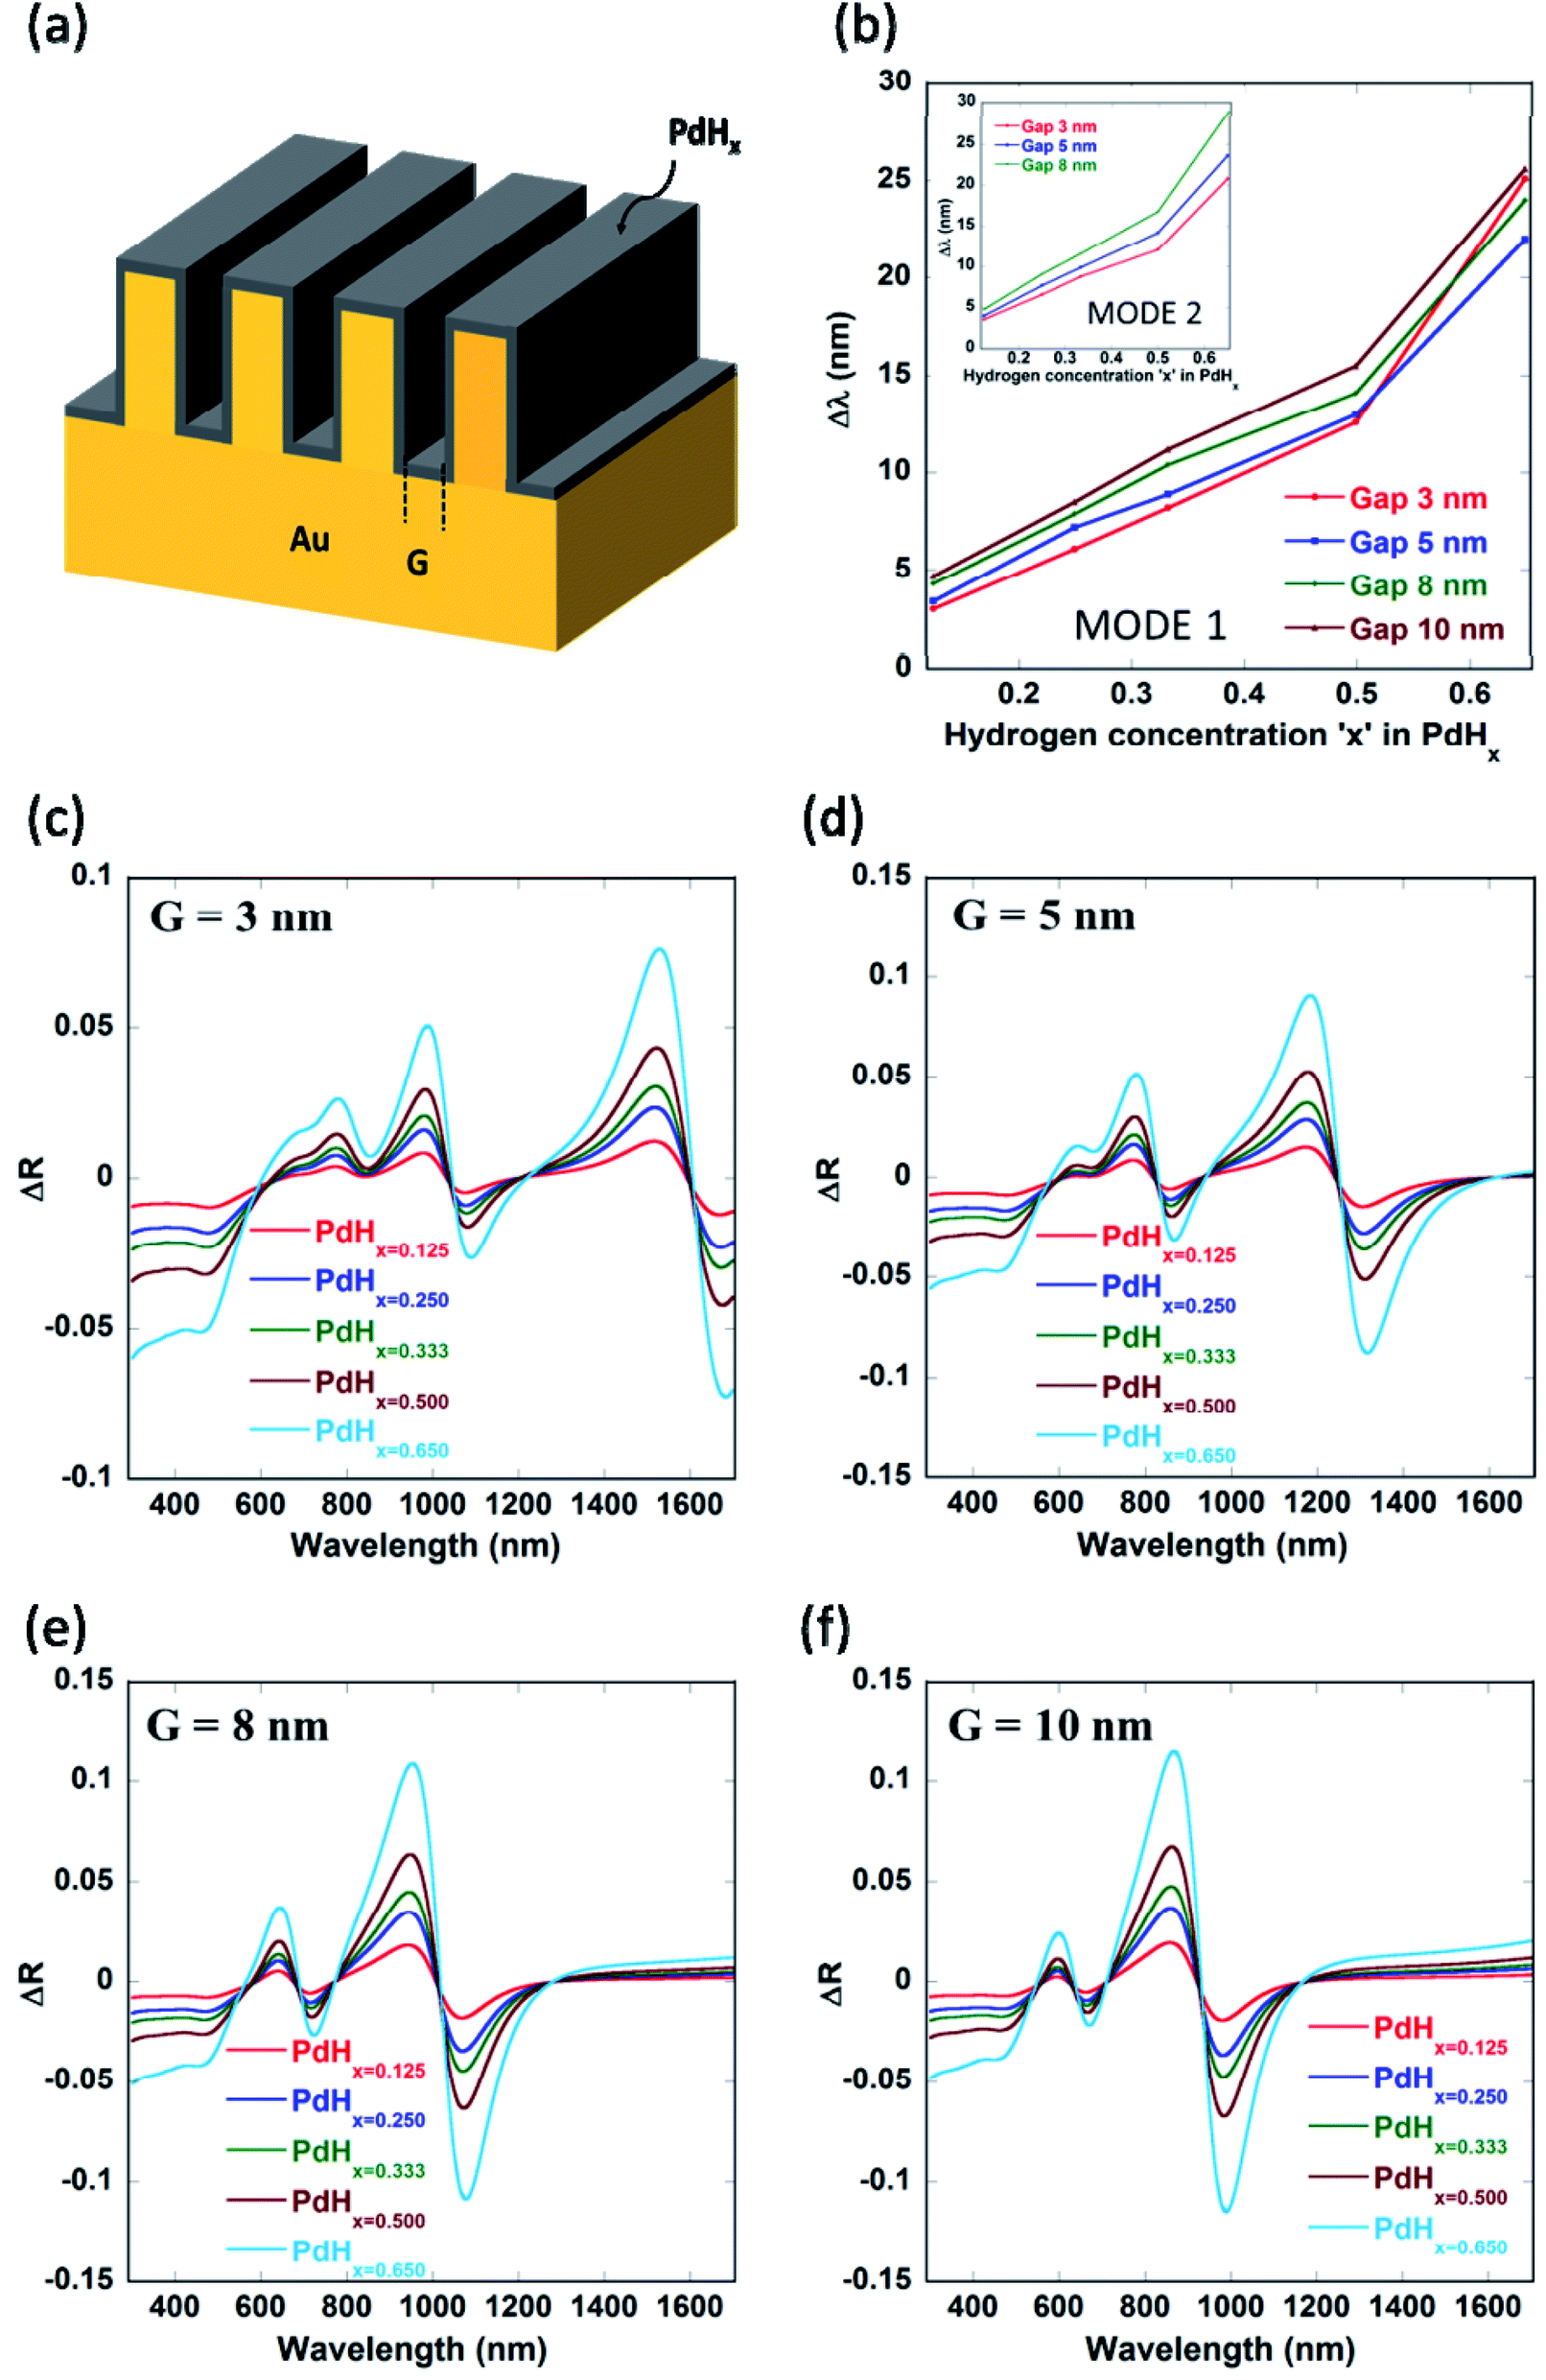 | ||
| Fig. 4 (a) Schematic illustrating the Pd–Au nanogratings for the effect of changing groove gap ‘G’ of the nanogratings (b) hydrogen-induced shift in resonance wavelength (Δλ) versus hydrogen concentration ‘x’ for plasmon modes (M1 and M2) for the effect of varying gap of the nanogratings. Differential reflectance versus wavelength curves for Pd coated nanogratings – with 100 nm periodicity, 250 nm groove height and 4 nm thickness – exposed to varying concentrations of hydrogen. Effect of nanograting groove gap on the amplitudes of differential reflectance spectra is shown for the following values of ‘G’: (c) 3 nm, (d) 5 nm, (e) 8 nm, (f) 10 nm. | ||
In the paper, we are also employing differential reflectance (ΔR) to quantify the changes in spectra after the adsorption of hydrogen in the palladium layer (resulting in the formation of palladium hydride, PdHx) on the plasmonic nanogratings as compared to calculating the shifts in the plasmon resonance wavelengths. This is because, in some practical scenarios, measurements of shifts in the plasmon resonance wavelength are difficult as one needs to first accurately determine the position of the plasmon resonance dips. The measurements of shifts in the plasmon resonance wavelengths become very difficult when very small shifts in the plasmon resonance wavelength occur. On the other hand, calculation of the difference between the spectra for the cases after and before the adsorption of hydrogen in palladium is easy and the quantification of the differential reflectance can be carried out either by calculating the peak differential reflectance or by determining the differential reflectance amplitude. Moreover, calculation of differential reflectance is better for surface plasmon resonance imaging as the differential of the images can be taken for the cases after and before the adsorption of hydrogen in the palladium layer over-coating the narrow groove plasmonic nanogratings.
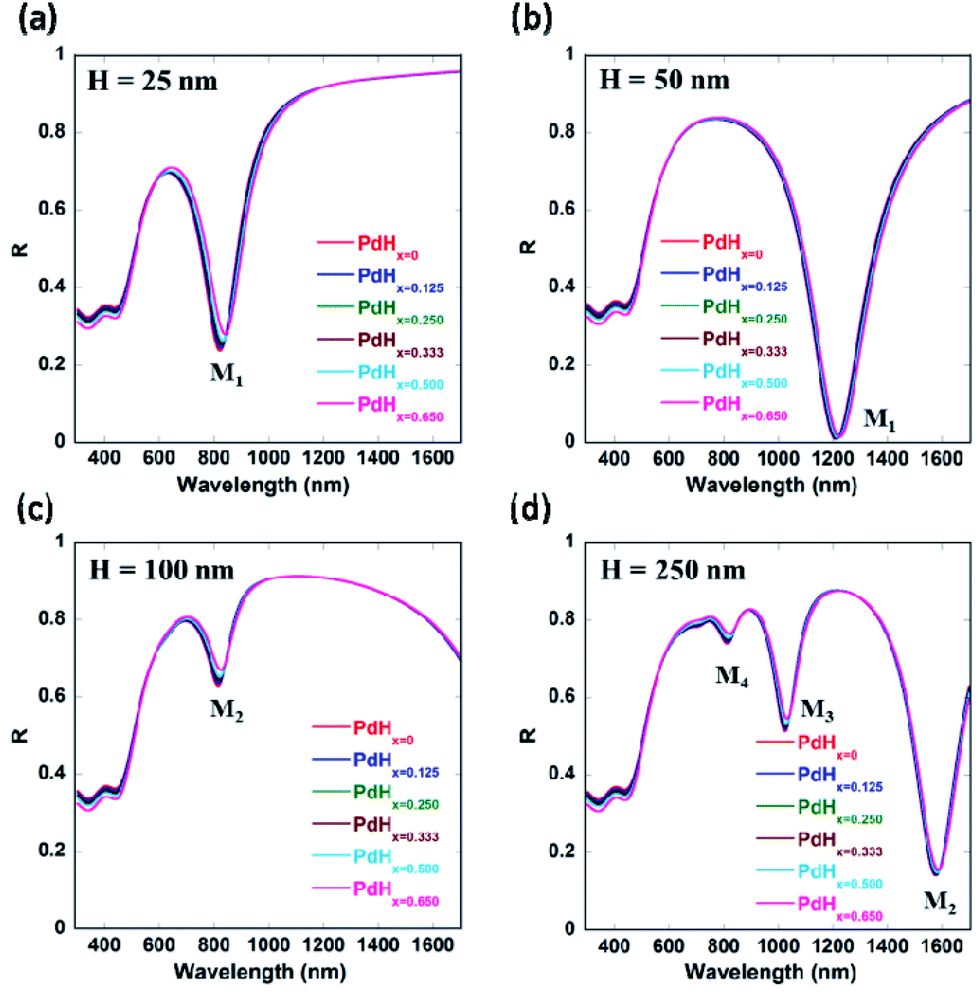
We also varied the height of the nanogratings and observed that as the height of the nanogratings is increased, more number of plasmon modes starts appearing (as shown by Fig. 5(f) and 9(d) in Appendix B). As the height of the plasmonic nanogratings is increased, the incident light can effectively get coupled into a greater number of plasmonic waveguide (MIM) modes formed by the palladium-coated gold nanogratings. Hence, hydrogen sensing using these plasmonic nanogratings can be carried out at multiple wavelengths. We also optimized the height ‘H’ of the plasmonic nanogratings and found that the highest shift in the plasmon resonance wavelength as well as the highest differential reflectance occurs in the case of the nanogratings with a height of 25 nm.
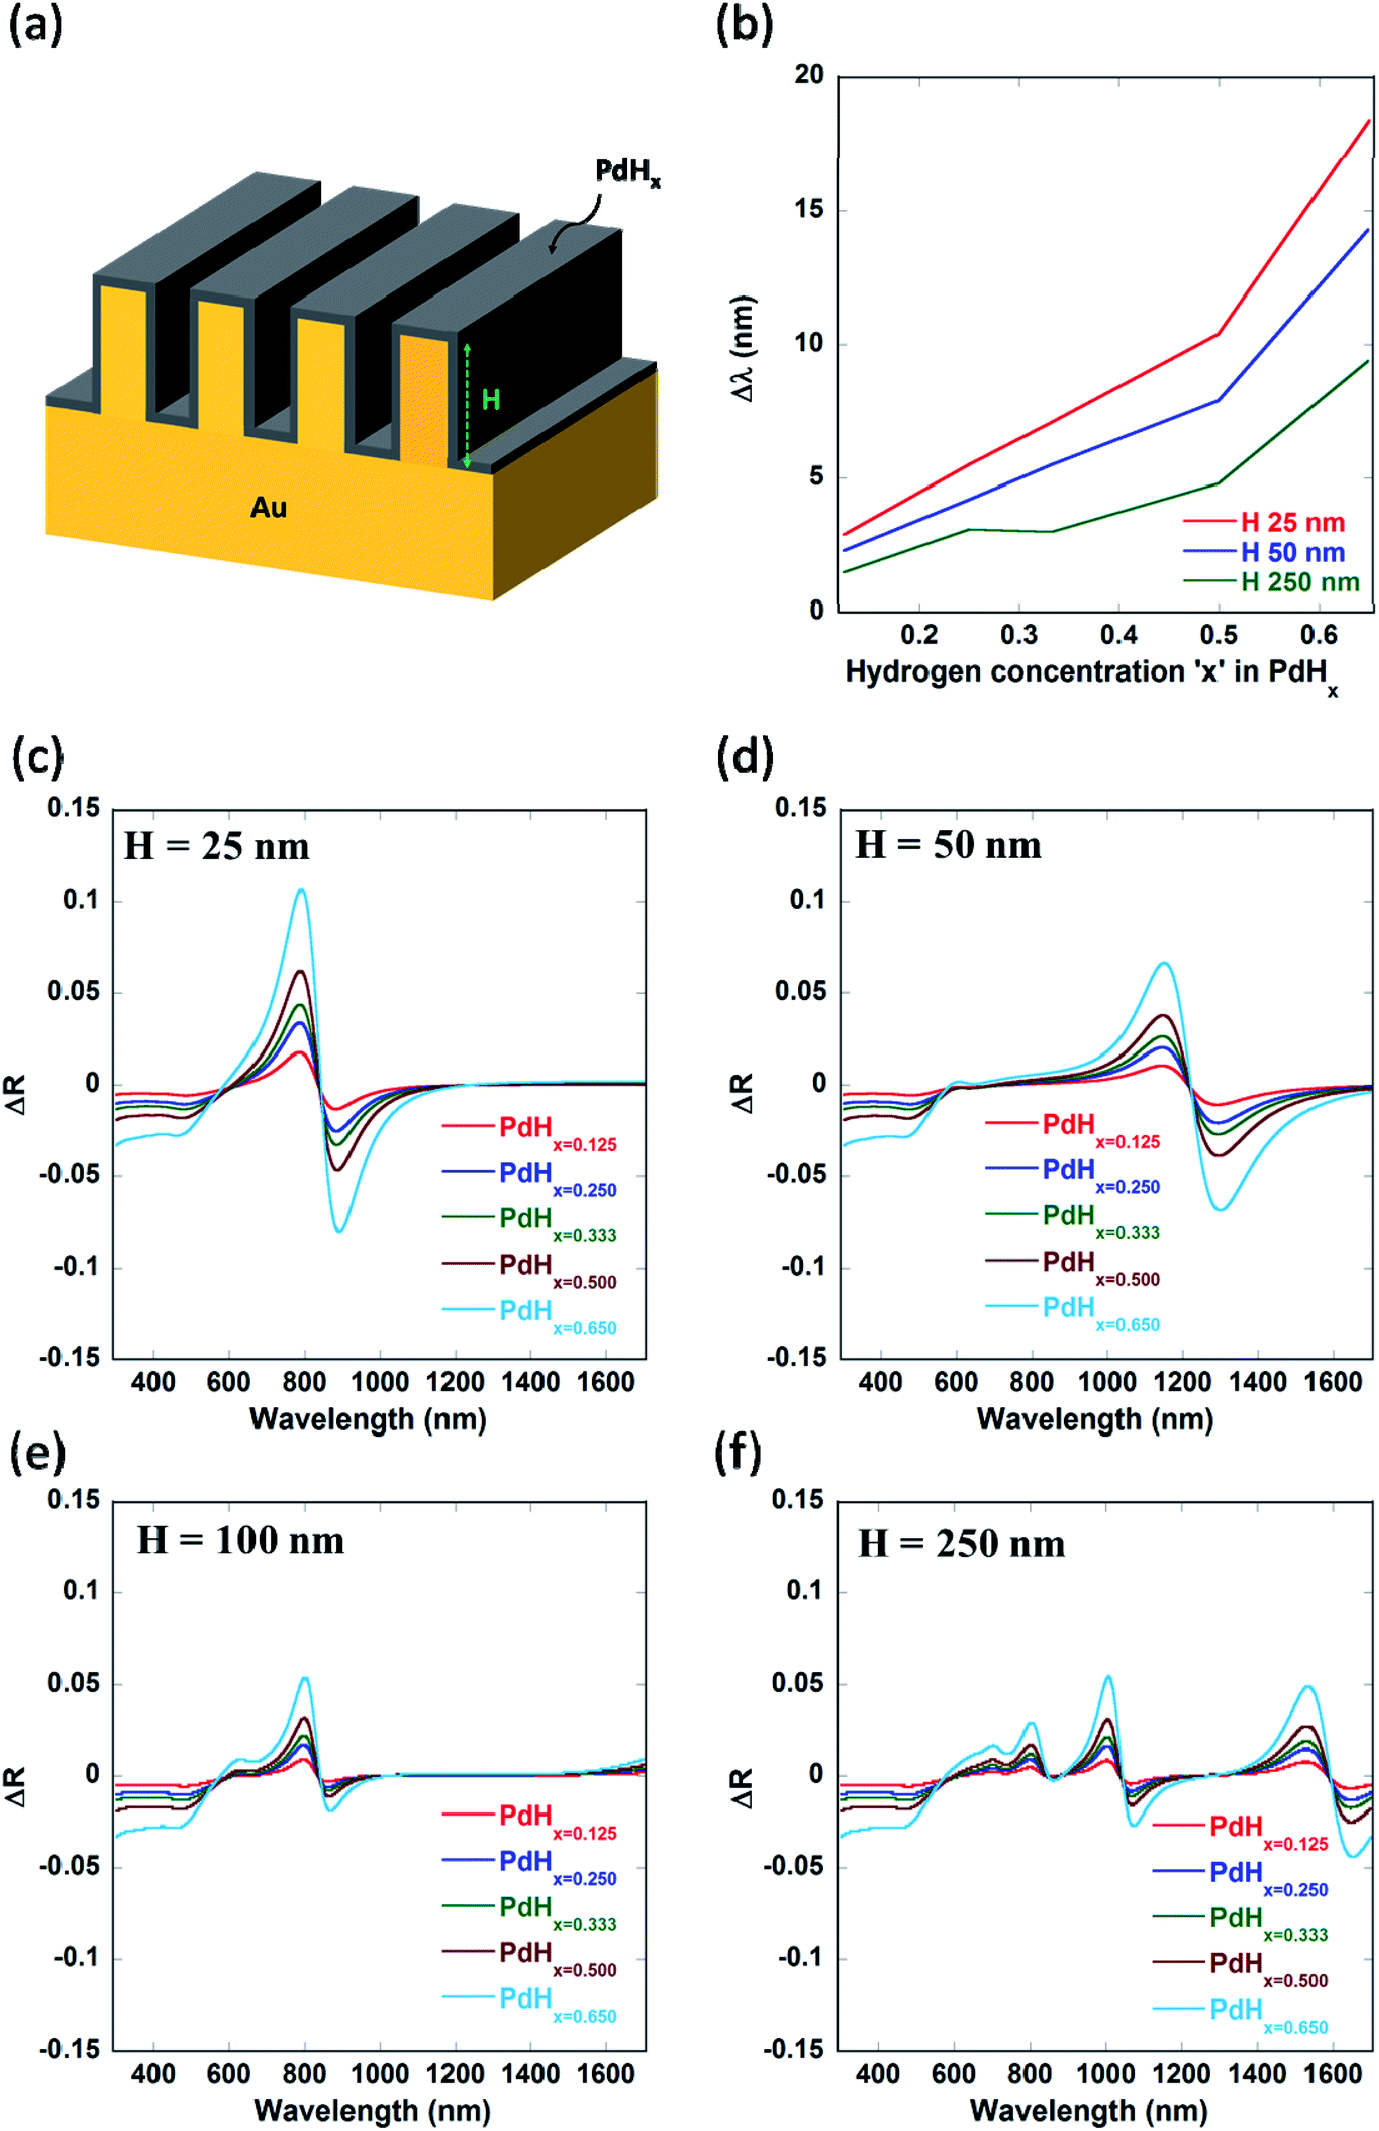 | ||
| Fig. 5 (a) Schematic of nanoplasmonic sensing of H2 for the effect of changing height ‘H’ of the nanogratings, (b) plasmon resonance wavelength shift upon hydrogen uptake of the nanograting for the effect of varying height of the nanogratings. Differential reflectivity signal consisting of positive and negative component (peak) against wavelength for nanogratings having the following values of groove height ‘H’: (c) 25 nm, (d) 50 nm, (e) 100 nm, (f) 250 nm – with 100 nm periodicity, 3 nm groove gap and 2 nm thickness. | ||
We observe from Fig. 6 and 7 that the shift in the plasmon resonance wavelength and the differential reflectance amplitude (peak maxima) increase with an increase in the thickness ‘t’ of the Pd layer surrounding the plasmonic nanogratings. This can be explained on the basis that the dielectric permittivity changes in a greater proportion of the region between the gold nanogratings when the thickness of the palladium layer is increased while keeping the gap ‘G’ between the adjacent palladium sidewalls to be constant at 10 nm. We can also observe from Fig. 6 that the differential reflectance shifts towards longer wavelengths when the thickness ‘t’ of the palladium layer is decreased. As the thickness of the palladium layer is decreased, the effective gap between the adjacent sidewalls of the gold nanogratings decreases, thereby leading to a decrease in the restoring force acting on the conduction band electrons of the plasmonic materials. This results in a decrease in plasma frequency, which in turn leads to an increase in the plasmon resonance wavelength associated with the nanogratings.
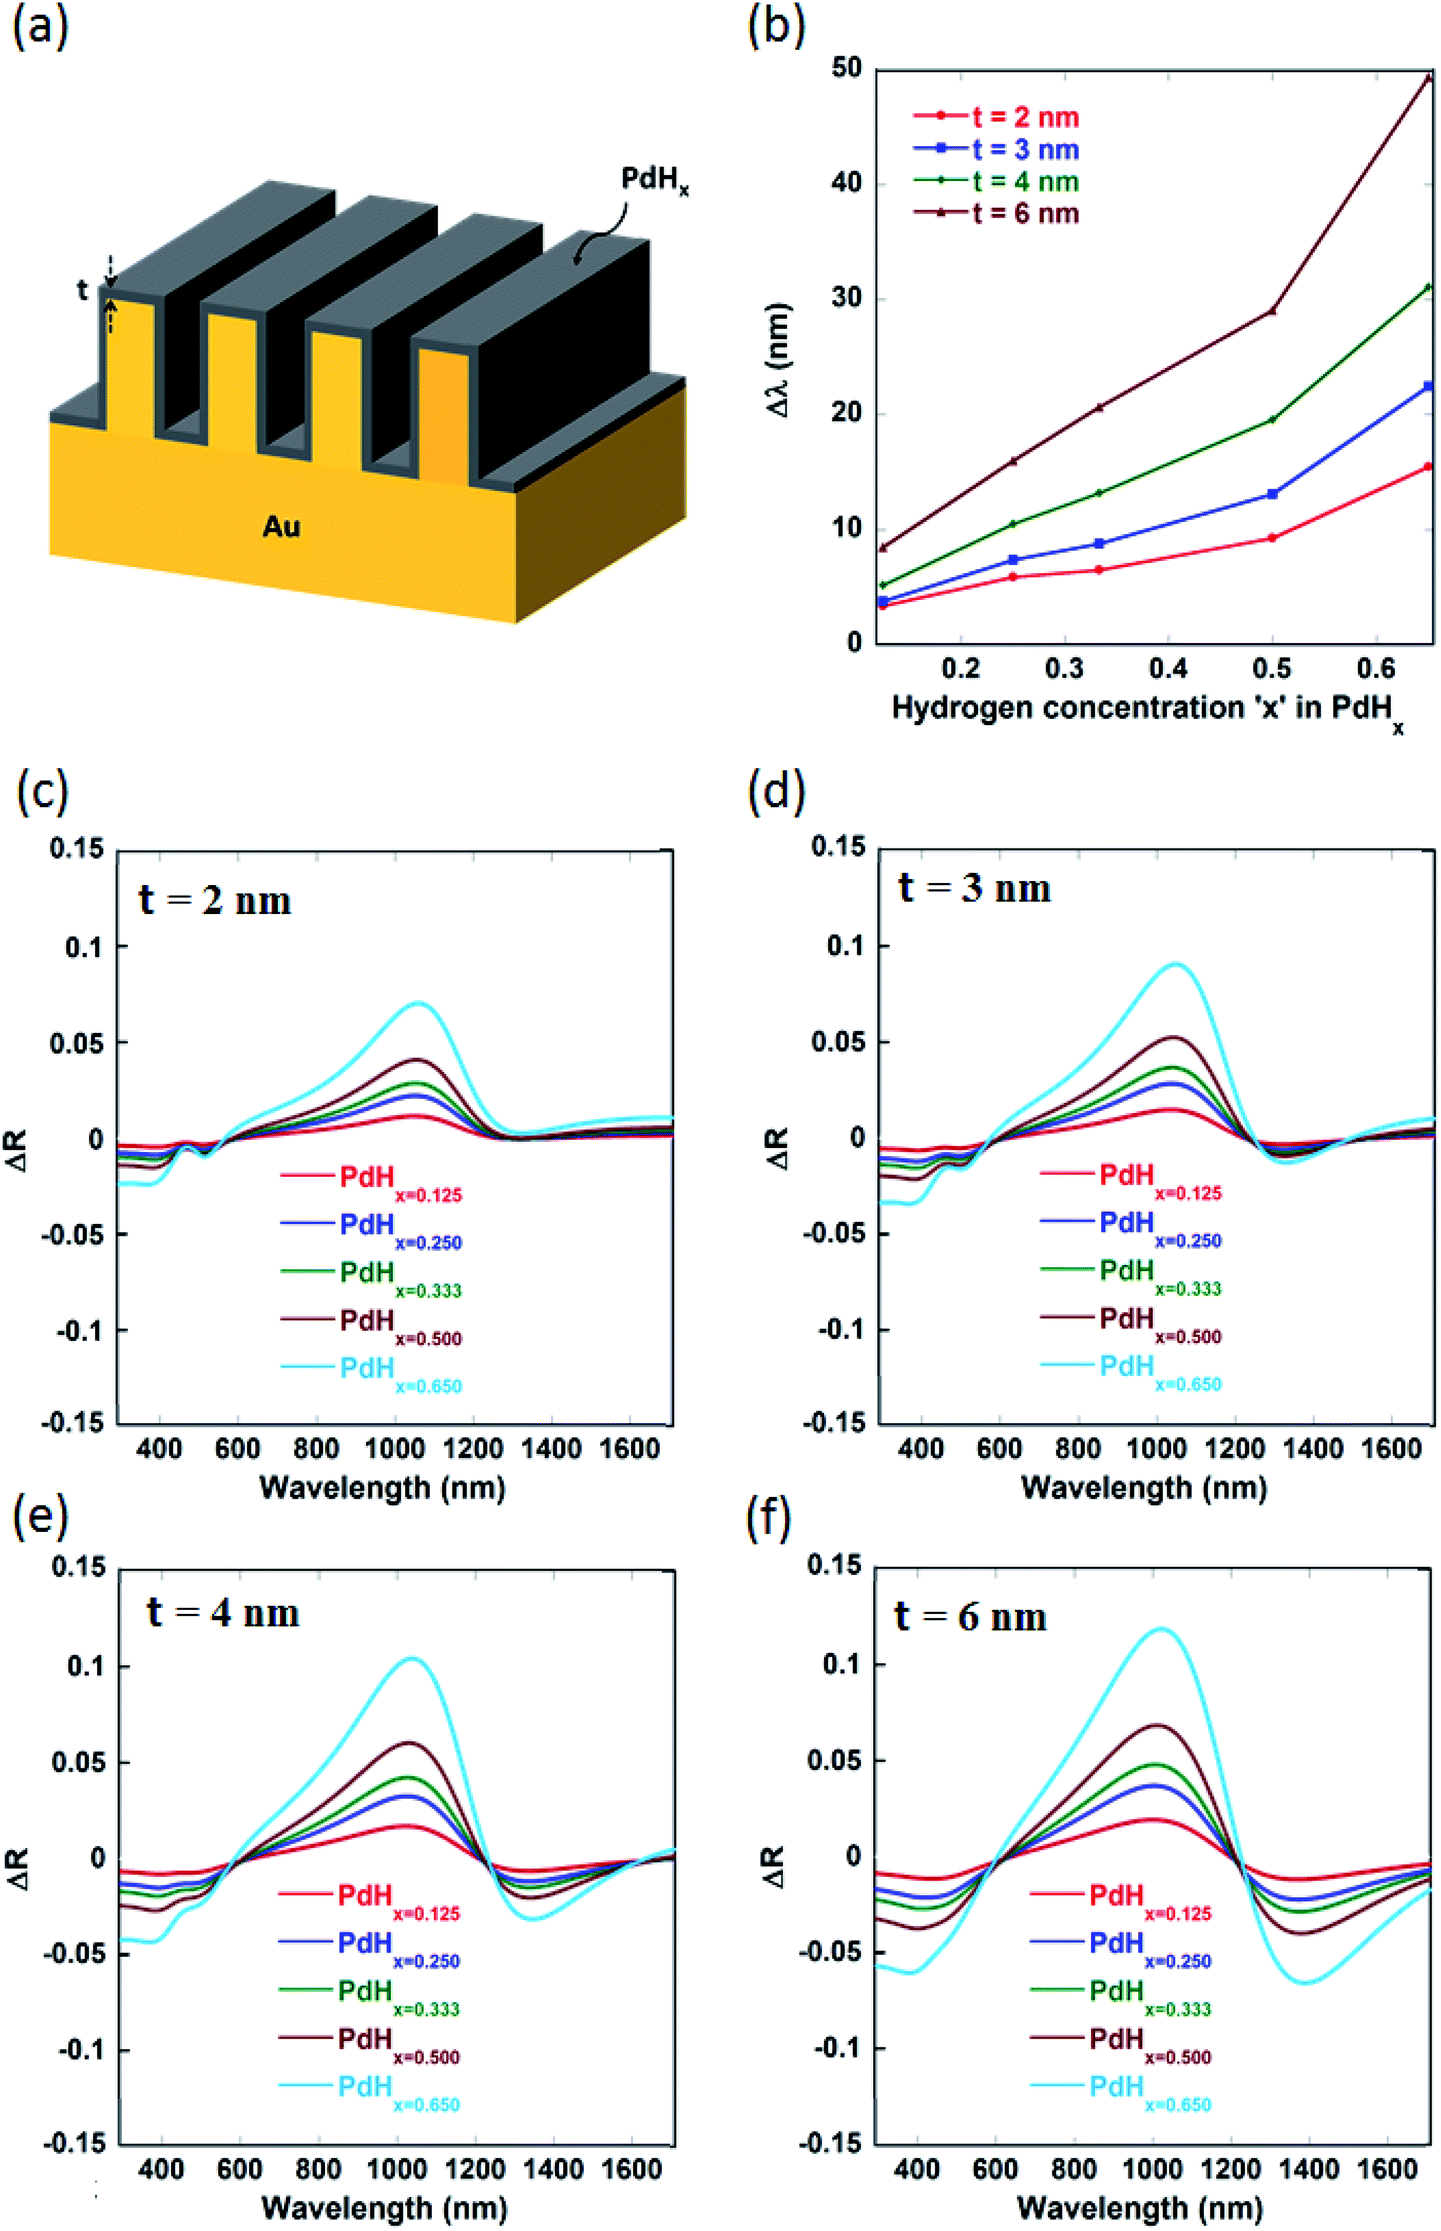 | ||
| Fig. 6 (a) Schematic of nanoplasmonic sensing of H2 for the effect of changing thickness ‘t’ of the palladium layer of the nanogratings (b) plasmon resonance wavelength shift upon hydrogen uptake of the nanogratings for different values of thickness, ‘t’. Differential reflectivity signal consisting of positive and negative component (peak) against wavelength for nanogratings having the following values of thickness ‘t’: (c) 2 nm, (d) 3 nm, (e) 4 nm, (f) 6 nm – with 100 nm periodicity, 10 nm groove gap and 100 nm height of the nanogratings. | ||
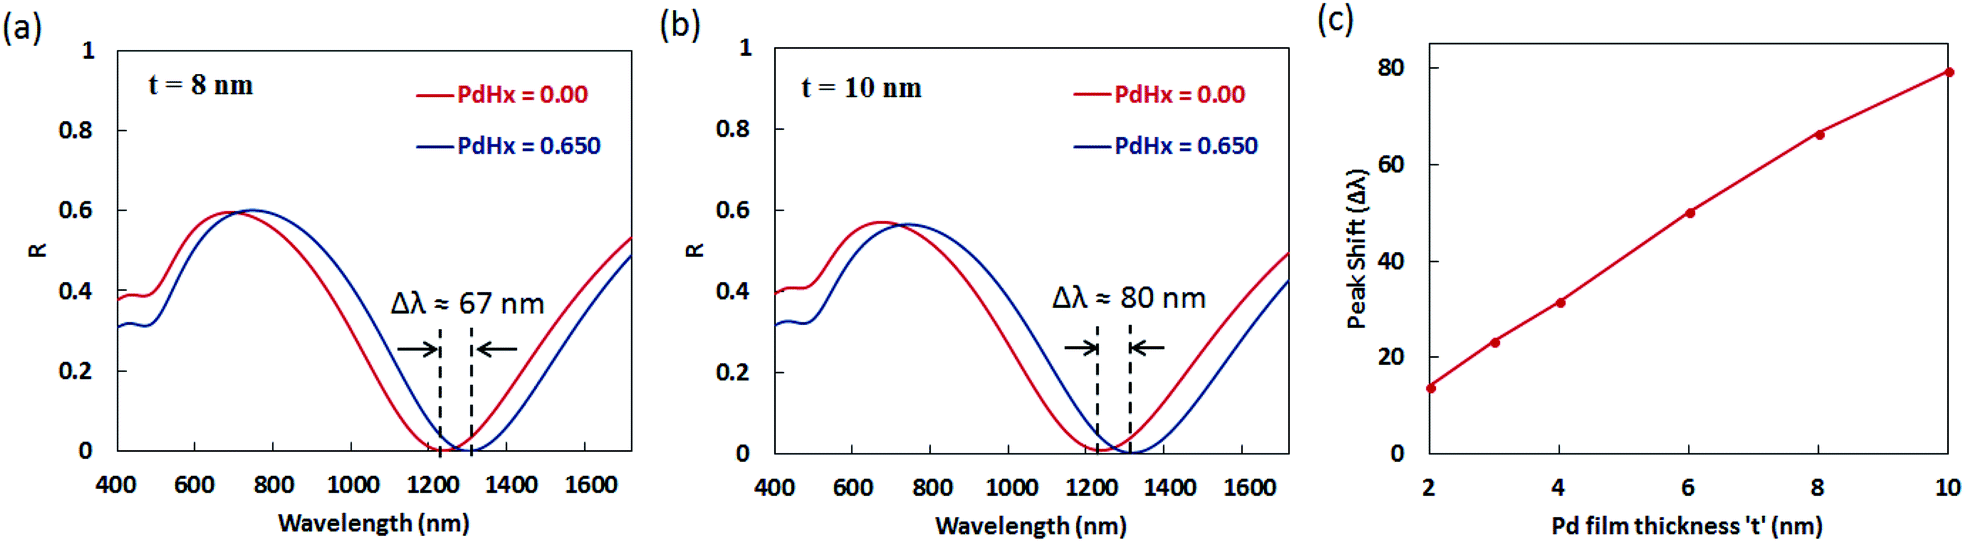 | ||
| Fig. 7 The shift (Δλ) in plasmon resonance dips in the reflectance spectra for narrow groove nanogratings before and after exposure to varying concentrations of hydrogen, when the value of the thickness ‘t’ of the palladium layer over-coating the nanogratings is: (a) 8 nm and (b) 10 nm. In these cases, the following parameters of the narrow groove nanogratings were taken: periodicity, P = 100 nm, the groove height, H = 100 nm, and the nanograting groove gap, G = 10 nm. (c) The effect of changing the thickness ‘t’ of the palladium layer on the shift (Δλ) in plasmon resonance wavelength. | ||
The values of sensitivity of the sensors being described in this paper—in terms of plasmon resonance wavelength (Δλ) for a 4 vol% increase in the concentration of H2 gas around the sensor, i.e. for a change of the atomic ratio ‘x’ (in PdHx) from x = 0 to x = 0.65—are higher than those reported thus far for plasmonic hydrogen sensors. It can be seen from Fig. 7 that the maximum value of the plasmon resonance wavelength shift (Δλ) of ∼80 nm can be obtained for the optimized geometry of the narrow groove plasmonic nanogratings. Moreover, the maximum value of differential reflectance (ΔR) of ∼0.12 was obtained for a change of the atomic ratio ‘x’ (in PdHx) from x = 0 to x = 0.65.
We can observe from Fig. 8 that not only normally incident light (θ = 0°) couples into the plasmonic waveguide modes, but also light incident at different non-zero angles. This can enable easier characterization of these palladium-coated plasmonic nanogratings. Another parameter which could be employed to fine-tune the shift in the plasmon resonance wavelength is the periodicity ‘P’ of the plasmonic nanogratings (as shown in Appendix C, Fig. 10). The gold nanogratings described in our work can be fabricated either using nanoimprint lithography,30,31 deep UV lithography, or electron beam lithography. The thin palladium layer can be deposited over the gold nanostructures in a conformal manner using atomic layer deposition.32
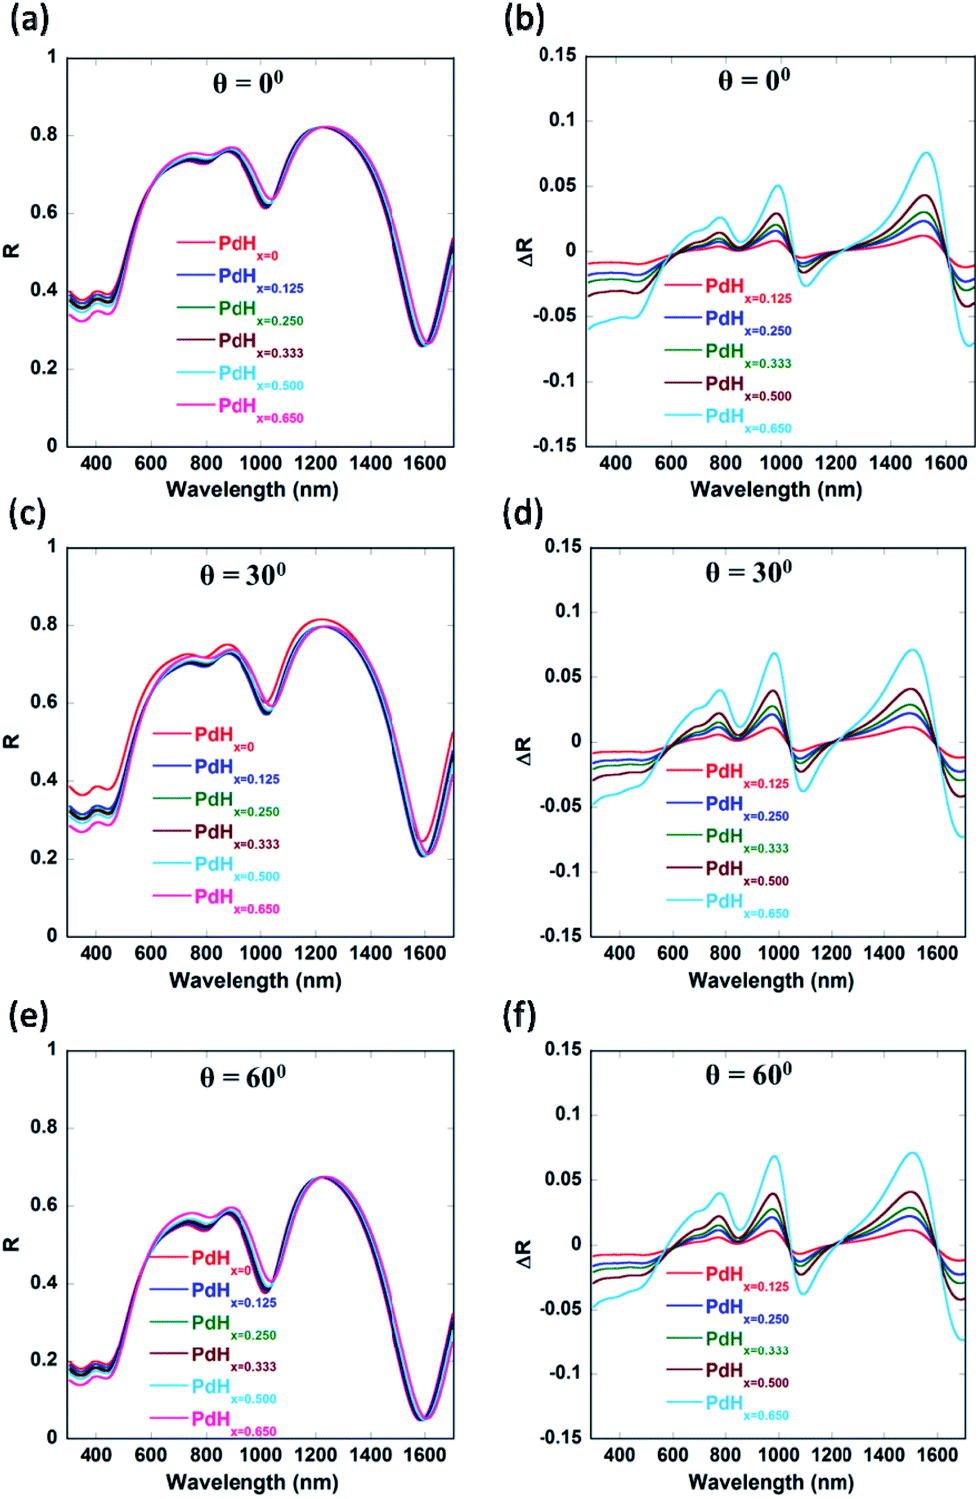 | ||
| Fig. 8 Reflectance (R) and differential reflectance (ΔR) plots are provided for spectral interrogation for varying angles of incidence on the narrow groove nanogratings. R and ΔR calculations are carried out for the following values of angles of incidence ‘θ’ (a and b) 0°, (c and d) 30°, (e and f) 60°. For all the above cases groove gap, G = 3 nm, height, H = 250 nm, periodicity, P = 100 nm and thickness, t = 4 nm were taken. | ||
Conclusions
We have proposed plasmonic sensors based on palladium coated narrow-groove plasmonic nanogratings for sensing of hydrogen gas at visible and near-infrared wavelengths. The results of the RCWA simulations showed that as the dielectric permittivity of the palladium thin film layers in between the plasmonic nanogratings is varied upon exposure to hydrogen gas, significant changes in the plasmon resonance wavelength as well as in the differential reflection spectra are observed. When palladium is exposed to varying concentrations of hydrogen gas, palladium undergoes phase transition to palladium hydride (PdHx), such that there are different atomic ratios ‘x’ (H/Pd) of hydrogen present in the palladium hydride (PdHx) depending on the concentration of the hydrogen gas. RCWA simulations were performed to obtain the reflectance spectral response of the Pd coated nanogratings in both the absence and presence of hydrogen, for various atomic ratios ‘x’ (x ∼ 0.125 to 0.65) in palladium hydride (PdHx). The structural parameters of these Pd coated narrow groove nanogratings—such as the nanograting height, gap between the nanograting walls, thickness of the palladium layer, periodicity of the nanogratings—were varied to maximize the shift in the plasmon resonance wavelength as well as the differential reflectance when these nanostructures are exposed to different concentrations of hydrogen (i.e. for different atomic ratios ‘x’ in PdHx). The maximum values of the plasmon resonance wavelength shift (Δλ) and differential reflectance (ΔR) of ∼80 nm and 0.12, respectively, were obtained for a change of the atomic ratio ‘x’ (in PdHx) from x = 0 to x = 0.65. The values of Δλ (for change of x from 0 to 0.65) reported in this paper are higher than those reported thus far for plasmonic hydrogen sensors and illustrate the high sensitivity of these plasmonic sensors.It was also observed that the plasmon resonance related dips in the reflectance spectra red-shift as the gaps between the adjacent walls of the narrow groove nanogratings decrease. Moreover, we observe that the number of plasmon resonance related dips in the reflectance spectra increase as the gaps between the adjacent walls of the narrow groove nanograting are decreased. Moreover, as the height of the plasmonic nanogratings is increased, the incident light can effectively get coupled into a greater number of plasmonic waveguide (MIM) modes formed by the palladium-coated gold nanogratings, leading to multiple plasmon resonance related dips in the reflection spectra. This allows these plasmonic sensors to be employed for hydrogen detection at multiple spectral regions (visible and infrared). We also observed that not only normally incident light couples into the plasmonic waveguide modes, but also light incident at different non-zero angles which can enable easier characterization of these palladium-coated plasmonic nanogratings.
Appendix A
| Atomic ratio ‘x’ in PdHx | G = 3 nm | G = 5 nm | G = 8 nm | G = 10 nm | G = 15 nm | G = 20 nm | G = 25 nm |
|---|---|---|---|---|---|---|---|
| x = 0.125 | Δλ = 3 nm | Δλ = 3.4 nm | Δλ = 4.3 nm | Δλ = 4.7 nm | Δλ = 4.4 nm | Δλ = 3.7 nm | Δλ = 3.8 nm |
| x = 0.250 | Δλ = 6.1 nm | Δλ = 7.2 nm | Δλ = 7.9 nm | Δλ = 8.5 nm | Δλ = 8.5 nm | Δλ = 7.2 nm | Δλ = 7.1 nm |
| x = 0.333 | Δλ = 8.2 nm | Δλ = 8.9 nm | Δλ = 10.4 nm | Δλ = 11.2 nm | Δλ = 10.8 nm | Δλ = 9.4 nm | Δλ = 8.9 nm |
| x = 0.500 | Δλ = 12.6 nm | Δλ = 13 nm | Δλ = 14.1 nm | Δλ = 15.5 nm | Δλ = 14.7 nm | Δλ = 13 nm | Δλ = 12.8 nm |
| x = 0.65 | Δλ = 25.1 nm | Δλ = 22 nm | Δλ = 24 nm | Δλ = 25.6 nm | Δλ = 24.1 nm | Δλ = 21.5 nm | Δλ = 21 nm |
Appendix B
 | ||
| Fig. 9 (a–d) Effect of varying groove height, H, on reflectance spectra calculated from nanoline grating structure for unhydrided and hydrided states of Pd. These spectra show different plasmon waveguide modes (M1, M2, M3, M4) for varying heights of the nanograting. Effect of nanograting groove height on the reflectance versus wavelength curves calculated for the following values of groove height ‘H’: (a) 25 nm, (b) 50 nm, (c) 100 nm, (d) 250 nm. For all the cases above groove gap, G = 3 nm, periodicity, P = 100 nm and thickness, t = 2 nm were taken. | ||
Appendix C
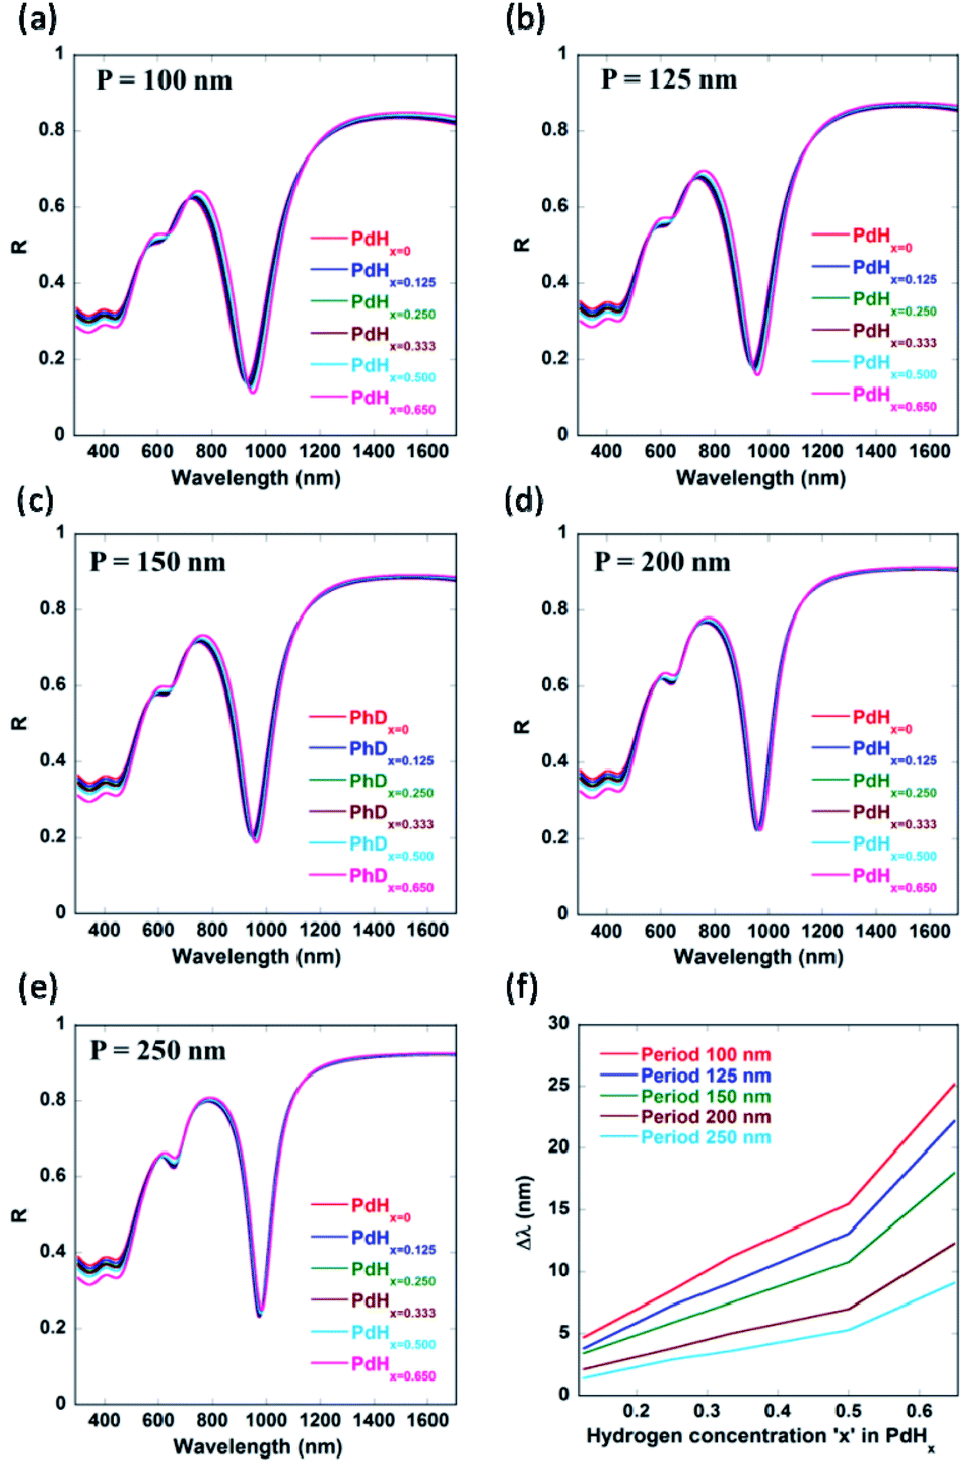 | ||
| Fig. 10 Effect of periodicity, P, of the narrow groove plasmonic nanogratings on the (a–e) reflectance versus wavelength curves for the nanograting. (f) Shift in resonance wavelength as a function of varying concentration of hydrogen. Effect of periodicity on the reflectance spectra and shift in resonance wavelength is shown for the following values of ‘P’: (a) 100 nm, (b) 125 nm, (c) 150 nm, (d) 200, (e) 250 nm. In all the cases above groove gap, G = 10 nm, height, H = 250 nm and thickness, t = 4 nm were taken. | ||
Conflicts of interest
There are no conflicts to declare.Acknowledgements
This research was supported in part by the Visvesvaraya PhD Scheme of Ministry of Electronics & Information Technology, Government of India, being implemented by Digital India Corporation (formerly Media Lab Asia). It was also supported by the Ministry of Human Resource Development (MHRD) (RP03246G: UAY program, RP03417G: IMPRINT program), the Science and Engineering Research Board (SERB) (RP03055G), the Department of Biotechnology, the Ministry of Science and Technology (DBT) (RP03150G, RP02829G), and the Defense Research and Development Organization (DRDO) (RP03356G, RP03436G, and RP03437G).Notes and references
- T. Hubert, L. Boon-Brett, G. Black and U. Banach, Sens. Actuators, B, 2011, 157, 329 CrossRef.
- F. DiMeo Jr, I. Chen, P. Chen, J. Neuner, A. Roerhl and J. Welch, Sens. Actuators, B, 2006, 117, 10 CrossRef.
- A. Bearzotti, C. Caliendo, E. Verona and A. D'Amico, Sens. Actuators, B, 1992, 7, 685 CrossRef CAS.
- A. Trouillet, E. Marin and C. Veillas, Meas. Sci. Technol., 2006, 17, 1124 CrossRef CAS.
- J. Homola, S. S. Yee and G. Gauglitz, Sens. Actuators, B, 1999, 54, 3 CrossRef CAS.
- J. Homola, Chem. Rev., 2008, 108, 462 CrossRef CAS PubMed.
- K. M. Mayer, Chem. Rev., 2011, 111, 3828 CrossRef CAS PubMed.
- F. Anggoro, A. Nugroho, I. Darmadi, V. P. Zhdanov and C. Langhammer, ACS Nano, 2018, 12, 9903 CrossRef PubMed.
- M. Fisser, R. A. Badcock, P. D. Teal and A. Hunze, J. Lightwave Technol., 2018, 36, 2166 CAS.
- C. Wadell, F. Anggoro, A. Nugroho, E. Lidström, B. Iandolo, J. B. Wagner and C. Langhammer, Nano Lett., 2015, 15, 3563 CrossRef CAS PubMed.
- S. Cai, Á. González-Vila, X. Zhang, T. Guo and C. Caucheteur, Opt. Lett., 2019, 44, 4483 CrossRef CAS PubMed.
- M. Fisser, R. A. Badcock, P. D. Teal, S. Janssens and A. Hunze, J. Lightwave Technol., 2018, 36, 850 CAS.
- M. Eryürek, Y. Karadag, N. Taşaltın, N. Kılınç and A. Kiraz, Sens. Actuators, B, 2015, 212, 78 CrossRef.
- N. Strohfeldt, J. Zhao, A. Tittl and H. Giessen, Opt. Mater. Express, 2015, 5, 2525 CrossRef CAS.
- A. Tittl, P. Mai, R. Taubert, D. Dregely, N. Liu and H. Giessen, Nano Lett., 2011, 11(10), 4366 CrossRef CAS PubMed.
- N. Liu, M. L. Tang, M. Hentschel, H. Giessen and A. P. Alivisatos, Nat. Mater., 2011, 10, 631 CrossRef CAS PubMed.
- C. Wadell and C. Langhammer, Nanoscale, 2015, 7, 10963 RSC.
- B. Chadwick and M. Gal, Appl. Surf. Sci., 1993, 68, 135 CrossRef CAS.
- X. Bevenot, A. Trouillet, C. Veillas, H. Gagnaire and M. Clement, Meas. Sci. Technol., 2002, 13, 118 CrossRef CAS.
- C. Perrotton, N. Javahiraly, M. Slaman, B. Dam and P. Meyrueis, Opt. Express, 2011, 19, A1175 CrossRef CAS PubMed.
- K. Lin, Y. Lu, J. Chen, R. Zheng, P. Wang and H. Ming, Opt. Express, 2008, 16, 18599 CrossRef CAS PubMed.
- B. D. Adams and A. Chen, Mater. Today, 2011, 14, 282 CrossRef CAS.
- R. R. J. Maier, B. J. S. Jones, J. S. Barton, S. McCulloch, T. Allsop, J. D. C. Jones and I. Bennion, J. Opt. A: Pure Appl. Opt., 2007, 9, S45 CrossRef CAS.
- N. Liu, M. L. Tang, M. Hentschel, H. Giessen and A. Paul Alivisatos, Nat. Mater., 2011, 10, 631 CrossRef CAS PubMed.
- M. E. Nasir, W. Dickson, G. A. Wurtz, W. P. Wardley and A. V. Zayats, Adv. Mater., 2014, 26, 3532 CrossRef CAS PubMed.
- A. Dhawan, M. Canva and T. Vo-Dinh, Opt. Express, 2011, 19, 787 CrossRef CAS PubMed.
- Z. Zhao, Y. Sevryugina, M. A. Carpenter, D. Welch and H. Xia, Anal. Chem., 2004, 76, 6321 CrossRef CAS PubMed.
- W. E. Vargas, I. Rojas, D. E. Azofeifa and N. Clark, Thin Solid Films, 2006, 496, 189 CrossRef CAS.
- Y. Yamada, K. Tajima, S. Bao, M. Okada, A. Roos and K. Yoshimura, J. Appl. Phys., 2009, 24, 013523 CrossRef.
- A. Cattoni, P. Ghenuche, A. Haghiri-Gosnet, D. Decanini, J. Chen, J. Pelouard and S. Collin, Nano Lett., 2011, 11, 3557 CrossRef CAS PubMed.
- C. Chang, H. Lin, M. Lai, T. Shieh, C. Peng, M. Shih and Y. Tung, Sci. Rep., 2018, 8, 11812 CrossRef PubMed.
- M. J. Weber, A. J. M. Mackus, M. A. Verheijen, V. Longo, A. A. Bol and W. M. M. Kessels, J. Phys. Chem. C, 2014, 118, 8702 CrossRef CAS.
Footnote |
| † Both authors contributed equally to this work. |
| This journal is © The Royal Society of Chemistry 2020 |