
 Open Access Article
 This Open Access Article is licensed under a Creative Commons Attribution-Non Commercial 3.0 Unported Licence
α(β)-PbO2 doped with Co3O4 and CNT porous composite materials with enhanced electrocatalytic activity for zinc electrowinning†
Xuanbing Wang ab,
Ruidong Xu*ab,
Suyang Fengab,
Bohao Yub and
Buming Chenb
ab,
Ruidong Xu*ab,
Suyang Fengab,
Bohao Yub and
Buming Chenb
aState Key Laboratory of Complex Nonferrous Metal Resources Clean Utilization, Kunming University of Science and Technology, Kunming 650093, China. E-mail: rdxupaper@aliyun.com; Fax: +86 871 65161278; Tel: +86 871 65160072
bFaculty of Metallurgical and Energy Engineering, Kunming University of Science and Technology, Kunming 650093, China
First published on 7th January 2020
Abstract
The high energy consumption during zinc electrowinning is mainly caused by the high overpotential of the oxygen evolution for Pb–Ag alloys with strong polarization. The preparation of new active energy-saving materials has become a very active research field, depending on the synergistic effects of active particles and active oxides. In this research, a composite material, α(β)-PbO2, doped with Co3O4 and CNTs on the porous Ti substrate was prepared via one-step electrochemical deposition and the corresponding electrochemical performance was investigated in simulated zinc electrowinning solution. The composite material showed a porous structure, finer grain size and larger electrochemical surface area (ECSA), which indicated excellent electrocatalytic activity. Compared with the Pb–0.76 wt% Ag alloy, the overpotential of oxygen evolution for the 3D-Ti/PbO2/Co3O4–CNTs composite material was decreased by about 452 mV under the current density of 500 A m−2 in the simulated zinc electrowinning solution. The decrease in the overpotential of oxygen evolution was mainly ascribed to the higher ECSA and lower charger transfer resistance. Moreover, it showed the lowest self-corrosion current density of 1.156 × 10⁻⁴ A cm−2 and may be an ideal material for use in zinc electrowinning.
1. Introduction
Globally, 80% of zinc is produced by zinc hydrometallurgy, for which 80% of the energy consumption originates from the electrowinning procedure. The Pb–(0.5–1 wt%)Ag alloy anode is widely used as an insoluble anode because it is conductive and relatively stable in rigorous working media. However, its high overpotential for oxygen evolution and high cost due to the addition of Ag are still unacceptable. In the past few years, extensive attempts have been devoted to the design of high electrocatalytic activity Pb–Ag based composited anodes and the electrocatalytic activity was greatly improved when some precious metals oxides were added.1,2The oxygen evolution reaction (OER) plays a crucial role in hydrogen production and zinc electrowinning (ZW) and the sluggish OER kinetics always presents a challenge. Although some precious metals have shown great electrocatalytic activity for the OER in strongly acidic media, their high cost still limits their applications in industry. Therefore, the development of base metal electrode materials with superior electrocatalytic activity and higher stability is urgently needed. Lead dioxide (PbO2) has drawn much attention due to its good electrical conductivity, low cost and high resistance to corrosion.3 However, there are still some drawbacks such as high over-potential for oxygen evolution, low stability, and low electrocatalytic activity in view of its limited active surface.4 To solve these problems, some researchers have made unremitting efforts to prepare modified PbO2 anodes with active coatings, such as RuO2,5 IrO2,6 Ta2O5,7 MnO2,8 Co3O4 (ref. 4) and carbon nanotubes (CNTs).9
The PbO2 electrode with excellent electrocatalytic activity and stability requires two key conditions. The first is a highly active surface, which is beneficial for the interface electrochemical reaction; the second is the stability of its physical structure. In order to obtain a highly active surface, the O2 bubble-templated deposition of a porous oxide was explored and a novel method to prepare PbO2 electrodes modified by MnO2 and Co3O4 was developed. The study showed that the porous electrode could provide more surface area, which is desirable for the electrode capacity.10–14
As is known, porous titanium is used as the electrode substrate material due to its good electrical conductivity, high surface area and excellent corrosion resistance.15 Comparative studies of the PbO2 electrode on the plate-like and porous Ti substrates were reported, and higher electrocatalytic performance was obtained.16,17 A porous Ti/SnO2–Sb2O3-CNT/PbO2 electrode was prepared by thermal decomposition and electrodeposition technology, in which PbO2 coating covered the surface of porous Ti and formed a fine crystalline structure, possessing a longer service life.18 Another nanostructured 3D-Ti/Sb–SnO2-Gr electrode was fabricated by a fast-evaporation process, which achieved a great enhancement in the structure and electrochemical performance, especially in its electrocatalytic activity.19
Sulfonate medium has been widely used as an environmentally friendly electrolyte in nickel deposition but is seldom reported for PbO2 electrodeposition.20 Co3O4 is attractive in the electrocatalytic field due to its excellent electrocatalytic activity. In addition, CNTs provide a promising strategy for boosting the conductivity of semiconductors with wide band gaps, or insulators.21 In this study, in order to obtain a material with a lower oxygen evolution reaction overpotential, higher active surface area and higher electrocatalytic properties, α(β)-PbO2 doped with Co3O4 and CNT porous composite materials on a porous Ti substrate was prepared from an electrolyte of Pb(CH3COO)2–NH2SO3H. The phase structures and surface microstructures were investigated by XRD and FE-SEM, the electrocatalytic activity was evaluated by anodic polarization, CV and EIS, and the corrosion resistance was also tested by Tafel plots.
2. Experimental
2.1 Preparation of porous composite materials
Firstly, porous titanium substrates (20 mm × 10 mm × 1 mm) with an average pore size of 100 μm were mechanically polished and then cleaned with deionized water and acetone to remove solid impurities. After that, they were degraded with 10 wt% sodium hydroxide (NaOH) solution, etched in boiling hydrochloric acid (HCl) with concentration 30 wt% for 60 min, and then washed by ultrasonication in deionized water.3D-Ti/PbO2, 3D-Ti/PbO2–Co3O4, 3D-Ti/PbO2–CNTs and 3D-Ti/PbO2–Co3O4–CNTs composite materials were prepared via anode electrodeposition from an electrolyte of Pb(CH3COO)2–NH2SO3H. The basic electrolyte composition included 0.2 M Pb(CH3COO)2 and a certain amount of H2NSO3H to adjust the pH value of the solution (1.0). For the doped materials, the concentrations of the second phase particles Co3O4 and CNTs were controlled at 10 g L−1 and 0.5 g L−1, respectively. The electrodeposition process conditions were as follows: current density, 20 mA cm−2; bath temperature, 40 ± 2 °C; deposition time, 60 min. For the doped materials, Co3O4 and CNTs were processed by ultrasound for 30 min before the electrodeposition. In addition, for the CNTs doped materials, 0.01 M surfactant sodium dodecyl sulfate (C12H25SO3Na, SDS) was added during the ultrasonic treatment. During the electrodeposition, mild stirring of 400 rpm to 600 rpm was carried out using a magnetic stirrer. After the electrodeposition, the composite materials were rinsed with deionized water and dried under vacuum for further characterization.
The forming mechanism of PbO2 was reported by Feischman and it has been widely accepted. The detailed pathways are shown below:
| H2O → OHads + H+ + e | (1) |
| Pb2+ + OHads + OH− → Pb(OH)2,ads+ | (2) |
| Pb(OH)2,ads+ → Pb(OH)2,ads2+ + e | (3) |
| Pb(OH)2,ads2+ → PbO2(s) + 2H+ | (4) |
The electrodeposition cell sketch is shown in Fig. 1a. A schematic illustration of the formation of α(β)-PbO2 doped with Co3O4 and CNTs porous composite materials is given in Fig. 1b, which includes the following four steps: mass transfer, absorption, deposition and growth.
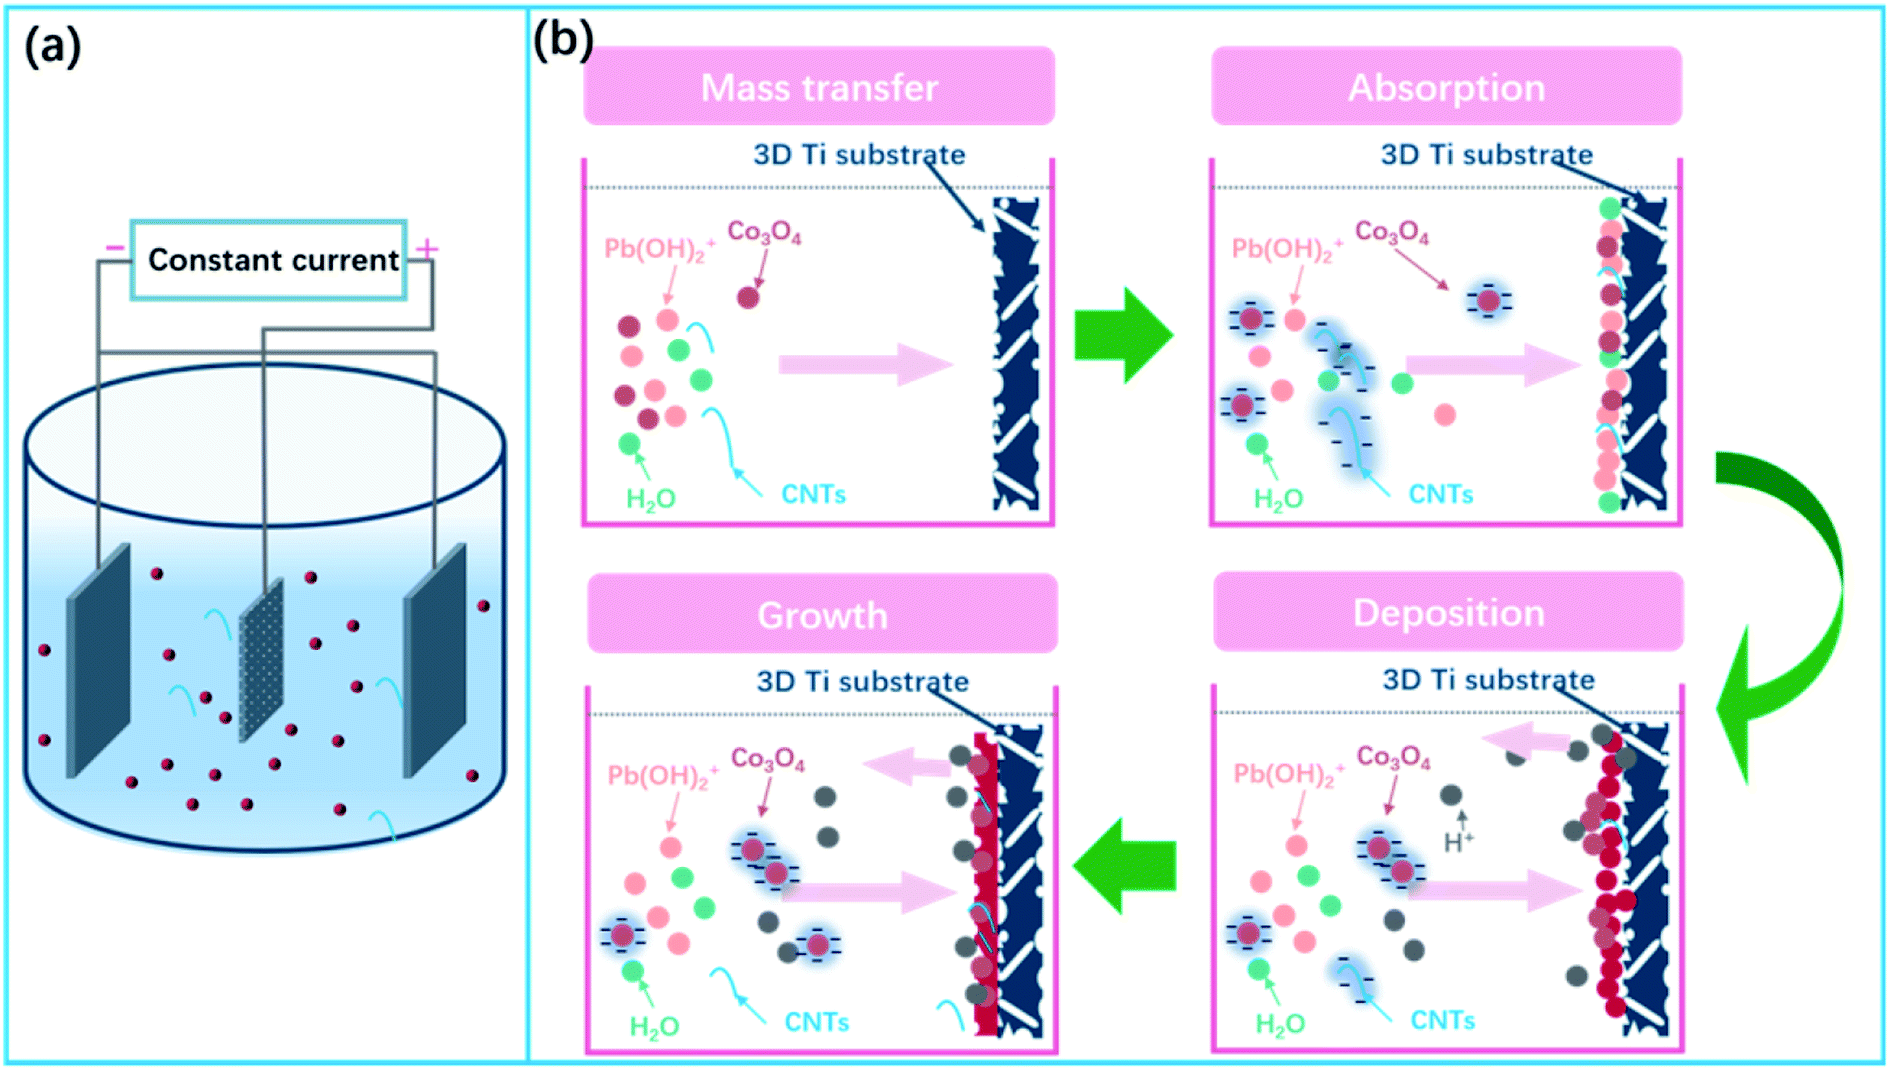 | ||
| Fig. 1 (a) Sketch of the electrodeposition cell; (b) schematic illustration of the fabrication of composite materials. | ||
2.2 Characterization of the composite materials
The phase structures of the composite materials were measured using a D/max2200 X-ray diffractometer (XRD, Cu Kα radiation). The surface morphologies and chemical composition were tested using a Nova Nano-SEM450 field emission scanning electron microscope (FE-SEM) equipped with energy dispersive spectroscopy (EDS).The anodic polarization, CV and Tafel curves were carried out using an electrochemical workstation (CHI760E) with a standard three-electrode system. In which, the composite materials were used as the working electrode and its effective area was 1 cm2. A saturated calomel electrode (SCE) was used as the reference electrode and the counter electrode was a stainless-steel plate. The reference electrode and the working electrode were linked by a Luggin capillary filled with agar and potassium chloride. In addition, the distance between the capillary and the working electrode was approximately 2d (d is the diameter of the capillary). The compositions of the tested simulated solution were 50 g L−1 Zn2+ and 150 g L−1 H2SO4, and the temperature was maintained at 35 °C. For impedance measurements, a Solartron Analytical (ModulLab XM) was used.
3. Results and discussion
3.1 Structure and surface morphology of PbO2 and its composite materials
The XRD patterns of PbO2 (a), PbO2–Co3O4 (b), PbO2–CNTS (c) and PbO2–Co3O4–CNTS (d) deposits are presented in Fig. 2.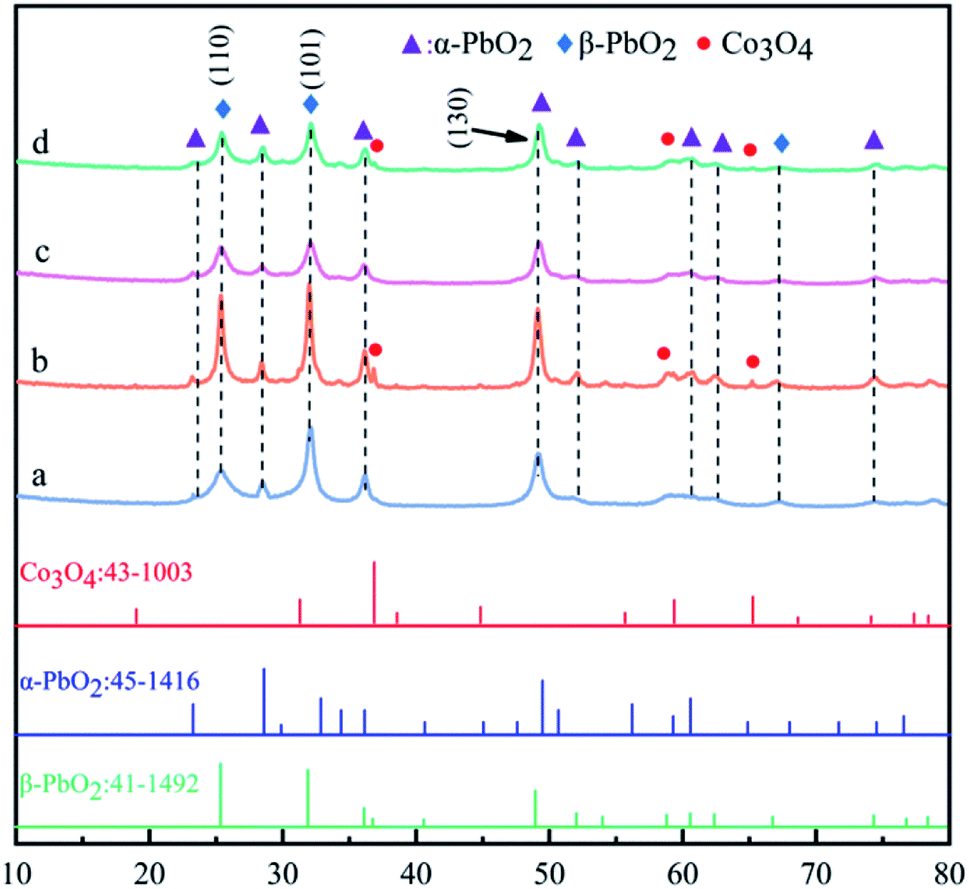 | ||
| Fig. 2 XRD patterns of (a) PbO2, (b) PbO2–Co3O4, (c) PbO2–CNTs and (d) PbO2–Co3O4–CNTS deposits. | ||
It can be seen from Fig. 2 that the main diffraction peaks of β-PbO2 appeared at 25.4° and 31.9°, and their corresponding crystal planes were (110) and (101), in accordance with the standard card (JCPDS no: 41-1492). The main diffraction peaks of α-PbO2 appeared at 28.6°, 36.2° and 49.0°, and their corresponding crystal planes were (110), (200) and (130), in accordance with the standard card (JCPDS no: 45-1416). Co3O4 diffraction peaks were observed in the patterns of PbO2–Co3O4 and PbO2–Co3O4–CNTS deposits, showing that some Co3O4 particles from the electrolyte were co-deposited into the structures of α(β)-PbO2. In particular, for the PbO2–Co3O4 deposit, the co-deposition of Co3O4 particles into the α(β)-PbO2 obviously promoted the crystallization of PbO2 and made the diffraction intensity sharper at 25.4°, 31.9°. In addition, it can be observed from Fig. 2c and d that the characteristic peaks of CNTs were not observed; this might be due to low content.22
The abovementioned research showed that α-PbO2 and β-PbO2 deposits doped with Co3O4 particles on the porous Ti substrates were obtained simultaneously from an electrolyte of Pb(CH3COO)2–NH2SO3H, PbO2 and its composite materials mainly consisted of the α-PbO2 and β-PbO2 phases, and a small portion Co3O4 particles. Whether CNTS were co-deposited into the α(β)-PbO2 deposit cannot be judged according to XRD patterns only.
Fig. 3 shows the SEM images of the porous titanium substrate and the different composite materials, where Fig. 3a, b, c, d and e represent the porous titanium substrate, the deposits of PbO2, PbO2–Co3O4, PbO2–CNTs and PbO2–Co3O4–CNTs, respectively.
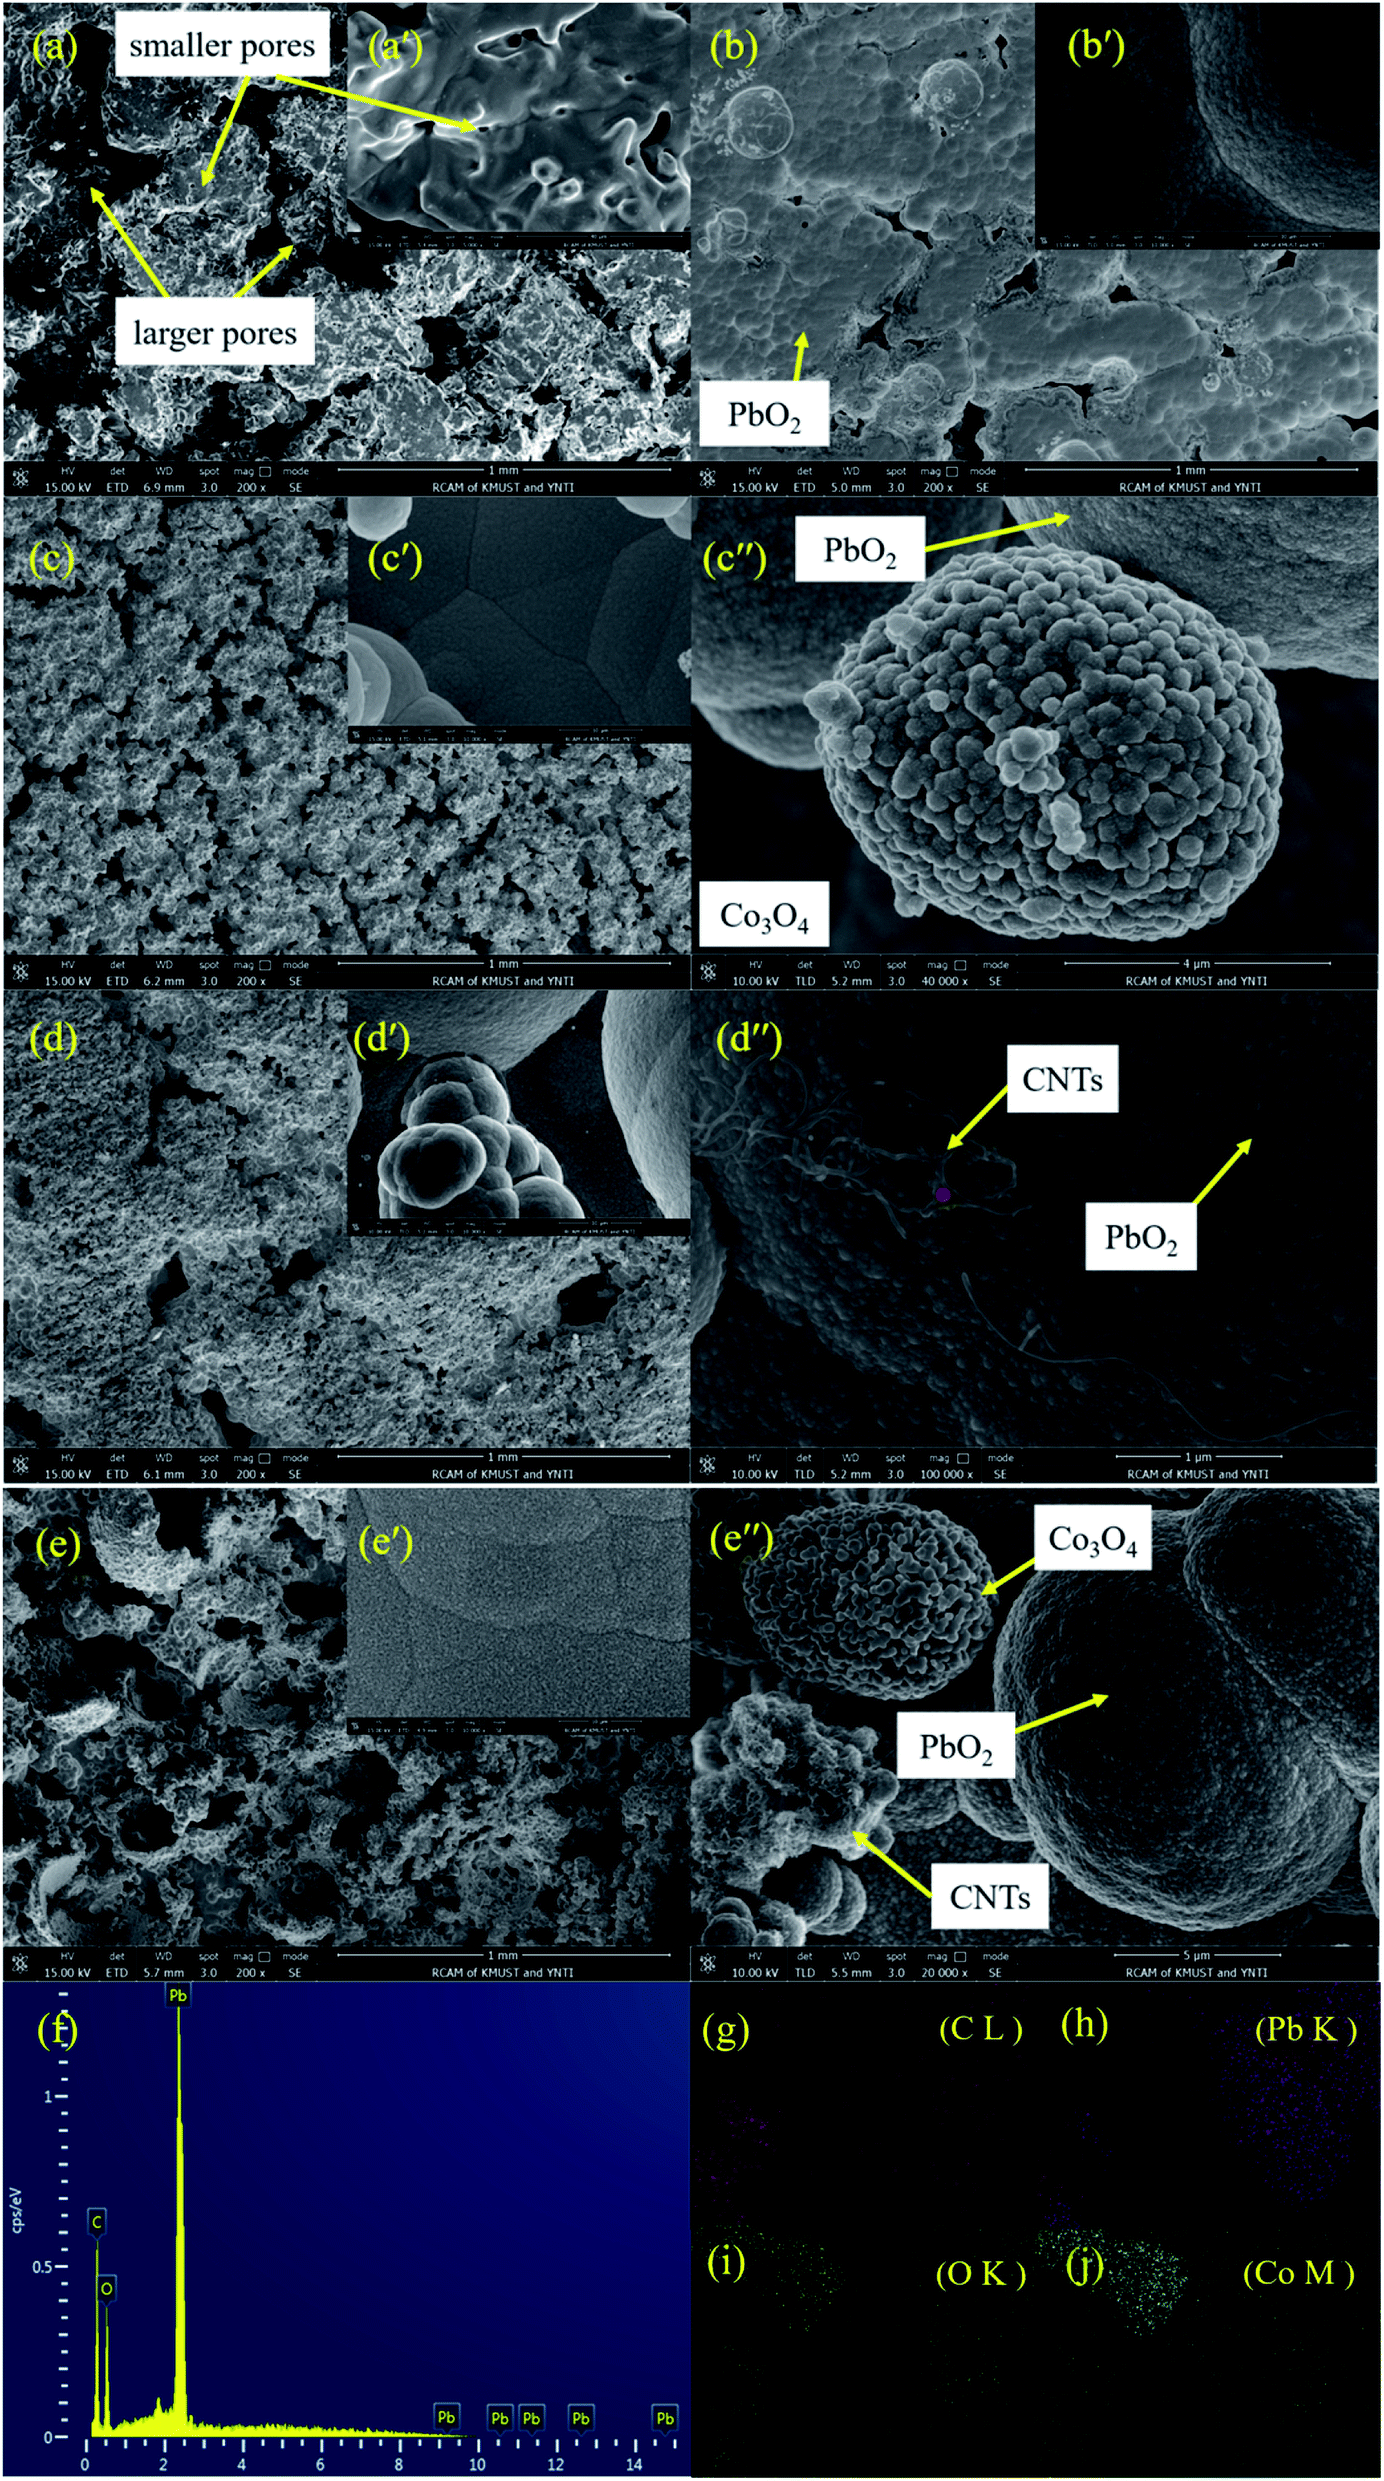 | ||
| Fig. 3 SEM images of the deposits: (a) porous substrate; (b) 3D-Ti/PbO2 deposit; (c) 3D-Ti/PbO2–Co3O4 deposit; (d) 3D-Ti/PbO2–CNTs deposit; (e) 3D-Ti/PbO2–Co3O4–CNTs deposit. (f) EDS of selected points in (d′′). (g–j) The element mapping results of zone (e′′). | ||
It can be observed from Fig. 3a that some irregular pores existed on the surface and inside of the Ti substrate. After α(β)-PbO2 deposition for 60 min (Fig. 3b–e), these pores were still not completely filled up by deposited PbO2. The PbO2 can deposit on the outside and the inside of the porous Ti substrate to make the deposit porous. The existence of pores can promote the formation of an embedded structure, making the combination between the PbO2 deposit and the substrate more compact. In addition, the pores can also help to eliminate the internal stress generated in the crystals.23 Hence, it is very important to form a porous microstructure to meet the requirements for physical and electrochemical performance. In general, the pores can be gradually covered by PbO2 with increasing depositing time. Therefore, it is crucial to control the deposited time to obtain a porous microstructure. It also can be observed from Fig. 3b that the morphology of the deposit is a polygonal crystallite microstructure, which is different from the pure α-PbO2 or β-PbO2; this might be caused by its composition of mixed phases of α-PbO2 and β-PbO2.
As for PbO2–Co3O4 (Fig. 3c), PbO2–CNTs (Fig. 3d) and PbO2–Co3O4–CNTs (Fig. 3e) deposits, the surfaces of these deposits are different from the PbO2 deposit (Fig. 3b). Apparently, the surfaces of these deposits are rougher as compared to the PbO2 deposit. From Fig. 3c–e, some other pores can clearly be observed, which might mean that the manner of nucleation and growth of PbO2 was changed.
It can be observed from Fig. 3d′′ that CNTs have been co-deposited and distributed uniformly in the PbO2 deposit, which was also proven by EDS results (Fig. 3f). When SDS was added to the Pb(CH3COO)2–NH2SO3H electrolyte, the negatively charged [CNTs-SDS]n− was probably formed and the aggregation of CNTs was decreased in the electrolyte. Moreover, [CNTs-SDS]n− could migrate toward the anode surface in the electric field, promoting the co-deposition of CNTs with PbO2.24,25 Similarly, Co3O4 and CNTs were also simultaneously co-deposited into PbO2 deposits (Fig. 3e and elements mapping Fig. 3g–j). Hence, it was confirmed that α(β)-PbO2 doped with Co3O4 and CNTs porous composite materials were successfully fabricated.
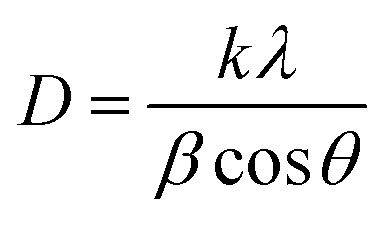
In addition, the crystal grain sizes (D) of different deposits were calculated by Debye–Scherrer's eqn (5):
 | (5) |
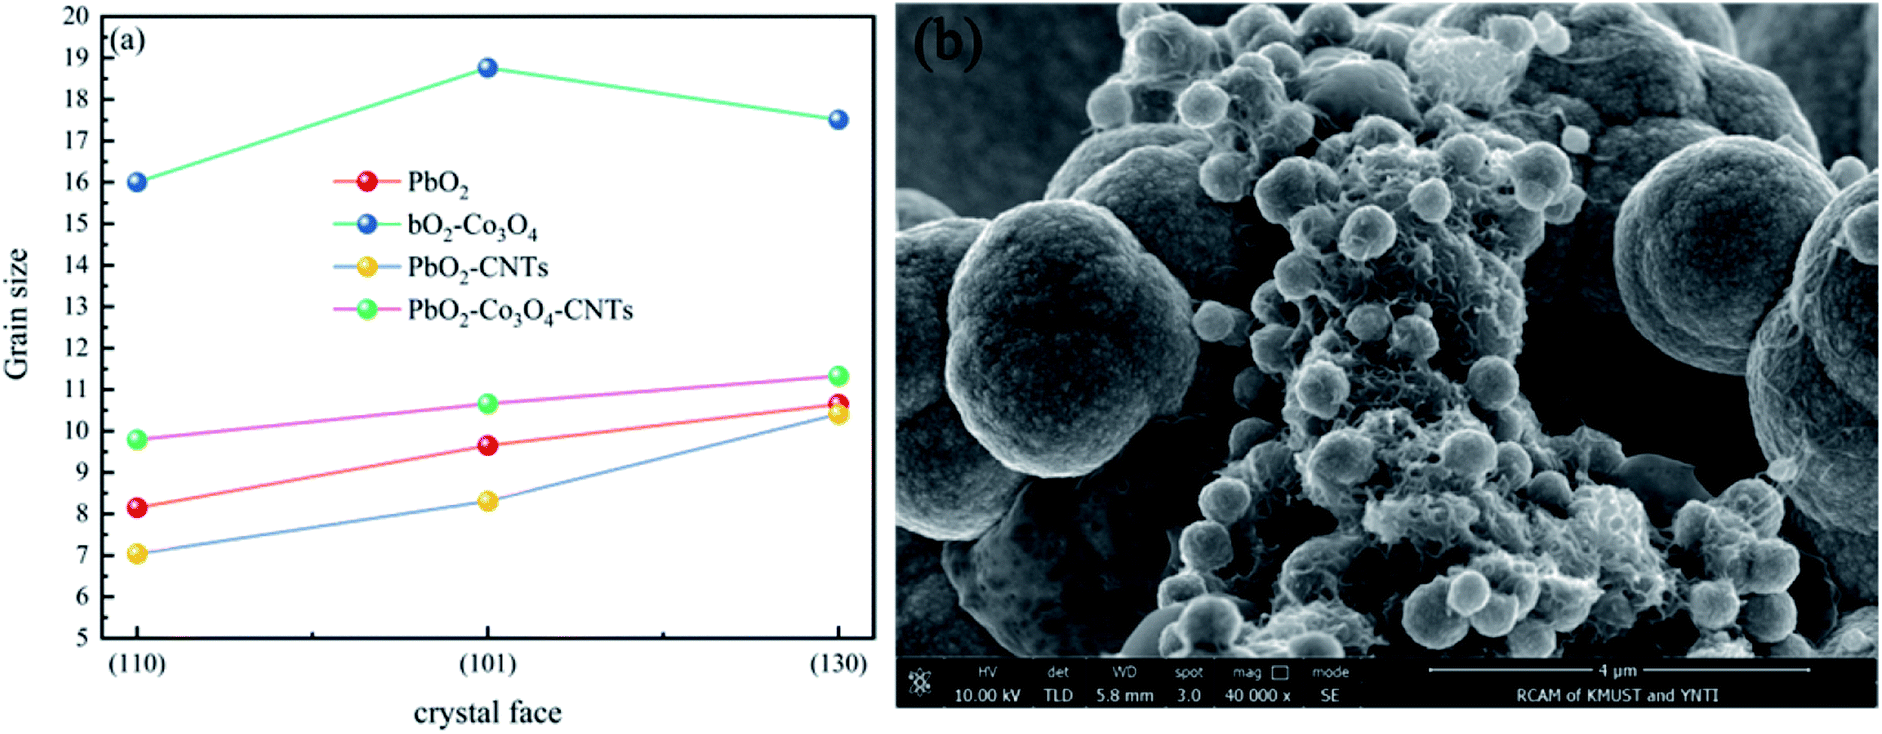 | ||
| Fig. 4 (a) The grain size on different crystal faces of different deposits and (b) the nucleation of lead dioxide on the CNTs. | ||
As shown in Fig. 4a, the grain sizes at the (110), (101) and (130) crystal faces of different deposits, arranged from largest to smallest, are as follows: PbO2–Co3O4, PbO2–Co3O4–CNTs, PbO2 and PbO2–CNTs. The PbO2 deposit doped with single Co3O4 showed the maximum crystal grain size at the (110), (101) and (130) crystal faces. This may be due to the formation of larger grains of Co3O4 particles that were covered by PbO2 grains. The PbO2–CNTs deposit displayed the minimum crystal grain sizes, revealing that CNTs could refine the crystal grains. This may be because CNTs with superior electrical conductivity improved the nucleation of PbO2 when adsorbed on the surface of the substrate (Fig. 4b), and the growth rate of the PbO2 grains decreased. The crystal grain sizes of PbO2–Co3O4–CNTs were slightly larger as compared to PbO2–CNTs, suggesting that the influence of CNTs on the growth of PbO2 grains played a more important role during the co-depositing of PbO2, Co3O4 and CNTs.
3.2 The electrocatalytic activity for OER characterizations
In zinc electrowinning, the sluggish kinetics of the OER determines the electric energy consumption. Hence, the OER electrocatalytic activity is a key factor in evaluating an anode material. To investigate the OER electrocatalytic activity of PbO2 and its composite materials, anode polarization technology was adopted at a scan rate of 10 mV s−1 in a simulated zinc solution (50 g L−1 Zn2+, 150 g L−1 H2SO4); the results are presented in Fig. 5a. The electrocatalytic activity of the PbO2 and its composite materials arranged from good to poor are as follows: 3D-Ti/PbO2–Co3O4–CNTs, 3D-Ti/PbO2–CNTs, 3D-Ti/PbO2–Co3O4 and 3D-Ti/PbO2, according to the OER potential.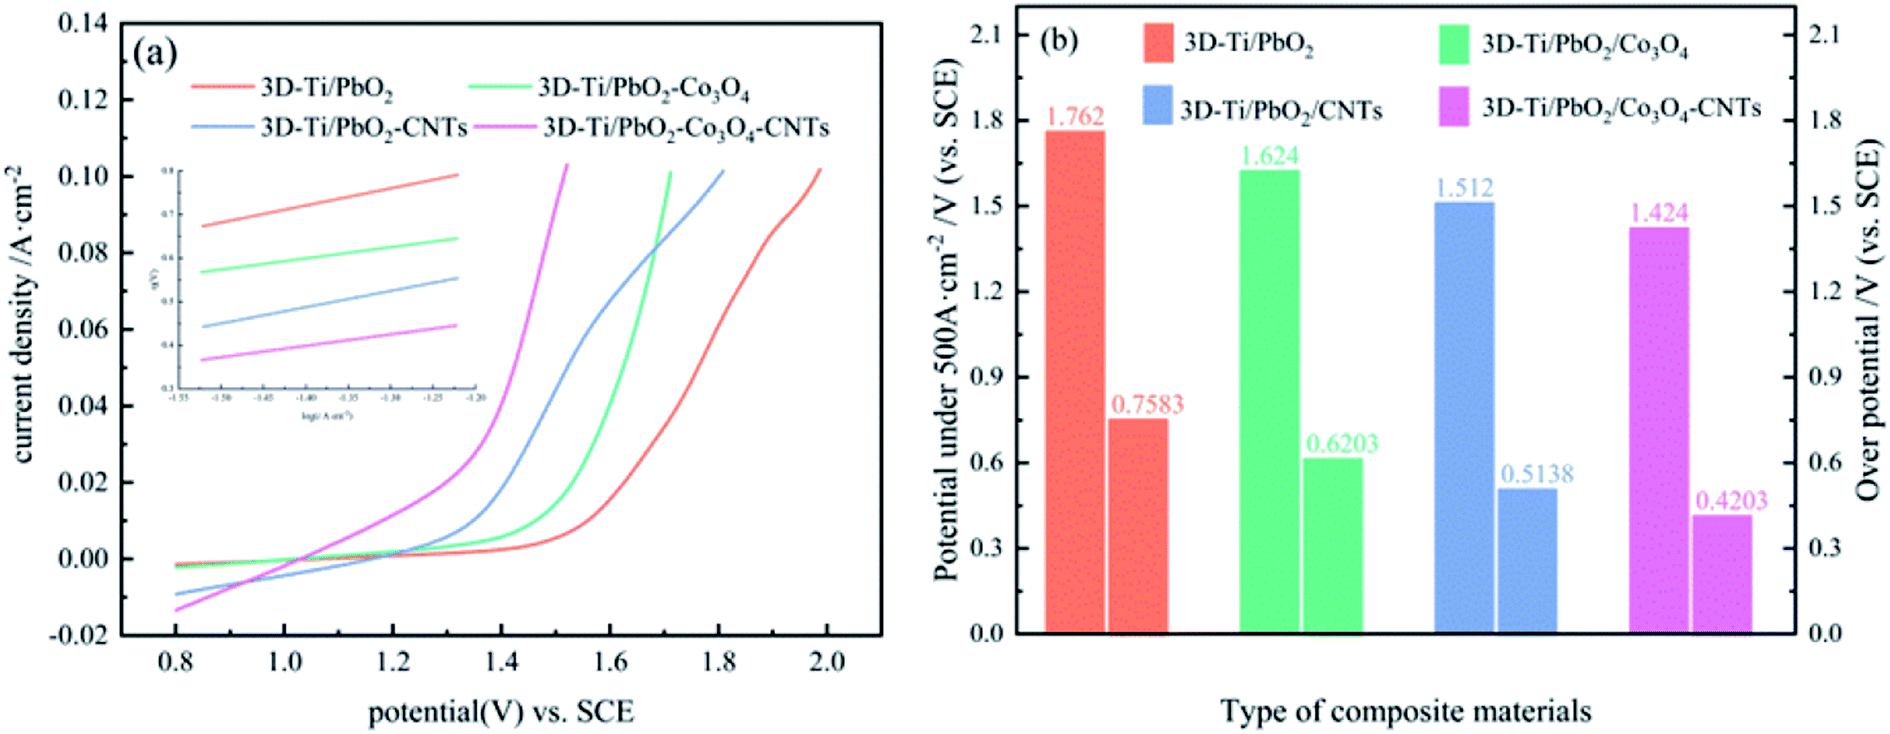 | ||
| Fig. 5 (a) Anodic polarization curves of PbO2 and its composite materials. (b) The potential and overpotential of PbO2 and its composite materials at the current density of 500 A m−2 in a simulated zinc solution. | ||
Fig. 5b presents the OER potential and overpotential of PbO2 and its composite materials. The OER potential and overpotential of 3D-Ti/PbO2, 3D-Ti/PbO2–Co3O4, 3D-Ti/PbO2–CNTs and 3D-Ti/PbO2–Co3O4–CNTs, arranged from high to low, are as follows: 1.762 V, 1.624 V, 1.512 V, 1.424 V, and 0.7583 V, 0.6203 V, 0.5138 V, 0.4203 V, respectively, at a current density of 500 A cm−2. The OER potential and overpotential of the PbO2 composite materials doped with Co3O4 and CNTs were obviously lower as compared to 3D-Ti/PbO2, indicating that Co3O4 and CNTs are beneficial for enhancing the OER electrocatalytic activity. Besides, the abovementioned potentials and overpotential were obviously lower than those of the Pb–0.76% Ag alloy with potential 1.870 V and overpotential 0.872 V.26
The inset in Fig. 5a is the Tafel linear fitting curves (η = a + b![[thin space (1/6-em)]](https://www.rsc.org/images/entities/char_2009.gif) logi) for PbO2 and its composite materials. The parameters of Tafel linear fitting are listed in Table 1 (linear fitting range: 300–600 A m−2).
logi) for PbO2 and its composite materials. The parameters of Tafel linear fitting are listed in Table 1 (linear fitting range: 300–600 A m−2).
| Material type | OER kinetic factors | ||
|---|---|---|---|
| a | b (V dec−1) | i0 | |
| 3D-Ti-PbO2 | 1.2697 | 0.3922 | 5.789 × 10⁻⁴ |
| 3D-Ti/PbO2–Co3O4 | 0.9589 | 0.2563 | 1.814 × 10⁻⁴ |
| 3D-Ti/PbO2–CNTs | 1.0105 | 0.3732 | 1.954 × 10⁻³ |
| 3D-Ti/PbO2–Co3O4–CNTs | 0.7043 | 0.2621 | 2.055 × 10⁻³ |
η is the OER overpotential, a is the intercept, b is the Tafel slope and i0 is the exchange current density. Among these parameters, the exchange current density (i0) as a primary driver is the most important factor for evaluating the electrocatalytic activity; a large i0 suggests that the OER occurs easily and with less power consumption. It can be seen from Table 1 that 3D-Ti/PbO2–Co3O4–CNTs showed the largest i0 value with 2.055 × 10⁻³, representing the optimal electrochemical activity.
It can be concluded from the above research that 3D-Ti/PbO2–Co3O4–CNTs showed the optimal electrochemical activity. The reason may be that the second phase, such as Co3O4 and CNTs, improved the electrocatalytic activity.
The spinel Co3O4 consists of two kinds of Co ions (Fig. 6):27 Co2+ located in the tetrahedral site and two other Co3+ ions in the octahedral site.28 The extraordinary structure may be related to its extra electrocatalytic activity. Besides, the transformation between Co2+ and Co3+ might correspond to the electrocatalytic activity. It has been reported that a small portion of Co3O4 could turn into Co2+ in aqueous solution at a higher potential, which is beneficial for the oxygen evolution. Once a few Co3O4 formed Co2+, the redox couple of Co2+ and Co3+ is absorbed at the active sites of PbO2. This process can be described by eqn (6)–(9). The existence of these reactions reduced the oxygen potential.1,29–32
| Co(abs)2+ ↔ Co3+ | (6) |
| Co3+ + OH ↔ CoOH2+ | (7) |
| CoOH2+ ↔ Co2+ + H2O + O | (8) |
| O + O = O2 | (9) |
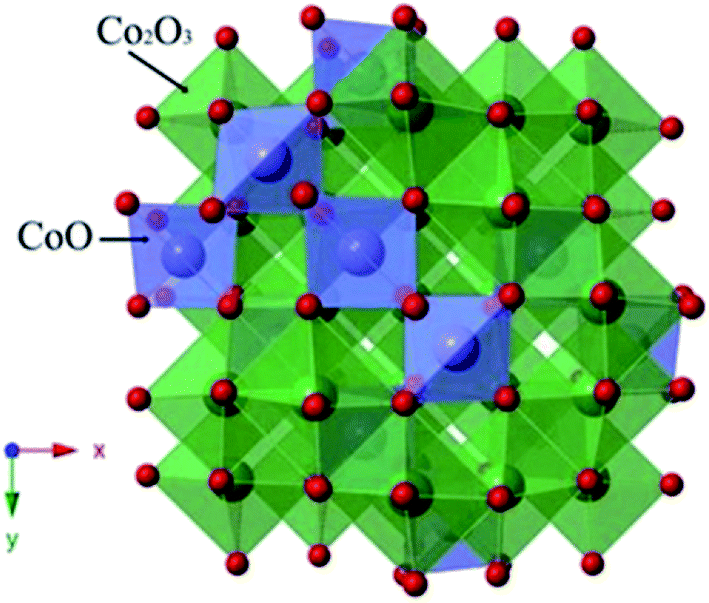 | ||
| Fig. 6 The spinel structure of Co3O4. | ||
The superior electric conductivity of CNTs would help to improve the OER electrocatalytic activity, which has been demonstrated in a recent report.33 When Co3O4 and CNTs were doped into PbO2, a synergetic effect contributed to the OER electrocatalytic activity.34,35
Secondly, the second active phase may alter the kinetics, specifically, the rate determination step (rds) during the OER process.
In the electrowinning process of zinc, the anodic reaction can be ascribed to the eqn (10):
| 2H2O − 4e− → 4H+ + O2 | (10) |
The detailed reaction pathways for OER on the active metal oxides electrode are described in Table 2:36
| Step | b/V dec−1 | — |
|---|---|---|
| S + H2O → S–OHads + H+ + e− | 0.12 | (11) |
| S–OHads → S–Oads + H+ + e− | 0.04 | (12a) |
| 2S–OHads → S–Oads + S + H2O | 0.03 | (12b) |
| 2S–Oads → S + O2 | 0.015 | (13) |
S indicates the active site on the metal oxide surface, S–OHads and S–Oads represent adsorbed intermediate species and b is the Tafel slope. Among the 4 steps in Table 2, the rds is commonly associated with the Tafel slope (b) for the OER. For PbO2, the generation of the adsorbed intermediate S–Oads (11) was be supposed to be rds when b is equal to or greater than 0.12 V dec−1.36 The b values of PbO2 and its composite materials ranged from 0.2563 to 0.3922 V dec−1, and were larger than 0.12 V dec−1; hence, step (11) was rds in the present research. Consequently, the outstanding electrocatalytic activity of the PbO2 composite materials doped with Co3O4 and CNTs may be attributed to more S–Oads when Co3O4 and CNTs were doped into PbO2.
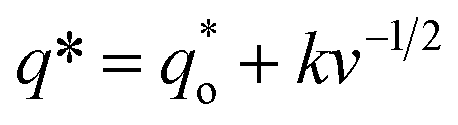
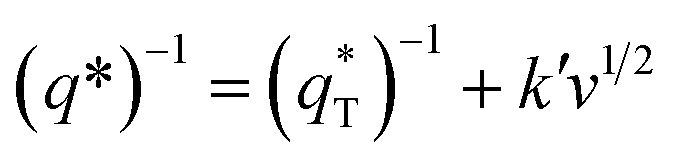
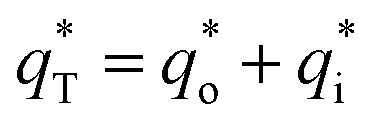
Thirdly, the electrocatalytic activity is affected by the active surface area; a large active surface area can provide more active sites that are beneficial to improve the electrochemical efficiency. It is known that the active surface area is related to the voltammetric charge (q*), which was usually measured by CV technology.15,35
It has been reported that the voltammetric charge (q*) consists of two parts: the outer voltammetric charge  and the inner voltammetric charge
 can be calculated by the following equation:
 | (14) |
 can be obtained by the extrapolation method when the v = ∞.
 can be obtained by plotting q* versus the square root of the scan rate as expressed by the following equation:
 | (15) |
 can be calculated when v = 0.
 can be acquired from the following equation:
 | (16) |
The cyclic voltammogram curves of PbO2 and its composite materials in an aqueous electrolyte containing 50 g L−1 Zn2+ and 150 g L−1 H2SO4, are shown in Fig. 7a; the plots of q* against the reciprocal square root of potential scan rate (v−1/2) are depicted in Fig. 7b; the linear fitting of (q*)−1 versus v−1/2 is displayed in Fig. 7c and  and
and  for PbO2 and its materials are summarized in Table S2† and Fig. 7d.
 | ||
| Fig. 7 (a) Cyclic voltammogram curves of PbO2 and its composite materials; (b) relationship of q* versus v−1/2; (c) relationship of (q*)−1 versus v1/2; (d) diagram showing electrochemical porosity. | ||
Fig. 7b and c depict a good linear relationship between q* and v−1/2, and (q*)−1 and v1/2, respectively. It can be seen from Table S2† that the  values of 3D-Ti/PbO2–Co3O4–CNTs, 3D-Ti/PbO2–CNTs, 3D-Ti/PbO2–Co3O4 and 3D-Ti/PbO2 were 39.04, 5.388, 2.311 and 0.26, so the total voltammetric charge was apparently increased when Co3O4 and CNTs were doped into PbO2. Besides, it can be observed from Fig. 7d that the electrochemical porosity is arranged from large to small as follows: 96.5%, 82.8%, 60.8% and 6.5% for 3D-Ti/PbO2–Co3O4–CNTs, 3D-Ti/PbO2–CNTs, 3D-Ti/PbO2–Co3O4 and 3D-Ti/PbO2.
The doping of Co3O4 and CNTs into PbO2 and the porous structure increased the active surface area, and the 3D-Ti/PbO2–Co3O4–CNTs exhibited the best electrocatalytic activity.
Additionally, PbO2 and its composite materials were tested by EIS technology to evaluate their electrocatalytic activity, the Nyquist plots under a constant potential of 1.5 V (vs. SCE) are shown in Fig. 8.
 | ||
| Fig. 8 EIS plots for 3D-Ti/PbO2, 3D-Ti/PbO2–Co3O4, 3D-Ti/PbO2–CNTs and 3D-Ti/PbO2–Co3O4–CNTs. | ||
It is clear that 3D-Ti/PbO2 showed the highest impedance, followed by 3D-Ti/PbO2–Co3O4, 3D-Ti/PbO2–CNTs and 3D-Ti/PbO2–Co3O4–CNTs. The EIS was investigated by the LR(QR) (CR) equivalent circuit (inset in Fig. 8), which was adopted from a report that also studied the DSA anodes. L can be ascribed to the electrochemical system,37 Rs is the resistance of the solution, Rct is the polarization (or charge transfer) resistance for oxygen evolution and Qdl is a constant phase element related to the double-layer capacitance at the Ti |deposited composite| electrolyte. The combination of Rct and Qdl indicates the behavior of the interface between the deposited composite and electrolyte, which can be calculated by eqn (17). The combination of Cf and Rf (CfRf) determines the properties of the oxide layer.38,39
| ZCPE = [Q(jω)n]−1 | (17) |
Here, j is equal to  ω is the angular velocity defined 2πf with being frequency, Q is the constant phase element, and n is an empirical constant between 0 and 1. When n = 1, the CPE is a pure capacitance. The effective capacitance C can be calculated by eqn (18):
 | (18) |
The circuit parameters for all prepared materials were calculated and are listed in Table 3. The Rs ranged from 0.123 to 0.284. The slight difference can be ascribed to the oxygen bubble on the surface, which blocked the interface of the electrode and electrolyte. The double-layer capacitance (Cdl) of both doped Co3O4 and CNTs was about 15 times higher than that without doped particles, which showed a higher electrochemically active surface area (ECSA).43 Besides, 3D-Ti/PbO2–Co3O4–CNTs composite materials showed the lowest Rct value, which was only about one fourth lower than that of 3D-Ti/PbO2, illustrating the higher electrocatalytic activity for the OER.
| Material type | L/μH | Rs (Ω−1 cm−2) | Rct (Ω−1 cm−2) | n | Qdl (Ω−1 cm−2 sn) | Cdl (F cm−2) | Rf (Ω−1 cm−2) | Qf (Ω−1 cm−2 sn) |
|---|---|---|---|---|---|---|---|---|
| 3D-Ti/PbO2 | 0.128 | 0.284 | 13.5 | 0.686 | 0.0218 | 0.4115 | 7.455 | 0.280 |
| 3D-Ti/PbO2–Co3O4 | 0.085 | 0.186 | 4.73 | 0.762 | 0.762 | 1.5369 | 5.033 | 0.173 |
| 3D-Ti/PbO2–CNTs | 0.070 | 0.231 | 4.56 | 0.754 | 0.120 | 0.3897 | 5.232 | 0.754 |
| 3D-Ti/PbO2–Co3O4–CNTs | 0.096 | 0.123 | 3.11 | 0.496 | 0.38 | 6.3250 | 0.00562 | 0.00566 |
It is known that CNTs are metallic with high conductivity of ∼100 S m−1 (about 2-fold that of PbO2 (∼59 S m−1)).44,45 The addition of CNTs could bridge the PbO2 and Ti substrate, and result in low Rct (shown in Table 3). Xu et al. also found that CNTs could support a long-term electron exchange between the Pt and Pd without direct atomic contact.46
For comparison, the OER performances of some electrodes have been listed in Table S3† and Fig. 9.
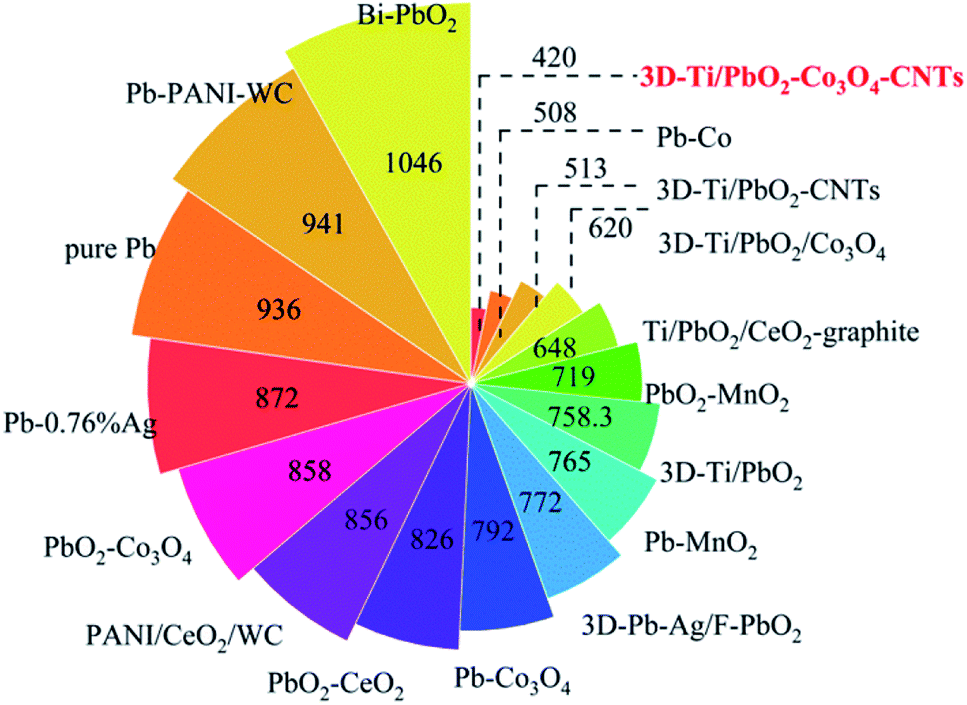 | ||
| Fig. 9 The overpotential of different composite materials at 500 A cm−2. | ||
As can be seen from Fig. 9, 3D-Ti/PbO2–Co3O4, 3D-Ti/PbO2–CNTs and 3D-Ti/PbO2–Co3O4–CNTs exhibited the best OER electrocatalytic activity. The outstanding electrocatalytic activity of 3D-Ti/PbO2–Co3O4–CNTs can be attributed the porous structure (Fig. 3), small crystal grain sizes (Fig. 5a) and the second phases such as Co3O4 and CNTs. The porous structure not only provided more active surface area but also gave more channels for removing oxygen generated in the reaction. The small grain size offered more active sites. In addition, Co3O4 with excellent catalytic activity and CNTs with outstanding electric conductivity improved the electrocatalytic activity when doped into PbO2 deposits. Therefore, 3D-Ti/PbO2–Co3O4–CNTs composite materials showed excellent electrocatalytic activity for the OER.
3.3 Corrosion resistance characterization
The high corrosion resistance of electrode materials is necessary to maintain long service life; hence, in order to investigate the corrosion resistance, the Tafel technology was used at a scan rate of 1 mV s−1 in a simulated zinc solution (50 g L−1 Zn2+, 150 g L−1 H2SO4). The results are shown in Fig. 10, and the corrosion currents and corrosion potentials are listed in Table S4.†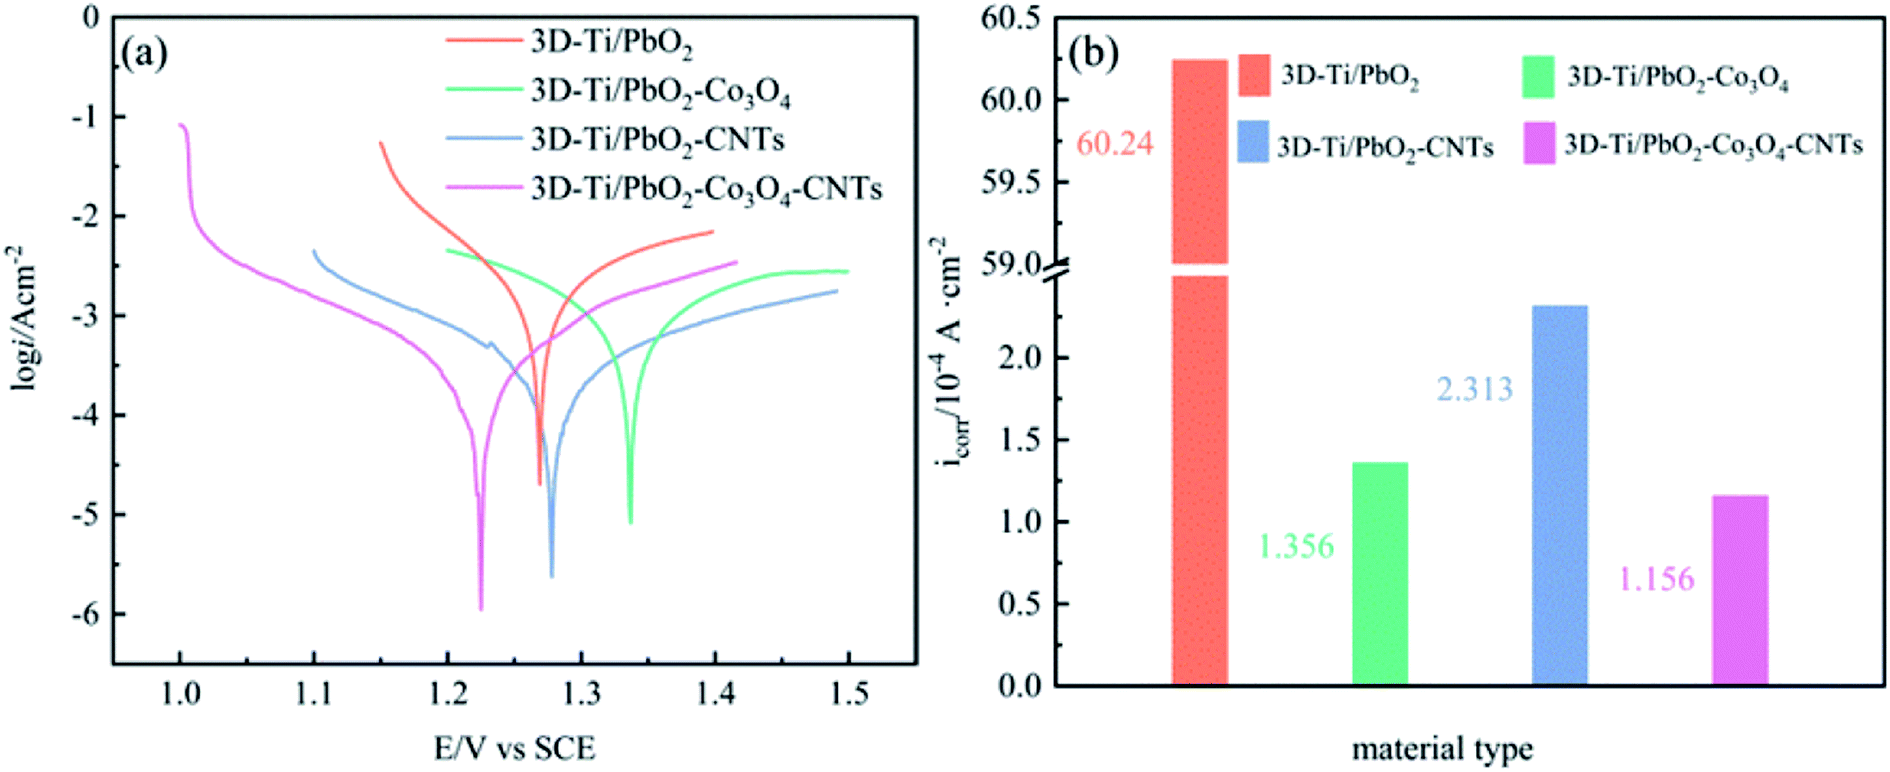 | ||
| Fig. 10 (a) Tafel polarization curves of PbO2 and its composite materials (scan rate: 1 mV s−1), (b) self-corrosion current density (icorr) of different composite materials in the simulated zinc solution. | ||
The value of Ecorr reveals the self-corrosion capacity of the material without external power being supplied, and icorr indicates the corrosion rate at a certain potential. As shown in Fig. 10b, the icorr of 3D-Ti/PbO2, 3D-Ti/PbO2–Co3O4, 3D-Ti/PbO2–CNTs and 3D-Ti/PbO2–Co3O4–CNTs were 6.024 × 10⁻³, 1.356 × 10⁻⁴, 2.314 × 10⁻⁴ and 1.156 × 10⁻⁴ (A cm−2), respectively. The icorr of doped composite materials is lower by nearly an order of magnitude as compared to that of the Pb–1% Ag alloy (5.17 × 10⁻³ A cm−2).47 It can be concluded that the doped composite materials presented better corrosion resistance in the simulated zinc solution (50 g L−1 Zn2+, 150 g L−1 H2SO4) at 35 °C.
4. Conclusion
In summary, a PbO2 composite material doped with Co3O4 and CNTs on a porous Ti substrate was prepared via a one-step electrochemical deposition, which involved the β-PbO2 phase, a small portion of the α-PbO2 phase, Co3O4 and CNTs. The 3D-Ti/PbO2/Co3O4–CNTs composite material exhibited a porous structure with the highest electrochemical porosity of 96%, large electrochemical surface area of 6.325 (F cm−2) and the lowest charge transfer resistance of 3.11 ohm cm2 in comparison to other electrodes. Compared with the Pb–0.76 wt% Ag alloy, the overpotential of the oxygen evolution was decreased by about 452 mV under the current density of 500 A m−2 in the simulated zinc electrowinning solution, displaying outstanding electrocatalytic activity. Furthermore, it showed the lowest self-corrosion current density, displaying good corrosion reactance.Conflicts of interest
There are no conflicts to declare.Acknowledgements
Authors gratefully acknowledge the financial support of the Natural Science Foundation of China (Project No. 51874154, 51564029), the Key Project of Yunnan Province Science and Technology Plan of China (Project No. 2014FA024); the Specialized Research Fund for the Doctoral Program of the Ministry of Education of China (Project No. 20125314110011) and Analysis and Measurement Research Fund (2017M20172128008) of Kunming University of Science and Technology.References
- M. Clancy, C. J. Bettles, A. Stuart and N. Birbilis, Hydrometallurgy, 2013, 131–132, 144–157 CrossRef CAS.
- X. Zhong, F. Chen, H. Nie, R. Wang and Z. Xu, Hydrometallurgy, 2019, 190, 105188 CrossRef CAS.
- X. Li, D. Pletcher and F. C. Walsh, Chem. Soc. Rev., 2011, 40, 3879–3894 RSC.
- J. Zhao, C. Zhu, J. Lu, C. Hu, S. Peng and T. Chen, Electrochim. Acta, 2014, 118, 169–175 CrossRef CAS.
- J. Aromaa and O. Forsén, Electrochim. Acta, 2006, 51, 6104–6110 CrossRef CAS.
- A. T. Marshall and R. G. Haverkamp, J. Mater. Sci., 2011, 47, 1135–1141 CrossRef.
- M. Zahedi, K. Jafarzadeh, M. Mirjani and H. M. Abbasi, Ionics, 2017, 24, 451–458 CrossRef.
- R. Ma, S. Cheng, X. Zhang, S. Li, Z. Liu and X. Li, Hydrometallurgy, 2016, 159, 6–11 CrossRef CAS.
- W. Zhao, J. Xing, D. Chen and J. Shen, J. Adv. Oxid. Technol., 2017, 20, 20160181 CAS.
- N. Comisso, S. Cattarin, P. Guerriero, L. Mattarozzi, M. Musiani and E. Verlato, Electrochem. Commun., 2015, 60, 144–147 CrossRef CAS.
- N. Comisso, S. Cattarin, P. Guerriero, L. Mattarozzi, M. Musiani and E. Verlato, Electrochim. Acta, 2016, 200, 259–267 CrossRef CAS.
- N. Comisso, S. Cattarin, P. Guerriero, L. Mattarozzi, M. Musiani and E. Verlato, Electrochem. Commun., 2016, 73, 59–62 CrossRef CAS.
- N. Comisso, L. Armelao, S. Cattarin, P. Guerriero, L. Mattarozzi, M. Musiani, M. Rancan, L. Vázquez-Gómez and E. Verlato, Electrochim. Acta, 2017, 253, 11–20 CrossRef CAS.
- N. Comisso, L. Armelao, S. Cattarin, P. Guerriero, L. Mattarozzi, M. Musiani, M. Rancan, L. Vázquez-Gómez and E. Verlato, Electrochim. Acta, 2018, 273, 454–461 CrossRef CAS.
- W. Zhang, H. Kong, H. Lin, H. Lu, W. Huang, J. Yin, Z. Lin and J. Bao, J. Alloys Compd., 2015, 650, 705–711 CrossRef CAS.
- Y. He, W. Huang, R. Chen, W. Zhang, H. Lin and H. Li, Sep. Purif. Technol., 2015, 156, 124–131 CrossRef CAS.
- Y. He, W. Huang, R. Chen, W. Zhang and H. Lin, Sep. Purif. Technol., 2015, 149, 124–131 CrossRef CAS.
- J. Xing, D. Chen, W. Zhao, X. Peng, Z. Bai, W. Zhang and X. Zhao, RSC Adv., 2015, 5, 53504–53513 RSC.
- S. Asim, Y. Zhu, M. Rana, J. Yin, M. W. Shah, Y. Li and C. Wang, Chemosphere, 2017, 169, 651–659 CrossRef CAS PubMed.
- G. A. Sadakov, E. K. Burygina, A. A. Mazin and N. M. Pokhomov, Chem. Informationsdienst, 1978, 9 DOI:10.1002/chin.197832040.
- J. Jiang, Y. Li, J. Liu, X. Huang, C. Yuan and X. W. Lou, Adv. Mater., 2012, 24, 5166–5180 CrossRef CAS PubMed.
- Z. Xu, H. Liu, J. Niu, Y. Zhou, C. Wang and Y. Wang, J. Hazard. Mater., 2017, 327, 144–152 CrossRef CAS PubMed.
- B. Chen, S. Wang, J. Liu, H. Huang, C. Dong, Y. He, W. Yan, Z. Guo, R. Xu and H. Yang, Corros. Sci., 2018, 144, 136–144 CrossRef CAS.
- R. Amadelli, L. Samiolo, A. B. Velichenko, V. A. Knysh, T. V. Luk’yanenko and F. I. Danilov, Electrochim. Acta, 2009, 54, 5239–5245 CrossRef CAS.
- X. Duan, F. Ma, Z. Yuan, L. Chang and X. Jin, J. Electroanal. Chem., 2012, 677–680, 90–100 CrossRef CAS.
- I. Ivanov, Y. Stefanov, M. Petrova, Ts. Dobrev and J. P. Demaerel, Hydrometallurgy, 2000, 57, 125–139 CrossRef CAS.
- M. Liang, M. Zhao, H. Wang, F. Wang and X. Song, Journal of Energy Storage, 2018, 17, 311–317 CrossRef.
- Y. Wang, S. F. Hung, H. Y. Chen, T. S. Chan, H. M. Chen and B. Liu, J. Am. Chem. Soc., 2016, 138, 36–39 CrossRef PubMed.
- N. Ortiz Peña, D. Ihiawakrim, M. Han, B. Lassalle-Kaiser, S. Carenco, C. Sanchez, C. Laberty-Robert, D. Portehault and O. Ersen, ACS Nano, 2019, 13, 11372–11381 CrossRef PubMed.
- M. Favaro, J. Yang, S. Nappini, E. Magnano, F. M. Toma, E. J. Crumlin, J. Yano and I. D. Sharp, J. Am. Chem. Soc., 2017, 139, 8960–8970 CrossRef CAS PubMed.
- J. B. Gerken, J. G. Mcalpin, J. Y. C. Chen, M. L. Rigsby, W. H. Casey, R. D. Britt and S. S. Stahl, J. Am. Chem. Soc., 2011, 133, 14431–14442 CrossRef CAS PubMed.
- J. A. Koza, Z. He, A. S. Miller and J. A. Switzer, Chem. Mater., 2012, 24, 3567–3573 CrossRef CAS.
- I. S. Filimonenkov, G. A. Tsirlina and E. R. Savinova, Electrochim. Acta, 2019, 319, 227–236 CrossRef CAS.
- Y. Cheng and S. P. Jiang, Prog. Nat. Sci.: Mater. Int., 2015, 25, 545–553 CrossRef CAS.
- Y. Dan, H. Lu, X. Liu, H. Lin and J. Zhao, Int. J. Hydrogen Energy, 2011, 36, 1949–1954 CrossRef CAS.
- Y. Lai, Y. Li, L. Jiang, W. Xu, X. Lv, J. Li and Y. Liu, J. Electroanal. Chem., 2012, 671, 16–23 CrossRef CAS.
- J. M. Hu, H. M. Meng, J. Q. Zhang and C. N. Cao, Corros. Sci., 2002, 44, 1655–1668 CrossRef CAS.
- J. M. Hu, J. Q. Zhang and C. N. Cao, Int. J. Hydrogen Energy, 2004, 29, 791–797 CrossRef CAS.
- S. Palmas, A. M. Polcaro, F. Ferrara, J. Rodriguez Ruiz, F. Delogu, C. Bonatto-Minella and G. Mulas, J. Appl. Electrochem., 2008, 38, 907–913 CrossRef CAS.
- A. QayoomMugheri, U. Aftab, M. IshaqAbro, S. R. Chaudhry, L. Amaral and Z. H. Ibupoto, Electrochim. Acta, 2019, 306, 9–17 CrossRef CAS.
- G. J. Brug and A. M. van den Eeden, J. Electroanal. Chem., 1984, 176, 275 CrossRef CAS.
- C. M. Gore, J. O. White, E. D. Wachsman and V. Thangadurai, J. Mater. Chem. A, 2014, 2, 2363–2373 RSC.
- C. C. L. Mccrory, S. Jung, I. M. Ferrer, S. M. Chatman, J. C. Peters and T. F. Jaramillo, J. Am. Chem. Soc., 2015, 137, 4347–4357 CrossRef CAS PubMed.
- W. Mindt, J. Electrochem. Soc., 1969, 116, 1076–1080 CrossRef CAS.
- J. Yang, Q. F. Shen, D. c. Zhai and Y. Gu, J. Appl. Electrochem., 2019, 49, 67–77 CrossRef.
- F. Xu, Q. Lu, L. Ye and S. C. E. Tsang, Chem. Commun., 2017, 53, 7653–7656 RSC.
- S. He, R. Xu, J. Wang, S. Han and B. Chen, J. Wuhan Univ. Technol., Mater. Sci. Ed., 2016, 31, 811–817 CrossRef CAS.
Footnote |
| † Electronic supplementary information (ESI) available. See DOI: 10.1039/c9ra08032e |
| This journal is © The Royal Society of Chemistry 2020 |