 Open Access Article
CdSe quantum dots labeled Staphylococcus aureus for research studies of THP-1 derived macrophage phagocytic behavior†
Tian-Yang Linab,
Zong-Juan Lianab,
Cai-Xia Yaoab,
Xiao-Yan Sunab,
Xin-Ying Liuab,
Zheng-Yu Yan*ab and
Sheng-Mei Wu *ab
*ab
aDepartment of Analytical Chemistry, China Pharmaceutical University, 24 Tongjia Lane, Gulou District, Nanjing 210009, China. E-mail: wushengmei80@163.com; yanzhengyujiang@126.com; Fax: +86-25-86185179; Tel: +86-25-83224365
bKey Laboratory of Drug Quality Control and Pharmacovigilance, Ministry of Education, 24 Tongjia Lane, Gulou District, Nanjing, 210009, China
First published on 2nd January 2020
Abstract
A simple biological strategy to couple intracellular irrelated biochemical reactions of staphylococcus aureus CMCC 26003 (S. aureus) with inorganic metal ions to synthesize cadmium selenide quantum dots (CdSe QDs) was demonstrated. Correspondingly, S. aureus as living matrices are internally generated and labeled with fluorescent QDs by the smart strategy. Several key factors in the process of biosynthesis were systematically evaluated. At the same time, ultraviolet-visible (UV-Vis), photo-luminescence (PL), inverted fluorescence microscopy and transmission electron microscopy (TEM) were utilized to study the characters of the as produced CdSe QDs. In addition, cytotoxicity and photostability of the QDs containing bacteria were also tested and evaluated as a whole. The results showed that intracellular CdSe nanocrystals had successfully formed in S. aureus living cells, which were less toxic, highly fluorescent and photostable. These fluorescent S. aureus bacteria were next applied as invading pathogens as well as fluorescent bioprobes for exploring the phagocytic behavior of THP-1-derived macrophage. Results proved that internal CdSe QDs labeling had no significantly adverse effects compared with the kind of infection reference, fluorescein isothiocyanate (FITC) stained S. aureus pathogen. Assuredly, the methods presented here provide researchers with a useful option to analyze the behavior of S. aureus as a type of infectious pathogen, which would also help understand the complex interplay between host cells and the invading bacteria on molecular level.
1. Introduction
As a new kind of nanomaterial, quantum dots (QDs) have caused considerable attention in recent years because of their stable photoluminescence, good biocompatibility and low toxicity.1–3 Furthermore, QDs play a key role in different fields such as bio-labeling, ion detection, virus detection, and bioimaging studies due to their distinct electrooptical properties.4–10Macrophages are involved in many physiological processes. They fulfill many diverse tasks, which range from phagocytic clearance of pathogens over maintaining tissue homeostasis to orchestrating immune responses by releasing a plethora of cytokines. Macrophages also play an important role in innate immunity by sensing the presence of invading pathogens as non-self and subsequently eradicating them through phagocytosis.11,12 This process involves ingestion and digestion by cells of solid substances such as alien cells, bacteria, bits of necrotic tissue and foreign particles more than 100 nm in diameter. Determination of macrophage functions, to some extent, could reflect the immune status, and can also be used to observe effects of certain drugs on immune function. Generally, fluorescent microspheres, fluorescent labeled-bacteria and apoptotic cells are often used as substrates for phagocytosis.13–15 The source and preparation of phagocytes are also important technical considerations. Some scholars chose rat and mouse peritoneal macrophages as cell models, but there is an inter-experimental biological variability and a limited survival period in culture. Since THP-1 cells are a well-characterized representative of human monocytic cell lines and frequently used in this type of experiments, they have some advantages over primary macrophages.16,17 Firstly, their homogeneous genetic background minimizes the degree of variability in the cell phenotype. Secondly, they provide a macrophage system that eliminates foreign bodies. Thirdly, they can be stored indefinitely in liquid nitrogen and be recovered easily to guarantee sufficient cells for further studies. Therefore, THP-1 cells appear to represent a simplified model to study macrophage phagocytosis.
Staphylococcus aureus CMCC 26003 (S. aureus) is a Gram-positive bacterium which is frequently used as a model organism in biological studies. Infections caused by S. aureus are a major cause of morbidity and mortality. In order to acquire more understanding of the complicated physiological interactions between host and pathogen, modern techniques with fluorescence-based techniques such as fluorescence microscopy and flow cytometry are suitable choices. Although both green fluorescent protein (GFP) and fluorescein isothiocyanate (FITC) labeling have been reported useful approaches to the study, they either require a tedious and time-consuming sampling process or have poor fluorescent stability.18,19 Moreover, GFP does not work in many strains, especially in anaerobes, and FITC is on the other hand sensitive to the change of environmental pH too. Therefore, it is desirable to develop a simple, fast labeling strategy to obtain fluorescent bacterial probes with uniform fluorescence intensity, outstanding photo stability, and high luminance. Much progress has been made in QDs as fluorescent labels for biological samples. QDs have advantages over traditional organic dyes due to their broad absorption spectra, narrow emission spectra, and resistance to photo bleaching. Studying bacterial process by labeling bacteria with QDs has been reported.20,21 However, these procedures usually need antibody as a bridge to attach QDs to bacterial surface or to pre treat bacteria by electrical shock to change cell wall permeability, helping QDs across into the bacteria. Hence, a labeling strategy which does not dependent on antibodies or on the expression of fluorescence markers would be a very helpful tool to research S. aureus's biological behaviors.
In recent years, biosynthesis of QDs has attracted a lot of attention because the technique presents a green, mild, and highly repeatable way to synthesize biocompatible QDs. Biosynthesis, namely, living biological systems take advantage of their molecular recognition and self-assembly ability, through a designed biological strategy to combine intracellular irrelated biochemical reactions to realize synthesis of nanomaterials. Over the past decades, many biological organisms such as yeast, fungi, bacteria have been explored as potential bio-factories to manufacture metallic nanoparticles including CdS, CdSe, CdTe, etc.22–24 Based on the review of biosynthesis, we aimed to elucidate whether S. aureus can be labeled with CdSe QDs when co-cultured with inorganic metallic materials in order to develop a method which allows the analysis of the behavior of S. aureus-interlinked macrophage phagocytosis.
In this work, an approach had been investigated using S. aureus to biosynthesize CdSe QDs based on our previous similar work, which allows one-step preparation of CdSe QDs from inorganic Cd and Se precursors.25 Then S. aureus internally labeled with fluorescent CdSe QDs were used as substrates to detect THP-1-derived macrophages phagocytic behaviors by flow cytometry.
2. Experimental section
2.1 Materials and instruments
Luria–Bertani (LB) broth's constitutes (NaCl 10 g, yeast extract 5 g, tryptone 10 g, per 1000 mL, pH 7.4) and 3-(4,5-dimethylthiazol-2-yl)-2,5-diphenyltetrazolium bromide (MTT) were obtained from Solarbio (Beijing, China). S. aureus CMCC 26003 was provided by Chinese Center for Type Culture Collections of Wuhan University (HuBei, China).Fluorescence microscopic images were captured by image-forming system (Olympus IX71, 100× objective) mounted on an inverted fluorescence microscope. Transmission electron microscope images were acquired by dropping cells solution on copper grids and dry, followed by detecting on an electron Hitachi H-7650 microscope (Tokyo, Japan) using an alternating voltage of 80 kV. Ultraviolet-Visible spectra were recorded by a spectrophotometer from Shanghai Fine Born Technology instrument Co. (Shanghai, China).
2.2 Biosynthesis of CdSe QDs and procedure optimization
In the work, S. aureus were firstly cultured and recovered with LB broth in conical flasks (250 mL) which contained 100 mL medium. Then they were inoculated by the ratio of 1% (v/v) in fresh LB broth at 37 °C and shook on a rotary shaker (200 rpm) to harvest cells at different growth stages. Then they were co-incubated with different concentrations of Na2SeO3 (final concentration: 0, 0.5, 1 and 1.5 mM) for 0, 1, 2, 3 and 4 h at 37 °C respectively, followed by centrifuging and transporting into fresh LB culture and then mixed with different concentrations of CdCl2 (final concentration: 0, 0.5, 1 and 1.5 mM) respectively. The mixtures were finally cultivated and shook at 37 °C in dark for 6–48 h to obtain CdSe QDs containing fluorescent bacteria respectively. Meanwhile, S. aureus cultured in the same media without adding any inorganic materials were used as control groups. The fluorescent S. aureus cells treated with different synthetic factors (including different selenium feeding points, selenization culture durations, co-incubation durations, concentration ratios of selenium source to cadmium source and medium replacement) were harvested by centrifuging at 8000 rpm for 5 min, then washed and resuspended three times with phosphate buffered saline (PBS, pH 7.4) to remove residual medium. The supernatant was finally collected for the measurement of photoluminescence (PL) spectra (Shimadzu RF-5301PC spectro fluorophotometer, Japan).2.3 MTT assay
In order to assess cytotoxicity of biosynthesized CdSe QDs, a series of CdSe purification were carried out as follows: cells firstly were crushed with glass beads (425–600 μm, Sigma, USA) for 20 min on a vortex, followed by ultrasonic treatment for 30 min with a sonicator (KH-50B, He Chuang Tech, Kun Shan, China). Repeated the above steps three times. The suspension was then centrifuged at 14![[thin space (1/6-em)]](https://www.rsc.org/images/entities/char_2009.gif) 000 rpm for 10 min and then filtered by a polycarbonate membrane with a pore size of 200 nm to remove bacterial fragments and insoluble denatured proteins. QDs' concentration was calculated according to the reported method.26
000 rpm for 10 min and then filtered by a polycarbonate membrane with a pore size of 200 nm to remove bacterial fragments and insoluble denatured proteins. QDs' concentration was calculated according to the reported method.26
For the toxicity evaluation, human acute monocytic leukemia cell line (THP-1 cells obtained from the Chinese Academy of Sciences Institute of Cell Research) was chosen as a cell model. THP-1 cells were seeded in 96-well plates at a density of 1 × 10⁶ cells per well in Roswell Park Memorial Institute (RPMI) 1640 medium (Hyclone) with 10% (v/v) fetal bovine serum (FBS, Hyclone) in a humidified atmosphere containing 5% CO2 at 37 °C. Then they were cultivated and differentiated into macrophages in RPMI 1640 medium by the addition of 50 ng mL−1 Phorbol-12-myristate-13-acetate (PMA) for 48 h. Then the cells were incubated with increasing concentrations of biosynthesized CdSe QDs (0, 0.1, 0.2, 0.5, 1 and 2 μM respectively) for 48 h. Cell morphological changes induced by different concentrations of QDs were observed by microscope to determine the degree of deformation morphology. At the same time, cell viability after QDs exposure was determined using a MTT assay according to the published protocol.27 Hydrothermally synthesized CdSe QDs were chosen as a control.
2.4 Fluorescence labeling of bacteria and fluorescence properties investigation
FITC was widely applied in bacteria, fungi and zymosan particles labeling.28 In the study, S. aureus were stained with FITC and stored for further usage as reported protocol.29 CdSe QDs-labeled S. aureus were prepared as previously described. Adjusting the above two kinds of fluorescent bacterial suspension to the same OD600 (OD600 = 0.3) by PBS (pH 7.4), then investigated their fluorescence intensities by an inverted fluorescence microscope for certain time intervals (0, 30, 60 and 120 s) under continual ultraviolet excitation.2.5 Macrophages infection by fluorescence bacteria
Fluorescent bacteria were washed by centrifugation and resuspended in RPMI 1640 medium (Hyclone) for three times and then diluted to the concentration of ca. 108 CFU mL−1. For phagocytosis tests, the differentiated THP-1 cells (prepared as above mentioned, 1 × 10⁶ cells per well) were firstly seeded in 24-well plates and infected with pretreated fluorescent S. aureus at a multiplicity of infection ratios of 10![[thin space (1/6-em)]](https://www.rsc.org/images/entities/char_2009.gif) :
:![[thin space (1/6-em)]](https://www.rsc.org/images/entities/char_2009.gif) 1, 25
1, 25![[thin space (1/6-em)]](https://www.rsc.org/images/entities/char_2009.gif) :
:![[thin space (1/6-em)]](https://www.rsc.org/images/entities/char_2009.gif) 1, 50
1, 50![[thin space (1/6-em)]](https://www.rsc.org/images/entities/char_2009.gif) :
:![[thin space (1/6-em)]](https://www.rsc.org/images/entities/char_2009.gif) 1, 100
1, 100![[thin space (1/6-em)]](https://www.rsc.org/images/entities/char_2009.gif) :
:![[thin space (1/6-em)]](https://www.rsc.org/images/entities/char_2009.gif) 1 for 1 h respectively. In addition, the THP-1 macrophages (25
1 for 1 h respectively. In addition, the THP-1 macrophages (25![[thin space (1/6-em)]](https://www.rsc.org/images/entities/char_2009.gif) :
:![[thin space (1/6-em)]](https://www.rsc.org/images/entities/char_2009.gif) 1) were particularly observed at selected intervals (0.5, 1, 2, 3 and 4 h) after infection. After co-cultured at 37 °C in a 5% CO2 atmosphere, the cells were washed three times with PBS followed by low-speed centrifugation (800 rpm, 5 min) to remove the extracellular bacteria and harvested targeted cells by mild trypsinization and scraping, then collected cell suspensions and adjusted concentrations to the appropriate density and immediately subjected to flow cytometry. The negative control was THP-1 cells without infection.
1) were particularly observed at selected intervals (0.5, 1, 2, 3 and 4 h) after infection. After co-cultured at 37 °C in a 5% CO2 atmosphere, the cells were washed three times with PBS followed by low-speed centrifugation (800 rpm, 5 min) to remove the extracellular bacteria and harvested targeted cells by mild trypsinization and scraping, then collected cell suspensions and adjusted concentrations to the appropriate density and immediately subjected to flow cytometry. The negative control was THP-1 cells without infection.
2.6 Flow cytometry method to quantify phagocytosis
Quantification of THP-1 cells' phagocytosis ratio to FITC-labeled S. aureus and CdSe QDs-labeled S. aureus was performed with a flow cytometer (MACS Quant Analyzer 10, Germany Miltenyi Biotec). FITC fluorescence was measured at 530 nm and forward angle light scatter at 488 nm. CdSe QDs fluorescence was measured at 510 nm and forward angle light scatter at 405 nm. Forward and side scatter were used to identify viable THP-1 macrophages' population. Then cells engulfing fluorescent S. aureus were counted and all parameters were collected in log mode histogram. The data were next analyzed using FlowJo software. A total of 10![[thin space (1/6-em)]](https://www.rsc.org/images/entities/char_2009.gif) 000 events were collected for each sample. The percentage of fluorescence positive cells was finally counted as the percentage of macrophages engulfing fluorescent S. aureus.
000 events were collected for each sample. The percentage of fluorescence positive cells was finally counted as the percentage of macrophages engulfing fluorescent S. aureus.
3. Results and discussion
3.1 Characterization of biosynthesized CdSe QDs
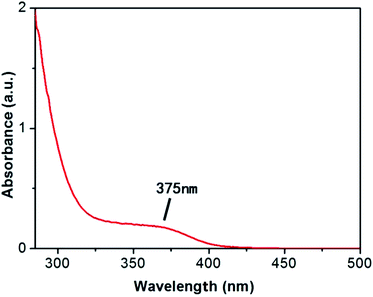
In order to test the successful synthesis of QDs in bacteria, fluorescence spectra and UV-Vis absorption spectra of isolated S. aureus cells which had finished biosynthesis were measured. The interference of background fluorescence of the culture medium was removed by repeated centrifugal washing operations. Meanwhile, bacteria cultured without selenium and cadmium or with merely selenium source were both used as blank controls. When excited at 345 nm, the bacteria containing biosynthesized QDs possessed fluorescence emission peak wavelength at approximately 510 nm (Fig. 1), which was in good agreement with nanoparticles' maximal emission wavelengths which were synthesized by chemical methods.30 When the solutions of fluorescent bacterial suspension were illuminated with a 365 nm lamp, an intense orange luminescence was presented (inset of Fig. 1, right side) which was quite different from the blue self-fluorescence of control bacteria (inset of Fig. 1, left side). UV-Vis spectrum of the isolated CdSe (Fig. 2) indicated that quantum confinement peak wavelength of the as produced CdSe was about 370 nm. Both of the results proved that the QDs were successfully synthesized and probably located inside bacteria before crushing processing.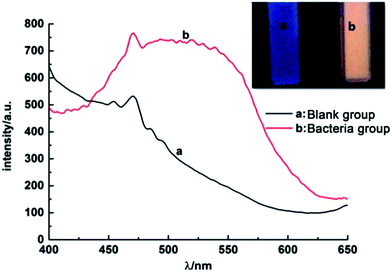 | ||
| Fig. 1 Photoluminescence spectra of S. aureus cells, (a) blank control and (b) QDs-labeled cells. Inset: corresponding photographs of S. aureus cells under UV light excited by 345 nm. | ||
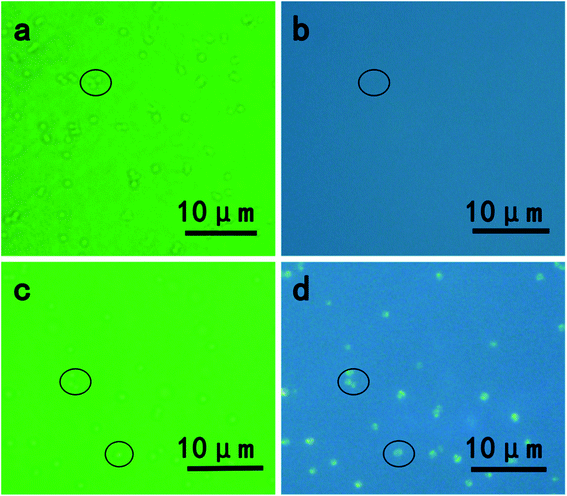
The presence of CdSe QDs nanoparticles in vivo was also confirmed by an inverted fluorescence microscope. As shown in Fig. 3, without exposing to Cd and Se precursors, blank S. aureus cells were only observed in the bright field (Fig. 3a) and no fluorescence emission was obtained under UV light excitation (Fig. 3b), whereas S. aureus cells incubated with Cd and Se precursors showed bright orange fluorescence (Fig. 3d) under UV excitation.
TEM as a powerful tool for observing fine structure of crystals was used to analyze CdSe QDs' cellular location as well (Fig. 4). As shown in Fig. 4b, some black spots could be observed within cells compared with the blank S. aureus without any treatment (Fig. 4a), which verified the presence of CdSe nanoparticles in vivo. However, QDs were not evenly dispersed throughout the cells and most of them contained only one or two clusters in cell cytoplasm, which has similarity in cluster formation of CdSe QDs biosynthesized by E. coli but difference in location in cells. CdSe QDs foci were evenly spread in E. coli cells and located near the two ends of them if only two foci were formed.31 Since CdSe QDs formed into crystal clusters, the foci had higher density than bacteria by TEM technique, which presented as black spots in images. Moreover, since most of the cellular activities were exploited and centred to detoxify metal ions, the matrices used for biosynthesis had a thinner extracellular capsule which are plenty of polysaccharide compared to blank controls. In order to further characterize the nanoparticle, biosynthesized CdSe QDs were carefully purified from fluorescent S. aureus cells by repeatedly washing, crushing and removal of cell fragments. Dispersive small nanoparticles instead of crystal clusters were detected after purification (Fig. 4c), revealing a spherical particle shape and uniform sizes, whose particle sizes ranged from ca. 10 nm to ca. 16 nm (Fig. S1a†). The particle size distribution was bigger than the counterpart QDs synthesized by hydrothermal method (ca. 2.5 to ca. 4.0 nm) due to the envelop of protein outside biosynthesized QDs' core.25
 | ||
| Fig. 4 TEM images of (a) blank S. aureus, (b) fluorescent S. aureus cells and (c) purified CdSe QDs. The scale bars were 1 μm, 1 μm and 20 nm respectively. | ||
3.2 Optimal biosynthesis conditions for CdSe QDs
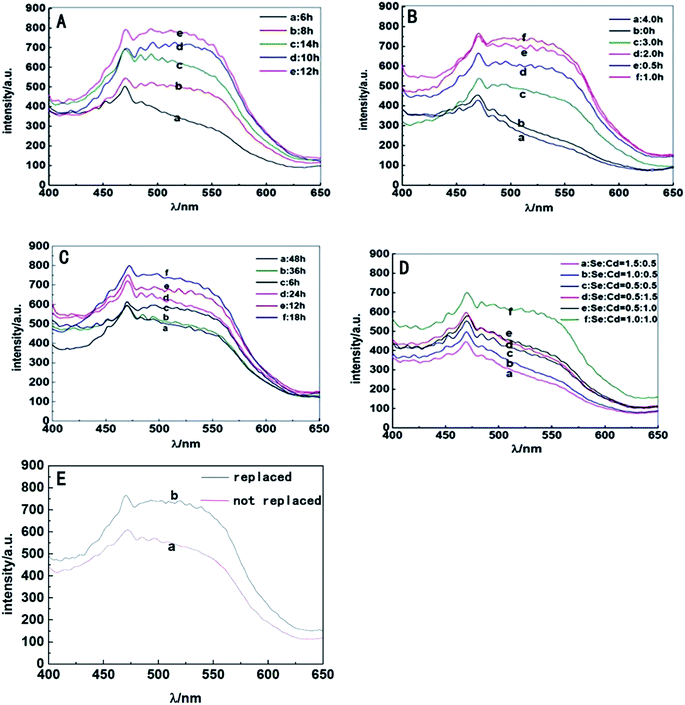
S. aureus were selected as the biosynthetic matrix, by co-culturing with Cd and Se precursors to biosynthesize CdSe QDs intracellularly. The abilities of microorganism to synthesize QDs were related to many factors such as the type of species, growth status of the biological matrix, the working concentrations and co-existing durations of metal ions, etc. Hence, several decisive parameters were chose in biosynthesis as optimized objects, including growth stage of the bacteria, co-incubating duration of selenium and cadmium sources, working concentrations of raw materials and ratios of selenium to cadmium, replacement of the culture medium, the sequence of raw material in-put (Fig. 5). First of all, growth curve of S. aureus was plotted (Fig. S2†), which was divided into three stages: lag phase (0–2 h), log phase (3–10 h), and stationary phase (11–16 h). Since late log phase and stationary phase bacteria were physiologically mature to some extent and might have better metal resistance and biological activities, they were chosen as the candidate matrices to study CdSe nanoparticle biosynthesis.32 As shown in Fig. 6A, fluorescence intensity of the S. aureus increased with the relevant growth stage of the biological matrices from lag to stationary ones and reached maximum fluorescence emission when 12 h grown bacteria were used. It was probably related to the physiological metabolism status of S. aureus. At the time point, S. aureus become physiological mature and full of biochemistry vitality which should benefit to synthesis related reductase and oxidase's efficiency. These enzymes took their parts in reduction–oxidation reactions of inorganic materials to a biologically less toxic form, such as from seleniun to elementary Se substance or organic GS-Se-SG etc.33,34 And more importance was that, GS-Se-SG was the very precursor used to synthesize CdSe QDs when Cd2+ was right there at the very time point.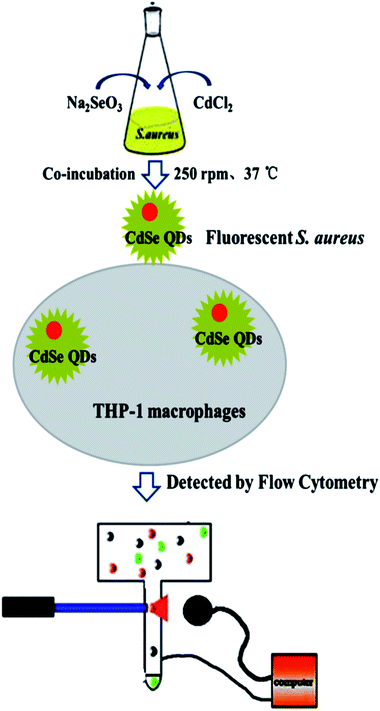 | ||
| Fig. 5 Schematic illustration of CdSe QDs labeling S. aureus and THP-1 macrophage phagocytosis detection. | ||
Hence, the biosynthesis of QDs demanded feeding CdCl2 at a becoming moment when cells were suitably precultured with Na2SeO3 to generate Se precursor. Herein, the time duration of Na2SeO3 exposure was significant and researched next to obtain the time point required for selenium transformation by bacteria matrices. As shown in Fig. 6B, maximum fluorescence intensity of the cells was acquired after they were seleniumized for 1 h. During the time point, high-valence selenium could be transferred effectively into the reactive organic selenium, such as Cys-Se, Se-Met and GS-Se-SG, which lead to a strong manufacturing capability of Se-based QDs' production by biosynthesis.35 The fluorescence intensity was lower when the matrices were seleniumized for less than 1 h. Apparently, at the moment the intracellular selenium reduction ability of S. aureus cells had not reached their maximum degree. It was also showed that when the seleniumization time duration was longer than 2 h, only weak fluorescence intensity of the cells could be observed. This probably owed to the less and less organic selenium precursor which was probably transported to vacuole and gradually destroyed or transformed into elementary Se. Therefore, 1 h seleniumization was chose when inorganic selenium was highly transformed into organic selenium and could hold to react exactly with the coming intracellular Cd2+ to create optimal CdSe QDs.
After 1 h seleniumization, the pretreated matrices were followed exposing to a certain concentration of CdCl2 for suitable time duration to couple organic Se and Cd to generate QDs in vivo. The results (Fig. 6C) indicated that S. aureus cells surprisingly began to emit fluorescence after co-incubation with CdCl2 for merely 6 h and possessed the strongest fluorescence emission when exposed to CdCl2 for 18 h. However, when the incubation time was prolonged to more than 18 h, the fluorescence intensities of cells began to decrease sharply. Lacking nutrients, slowly poisoning of metal ions, excessively accumulating harmful metabolites and releasing hydrolase to attack other cells, bacteria became aging and self-decomposition, which would kill most of the cells and ultimately affect the stability of biosynthesized QDs, somehow resulting in fluorescence quenching of QDs. Hence, 18 h co incubation of inorganic cadmium was selected.
Another aim of procedure optimizing was to detect the working concentrations of both Se and Cd metal ions. The study proved that S. aureus cells had the strongest ability to biosynthesize QDs when 1 mM selenium and 1 mM cadmium were added sequentially (Fig. 6D). By exposing to the two kinds of metal ions, S. aureus had the capability of absorbing and transforming Se and Cd and their compounds, followed by time and space coupling them to manufacture the target CdSe QDs. When the concentration of selenium or cadmium was at a low level, the synthesis ability of cells was not saturated, leading to a low yield of CdSe QDs. However, when the ambient concentration of Na2SeO3 or CdCl2 added up to a certain extent, especially the later one, these ions greatly contributed to superoxide anion oxidative damages which inhibited microbial cell growth, metabolic reaction effects and ultimately biological QDs' synthesis.36,37
The ability of S. aureus to synthesize QDs was investigated by changing the culture medium as well. The outcomes (Fig. 6E) indicated that culture medium change was beneficial to the intensity enhancement of the corresponding bacterial fluorescence emission. The extrapolation and replacement of the culture medium had an advantage in reducing environmental pressure of bacteria especially exposure to toxic agents, maintaining activities of bacteria matrices, and then promoting the detoxification effects of S. aureus on exogenous heavy metal cadmium source and the subsequent synthesis of QDs.
Moreover, the storage conditions were investigated finally. The results (Fig. S3†) showed that fluorescent S. aureus suspension were not sensitive to temperature and the fluorescence intensities were well kept when buffer solution was at pH 7–9 over a period of time. Taking into account physiological activities of S. aureus, the conditions of 4 °C and 0.1 M PBS (pH = 7.4) were recommended for long-term storage.
3.3 Cytotoxicity of biosynthesized QDs
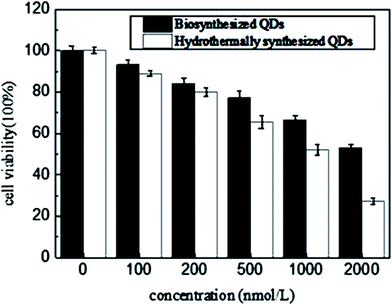
A MTT assay was carried out to test nanotoxicity of the biosynthesized CdSe QDs using hydrothermally synthesized CdSe QDs as controls. The aqueous solution of CdSe QDs was firstly hydrothermally synthesized by adding the newly prepared oxygen-free 0.05 M NaHSe solution and 250 mL H2O to the saturated 1.97 g (4.70 mM) Cd(ClO4)2·6H2O solution of pH 11.2 and using 11.54 mM 2-mercaptoethanol as stabilizer.25 The MTT results (Fig. 7) showed that hydrothermally synthesized QDs (concentrations ≥ 5 × 10⁻⁴ mM) had significant toxic effects on THP-1-derived macrophage cells (cell viability ≤ 60%), while the biosynthesized QDs maintained a two times cell viability than hydrothermally synthesized QDs at a concentration of more than four times higher than hydrothermally synthesized ones (concentrations ≥ 2 × 10⁻³ mM). Cytotoxicity tests proved that biosynthesized QDs had high cytocompatibility, which probably resulted from cell originated biomaterials' capping on the particle surface during biosynthesis. The capping materials were all self produced and most importance was that cells managed to do it in a way supposing to greatly lower down metal toxicity. In other word, the as produced biomaterial enveloping nanoparticles were excellently biocompatible compared with the chemically synthesized QDs. It also suggested a significant potential of the biosynthesized QDs for utilization in vivo living cell imaging, which might not disturb cell's other biological activities, such as phagocytosis.3.4 Bacterial fluorescence labeling and performance investigation
After synthesis optimization, QDs were efficiently manufactured by bacterial cells and kept just right in vivo, by which cells were able to be illuminated when excited by a suitable light source. However, whether the biosynthesis process changed bacteria surface biochemistry properties such as being engulfed by cells' phagocytosis or not concerned us. Hence, two kinds of S. aureus labeled by two different fluorescent dyes, QDs and FITC were systematically compared when they were exposed to differentiated THP-1 cells to research the phagocytic immune responses.THP-1 cell is single, round suspension cells with distinct monocytic markers. After exposure to certain agents such as PMA or 1a, 25-dihydroxyvitamin, nearly all the THP-1 cells start to adhere to culture plates, differentiating into a macrophage phenotype with marked morphological changes.38,39 Since PMA treatment leaded to a more mature phenotype with higher levels of adherence and a higher rate of phagocytosis, PMA was used and the inducing conditions were optimized for further macrophage function study. Researches proved that cells treated with PMA (50 ng mL−1) for 48 h owned mature macrophage features and good cell viability and the conditions were chose to differentiate THP-1 cell (Fig. S4d†).
Before phagocytosis experiments, the fluorescence photo stability were also detected by exposing two different fluorescing cells to a continual ultraviolet light excitation for 2 minutes. Results showed that there was not apparent decrease of fluorescence intensity in CdSe QDs-labeled S. aureus cells during the 120 s exposure (Fig. 8a), while the fluorescence of FITC-labeled S. aureus were almost quenched by the end of 60 s exposure (Fig. 8b), indicating the CdSe QDs-labeled S. aureus possessing excellent photo stability for long term light exposure. Macrophage as a kind of phagocytic cells takes the first line of defense against invading bacterial pathogens. Once encountered, macrophages recognize bacteria via their microbe-associated molecular patterns (MAMPs) by surface exposure, vesicular, or cytoplasmic pattern recognition receptors (PRRs). Upon phagocytosis, epithelia-associated macrophages carry engulfed bacteria to deeper tissues and further to draining lymph nodes. Finally, antigens are presented to T cells by professional antigen-presenting cells (APCs), such as DCs and MUs (as well as B cells), to initiate specific cellular immunity and generate specific T cells.40 In a word, phagocytosis of macrophages is a process which is considerately complex and the researches of macrophage phagocytic behaviors undoubtedly demand fluorescence indicators that are stable to maintain minutes or even dozens of hours.41,42
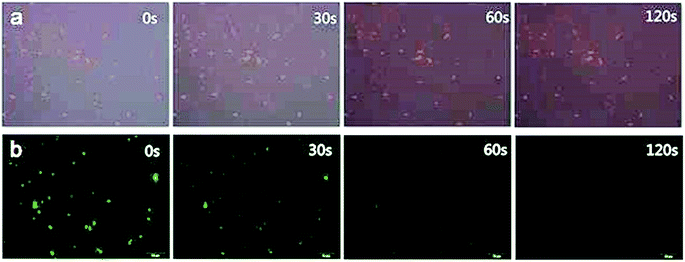 | ||
| Fig. 8 Fluorescence microscopy images of fluorescent S. aureus in different exposure time lengths ((a) CdSe QDs-labeled S. aureus, (b) FITC-labeled S. aureus). | ||
3.5 Flow cytometry quantification of phagocytosis
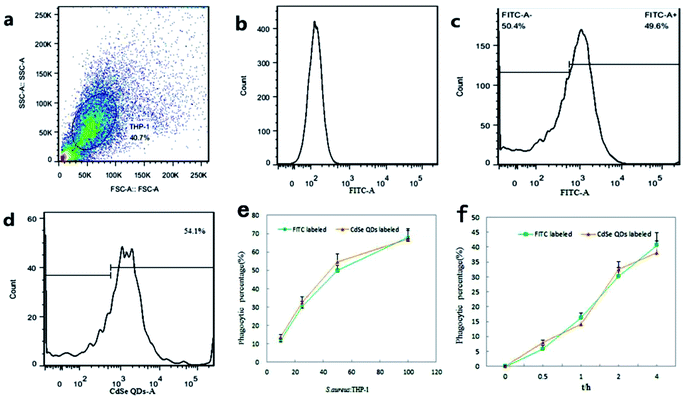
Flow cytometry was used, in order to accurately quantify the percentage of macrophage phagocytosis. The technique greatly increases the numbers of processing organisms, the numbers of observable macrophages per sample, and the degrees of statistical confidence as a result of the large number of observations that are detected and analyzed. Additionally, operators' subjectivity is avoided by establishing objective, consistent criteria in the determination of particulate phagocytosis.THP-1 macrophage populations were observed by scatter plots and histograms plots determined by flow cytometer (Fig. 9a and b). When infected by FITC-labeled S. aureus (Fig. 9c) or CdSe QDs-labeled S. aureus (Fig. 9d), positive fluorescence signals of macrophages were observed and the signals were presented inside the infected living macrophages. The percentage of macrophage phagocytic rate was then calculated as the numbers of fluorescence positive macrophage (FITC or CdSe QDs in vivo) in an infection assay versus the uninfected macrophage controls.
Firstly, phagocytic immune responses to QDs-labeled S. aureus were researched with FITC-labeled S. aureus as a reference. With concentration of infection bacteria increasing, phagocytic rates rapidly increased at the beginning. When the infection ratios exceeded 50![[thin space (1/6-em)]](https://www.rsc.org/images/entities/char_2009.gif) :
:![[thin space (1/6-em)]](https://www.rsc.org/images/entities/char_2009.gif) 1, the phagocytic rates referring to the total infection concentration turned to slow down (Fig. 9e). Moreover, high concentrations of bacteria infection lead to portion of cells apoptosis and ultimately lose their ability of phagocytosis. As shown in Fig. 9f, the phagocytic rates increased rapidly within 0–2 h, and then became much slow in the next 2–4 h. The phenomenon indicated that phagocytic capacity of macrophages gradually saturated and began to digest and get rid of intracellular S. aureus during the period. Both of the two kinds of fluorescence S. aureus exhibited similar trends in dose and time dependent phagocytic rates, which had not significant difference in number count analysis. It proved that surface properties of the CdSe QDs-labeled S. aureus, including recognition, transportation, endocytosis and so on were not affected by the operation of QDs' biosynthesis.
1, the phagocytic rates referring to the total infection concentration turned to slow down (Fig. 9e). Moreover, high concentrations of bacteria infection lead to portion of cells apoptosis and ultimately lose their ability of phagocytosis. As shown in Fig. 9f, the phagocytic rates increased rapidly within 0–2 h, and then became much slow in the next 2–4 h. The phenomenon indicated that phagocytic capacity of macrophages gradually saturated and began to digest and get rid of intracellular S. aureus during the period. Both of the two kinds of fluorescence S. aureus exhibited similar trends in dose and time dependent phagocytic rates, which had not significant difference in number count analysis. It proved that surface properties of the CdSe QDs-labeled S. aureus, including recognition, transportation, endocytosis and so on were not affected by the operation of QDs' biosynthesis.
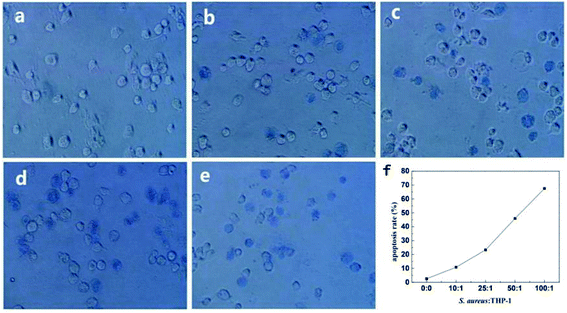
The viability and mortality of macrophages were followed investigating. Trypan blue colouring agent is often used to detect the integrity of cell membrane. As shown in Fig. 10, healthy living cells could reject trypan blue and the cells were colorless. On the other hand, since dead cells had increased membrane permeability, trypan blue could easily enter the cells and dye them, and the cells turned blue. The quantitative analysis of macrophage survival rate was realized by counting blue cells under microscope equipped with bright light. In order to reduce the effect of cell's fast adherent to dish wall or glass slide which would disturb observation under bright light illumination, in situ trypan blue exclusion test was used to determine survival rate of the cells. As shown in Fig. 10f, cell mortality of the bacteria infected macrophages was significantly higher than the control groups. Cell death rate was gradually higher as the ratios of cell to S. aureus decreased. The apoptosis rate reached as high as 67% when the ratio was 1![[thin space (1/6-em)]](https://www.rsc.org/images/entities/char_2009.gif) :
:![[thin space (1/6-em)]](https://www.rsc.org/images/entities/char_2009.gif) 100. It was suggested that the infected host macrophage went on apoptosis to kill or limit the growth of pathogenic bacteria in vivo by which a defensive response was started.43 As a whole, QDs labeling S. aureus had the abilities to trigger macrophages' phagocytosis and their following defensive apoptosis.
100. It was suggested that the infected host macrophage went on apoptosis to kill or limit the growth of pathogenic bacteria in vivo by which a defensive response was started.43 As a whole, QDs labeling S. aureus had the abilities to trigger macrophages' phagocytosis and their following defensive apoptosis.
QDs as a new kind of inorganic fluorescent materials, their applications in biolabeling and biosensing have attracted growing attention. There are various methods employed for the synthesis of QDs.44,45 However, biological methods of synthesis have aroused great concern, as they are rapid, cost effective, and eco-friendly. Scholars have reviewed the microorganism used for the synthesis of nanomaterials.46,47 S. aureus is a Gram-positive bacterium that is frequently used as a model organism in biological studies and can be easily cultured under aerobic or anaerobic conditions at 37 °C. Compared with Gram-negative bacterium, it owns thicker cell wall on which different groups with positive and negative charges are dispersive, while in the aqueous solution the bacteria usually negatively charged, which benefits to attract more metal ions when co-cultured with positive charged metal particles. So it could be an ideal biofactory to microbially fabricate CdSe QDs. In the work, an approach using S. aureus cells to biosynthesize CdSe QDs which allowed one-step preparation of CdSe QDs from Cd and Se precursors was investigated. S. aureus, that were grown to stationary phase (12 h) and then treated with 1 mM Na2SeO3 for 1 h, followed by co-culture with 1 mM cadmium fresh medium for 18 h, could efficiently manufacture QDs in vivo and did not affect their biological activities.
Currently, a variety of microbial synthesis method of QDs have been reported. However, details of how nanomaterials assemble in the microorganism are less explained. For yeast cells, Pang et al. had proposed a reasonable explanation.48 By temporally and spatially collaborative coupling intracellular glutathione reductase-involved selenium (IV) reduction reactions with intracellular Cd (II) detoxification, cadmium precursors react with low-valence organoselenium resulting from selenium (IV) reductions to yield fluorescent CdSe QDs in living yeast cells. However, from bacteria (S. aureus) to fungus (yeast), specific biosynthetic mechanisms may be different. Hence further researches are still demanded to clarify them.
Recent years, extensive nanotoxicological investigations were necessary to determine their biocompatibility and cytotoxicity before QDs can be safely used as biomaterials.49,50 Metal release, surface functional groups and size effects have been commonly cited as factors to indicate nanoparticles' biological cytotoxicity.51–53 Herein, biosynthesized QDs coated with self produced materials greatly reduce nanotoxicity and are considered a good approach to overcome these shortcomings. It is owing to that biosynthesized nanomaterials are naturally capped with secreted proteins during synthesis process. The previous MTT results in the work fit well to this frame of theory.
4. Conclusions
In summary, CdSe QDs were successfully synthesized in living Gram-positive S. aureus CMCC 26003 to fluorescence labeling cells, and the experimental conditions were optimized to obtain fluorescent bacteria with excellent photoluminescence. UV, PL, TEM and inverted fluorescence microscope were used to study the optimal and particle properties of CdSe QDs. In addition, the cytotoxicity and fluorescent photo stability of the isolated CdSe QDs were evaluated as well. Moreover, the CdSe QDs labeled S. aureus were assessed as fluorescent bacterial probes for exploring the phagocytic behaviors of THP-1-derived macrophages. The results showed that intracellular biosynthesis of CdSe QDs by living S. aureus was a simple, viable labeling strategy to obtain fluorescent bacterial probe with uniform fluorescence intensity, outstanding photo stability, high luminance and good biocompatibility. More importantly, these bacterial surface's properties were unaltered regarding to cell surface recognition and phagocytosis by macrophages. Therefore, biosynthesis of CdSe QDs by living S. aureus as a smart fluorescent probe promises to be a versatile tool for tracing, imaging, detection of S. aureus based biological researches and the synthetic protocol is expected to be applicable to other microorganism and nanomaterials.Conflicts of interest
There are no conflicts to declare.Acknowledgements
We would like to thank Dr Guo for providing THP-1 cell line and advice for cell culture. Moreover, this work was supported by National Natural Science Foundation of China Youth Fund with Grant No. 21601206.References
- P. G. Luo, S. Sahu, S. T. Yang, S. K. Sonkar, J. P. Wang, H. F. Wang, G. E. LeCroy, L. Cao and Y. P. Sun, J. Mater. Chem. B, 2013, 1, 2116 RSC.
- S. N. Baker, Angew. Chem., Int. Ed., 2010, 49, 6726 CrossRef CAS PubMed.
- H. T. Li, Z. H. Kang, Y. Liu and S. T. Lee, J. Mater. Chem., 2012, 46, 24230 RSC.
- X. Gao, L. Yang and J. A. Petros, Curr. Opin. Neurobiol., 2009, 18, 63 Search PubMed.
- P. P. Ingole, R. M. Abhyankar and B. L. V. Prasad, Mater. Sci. Eng., B, 2010, 168, 60 CrossRef CAS.
- J. Kye-II, L. Y. ning and L. C. Lin, ACS Nano, 2008, 2, 1553 CrossRef PubMed.
- A. M. Smith, H. Duan and A. M. Mohs, Adv. Drug Delivery Rev., 2005, 16, 63 Search PubMed.
- H. Mattoussi, G. Palui and H. B. Na, Adv. Drug Delivery Rev., 2012, 64, 138 CrossRef CAS PubMed.
- M. Bruchez, M. Moronne, P. Gin and S. Weiss, Science, 2013, 281, 1998 Search PubMed.
- W. C. Chan and S. Nie, Science, 2016, 281, 1998 Search PubMed.
- S. Akira, T. Misawa, T. Satoh and T. Saitoh, Diabetes Obes. Metab., 2013, 15, 10 CrossRef CAS PubMed.
- S. D. Ricardo, G. H. Van and A. A. Eddy, J. Clin. Invest., 2008, 118, 3522 CrossRef CAS PubMed.
- Y. Q. Ge, A. K. Liu, J. Dong, G. Y. Duan, X. Q. Cao and F. Y. Li, Sens. Actuators, B, 2017, 247, 46 CrossRef CAS.
- R. Bukasov, O. Filchakova, K. Gudun and M. Bouhrara, J. Fluoresc., 2018, 28, 1 CrossRef CAS PubMed.
- L. A. Dempsey, Nat. Immunol., 2018, 19, 1 Search PubMed.
- Y. Wang and W. Wu, Drug Delivery, 2006, 13, 189 CrossRef CAS PubMed.
- Z. Qin, Atherosclerosis, 2012, 221, 2 CrossRef CAS PubMed.
- T. W. Chen, T. J. Wardill, Y. Sun, S. R. Pulver, S. L. Renninger, A. Baohan, E. R. Schreiter, R. A. Kerr, M. B. Orger, V. Jayaraman, L. L. Looger, K. Svoboda and D. S. Kim, Nature, 2013, 499, 295 CrossRef CAS PubMed.
- H. Zeng, D. Zhang, X. Zhai, S. Wang and Q. Liu, Anal. Bioanal. Chem., 2018, 410, 71 CrossRef CAS PubMed.
- M. Zhong, L. Yang, H. Yang, C. Cheng, W. F. Deng, Y. M. Tan, Q. I. Xie and S. Z. Yao, Biosens. Bioelectron., 2019, 126, 493 CrossRef CAS PubMed.
- L. Yang, W. Deng, C. Cheng, Y. Tan, Q. Xie and S. Yao, ACS Appl. Mater. Interfaces, 2018, 10, 3441 CrossRef CAS PubMed.
- Z. M. Alvand, H. R. Rajabi, A. Mirzaei, A. Masoumiasl and H. Sadatfaraji, Mater. Sci. Eng., C, 2019, 98, 535 CrossRef PubMed.
- A. Syed and A. Ahmad, Spectrochim. Acta, Part A, 2013, 106, 41 CrossRef CAS PubMed.
- Z. Q. Yang, Y. Wang and D. Zhang, Sens. Actuators, B, 2018, 261, 515 CrossRef CAS.
- A. L. Rogach, A. Kornowski, M. Gao, A. Eychmüller and H. Weller, J. Phys. Chem. B, 1999, 103, 3065 CrossRef CAS.
- L. T. Dai, D. P. Gia, P. N. Xuan, H. V. Dinh, T. N. Ngoc, H. T. Vinh, T. T. M. Thi, B. N. Hai, D. L. Quang, N. N. Thi and C. B. Thi, Adv. Nat. Sci.: Nanosci. Nanotechnol., 2011, 2, 045004 Search PubMed.
- P. W. Sylvester, Drug Des. Discovery, 2011, 716, 157 CAS.
- M. B. Figueiredo, E. S. Garcia and P. Azambuja, J. Insect Physiol., 2008, 54, 344 CrossRef CAS PubMed.
- C. F. Bassφe, Cytometry, 1984, 5, 86 CrossRef PubMed.
- Y. Gao, Q. Zhang, Q. Gao, Y. Tian, W. Zhou, L. Zheng and S. Zhang, Mater. Chem. Phys., 2009, 115, 724 CrossRef CAS.
- Z. Y. Yan, J. Qian, Y. Q. Gu, Y. L. Su, X. X. Ai and S. M. Wu, Mater. Res., 2014, 1, 015401 Search PubMed.
- Z. Y. Yan, C. X. Yao, D. Y. Wan, L. L. Wang, Q. Q. Du, Z. Q. Li and S. M. Wu, Enzyme Microb. Technol., 2018, 119, 37 CrossRef CAS PubMed.
- S. Silver and L. T. Phung, Annu. Rev. Microbiol., 1996, 50, 753 CrossRef CAS PubMed.
- D. H. Nies, Appl. Microbiol. Biotechnol., 1999, 51, 730 CrossRef CAS PubMed.
- C. M. Debieux, E. J. Dridge, C. M. Mueller, P. Splatt, K. Paszkiewicz, I. Knight, H. H. Florance, J. Love, R. W. Titball, R. J. Lewis, D. J. Richardson and C. S. Butler, Proc. Natl. Acad. Sci. U. S. A., 2011, 108, 13480 CrossRef CAS PubMed.
- P. A. Tran and T. J. Webster, Int. J. Nanomed., 2011, 6, 1553 CAS.
- L. Xi, L. Yi, W. Jun and Q. Song, Acta, 2001, 375, 109 Search PubMed.
- L. Zhou, L. Shen, L. Hu, H. Ge, J. Pu, D. Chai, Q. Shao, L. Wang, J. Zeng and B. He, Mol. Cell. Biochem., 2010, 335, 283 CrossRef CAS PubMed.
- H. Schwende, E. Fitzke, P. Ambs and P. Dieter, J. Leukocyte Biol., 1996, 59, 555 CrossRef CAS PubMed.
- G. Weiss and U. E. Schaible, Immunol. Rev., 2015, 264, 182 CrossRef CAS PubMed.
- Z. R. Tranchemontagne, R. B. Camire, V. J. O'Donnell, J. Baugh and K. M. Burkholder, Infect. Immun., 2016, 84, 241 CrossRef CAS PubMed.
- A. K. Bolling, B. P. Olderbo, J. T. Samuelsen and H. V. Rukkea, Dent. Mater., 2019, 35, E235 CrossRef CAS PubMed.
- R. Baughn and P. F. Bonventre, Infect. Immun., 1975, 12, 346 CrossRef CAS PubMed.
- Y. Y. Kang, Z. C. Song, P. S. Qiao, X. P. Du and F. Zhao, Prog. Chem., 2017, 29, 467 Search PubMed.
- L. H. Jing, S. V. Kershaw, Y. L. Li, X. Huang, Y. Y. Li, A. L. Rogach and M. Y. Gao, Chem. Rev., 2016, 116, 10623 CrossRef CAS PubMed.
- A. Fariq, T. Khan and A. Yasmin, J. Appl. Biomed., 2017, 15, 241 CrossRef.
- S. A. Dahoumane, C. Jeffryes, M. Mechouet and S. N. Agathos, BioEngineering, 2017, 4, 14 CrossRef PubMed.
- R. Cui, H. H. Liu, H. Y. Xie, Z. L. Zhang, Y. R. Yang, D. W. Pang, Z. X. Xie, B. B. Chen, B. Hu and P. Shen, Adv. Funct. Mater., 2009, 19, 2359 CrossRef CAS.
- N. Chen, Y. He, Y. Su, X. Li, Q. Huang, H. Wang, X. Zhang, R. Tai and C. Fan, Biomaterials, 2012, 33, 1238 CrossRef CAS PubMed.
- A. N. Yadav, R. Kumar, R. K. Jaiswal, A. K. Singh, P. Kumar and K. Singh, Mater. Res. Express, 2019, 6, 5 Search PubMed.
- A. Bruneau, M. Fortier, F. Gagne, C. Gagnon, P. Turcotte, A. Tayabali, T. A. Davis and M. Auffret, Environ. Toxicol., 2015, 30, 9 CrossRef CAS PubMed.
- P. Modlitbova, P. Porizka, K. Novotny, J. Drbohlavova, I. Chamradova, Z. Farka, H. Z. Gargosova, T. Romih and J. Kaiser, Ecotoxicol. Environ. Saf., 2018, 153, 23 CrossRef CAS PubMed.
- W. Wang and M. Tang, Sci. Total Environ., 2018, 625, 940 CrossRef PubMed.
Footnote |
| † Electronic supplementary information (ESI) available. See DOI: 10.1039/c9ra07892d |
| This journal is © The Royal Society of Chemistry 2020 |

