
 Open Access Article
 This Open Access Article is licensed under a Creative Commons Attribution-Non Commercial 3.0 Unported Licence
Yellow pigment formation, pigment composition, and quality of fresh-cut yam (Dioscorea opposita) slices
Lei Zhao†
ab,
Dan Wang†b,
Yue Mab,
Yan Zhangc and
Xiaoyan Zhao *ab
*ab
aCollege of Food, Shenyang Agricultural University, Shenyang, Liaoning 110161, China. E-mail: xiaoyanzhao001@163.com; Fax: +86-10-51503053; Tel: +86-10-51503053
bBeijing Vegetable Research Center, Beijing Academy of Agriculture and Forestry Sciences, Beijing Key Laboratory of Agricultural Products of Fruits and Vegetables Preservation and Processing, Key Laboratory of Vegetable Postharvest Processing, Ministry of Agriculture and Rural Affairs, Beijing 100097, China
cLongda Food Group Co. LTD, Shandong 265231, China
First published on 6th January 2020
Abstract
Fresh-cut yam (Dioscorea opposita) slices brown easily and can turn yellow under certain storage conditions. The formation conditions of yellow pigment, pigment composition, and quality of yellow fresh-cut yam slices were investigated in this study. The results showed that storage temperature, gas ratio of packaging, and slice thickness affected the formation of yellow pigmentation. The highest content of yellow pigment was found in 0.1 cm-thick yam slices stored at 25 °C for 18 h and packaged in 20% O2 and 80% N2. Yellow pigments were composed primarily of bisdemethoxycurcumin (73.7%) and two other unknown compounds that were not attributed to microorganisms. Yellow fresh-cut yam exhibited good quality, and the alcohol and ester extracts of yellow yams had higher oxygen radical adsorption capacity and 2,2-diphenyl-1-picrylhydrazyl radical scavenging ability compared to white fresh-cut yam.
1. Introduction
Yam (Dioscorea opposita) is an annual or perennial climbing plant.1 The edible tubers of various species of Dioscorea2 include many functional components, including mucin, allantoin, polysaccharides, flavonoids, choline, and polyphenols,3,4 which can reduce blood glucose, aid digestion, and relieve coughs. These components also exhibit anticoagulant, anti-cancer, and antioxidant activities.5 As yams provide a low-cost source of dietary energy in the form of carbohydrates, fresh-cut yams are popular with consumers in developing countries.6,7 However, it is difficult to remove the peel of yams because the resulting liquid can cause itching.Processing of fresh-cut yam has some advantages related to convenience and nutritional value. Fresh-cut yam could be directly cooked for eat in family or central kitchen, and supplied for drying processing.8 However, trimming, peeling, and cutting increase the physiological deterioration of yams.9 The color change of fresh-cut vegetables is an important problem in the produce industry because it affects the flavor, appearance, and nutritional value of vegetables and shortens its shelf life.10 Browning is the most typical color change observed in fresh-cut yam.11 During the browning of fresh-cut yam, polyphenols are oxidized to quinones. However, in our experiments, yellowing is observed in fresh-cut yams under certain processing conditions.
Some vegetables, such as Chinese water chestnuts, tend to etiolate after the cutting process.12 Few studies in the literature have reported yellowing of fresh-cut yams and the chemicals responsible for the yellowing process. In this study, the formation conditions, pigment composition, and quality of yellow fresh-cut yam slices were investigated. The results provide useful information for the processing of fresh-cut yams.
2. Materials and methods
2.1 Chemicals
Chromatography-grade acetonitrile was purchased from Dima Technologies (Beijing, China). Analytical-grade methanol and anhydrous ethanol (≥99.8%) were obtained from Beijing Chemistry Co. (Beijing, China). 2,2-Diphenyl-1-picrylhydrazyl (DPPH) was obtained from TSI AI Chemical Industry Development (Shanghai, China). Folin-phenol was obtained from Solarbio (Beijing, China). Nutritive agar was obtained from Aoboxing Biotechnology (Beijing, China). Sodium fluorescein, 2-aminopropane, sodium hypochlorite, potassium hypophosphite, dipotassium phosphate, and vitamin E (Ve) were obtained from Mclean Biochemical Technology (Shanghai, China). Bisdemethoxycurcumin standard was obtained from Solarbio (Beijing, China). Macroporous resin (XAD-7) was obtained from Abol Biotechnology Co., Ltd (Beijing, China). Solid-phase extraction (SPE) cartridges (Sep-Pak C18; 12 mL, 2000 mg) were obtained from Waters (Milford, USA). Syringe filter units (0.22 μm) were supplied by Hercules (Beijing, China). Distilled water was used throughout.2.2 Plant material and treatments
One variety of yam, “Tiegun”, was purchased from a supermarket, Guoxiangsiyi, in Zhanghua Road, Haidian District (Beijing, China) and kept for 24 h at 4 °C before being used in experiments. Fresh samples with uniform shape and size were selected; specimens that showed physical damage or signs of disease were discarded. After washing with tap water and peeling, fresh yams were cut into 0.1, 0.5, 1, 3, 5, and 10 cm-thick slices using a slicer.2.3 Packaging
Yam slices were packed separately in polyethylene (PE; thickness = 4.25 μm, dimensions = 41 cm × 29 cm) plastic bags. The oxygen and carbon dioxide transmission rates of the PE bags were 1113.66 and 3669.42 cm3 m−2 24 h 0.1 MPa, respectively.2.4 Experimental design
For each treatment, approximately 1000 g of fresh-cut yam was immersed into 1% and 0.5% solutions of sodium hypochlorite at 6.5 pH and 15 °C for 2 min each.13 A vegetable dehydrator was then used to remove water from the surfaces of the samples. Subsequently, approximately 120 g of selected slices were packed randomly into packing bags.The fresh-cut yams were allocated randomly into three groups. For the first group, samples were stored at different temperatures: 4 °C, 10 °C, 15 °C, 20 °C, or 25 °C. The samples in the first group were analyzed at different time points (9, 18, 27, 36, and 45 h). In the second group, samples were packaged in atmospheres with different gas compositions: 0% oxygen (O2) and 100% nitrogen (N2) (0% O2–100% N2); 20% O2 and 80% N2 (20% O2–80% N2); 40% O2 and 60% N2 (40% O2–60% N2); 60% O2 and 40% N2 (60% O2–40% N2); 80% O2 and 20% N2 (80% O2–20% N2); 100% O2 and 0% N2 (100% O2); 20% carbon dioxide (CO2) and 80% N2 (20% CO2–80% N2); 40% CO2 and 60% N2 (40% CO2–60% N2); 60% CO2 and 40% N2 (60% CO2–40% N2); 80% CO2 and 20% N2 (80% CO2–20% N2); or vacuum-packed. The samples in the second group were stored at 25 °C for 18 h. In the third group, samples were cut into slices with different thicknesses: mud paste (beating fresh yam with Philips beater into a homogenate) or 0.1, 0.5, 1, 3, 5, or 10 cm. The samples in the third group were stored at 25 °C for 18 h. Three replicate values were used for all treatments on each storage period.
2.5 Color assessment
A colorimeter (Konica Minolta CM-3700; Japan) was used to assess the colors of fresh-cut yam slices. L*, a*, and b* values at 10 sites on each of the 20 yam slices in each treatment group were measured.2.6 Purification
Yellow fresh-cut yams were extracted with methanol. The ratio of yam (mass) to methanol (volume) was 1![[thin space (1/6-em)]](https://www.rsc.org/images/entities/char_2009.gif) :1, and the extraction time was 30 min. The resultant extract was passed through an Amberlite XAD-7 column (60 cm × 1.6 cm; Sigma, Santa Clara, USA) within a chromatography system (AKTA Explorer; GE, Fairfield, USA). The injection volume was 250 mL, and the column was washed with water at a flow rate of 5 mL min−1 to remove sugar and protein until the electrical conductivity became stable. Subsequently, methanol was used to elute the pigment, and the eluent with an absorption peak at 410 nm was collected. The extraction solution was concentrated using a rotary evaporator (BUCHI R-215, Flawil, Switzerland) and then filtered through a 0.22 mm syringe filter.
:1, and the extraction time was 30 min. The resultant extract was passed through an Amberlite XAD-7 column (60 cm × 1.6 cm; Sigma, Santa Clara, USA) within a chromatography system (AKTA Explorer; GE, Fairfield, USA). The injection volume was 250 mL, and the column was washed with water at a flow rate of 5 mL min−1 to remove sugar and protein until the electrical conductivity became stable. Subsequently, methanol was used to elute the pigment, and the eluent with an absorption peak at 410 nm was collected. The extraction solution was concentrated using a rotary evaporator (BUCHI R-215, Flawil, Switzerland) and then filtered through a 0.22 mm syringe filter.
2.7 Fractionation
The purified sample was cleaned further using a Sep-Pak C18 SPE cartridge. The cartridge was loaded successively with ten times the column volume of methanol and ten times the column volume of water. Next, an 1.5 mL aliquot of the sample was injected into the SPE cartridge and eluted with 45 mL of water to remove impurities. The yellow pigment was then eluted with methanol. The methanol eluent was collected and concentrated using a rotary evaporator. The yellow pigment solution was then analyzed by ultra-high performance liquid chromatography/tandem mass spectrometry (UHPLC-MS/MS).2.8 UHPLC-MS/MS analysis
Purified yellow pigments were analyzed by UHPLC-MS/MS using an Agilent 1290 liquid chromatograph (Agilent, Santa Clara, USA). The sample (2 μL) was injected onto an analytical-scale Zorbax SB-C18 column (particle size = 5 μm, 4.6 × 250 mm; Agilent, Santa Clara, USA). The UHPLC elution conditions were as follows: 50% B (0–10 min), 50–100% B (10–35 min), and 100% B (35–45 min). The flow rate was 0.5 mL min−1. The temperature of the column was held at 25 °C. The injection volume of the sample was 2.0 μL. MS analysis was performed using an Agilent QTOF-MS mass spectrometer (Agilent, Santa Clara, USA) equipped with an electrospray ionization (ESI) source operating in negative ionization mode. The collision energy was set at 10, 20, and 40 eV. The capillary voltage and cone voltage were 2500 and 45 V, respectively. The sheath gas temperature was 375 °C. The drying gas was flowed at a rate of 12 L min−1 at a temperature of 325 °C. The sheath gas flow rate was 12 L min−1. The MS acquisition rate was 1.5 spectra per s. Dynamic range enhancement of the cone voltage was applied throughout MS analysis to ensure the accurate mass measurement over a wide dynamic range. Data were collected and acquired using MassLynx B2.1 software (Agilent, Santa Clara, USA).2.9 Microbiological analysis
Each yam slice sample (25 g) was macerated in 225 mL aseptic physiological saline (0.85 g NaCl dissolved in 100 g water), as described by the International Commission on Microbiological Specifications for Foods.14 The mixture was then shaken with sterile glass rods for 3 min. The total bacterial count was determined using plate count agar plates, and the colony-forming units (CFUs) were counted after incubation at 37 °C for 48 h. The microbiological count was expressed as log (CFU g−1 fresh-cut yam).2.10 Texture analysis
Hardness of fresh-cut yam slices were evaluated using a texture analyzer (TA-XT Plus, Stable Systems Ltd., UK) equipped with a cylindroid P2 probe. Yam samples were fixed on the model platform to prevent the samples from slipping. Pre-test, test, and post-test compression rates of yam tissue were 10, 2, and 10 mm s−1, respectively. The trigger force strain was 5 g, and the temperature was 25 °C. Hardness was determined as the maximum force needed to puncture the fresh-cut yam sample to a depth of 0.5 mm. The results were expressed in N. For each sample, three measurements were performed at each storage time.2.11 Overall visual quality analysis
Samples were transferred to closed plastic boxes coded with random numbers. Overall visual quality analysis was carried out according to the previously reported procedure for fresh-cut lotus root15 with some modifications to assess freshness, appearance, color, uniformity, and brightness. Sensory evaluation criteria were as follows: 9 (excellent, no defects), 7 (good quality, minor defects), 5 (fair, slightly to moderately objectionable defects), 3 (poor, excessive defects), and 1 (unusable).2.12 Determination of total phenolic content
The Folin–Ciocalteu method was used to quantify phenolic compounds.16 Briefly, the sample (5 g) was homogenized with 20 mL of 80% ethanol (ethanol-to-water volume ratio = 4:1) for 1 min. Subsequently, the extract was filtered and centrifuged at 10000 × g for 15 min. The supernatant (1 mL) was mixed gently with 1 mL of Folin–Ciocalteu reagent and 10 mL of 7% sodium carbonate (mass ratio of sodium carbonate to aqueous solution = 7:100). The volume was increased to 25 mL with distilled water, and the mixture was left to settle for 1 h. Total phenolic content was measured by recording the adsorption at 760 nm using a spectrophotometer (UV-1800, Shimadzu. Japan). The standard curve of gallic acid was constructed to quantify the total phenolic content.
2.13 Determination of DPPH radical scavenging activity and oxygen radical adsorption capacity (ORAC)
Yellow fresh-cut yam slices (500 g, packaged in 20% O2 and 80% N2, and stored at 25 °C for 18 h) were extracted with 500 mL water, methanol, or ethyl acetate. White fresh-cut yam slices (packaged in 20% O2 and 80% N2 and stored at 4 °C for 18 h) served as the control. The extraction conditions were as follows: ratio of yam slice (mass) to extracted solution (volume) = 1:1; temperature = 30 °C; and extraction time = 1 h. The collected filtrate was centrifuged at 12000 × g and 4 °C for 20 min. The supernatants were analyzed for antioxidant activity (based on free DPPH radical scavenging activity) and ORAC.
DPPH radical scavenging activity was measured according to the method of Duan et al.17 with slight modification. Water, methanol, and ethyl acetate extracts (10 μL) were each mixed with 3 mL of a solution of 0.1 mM DPPH in methanol. In the control, the extract was replaced with methanol. The blanks contained methanol instead of DPPH solution. After the solution was shaken vigorously and left to incubate for 30 min in the dark at room temperature, the absorbance at 517 nm was measured and expressed as the value of the OD. The DPPH radical scavenging ability was calculated according to the following equation: DPPH radical scavenging activity (%) = [1 − (ODsample − ODblank)/ODcontrol] × 100.
The extract was subjected to ORAC according to the previously described method18 with slight modification. 2,2′-Azobis (2-amidinopropane) dihydrochloride (AAPH; 0.41 g) was prepared rapidly in 10 mL 75 mM phosphate buffer (pH 7.4) to a final concentration of 153 mM. Water, methanol, and ethyl acetate extracts were diluted to 10, 100, 1000, and 10000 times with the corresponding solvent. Sodium fluorescein diluent (200 μL, 4.19 × 10⁻³ mM) and 20 μL of extract were placed in the wells of 96-well polystyrene white microplates. Water, methanol, and ethyl acetate (200 μL) without extract served as the blank samples. After incubation at 37 °C for 10 min, 20 μL of AAPH solution was added rapidly to begin the reaction. The fluorescence value was recorded at the excitation wavelength of 485 nm and emission wavelength of 535 nm. The fluorescence value was recorded every minute. The fluorescence quenching curve of the extract was quantified based on the abscissa as the measurement time and the ordinate as the fluorescence. The area under the fluorescence decay curve (AUC) was integrated approximately as the sum of the trapezoidal area using the following formula:
| AUC = 0.5 × (f0 + f1) × Δt + 0.5 × (f1 + f2) × Δt + … + 0.5 × (fx + fx+1) × Δt + … + 0.5 × (fn−1 + fn) × Δt, | (1) |
Data were analyzed using a Microsoft Excel macro program (Microsoft, Roselle, USA) to calculate AUC using eqn (1). The net AUC of the sample was calculated by subtracting the AUC of the blank. ORAC and DPPH radical scavenging activity was expressed as Trolox (Ve of 0.1 mg mL−1), which was determined according to the standard curve of Trolox.
3. Results and discussion
3.1 Formation of yellowing of fresh-cut yams under different storage conditions
Storage temperature affected yellow pigment formation in fresh-cut yam (Table 1). The color parameters of the samples stored at 25 °C for 18 h, 20 °C for 24 h, 15 °C for 60 h, 10 °C for 168 h, and 4 °C for 360 h were determined because visible color changes were observed in the fresh-cut yam slices at these time points. The L* value represents brightness, with a high L* value indicating high brightness (whiteness).19 The L* values for fresh-cut yams stored at different temperatures were significantly lower (p < 0.05) than those of the control group (fresh-cut yam stored for 0 h). The yam samples stored at 4 °C, 10 °C, and 15 °C had higher brightness (higher L* values) than the samples stored at 20 °C and 25 °C. The a* value increased with decreasing storage temperature. Compared with the control group, a* values of the samples stored at 15 °C, 10 °C, and 4 °C were higher, while those of the yams stored at 25 °C and 20 °C were lower. These results indicate that the fresh-cut yam slices stored at temperatures ≤ 15 °C turned brown. The b* value is the most important index for evaluating yam yellowing. The b* value in this study decreased gradually with decreasing storage temperature. All stored samples exhibited higher b* values compared with the control group, indicating that yellowing occurred during storage. In this study, fresh-cut yam stored at 25 °C for 18 h had the highest b* value, indicating the formation of the most yellow pigment. The above results indicate that browning occurred mainly in fresh-cut yam stored at 4 °C, 10 °C, and 15 °C, but yellowing occurred in the samples stored at 20 °C and 25 °C. Temperature regulates reaction speed and enzymatic activity.20 The yellowing and browning of fresh-cut yams may have proceeded through two different reaction pathways, with 15 °C being the threshold temperature separating these two reactions.| Treatments | L* | a* | b* | |
|---|---|---|---|---|
| a Different lowercase letters indicate significant differences at P < 0.05. | ||||
| Temperature–time | Control–0 h | 83.7 ± 0.19a | −1.19 ± 0.06c | 7.9 ± 0.08e |
| 4 °C–360 h | 76.5 ± 0.19b | 0.79 ± 0.21a | 10.06 ± 0.09d | |
| 10 °C–168 h | 78.0 ± 0.13b | 0.79 ± 0.09a | 10.97 ± 0.02c | |
| 15 °C–60 h | 76.8 ± 0.01b | −0.74 ± 0.27b | 11.28 ± 0.26c | |
| 20 °C–4 h | 72.4 ± 0.10c | −1.5 ± 0.15d | 13.62 ± 0.21b | |
| 25 °C–18 h | 70.2 ± 0.18c | −2 ± 0.23e | 15.58 ± 0.11a | |
| Modified atmosphere packaging | Air | 73.83 ± 0.32f | −2.13 ± 0.01g | 33.88 ± 0.40c |
| 100% N2 | 74.71 ± 0.21cdef | −1.97 ± 0.03e | 41.89 ± 0.52a | |
| 20% O2 | 73.85 ± 0.35def | −2 ± 0.003e | 38.61 ± 0.27b | |
| 40% O2 | 74.12 ± 0.33ef | −2.21 ± 0.01g | 27.10 ± 0.89de | |
| 60% O2 | 76.86 ± 0.09bcdef | −2.32 ± 0.03h | 24.8 ± 0.62de | |
| 80% O2 | 75.34 ± 0.01f | −2.44 ± 0.01i | 22.07 ± 0.36f | |
| 100% O2 | 74.2 ± 0.34f | −2.89 ± 0.01j | 19.97 ± 0.43g | |
| Vacuum | 77.54 ± 0.35bcde | −2.44 ± 0.01f | 27.84 ± 0.65d | |
| 20% CO2 | 80.31 ± 0.29bcde | −1.88 ± 0.04d | 25.4 ± 0.80ef | |
| 40% CO2 | 81.7 ± 0.18f | −1.69 ± 0.03c | 18.39 ± 0.69g | |
| 60% CO2 | 82.56 ± 0.29b | −1.49 ± 0.03b | 17.47 ± 0.46gh | |
| 80% CO2 | 82.59 ± 0.35bcd | −1.45 ± 0.03b | 15.81 ± 0.45h | |
| 100% CO2 | 82.77 ± 0.05a | −1.2 ± 0.01a | 10.68 ± 0.04i | |
| Thickness | Mud | 91.14 ± 0.01b | −0.12 ± 0.03a | 0.57 ± 0.01d |
| 0.1 cm | 95.89 ± 0.01ab | −12.89 ± 0.02d | 39.52 ± 0.08a | |
| 0.5 cm | 97.06 ± 0.01ab | −1.63 ± 0.01c | 4.26 ± 0.01b | |
| 1 cm | 97.06 ± 0.01ab | −1.48 ± 0.05c | 4.13 ± 0.08b | |
| 3 cm | 97.19 ± 0.01ab | −0.3 ± 0.08a | 1.035 ± 0.08cd | |
| 5 cm | 97.19 ± 0.01ab | −0.72 ± 0.07b | 2.01 ± 0.01c | |
| 10 cm | 97.22 ± 0.01a | −0.36 ± 0.08a | 1.2 ± 0.09cd | |
The storage of fresh-cut yams in different packaging atmosphere had significant (p < 0.01) effect on the occurrence of yellowing (Table 1). The L* values of samples packaged in atmosphere containing CO2 were higher than those of the vacuum-packed and air-packed samples, indicating that storage in CO2 contributed to the preservation of brightness. These results agree with previous studies finding that the storage of fresh-cut yam in atmosphere with high CO2 content and low O2 content was beneficial for maintaining quality.21 All stored samples exhibited lower a* values compared to the control with the exception of the sample packaged in 100% CO2; the a* value of that sample was not different compared to the control, indicating that browning did not occur. The b* values of fresh-cut yam are shown in Table 1. All stored samples exhibited higher b* values compared to the control group, indicating the formation of yellow pigment in all stored samples. The b* value increased, that is yellowing gradually lightened with increasing O2 and CO2 concentrations in the storage atmosphere. The samples packaged in atmospheres containing different concentrations of O2 generated more yellow pigment than the samples stored in atmospheres with equivalent concentrations of CO2. The b* value of the sample packaged in 100% N2 exhibited the highest content of yellow pigment, followed by the sample packaged in 20% O2 and 80% N2 and the samples packed in air and under vacuum. However, the fresh-cut yam packaged in 100% N2 exhibited an obvious peculiar smell after yellowing. Therefore, the atmosphere containing 20% O2 and 80% N2 was selected as the best for producing yellow pigment in fresh-cut yam.
Fresh-cut yam samples with different thicknesses exhibited different degrees of yellowing under the same storage conditions. The colorimetric parameters of fresh-cut yam slices with different thickness are compared in Table 1 for samples stored in 20% O2 and 80% N2 at 25 °C for 18 h. Fresh-cut yam paste displayed the lowest brightness, as evidenced by the lowest L* value, while the 10 cm-thick sample had the highest brightness. No significant differences in L* were observed among the fresh-cut yam samples with other thicknesses. The a* value of the sample with a thickness of 0.1 cm was significantly lower than those of the other samples, while the b* value was notably higher, indicating that thickness affected the yellowing process during storage. Fresh-cut yams were still on respiration, causing O2 to be absorbed and CO2 to be released. Different slicing processes lead to different degrees of damage and different effects on respiration.22 In addition, the internal gas ratio differed greatly among the treatments, and the contents of phenolic acids and amino acids along with enzymatic activity also differed. These factors all affected the formation of yellow pigment in the fresh-cut yam samples.
Based on the above results, the optimum storage conditions for yellow pigment formation in fresh-cut yam are as follows: thickness = 0.1 cm; atmosphere containing 20% O2 and 80% N2; and storage at 25 °C for 18 h.
3.2 Separation and characterization of yellow pigment from fresh-cut yam
The yellow pigments from fresh-cut yam were extracted using water, methanol, ethyl acetate, and trichloromethane. Methanol was found to be the best extraction solvent for yellow pigment. The UHPLC results of the purified yellow pigment fraction are shown in Fig. 1A. The detection wavelength of 410 nm was confirmed through an ultraviolet-visible (UV-Vis) full-wavelength scan (200–800 nm). The yellow fraction contained three peaks with retention times of 10.58 min (peak 1), 11.34 min (peak 2), and 17.59 min (peak 3). Peak 3 was the major peak (peak area ratio = 73.7%) followed by peak 2 and then peak 1. Based on the retention times, peak 3 had the weakest polarity, while peak 1 exhibited the strongest polarity. The UV-Vis spectra of the three yellow pigment compounds corresponding to peaks 1–3 are displayed in Fig. 1B–D, indicating UV-Vis absorption wavelengths of 400, 350, and 420 nm, respectively.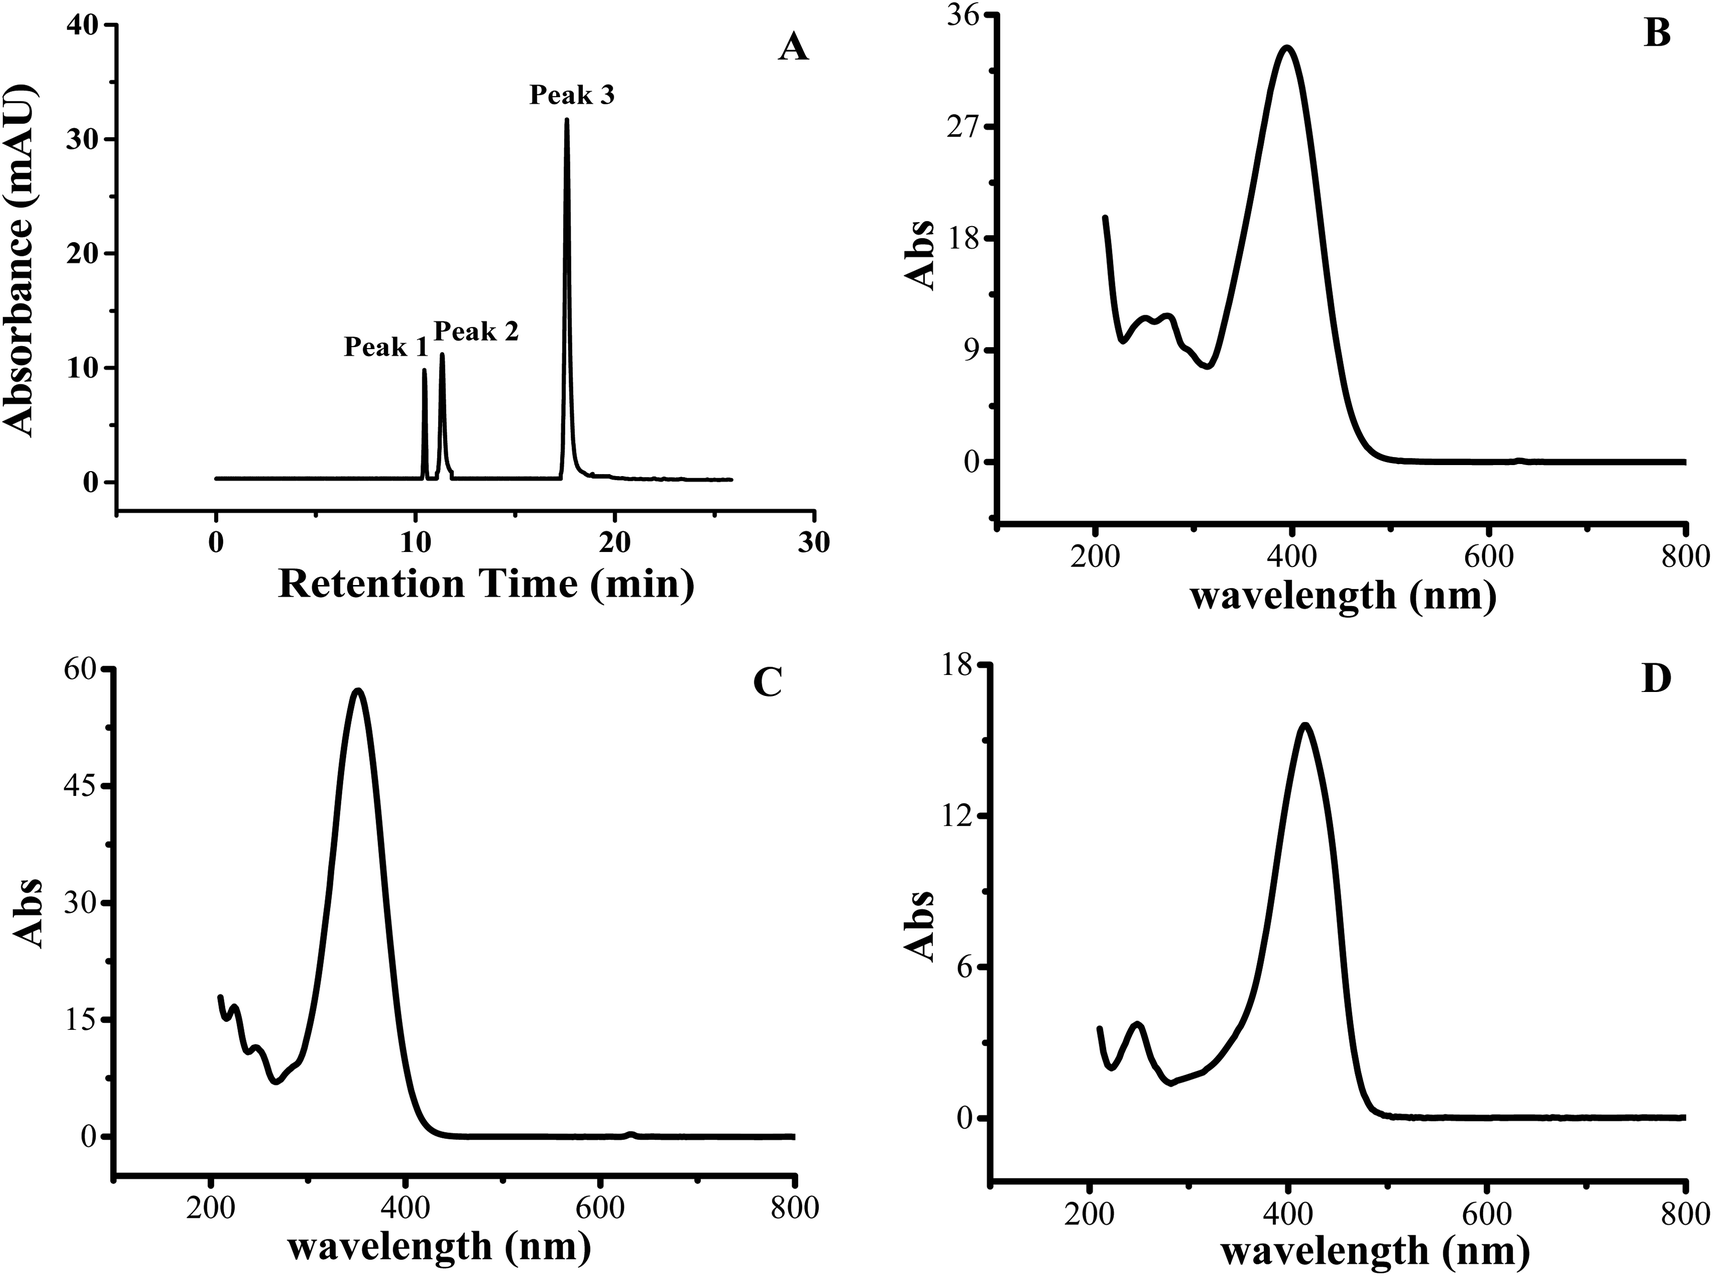 | ||
| Fig. 1 UHPLC and UV-Vis analysis of the purified yellow pigment fraction of fresh-cut yam. (A) UHPLC chromatogram of the yellow fraction detected at 410 nm and UV-Vis spectra of (B) peak 1, (C) peak 2, and (D) peak 3. | ||
The molecular masses and structures of the yellow pigment compounds were evaluated by MS. HPLC-MS with ESI is widely used for the sensitive and reproducible analyses of complex sample matrices.23–25 For UHPLC peak 1, one compound with a protonated molecular ion peak at m/z 291 [M − H]− was observed in the mass spectrum (Fig. 2A). Since the compound was detected in negative ion mode, the molecular weight of the compound was determined to be 292. The proposed molecular formula and mass spectral information are given in Table 2. The number of carbon atoms was calculated from the observed intensity of the M + 1 peak (Fig. 2B).26 These data agree with the chemical formula C19H16O3. Increasing the cone voltage may provide sufficient energy to break molecules into fragments; thus, adjusting the cone voltage can control the degree of fragmentation.27 At low cone voltage (10 V), only one prominent peak was observed at m/z 291, suggesting that this is the mother ion for UHPLC peak 1 (10.58 min). At a cone voltage of 20 V, the mother ion produced two daughter ions at m/z 171 and 145. One new peak at m/z 117 appeared when the cone voltage was increased to 40 V. Similarly, for UHPLC peak 2, the mother ion in the mass spectrum was observed at m/z 293 [M − H]− (Table 2), corresponding to a molecular weight of 293 and a molecular formula of C19H18O3. The fragmentation ions were m/z 187 and 119. Peaks 1 (10.58 min) and 2 (11.34 min) had no matches in the mass spectrometry library; thus, their chemical structures require further study through nuclear magnetic resonance and infrared spectroscopy. UHPLC peak 3 (17.59 min) corresponded to the major yellow pigment component. At a collision energy of 10 V, one protonated molecular ion peak at m/z 307 [M − H]− and three fragment ions (m/z 187, 143, and 119) were found in the MS spectrum, indicating a molecular weight of 308. Upon increasing the cone voltage to 20 V, the mother ion at m/z 307 [M − H]− disappeared, the intensities of the fragment ion peaks at m/z 187 and 143 decreased, and the intensity of the fragment ion peak at m/z 119 increased. When the cone voltage increased to 40 V, the fragment ion peak at m/z 187 disappeared, and the intensities of the other fragment ion peaks decreased. The molecular formula indicated by the MS results was C19H16O4, consistent with the mass spectrum of bisdemethoxycurcumin in the spectral library (Fig. 2D). Peak 3 was confirmed as the peak of bisdemethoxycurcumin based on standard sample analysis. Since the intensity of peak 3 was much greater compared with other peaks, bisdemethoxycurcumin had the greatest contribution to the production of yellow pigment in fresh-cut yams. In contrast, the primary components of yellow pigment from Chinese water chestnuts were found to be eriodictyol, naringenin, sucrose, and ethyl glucoside.28 This study represents the first time that bisdemethoxycurcumin was identified in fresh-cut yam with yellow pigment. These results are consistent with the influence of gas ratio on yellow pigment formation. The bisdemethoxycurcumin was biosynthesized through several steps. In one of these steps, p-coumaroyldiketide-CoA and CO2 were produced by the reaction among p-coumaroyl-CoA, malonyl-CoA, and diketide-COA synthase.29,30 This reaction would be inhibited by high concentrations of CO2. Therefore, storage in CO2 hindered the formation of yellow pigment. In contrast, low concentrations of O2 inhibited respiration and reduced the concentration of CO2 in the storage bag, which favored the formation of yellow pigment.
 | ||
| Fig. 2 Mass spectra of the purified yellow pigment fraction of fresh-cut yam. (A) MS spectrum of peak 1. (B) Molecular ion isotope analysis of peak 1. (C) MS spectrum of peak 1 at cone voltages of 10, 20, and 40 V. (D) Comparison of the MS spectra of the samples and spectral library information of bisdemethoxycurcumin at cone voltages of 10, 20, and 40 V (the red lines represent the ions of peak 3, while the black lines represent the spectral library ions of bisdemethoxycurcumin). | ||
| Proposed formula | Molecular ions (m/z) | Fragmentation ions (m/z) | |
|---|---|---|---|
| Peak 1 | C19H16O3 | 291 | 171, 145, 117 |
| Peak 2 | C19H18O3 | 293 | 187, 119 |
| Peak 3 | C19H16O4 | 307 | 187, 143, 119 |
3.3 Quality of yellow fresh-cut yam
Fig. 3 compares the qualities of yellow fresh-cut yam (thickness = 0.1 cm, packaged in 20% O2 and 80% N2, and stored at 25 °C for 18 h) and white fresh-cut yam (thickness = 0.1 cm, packaged with 20% O2 and 80% N2, and stored at 4 °C for 18 h) with the control group (fresh-cut yam stored for 0 h). Images of the control, white, and yellow fresh-cut yam slices are shown in Fig. 3A–C, respectively. The total bacteria count of the yam samples increased during storage. Although the total bacteria count of yellow fresh-cut yam increased by 1.1 log (CFU g−1) during storage, the bacteria count did not exceed the limit that prevents their sale [5log (CFU g−1)]. Fresh-cut yam samples were also treated with a high concentration of sodium hypochlorite on a sterile table (initial bacteria count = 0) and stored at 4 °C and 25 °C. The fresh-cut yam stored at 25 °C still turned yellow after 18 h, demonstrating that the yellowing was not caused by microorganisms (data not shown). The total phenol content of white fresh-cut yam was 5.63 g/100 g, higher than in the control group but lower than for yellow yam. The higher total phenolic content of white yam was attributed to the cutting process and can be considered as a defense mechanism.31 Many studies have found significant increases in the phenolic contents and antioxidant activities after the cutting of fruits and vegetables, including broccoli,32 mangoes,33 celery,34 carrot,35 lettuce,36 mushroom,37 and welsh onion.38 The formation of the polyphenol bisdemethoxycurcumin also contributed to the high total phenolic content of yellow fresh-cut yam. The hardness and overall visual quality of yellow yam were consistent with those of white yam (Fig. 3D). The antioxidant activities of yellow and white fresh-cut yams were compared (Fig. 4) based on ORAC and DPPH radical scavenging activity, which are the most commonly used measures for evaluating the antioxidant capacities of foods.39–41 The ORAC and DPPH radical scavenging activity of the water extract were significantly higher for white yam than for yellow yam; the opposite trend was observed for the methanol extracts. The aqueous extract of yams contain mucins, amino acids, water-soluble proteins, polysaccharides and other compounds with biological activity which increase its antioxidant activity.42,43 The contents of some amino acids such as phenylalanine and tyrosine may have decreased during storage because of their involvement in bisdemethoxycurcumin formation, leading to the lower antioxidant activity of yellow fresh-cut yam compared to white fresh-cut yam. However, the alcohol extract, which contained bisdemethoxycurcumin and presented obvious yellow color, exhibited a higher antioxidant activity in the yellow yam than in the white yam. Moreover, the ORAC of the ethyl acetate extract of yellow yam was higher than that of white yam, whereas the DPPH radical scavenging activity was not significantly different between white and yellow yam. Therefore, the alcohol and ester extracts of yellow fresh-cut yam displayed higher antioxidant activities than the corresponding extracts of white fresh-cut yam.
 | ||
| Fig. 3 Images and quality analysis results of yellow and white fresh-cut yam slices. Images of (A) fresh-cut yam stored for 0 h, (B) white fresh-cut yam, and (C) yellow fresh-cut yam. (D) Quality analysis results for the fresh-cut yam slices. Data presented are the means of three replicates. Different letters indicate significant differences among mean values (P < 0.05). | ||
 | ||
| Fig. 4 Antioxidant activities of fresh-cut yam slices. (A) ORAC values of fresh-cut yam slices and (B) DPPH radical scavenging activities of fresh-cut yam slices. Data presented are the means of three replicates. Different letters indicate significant differences among mean values (P < 0.05). | ||
4. Conclusion
The optimum storage conditions that favor yellow pigment formation in fresh-cut yam were determined as follows: slice thickness = 0.1 cm; packaging in atmosphere containing 20% O2 and 80% N2; and storage at 25 °C for 18 h. The primary components of the yellow pigments were bisdemethoxycurcumin and two unknown compounds. The yellow yam slices exhibited good quality, and their alcohol and ester extracts exhibited higher ORAC and DPPH radical scavenging activity compared to the white yam slices. The results provide useful information for the processing of fresh-cut yam.Conflicts of interest
The authors declare no competing financial or non-financial interests.Acknowledgements
This work was supported by Special training Program for Outstanding Scientists of Beijing Academy of Agricultural and Forestry Sciences (JKZX201908), the Collaborative Innovation Center of the Beijing Academy of Agricultural and Forestry Sciences (KJCX201915), China Agriculture Research System (CARS-23), and Efficient Ecological Agriculture Innovation Project of Taishan Industry Leading Talent Programming Shandong Province (LJNY201705).References
- N. Akissoe, C. Mestres, S. Handschin, O. Gibert, J. Hounhouigan and M. Nago, LWT–Food Sci. Technol., 2011, 44, 321–329 CrossRef CAS.
- Z. Luo, Y. Wang, L. Jiang and X. Xu, LWT–Food Sci. Technol., 2015, 60, 1155–1161 CrossRef CAS.
- I. O. Fasidi and N. O. Bakare, Food Chem., 1995, 52, 423–426 CrossRef CAS.
- H.-C. Lee, W.-Y. Cheng, B. E. T.-G. Huang, Y.-H. Hsu and S.-Y. Huang, RSC Adv., 2014, 4, 55649–55657 RSC.
- M. Li, W. Kong, Y. Li, H. Liu, Q. Liu, X. Dou, Z. Ouyang and M. Yang, J. Chromatogr. B: Anal. Technol. Biomed. Life Sci., 2016, 1022, 118–125 CrossRef CAS.
- L. S. Teoh, O. Lasekan, N. M. Adzahan and N. Hashim, Postharvest Biol. Technol., 2016, 120, 138–144 CrossRef CAS.
- Y. Zhang, J. Li, J. Zhao, Y. Zhang and J. Fan, RSC Adv., 2018, 8, 30040–30048 RSC.
- T. A. Ajayeoba, T. S. Bamidele, O. M. Oyawoye and O. A. Ijabadeniyi, LWT–Food Sci. Technol., 2019, 111, 133–137 CrossRef CAS.
- A. B. Martín-Diana, D. Rico and C. Barry-Ryan, Innovative Food Sci. Emerging Technol., 2008, 9, 593–603 CrossRef.
- M. C. Luna, J. A. Tudela, F. A. Tomás-Barberán and M. I. Gil, Postharvest Biol. Technol., 2016, 119, 84–93 CrossRef CAS.
- G. Zhang, L. Gu, Z. Lu, C. Yuan and Y. Sun, RSC Adv., 2019, 9, 5002–5008 RSC.
- M. Song, S. Wu, L. Shuai, Z. Duan, Z. Chen, F. Shang and F. Fang, Postharvest Biol. Technol., 2019, 148, 15–21 CrossRef CAS.
- R. C. Soliva-Fortuny and O. MartíN-Belloso, Trends Food Sci. Technol., 2003, 14, 341–353 CrossRef CAS.
- J. A. Robertson, K. J. A. I'Anson, J. Treimo, C. B. Faulds, T. F. Brocklehurst, V. G. H. Eijsink and K. W. Waldron, LWT–Food Sci. Technol., 2010, 43, 890–896 CrossRef CAS.
- J. Du, Y. Fu and N. Wang, LWT–Food Sci. Technol., 2009, 42, 654–659 CrossRef CAS.
- V. L. Singleton and J. A. Rossi, Am. J. Enol. Vitic., 1965, 16, 144–158 CAS.
- X. Duan, T. Liu, D. Zhang, X. Su, H. Lin and Y. Jiang, Food Res. Int., 2011, 44, 1905–1911 CrossRef CAS.
- D. Huang, B. Ou, M. Hampschwoodill, J. A. Flanagan and R. L. Prior, J. Agric. Food Chem., 2002, 50, 4437 CrossRef CAS PubMed.
- M. A. Homaida, S. Yan and H. Yang, LWT–Food Sci. Technol., 2017, 77, 8–14 CrossRef CAS.
- K. Towantakavanit and P. Yongseo, Hortic., Environ. Biotechnol., 2009, 433–436 Search PubMed.
- Z. Luo, Y. Wang, L. Jiang and X. Xu, LWT–Food Sci. Technol., 2015, 60, 1155–1161 CrossRef CAS.
- T. Iqbal, F. A. S. Rodrigues, P. V. Mahajan, J. P. Kerry, L. Gil, M. C. Manso and L. M. Cunha, J. Food Sci., 2010, 73, E396–E402 CrossRef PubMed.
- F. Cuyckens and M. Claeys, J. Mass Spectrom., 2004, 39, 1–15 CrossRef CAS PubMed.
- J. Singh, K. Sharma, S. Walia and S. Saha, Food Anal. Methods, 2017, 10, 1–11 CrossRef CAS.
- R. C. D. Vos, S. Moco, A. Lommen, J. J. Keurentjes, R. J. Bino and R. D. Hall, Nat. Protoc., 2007, 2, 778–791 CrossRef PubMed.
- L. J. Matheson, W. C. Goldberg, W. D. Bostick and L. Harris, in Handbook of Groundwater Remediation using Permeable Reactive Barriers, ed. D. L. Naftz, S. J. Morrison, C. C. Fuller and J. A. Davis, Academic Press, San Diego, 2003, pp. 343–367, DOI:10.1016/B978-012513563-4/50016-5.
- D. Wang, X. Yang, Z. Wang, X. Hu and G. Zhao, Food Chem., 2019, 117, 296–301 CrossRef.
- Y. G. Pan, Y. X. Li and M. Q. Yuan, Food Chem., 2015, 186, 119–122 CrossRef CAS PubMed.
- Y. Katsuyama, T. Kita and S. Horinouchi, FEBS Lett., 2009, 583, 2799–2803 CrossRef CAS PubMed.
- M. D. C. Ramirez-Ahumada, B. N. Timmermann and D. R. Gang, Phytochemistry, 2006, 67, 2017–2029 CrossRef CAS.
- S. T. Li, O. Lasekan, N. M. Adzahan and N. Hashim, Postharvest Biol. Technol., 2016, 120, 138–144 CrossRef.
- G. B. Martínez-Hernández, F. Artés-Hernández, P. A. Gómez, A. C. Formica and F. Artés, Postharvest Biol. Technol., 2013, 76, 125–134 CrossRef.
- R. M. Roblessánchez, M. A. Rojasgraü, I. Odriozolaserrano, G. Gonzálezaguilar and O. Martinbelloso, LWT–Food Sci. Technol., 2013, 50, 240–246 CrossRef.
- S. Z. Vina and A. R. Chaves, Food Chem., 2006, 94, 68–74 CrossRef CAS.
- B. B. Surjadinata and L. Cisneroszevallos, Food Chem., 2012, 134, 615–624 CrossRef CAS PubMed.
- L. Zhan, Y. Li, J. Hu, L. Pang and H. Fan, Innovative Food Sci. Emerging Technol., 2012, 14, 70–76 CrossRef CAS.
- G. Omsoliu, I. Aguilóaguayo, O. Martínbelloso and R. Solivafortuny, Postharvest Biol. Technol., 2010, 56, 216–222 CrossRef CAS.
- C. Han, Y. Ji, M. Li, X. Li, P. Jin and Y. Zheng, Sci. Hortic., 2016, 212, 203–209 CrossRef CAS.
- R. L. Prior, W. Xianli and S. Karen, J. Agric. Food Chem., 2005, 53, 4290–4302 CrossRef CAS PubMed.
- R. Prior, H. Hoang, L. Gu, X. Wu, M. Bacchiocca, L. Howard, M. Hampsch-Woodill, D. Huang, B. Ou and R. Jacob, J. Agric. Food Chem., 2003, 51, 3273–3279 CrossRef CAS PubMed.
- H. Kameya, J. Watanabe, Y. Takano-Ishikawa and S. Todoriki, Food Chem., 2014, 145, 866–873 CrossRef CAS PubMed.
- Y.-L. Xue, T. Miyakawa, A. Nakamura, K.-i. Hatano, Y. Sawano and M. Tanokura, Mol. Plant, 2015, 8, 1115–1118 CrossRef CAS PubMed.
- H.-Y. Xue, J.-R. Li, Y.-G. Liu, Q. Gao, X.-W. Wang, J.-W. Zhang, M. Tanokura and Y.-L. Xue, Int. J. Biol. Macromol., 2019, 121, 1186–1193 CrossRef CAS PubMed.
Footnote |
| † These authors contributed equally to this work. |
| This journal is © The Royal Society of Chemistry 2020 |