 Open Access Article
Design of a debinding process for polymetallic material green parts fabricated via metal paste injection 3D printing with dual nozzles
Ping Gong,
Xiaokang Yan,
Wei Xiong,
Liang Hao *,
Danna Tang and
Yan Li*
Gemological Institute, China University of Geosciences, Wuhan, 430074, China. E-mail: haoliang@cug.edu.cn; Fax: +86 27 87482950; Tel: +86 27 67884883
First published on 11th May 2020
Abstract
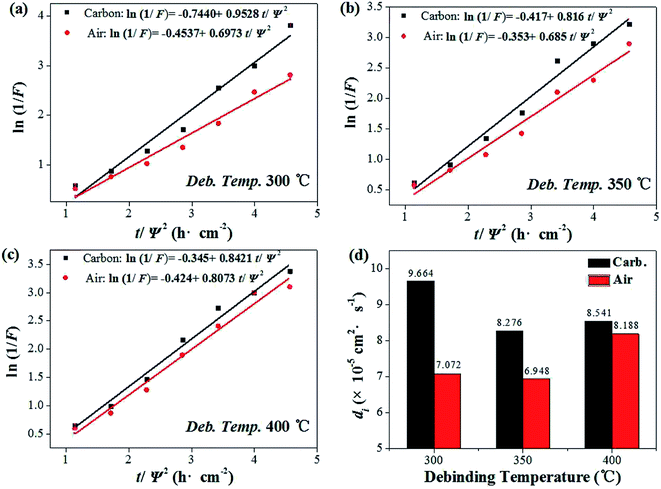
Debinding is one of the most critical processes in metal paste injection 3D printing technology (MPI). In order to design the optimal debinding parameters, the debinding temperature, debinding time and heating rate were discussed from the perspective of dynamics. The results showed that there was a peak in liquid phase mass transfer during debinding, exhibiting the characteristics of migration with debinding temperatures. For gas phase mass transfer, when the temperature was 300 °C, the thermal debinding diffusion coefficient was the largest (9.7 × 10⁻⁵ cm2 s−1) and the corresponding debinding time was 3.5 h. By analyzing the activation energy of the debinding reaction, when the heating rate was 10 °C min−1, the activation energy required for the thermal debinding reaction was the smallest. Combined with the sintering process, the interwoven structural parts of the copper and cupronickel components were finally obtained. The average hardness of the polymetallic parts was 78.8 HV, and the density was 8.1 g cm−3.
1. Introduction
Metal paste injection 3D printing technology (MPI) is a new type of metal 3D printing technology.1,2 It uses the material deposition principle for forming 3D shapes layer-by-layer, similar to Fused Deposition Modeling (FDM).3,4 Compared with selective laser melting (SLM), electron beam melting (EBM) and laser micro sintering (LMS) technology,5–7 MPI has the outstanding advantages of low cost and a wide application range of materials, and also avoids micro-crack defects in laser melting technology,8 showing a broad development prospect in the field of micro-miniature metal parts manufacturing.9 In this work, we improved the laboratory-made MPI equipment that could be used to print polymetallic materials with dual nozzles, which is difficult to achieve via other metal 3D printing technologies.To provide the fluidity of the printed material system, the binder should be utilized in the MPI process. Paraffin wax is a kind of common adhesive which could adjust the viscosity by controlling its content, make the MPI process possible to print metal materials, ceramic materials, polymer materials, composite printing10 and polymetallic materials. The green body printed by the MPI process is subjected to a debinding and sintering stage.
The binder is a component of the green part supporting the metal powder, so it must be completely removed from the body to obtain a sintered body with a dense structure, no defects, and excellent properties. The residue of the binder will destroy the perfect sintering of the metal powder particles and the formation of sintered neck. The thermal debinding method is easy to control compared with other debinding process11,12 (solvent debinding, extraction debinding), and the removal of the binder can be smoothly completed by thermal debinding. In addition, the thermal debinding and sintering integration of the MPI process can be realized.13,14
In order to explore basic scientific issues to develop the optimal debinding process, the mass transfer mechanism and dynamics had been investigated quantitatively in previous publication.15 In this work, the metal paste were separately prepared by using copper powders and cupronickel powders. The copper paste and cupronickel paste were alternately injected layer by layer through the double nozzles to get polymetallic material green parts, after which the debinding temperature, debinding time and heating rate were discussed from the perspective of kinetic analysis. Therefore, it provided a theoretical basis for optimizing the thermal debinding process.
2. Experiment
The copper powders (Avg. 1.5 μm, purity > 99.5%) and cupronickel powders (Avg. 1.5 μm, purity > 99.5%) were utilized to prepare copper paste and cupronickel paste according to the mass ratio (m1![[thin space (1/6-em)]](https://www.rsc.org/images/entities/char_2009.gif) :
:![[thin space (1/6-em)]](https://www.rsc.org/images/entities/char_2009.gif) m2 = 10
m2 = 10![[thin space (1/6-em)]](https://www.rsc.org/images/entities/char_2009.gif) :
:![[thin space (1/6-em)]](https://www.rsc.org/images/entities/char_2009.gif) 1) of powder to paraffin wax (0.9 g cm−3), respectively.
1) of powder to paraffin wax (0.9 g cm−3), respectively.
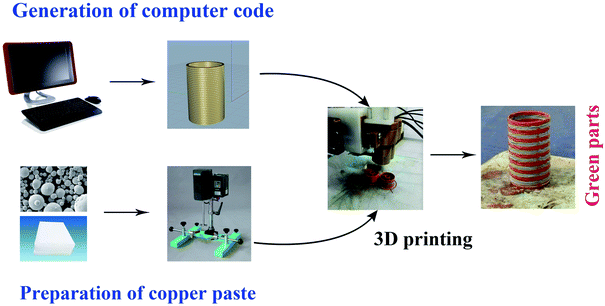
A laboratory based equipment was built, composed of the 3D printer and syringe with double nozzles (0.4 mm in diameter). The copper paste and cupronickel paste were prepared with a preparation device that agitated and heated up the mixed materials. The viscometer (LV DV-II+Pro, America) was utilized to measure the viscosity of the copper paste. The rotation speed was between 18 and 36 rpm and the temperature was set with the change of temperature (65 °C, 70 °C, 75 °C, 80 °C and 85 °C), after which the copper paste and cupronickel paste were printed alternately according to software (Cura 2.1.3). The printing parameters can be described as the drive gear diameter of 7.5 mm, the retraction distance of 1.7 mm and the layer height of 0.55 mm. The printing process, printing equipment and the printed green part were summarized in Fig. 1.
After printing process, the green parts were put into the muffle furnace (SX2-5-12, China) under carbon powder embedding to explore the debinding process. Thermogravimetric analysis (TG-DSC) was tested under N2 atmosphere ramping up from 20 to 1050 °C at a heating rate of 5 °C min−1. The microstructures of samples were observed by a Field Emission Scanning Electron Microscope (FE-SEM, SU8010, Hitachi, Japan). Besides, the debinding ratio, shrinkage and burnout ratio of samples were also investigated. Here, debinding ratio refers to the ratio of removed binder to total binder. The density was measured by a drainage method and the hardness was tested by a digital micro-hardness tester (HVS-1000B).
3. Results and discussion
In order to optimize the debinding process, factors such as viscosity, debinding temperature, debinding time and heating rate were analyzed from the perspective of dynamics.3.1. Determination of viscosity
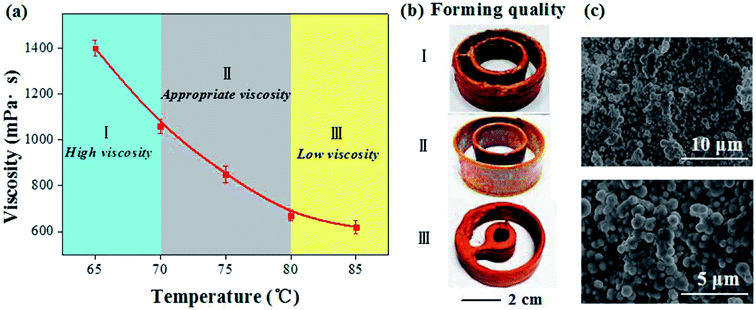
When the material ratio is determined, the viscosity of the material system mainly depends on the mixing temperature. Generally, the higher the paste mixing temperature, the lower the viscosity of the material system will be.16,17 During the printing process, the viscosity of the paste needs to be controlled within a suitable range. If the viscosity is too high, the resistance of the paste is large, which is not favorable for forming; but if the viscosity is too small, the injection paste cannot be solidified well, resulting in failure to form the three-dimensional (3D) structure.Taking copper paste as an example, Fig. 2 showed the relationship between mixing temperature, viscosity and printing quality. When the mixing temperature was raised from 65 °C to 85 °C (Fig. 2a), the viscosity of the paste showed a downward trend. In order to further clarify the suitable mixing temperature, the printing quality at 65–70 °C (1100–1385 mPa s), 70–80 °C (700–1100 mPa s) and 80–85 °C (650–700 mPa s) were tested. It can be found that the print quality corresponding to the interval of 70–80 °C (860 mPa s) was better (Fig. 2b), which was the suitable viscosity interval. By characterizing the micro-structure of the sample printed with the appropriate viscosity interval, uniform copper particles mixed with the binder were exhibited (Fig. 2c).
3.2. Debinding temperature selection strategy
 | ||
| Fig. 3 Thermal analysis of sample: (a) TG- DTA curve of the sample; (b) shrinkage ratio and mass loss ratio curve. | ||
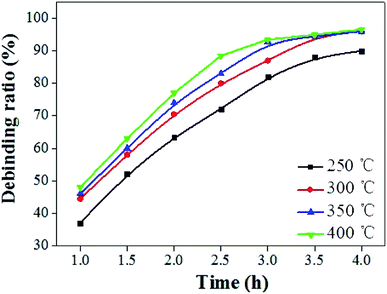
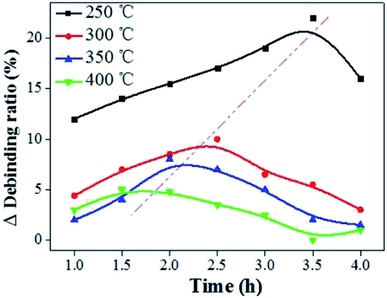
Fig. 3b showed the shrinkage and mass loss ratio curves for the cupronickel paste at different temperatures. It can be seen that the main stage of sample mass loss and shrinkage was also within 400 °C. In order to obtain the optimum debinding temperature, a set of temperature parameters (250 °C, 300 °C, 350 °C, and 400 °C) was designed for comparative analysis. It can be seen that the debinding ratio increased with increasing debinding time and eventually tended to be stable (Fig. 4). Moreover, the higher the debinding temperature, the faster the debinding rate. When the temperature was higher than 300 °C, the final debinding ratio exceeded 95%, but the debinding ratio at 250 °C for 4 h was still less than 90%.
In the debinding environment of carbon powder embedding, the mass transfer pathway of debinding process mainly includes gas phase mass transfer and liquid phase mass transfer. The dominant role is gas phase mass transfer,17–19 so generally using diffusion kinetic equation20,21 and diffusion coefficient22 to quantitatively analyze. The liquid phase mass transfer pathway is characterized by liquid phase migration under capillary force, which can be roughly quantified by calculating the difference in debinding ratio between carbon powder embedding and non-carbon powder.
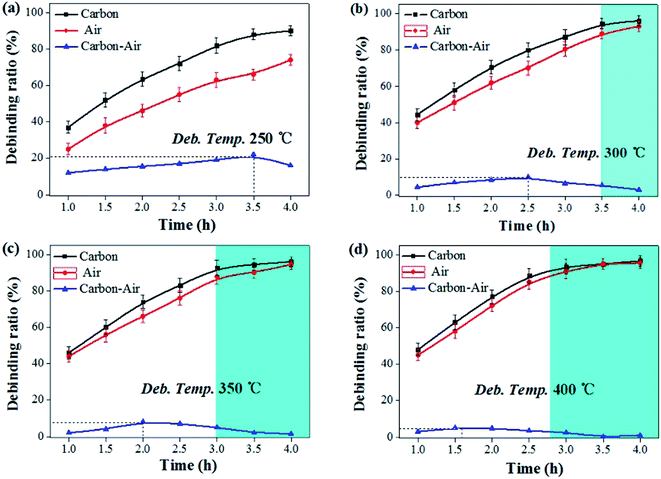
The debinding ratio curves at different temperature under the embedded carbon powder and air environment were illustrated as Fig. 5. The debinding ratio demonstrated a rising trend with time, but the debinding ratio under embedding carbon powder was slightly higher than that in air atmosphere, the difference of which were contributed by the liquid phase migration under capillary forces. It can be found that the higher the temperature, the more the debinding ratio tended to reach a maximum in a short period of time (blue area in the Fig. 5). When the temperature was 300 °C, it took 3.5 h (Fig. 5b). Increasing the temperature to 400 °C, it only took 2.7 h (Fig. 5d).
The liquid phase mass transfer decreased with increasing temperature (Fig. 6). The peak of liquid phase mass transfer effect shifted to the left of the time axis as the temperature increased, indicating that the higher the temperature, the shorter the time when liquid phase mass transfer worked.
 | (1) |
 | (2) |
 | (3) |
3.3. Selection strategy for heating rate
Activation energy (E) is an also important parameter in debinding dynamics. Coats–Redfern method provided an effective theoretical basis for the calculation of activation energy (E). Based on the kinetics of the non-isothermal thermogravimetric loss curve during debinding of MIM, the dynamics mechanism could be expressed as eqn (4):27,28
 | (4) |
 and 1/T shows a linear relationship, so activation energy (E) can be calculated by the slope and intercept via the fitting of them. In this work, it was assumed that the reaction order was 1 (n = 1) and then the fitting results were exhibited as Fig. 8b and Table 1. It can be found that Adj. R-square data shows a good linear relationship. The fitting results show that when the heating rate was 10 °C min−1, the activation energy required for the thermal degreasing reaction was the smallest. The corresponding debinding kinetic equation is eqn (5).
 | (5) |
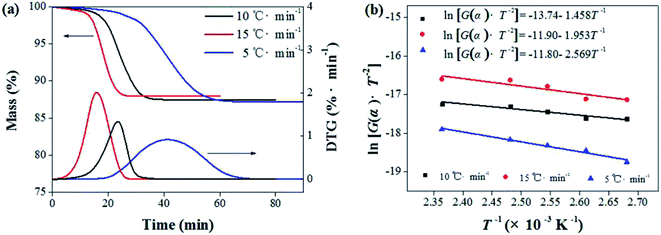 | ||
Fig. 8 Calculation of activation energy: (a) the thermogravimetric and weight loss rate curves at different heating rates; (b) the fitting curves between  and 1/T. and 1/T. | ||
| Heating rate/(°C min−1) | Activation energy, E/(kJ mol−1) | Adj. R-square |
|---|---|---|
| 5 | 21.36 | 0.929 |
| 10 | 12.12 | 0.971 |
| 15 | 16.24 | 0.800 |
3.4. Design and analysis of debinding process
Based on the above analysis, the parameters were determined (debinding temperature 300 °C, heating rate 10 °C min−1, debinding time 3.5 h). After the debinding process was completed, sintering was continued at 950 °C for 2 h, and finally the interwoven structure of copper and cupronickel components was obtained (Fig. 9b). By observing the SEM images (Fig. 9c) of the samples, the evolution of the microstructure in debinding process can be understood. It can be found that the sample has a dense microstructure after the sintering process. The average hardness of sintered parts was 78.8 HV, and the density was 8.1 g cm−3.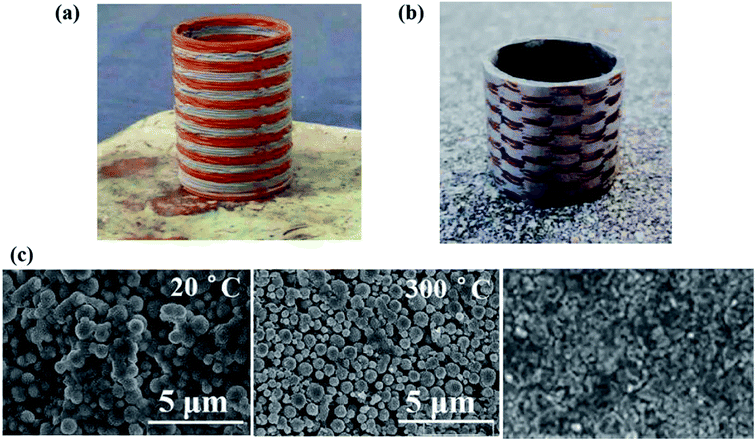 | ||
| Fig. 9 Formed sample and properties: (a) printed polymetallic material green parts; (b) sintered part; (c) SEM images of samples at different stage. | ||
4. Conclusions
In this work, the debinding temperature, debinding time and heating rate were discussed from the perspective of kinetic analysis. The viscosity test results showed that the optimum preparation temperature of the copper paste and cupronickel paste was 70–80 °C. There was a peak in liquid phase mass transfer effect during debinding and exhibited the characteristics of migration with temperatures. For gas phase mass transfer, when the temperature was 300 °C, the thermal debinding diffusion coefficient was the largest (9.7 × 10⁻⁵ cm2 s−1), and the corresponding debinding time was 3.5 h. By analyzing the activation energy of the debinding reaction, when the heating rate was 10 °C min−1, and the activation energy required for the thermal debinding reaction was the smallest. Combined with the sintering process, the interwoven structure of copper and cupronickel components was finally obtained. The average hardness of sintered parts was 78.8 HV, and the density was 8.1 g cm−3. This study provides an innovative approach to the control mechanism of the MPI debinding process, and confirms the feasibility of MPI forming multi-metal material parts at a low cost.Conflicts of interest
There are no conflicts to declare.Acknowledgements
We gratefully acknowledge the financial support by National Natural Science Foundation of China (No. 51675496, No. 51902295 and 51671091), Wuhan City Applied Basic Research Project, China (No. 2017010201010126). This paper is CJHI contribution CJHIWZ-2020001. The authors acknowledge the financial support of a Grant (CJHIXM-S201617) from Center for Jewelry Heritage and Innovation, a Hubei Provincial Key Research Base for Humanity and Social Sciences. The project was also kindly supported by the Fundamental Research Funds for the Central Universities, China University of Geosciences (Wuhan) (No. CUG170677) and Hubei Province Natural Science Foundation grant (No. 2019 CFB264).References
- X. Yan, L. Hao, W. Xiong and D. Tang, Research on influencing factors and its optimization of metal powder injection molding without mold via an innovative 3D printing method, RSC Adv., 2017, 7(87), 55232–55239 RSC.
- X. Yan, C. Wang, W. Xiong, T. Hou and L. Hao, Thermal debinding mass transfer mechanism and dynamics of copper green parts fabricated by an innovative 3D printing method, RSC Adv., 2018, 8(19), 10355–10360 RSC.
- Q. Hu, W. Li, H. Zhang, D. Liu, F. Peng and Y. Duan, Research into topology optimization and the FDM method for a space cracked membrane, Acta Astronaut., 2017, 136, 443–449 CrossRef CAS.
- A. Salea, R. Prathumwan, J. Junpha and K. Subannajui, Metal oxide semiconductor 3D printing: preparation of copper(II) oxide by fused deposition modelling for multi-functional semiconducting applications, J. Mater. Chem. C, 2017, 5, 4614–4620 RSC.
- L. Hirt, A. Reiser, R. Spolenak and T. Zambelli, Additive Manufacturing of Metal Structures at the Micrometer Scale, Adv. Mater., 2017, 29, 1604211 CrossRef PubMed.
- H. Alsalla, H. Liang and C. Smith, Fracture toughness and tensile strength of 316L stainless steel cellular lattice structures manufactured using the selective laser melting technique, Mater. Sci. Eng., A, 2016, 4, 1–6 CrossRef.
- Z. C. Cordero, H. M. Meyer, P. Nandwana and R. R. Dehoff, Powder bed charging during electron-beam additive manufacturing, Acta Mater., 2017, 124, 437–445 CrossRef CAS.
- J. H. Martin, B. D. Yahata, J. M. Hundley, J. A. Mayer and T. A. Schaedler, 3D printing of high-strength aluminium alloys, Nature, 2017, 549, 365–369 CrossRef CAS PubMed.
- M. Vaezi, H. Seitz and S. Yang, A review on 3D micro-additive manufacturing technologies, Int. J. Adv. Des. Manuf. Technol., 2013, 5, 1721–1754 CrossRef.
- D. Tang, L. Hao, Y. Li, W. Xiong, T. Sun and X. Yan, Investigation of Wax-Based Barite Slurry and Deposition for 3D Printing Landslide Model, Composites, Part A, 2018, 108, 99–106 CrossRef CAS.
- M. R. Raza, A. B. Sulong, N. Muhamad, M. N. Akhtar and J. Rajabi, Effects of binder system and processing parameters on formability of porous Ti/HA composite through powder injection molding, Mater. Des., 2015, 87, 386–392 CrossRef CAS.
- M. T. Zaky, Effect of solvent debinding variables on the shape maintenance of green molded bodies, J. Mater. Sci., 2004, 39, 3397–3402 CrossRef CAS.
- P. Bednarek and M. Szafran, Thermal decomposition of monosaccharides derivatives applied in ceramic gelcasting process investigated by the coupled DTA/TG/MS analysis, J. Therm. Anal. Calorim., 2012, 109, 773 CrossRef CAS.
- L. M. Zhang, L. Zhang, L. G. Wang, H. J. Zhou, P. Liu, Z. J. Li and Y. Huang, Debinding of gelcasting Al2O3 green body, Rare Met. Mater. Eng., 2008, 37, 697 Search PubMed.
- X. Yan, C. Wang, W. Xiong, T. Hou and L. Hao, Thermal debinding mass transfer mechanism and dynamics of copper green parts fabricated by an innovative 3D printing method, RSC Adv., 2018, 8(19), 10355–10360 RSC.
- U. Domańska, P. Papis, J. Szydłowski, M. Królikowska and M. Królikowski, Excess Enthalpies of Mixing, Effect of Temperature and Composition on the Density, and Viscosity and Thermodynamic Properties of Binary Systems of {Ammonium-Based Ionic Liquid + Alkanediol}, J. Phys. Chem. B, 2014, 118, 12692–12705 CrossRef PubMed.
- Z. Fu, M. Freihart, T. Schlordt, T. Fey, T. Kraft, P. Greil and N. Travitzky, Robocasting of carbon-alumina core-shell composites using co-extrusion, Rapid Prototyp. J., 2017, 23, 423–433 CrossRef.
- L. Gorjan, A. Dakskobler and T. Kosmač, Partial wick-debinding of low-pressure powder injection-moulded ceramic parts, J. Eur. Ceram. Soc., 2010, 30, 3013–3021 CrossRef CAS.
- V. D. Waal, Periodic and aperiodic close packing: a spontaneous hard-sphere model, J. Chem. Educ., 2017, 62, 293–294 CrossRef.
- Y. Bilotsky, M. Gasik and B. Lev, Diffusion equations in inhomogeneous solid having arbitrary gradient concentration, Condens. Matter Phys., 2017, 20, 13201–13205 CrossRef.
- G. E. Rodriguez, H. Gimperlein, K. J. Painter and J. Stocek, Space-time fractional diffusion in cell movement models with delay, Math. Models Methods Appl. Sci., 2019, 29, 65–88 CrossRef.
- T. Wei and Y. S. Li, Identifying a diffusion coefficient in a time-fractional diffusion equation, Math. Comput. Simulat., 2018, 151, 77–95 CrossRef.
- H. H. Angermann and F. K. Yang, Removal of low molecular weight components during thermal debinding of powder compacts, J. Mater. Sci., 1992, 27, 2534–2538 CrossRef CAS.
- L. Gorjan, A. Dakskobler and T. Kosmač, Partial wick-debinding of low-pressure powder injection-moulded ceramic parts, J. Eur. Ceram. Soc., 2010, 30, 3013–3021 CrossRef CAS.
- T. S. Shivashankar and R. M. German, Effective Length Scale for Predicting Solvent-Debinding Times of Components Produced by Powder Injection Molding, J. Am. Ceram. Soc., 1999, 82, 1146–1152 CrossRef CAS.
- J. Shao, R. Yan, H. Chen, B. Wang and H. L. Dong, Pyrolysis Characteristics and Kinetics of Sewage Sludge by Thermogravimetry Fourier Transform Infrared Analysis, Energy Fuels, 2008, 22, 38–45 CrossRef CAS.
- J. Shao, R. Yan, H. Chen, B. Wang and H. L. Dong, Pyrolysis Characteristics and Kinetics of Sewage Sludge by Thermogravimetry Fourier Transform Infrared Analysis, Energy Fuels, 2008, 22, 38–45 CrossRef CAS.
- M. Alshehri, A. Al-Fawaz and T. Ahamad, Thermal kinetic parameters and evolved gas analysis (TG–FTIR–MS) for thiourea–formaldehyde based polymer metal complexes, J. Anal. Appl. Pyrolysis, 2013, 101, 215–221 CrossRef.
| This journal is © The Royal Society of Chemistry 2020 |

