 Open Access Article
An improved ASM-GDA approach to evaluate the production kinetics of loosely bound and tightly bound extracellular polymeric substances in biological phosphorus removal process†
Hai Cuia,
Shan-Shan Yang *a,
Ji-Wei Panga,
Hai-Rong Mib,
Chen-Chen Nuerb and
Jie Dinga
aState Key Laboratory of Urban Water Resource and Environment, Harbin Institute of Technology, Harbin 150000, PR China. E-mail: shanshanyang@hit.edu.cn
bCollege of Aerospace and Civil Engineering, Harbin Engineering University, Harbin 150001, PR China
First published on 14th January 2020
Abstract
This study established an extended activated sludge model no. 2 (ASM2) for providing a new recognition of the contributions of both loosely-bound EPS (LB-EPS) and tightly-bound EPS (TB-EPS) into phosphorus (P) removal by incorporating their formation and degradation processes during the anaerobic–aerobic cycle. For determining the best-fit values for the new model parameters (kh,TB-EPS, kh,LB-EPS, fPP,TB-EPS, and fPP,LB-EPS) in this extended ASM2, a novel and convenient gradient descent algorithm (GDA) based ASM (ASM-GDA) method was developed. Sensitivity analysis of fPP,TB-EPS, fPP,LB-EPS, kh,TB-EPS, and kh,LB-EPS on the model target outputs of SPO4, XTB-EPS, XLB-EPS, and XPP proved the accuracy of the chosen parameters. Eight batch experiments conducted under different influential chemical oxygen demand (COD) and P conditions were quantitatively and qualitatively analyzed. Respectively, 9.37–9.64% and 4.17–4.29% of P removal by TB-EPS and LB-EPS were achieved. Self-Organizing Map (SOM) has shown its high performance for visualization and abstraction for exhibiting the high correlations of the influential COD/P concentrations and the P% removal by TB-EPS (and LB-EPS). Comprehensive analyses of the influences of influential COD and P concentration on the biological phosphorus removal process help us in successfully establishing the mechanism kinetics of production and degradation of P in a dynamic P biological-treatment model.
1. Introduction
Biological phosphorus removal (BPR) plays an important role in controlling the eutrophication of a water body.1 The success of the BPR process relies mainly on a group of selectively enriched polyphosphate accumulating organisms (PAOs) with phosphorus uptake ability.2,3 It is conventionally considered that the accumulated P by PAOs is transformed to polyphosphate (polyP) and stored inside the cells.4 However, recent studies reveal that microbial cells embedded in their surrounding matrix of EPS collectively form a semi-solid structure and exhibit an important role in biological wastewater treatment processes.5–7 As a complex high-molecular-weight mixture of polymers, the accepted consensus for EPS classification in the literature contains the tightly bound EPS (TB-EPS) forming the inner layer, the loosely bound EPS (LB-EPS) diffusing in the outer layer, and soluble EPS originating from EPS hydrolysis.8,9 As an inevitable transportation pathway of P between bulk solution and PAOs cell, both TB-EPS and LB-EPS are regarded as the P reservoirs, and hence pose significantly influences on the uptake and release of P in BPR processes. More recently, some studies have already provided a new recognition of the contribution of both the LB-EPS and TB-EPS into P removal by proposing a new BPR metabolic model.10 Thereby, it is of great important to learn the roles of LB-EPS, TB-EPS and microbial cells in the contribution and dynamics of P removal in the BPR processes.Mathematical modeling has proven to be essential for understanding the reaction mechanism and kinetics of the complex biological wastewater treatment processes.11 Established earlier by the International Water Association (IWA), popularly used activated sludge models (ASMs) have provided researchers and practitioners with a standardized set of the mechanism model for the biological treatment processes.12–15 Although researches on ASMs mathematical models have contributed to increasing knowledge in the BPR field,16,17 the reaction mechanism by incorporating and exploring the roles of TB-EPS and LB-EPS in BPR process in ASM models were not presented in literatures. To gain a better understanding of the role of EPS in the transformation and transportation of P in a dynamic biological-treatment model, kinetics model of the formation and hydrolysis of XTB-EPS and XLB-EPS being accompanied by new model parameters (new kinetic and stoichiometric parameters) are established in an improved ASM2 in this study. The quantitative determination of the contents and species of P in the formation and hydrolysis of LB-EPS and TB-EPS as well as their kinetics in BPR processes are comprehensively studied.
But what is strikingly noticeable is that, the focus on the applications of ASMs in wastewater treatment and on related research has been on the extension or improvement of traditional ASMs,18–21 comparatively little attention has been paid to develop a convenient and applicable methodology for determining the model parameters of these Monod-based equations, even though this aspect is equally important to the models development. Traditional methods for the evaluation of kinetic parameters require representative data and linearized fitting methods to fit the nonlinear kinetic equations to the data.22 However, there are deficiencies in the use of applying linearized fitting methods to the nonlinear kinetic equations in ASMs which have been recognized for many years, as discussed repeatedly in literatures.22 Additionally, some available measurements for model parameters are often estimated using trial and error methods, and no parameter confidence interval is given, and no independent model validation is provided.23 Therefore, other than the complicated chemical methods or complex models, the importance of developing an effective and convenient methodology for determining the model parameters in the new established LB-EPS and TB-EPS kinetic models is highly emphasized.
Pertaining to machine learning algorithms, a gradient descent algorithm (GDA), which can be used to tune the parameters to best fit a training set of input–output pairs, is a significant general algorithm for experiential learning.24 A GDA is also a quick and effective method for searching extreme values via large, or even infinite sample spaces.25 Possessing significant advantages over traditional methods in the domain of biological wastewater treatment, an improved GDA using the method of ASMs for determining the model coefficients can be applied to any databases and experimental/environmental conditions; meanwhile, it requires no restriction conditions (e.g., temperature, reactor configuration, sewage type, weather, climate, etc.) while establishing the model. In this paper, we develop a novel method for determining the best-fit values for the model parameters in ASMs using an improved GDA based ASM (ASM-GDA) method. To the best of our knowledge, this novel ASM-GDA method with the effective and convenient features is for the first time developed to determine the best-fit values for the model parameters in the improved or extended ASMs in this study.
The objective of this study is to elucidate the relationship between the variations in TB-EPS, LB-EPS, and P components in the anaerobic–aerobic process. An extended ASM2 kinetic modeling by incorporating three new components of XTB-EPS, XLB-EPS, and SEPS is established to better understand the dynamics and their important roles in the BPR process. Another significant contribution of this work is the development of an effective and convenient ASM-GDA approach to determine the best-fit values of the new model parameters. Then experimental data are used to validate this approach. Finally, eight batch experiments conducted under different influential chemical oxygen demand (COD) and P were compared to quantitatively and qualitatively describe the kinetics of LB-EPS and TB-EPS by Self-Organizing Map (SOM) and GDA model.
2. Materials and methods
2.1. Experimental setup and operation
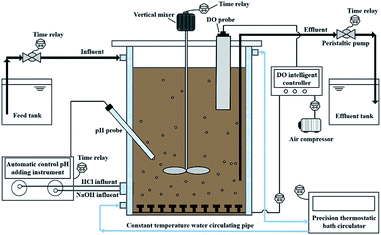
Two parent bench-scale sequencing batch reactors (SBRs) were used in the present work with a diameter of 15 cm, a height of 35 cm and a working volume of 5.0 L, as configured in Fig. 1. Each SBR was seeded to maintain a mixed liquor suspended solids (MLSS) of 3500 ± 500 mg L−1 with activated sludge from a municipal wastewater treatment plant in Harbin. Two SBRs were individually operated under 10.0 ± 0.5 °C (SBR#1) and 20.0 ± 0.5 °C (SBR#2). The constant temperature for the SBRs was maintained by a precision thermostatic bath circulator with the digital temperature controller (Ningbo Tianheng Instrument factory, Ningbo, China). Air was supplied from the bottom of the reactor by aerators and the dissolved oxygen (DO) concentration was maintained at 3.0 mg L−1 during aerobic phase. The DO concentration in each SBR was measured and controlled precisely by a DO probe with a DO industrial intelligent controller (SUP-DM2800, Hangzhou Sinomeasure automation Technology Co., LTd, China). Electric mechanical stirrer was performed to prevent sludge settling, which were run constantly except the time for settling, feeding and decanting. The detailed time schedules for the two SBRs were operated as follows: instantaneous filling, a 2 h of anaerobic period, 3 h of aerobic period, 40 min of sludge settling period, 15 min of decanting period, and 5 min of idling idle phase, making a complete 6 h per cycle. Each SBR was operated for 4 cycles per day. During operation, the pH was maintained at 7.50 ± 0.05 by two automatic titration units (SC-200A, ChangSha Sichen Instrument Technology Co., LTd, China) dosing 1 M HCl and NaOH to avoid the phosphate precipitation. During testing, the synthetic wastewater used as the influent of the two SBRs contained: 256.4 mg L−1 sodium acetate (in chemical oxygen demand), 38.2 mg L−1 NH4Cl, 43.9 mg L−1 KH2PO4, 40 mg L−1 CaCl2, 75 mg L−1 MgSO4 and a trace element solution was further added as described by.26 After about 2 months' cultivation, the sludge characteristics and effluent concentrations in the two SBRs were maintained in steady states. Each measurement was performed in triplicate.To further quantitatively and qualitatively describe the roles of TB-EPS and LB-EPS in the BPR process, eight batch experiments conducted under different influential chemical oxygen demand (COD) concentrations varied from 150 to 300 mg L−1 and influential P concentrations varied from 6 to 15 mg L−1 were conducted: COD and P = 150 and 6 mg L−1 (#1); 150 and 7.5 mg L−1 (#2); 200 and 8 mg L−1 (#3); 200 and 10 mg L−1 (#4); 250 and 10 mg L−1 (#5); 250 and 12.5 mg L−1 (#6); 300 and 12 mg L−1 (#7); 300 and 15 mg L−1 (#8). The COD/P ratios between 20 and 25 recommended for enhanced BPR processes based on previous researches were adopted.27,28
2.2. Model development
The kinetic rates expressions (ρi) of the extended ASM2 are shown in Table S1 (ESI).† The values of the kinetic and stoichiometric parameters together with their definitions are shown in Table S2.† The stoichiometric matrixes of the extended ASM2 are shown in Table S3.†
In this extended ASM2 model, EPS is subdivided into three major fractions: the tightly bound EPS (TB-EPS,XTB-EPS) forming inner layer, the loosely bound EPS (LB-EPS,XLB-EPS) diffusing in outer layer, and the soluble EPS (SEPS) which is also called soluble microbial products (SMP), are weakly bound with the microbial cells or dissolved into bulk solution as the biomass-associated products (BAP).9,29–31
The production and degradation processes of LB-EPS using a Monod-based kinetics were described as proportional to the production of XLB-EPS with a stoichiometric parameter of kLB-EPS/YH. The anaerobic and aerobic hydrolysis processes of LB-EPS convert it to SEPS with stoichiometric parameters of kh,LB-EPS. The third term is the storage and decomposing of XPP with a stoichiometric parameter of fPP,LB-EPS. Eqn (1) and (2) express the kinetic model description of XLB-EPS under anaerobic and aerobic processes:
 | (1) |
 | (2) |
Similarly, eqn (3) and (4) describe the kinetic equation for the model description of XTB-EPS under anaerobic and aerobic processes:
 | (3) |
 | (4) |
 | (5) |
 | (6) |
2.3. A novel ASM-GDA method for the determination of kinetic and stoichiometric parameters coefficients
First, we suppose the size of the sample space of the influent–effluent qualities is m, the space of the kinetic coefficient is n, and that j is the sampling set, i is the components in ASMs, Xouti(j) represents the predictive effluent quality, and Youti(j) represents the actual effluent quality.According to the ordered pairs of the predictive-actual effluent quality, the fitting of these n kinetic coefficients is conducted in m sample spaces. The fitting function is defined as eqn (7):
 | (7) |
The GDA is adopted for its minimum value points (eqn (8)),
 | (8) |
Thus, to find the partial derivative of eqn (7) on each dynamic coefficient, eqn (9) shows:
 | (9) |
Also, according to the ASM model, we have (eqn (10)),
 | (10) |
 | (11) |
Thus, eqn (11) can be expressed as follows:
 | (12) |
 is the step length of the Runge–Kutta method. Therefore,
 | (13) |
Thus,
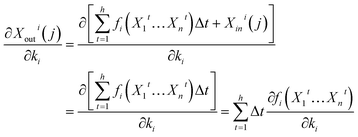 | (14) |
 | (15) |
Furthermore, as can be seen from the ASM model, the function fi(·) can be expressed as a function of Xit, as well as a function of ki. Thus, bringing eqn (14) into eqn (9), eqn (9) can be expressed using the following equation:
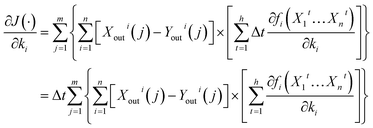 | (16) |
Additionally, bringing eqn (16) into eqn (8), eqn (8) can be expressed using the following:
 | (17) |
Therefore, to conduct the programming based on eqn (17), the optimal fitting kinetic coefficient n in a particular sample space is obtained through the comprehensive consideration of ASMs and the actual influent–effluent qualities of the numerically ordered pairs.
2.4. Analytical methods
3. Results and discussion
3.1. Overall performance of two SBRs
Two lab-scale SBRs performed under 10 ± 0.5 and 20 ± 0.5 °C generally reached steady-state after 1 month inoculation. As shown in Fig. 2a, the MLVSS/MLSS ratio in the two SBRs gradually increased from 55% at the beginning of inoculation up to 92–93% at the steady state, suggesting the well enrichment of biomass during the acclimation period. Fig. 2b shows the observed values of SVI in SBR1# and SBR2# during 60 day steady operation. It can be clearly observed that good SVI values around 31–44 mL g−1 in SBR1# and SBR2# indicated that SBRs operated under 10 °C and 20 °C had no distinguished differences in their settling abilities.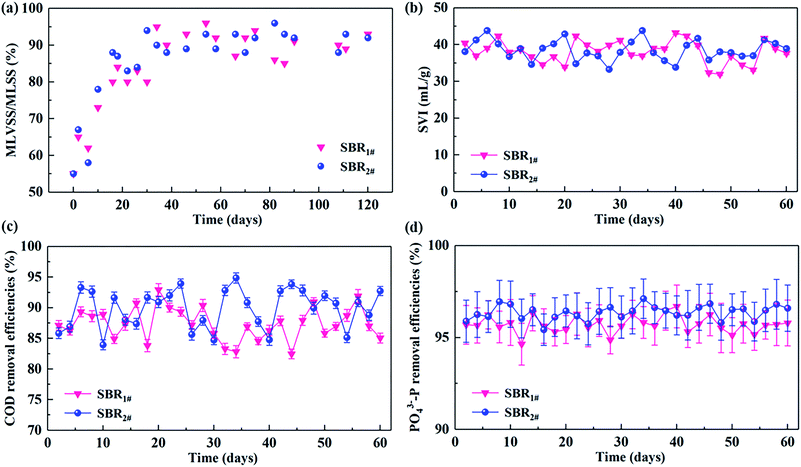 | ||
| Fig. 2 Variations of (a) MLVSS/MLSS ratio, (b) SVI, (c) COD, and (d) PO43−-P in SBR#1 and SBR#2 under 10.0 ± 0.5 and 20.0 ± 0.5 °C. | ||
The alternating anaerobic–aerobic cycle behaviors of COD and P in the effluents of the two SBRs over 60 day steady state were given in Fig. 2c and d. By inoculating an average influent COD concentration of 200 ± 6.85 mg L−1, average effluent COD concentrations in SBR1# and SBR2# were respective 25.19 ± 0.77 and 20.11 ± 1.01 mg L−1, corresponding to the COD removal efficiencies were 87.38 ± 0.82 and 89.91 ± 0.85%, respectively (Fig. 2c). In terms of P removal, the effluent PO43−-P concentrations in the effluent were respective 0.43 ± 0.10 and 0.37 ± 0.11 mg L−1 for SBR1# and SBR2# (Fig. 2d). By comparison, average PO43−-P removal efficiencies of 95.71 ± 0.98 and 96.36 ± 1.09% in SBR1# and SBR2# were observed. Compared with SBR#1 operated under 10 ± 0.5 °C, better COD and P removal abilities in SBR#2 can be observed over 60 days operation period.
3.2. Changes in contents of P, LB-EPS and TB-EPS of two SBRs
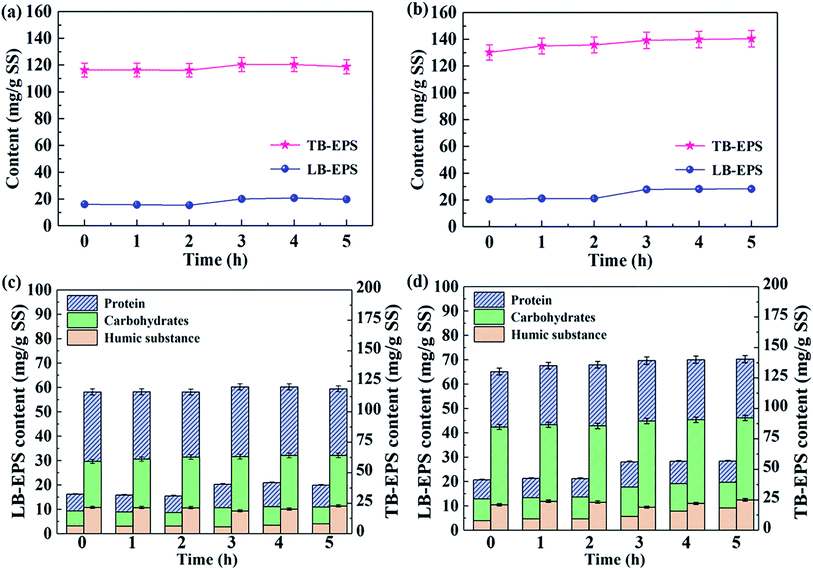
The profiles of the LB-EPS and TB-EPS contents in SBR#1 and SBR#2 were showed in Fig. 3a and b. After about 2 months' cultivation, activated sludge under 10 °C reaction had an initial TB-EPS and LB-EPS contents of 116.38 ± 4.91 and 16.19 ± 0.66 mg g−1 MLSS, while differentiated initial TB-EPS and LB-EPS contents of 130.34 ± 5.73 and 20.65 ± 0.85 mg g−1 MLSS were observed under 20 °C reaction period, suggesting that the contents of LB-EPS and TB-EPS were obviously influenced by the operational temperature. For both the SBRs, the contents of TB-EPS in activated sludge were much higher than those of LB-EPS. Obvious increases in contents of TB-EPS and LB-EPS were observed during external substrate consumption. After the external substrate was completely depleted, both LB-EPS and TB-EPS concentrations did not change significantly, indicating that the formation of both the TB-EPS and LB-EPS mainly occurred during the external substrate consumption period, which this observation was in accordance with the unified theory for EPS production proposed by ref. 29.The operational temperature was also found has significant influences on the contents of carbohydrates, proteins, and humic substances in LB-EPS and TB-EPS (Fig. 3c and d). For the contents of TB-EPS and LB-EPS formed at 10 °C (Fig. 3c), proteins were the predominant component at quantities of 42.45–48.98%, followed by carbohydrates at 32.32–38.84%, while the contents of humic substances accounted for a relative smaller proportion of the TB-EPS and LB-EPS (13.93–20.48%). The predominance of protein contents in the LB-EPS and TB-EPS might be induced by the formation of a large quantity of exoenzymes due to the easy degradation and uptake of readily biodegradable organic acetate, as suggested by previous studies.30,35 While for SBR#2 as shown in Fig. 3d, the predominant content contained in TB-EPS and LB-EPS was carbohydrates. Higher carbohydrates contained in both TB-EPS and LB-EPS in SBR#2 by comparing those of SBR#1 might be induced by their different environmental and operational conditions, as well as their different microbial communities formed during 60 day steady operation.30,36 According to previous investigations,2,37 higher carbohydrates content in EPS was found beneficial for EPS phosphorus removal. Combined with analyses of operation observation in Fig. 2, higher carbohydrates content contained in TB-EPS and LB-EPS might have helped in improving the performance of P removal in SBR#2. The results obtained from the analyses of the carbohydrates, proteins, and humic substances contents in LB-EPS and TB-EPS could provide a better explanation of why the effluent quality from SBR#2 (20 °C) systems was better than that from SBR#1 operated under 10 °C.
Table 1 showed the increased P contents in TB-EPS and LB-EPS from SBR#1 and SBR#2 at the end of aerobic adsorption. Operated under 20 °C in one cycle, up to 3.08 ± 0.12 mg L−1 and 1.37 ± 0.06 mg L−1 of P increased in TB-EPS and LB-EPS had been observed in SBR#2, which respective 9.52 ± 0.37% and 4.23 ± 0.19% of P removal by TB-EPS and LB-EPS were found after 3 h aerobic reaction. Compared with SBR#1, increased P contents in TB-EPS and LB-EPS were relatively lower than those from SBR#2 operated under 20 °C, thus might explain better performance of P removal in SBR#2. Results indicated that TB-EPS played a more important role than LB-EPS. To better understand the dynamics and the important roles of TB-EPS and LB-EPS in BPR process, the data set from SBR#2 operated under 20 °C was chosen for investigations on the extended ASM2 development in the following section.
| Components | 10 °C | 20 °C | ||
|---|---|---|---|---|
| Initiala | Finalb | Initiala | Finalb | |
| a Represents the contents of components in activated sludge from SBR#1 and SBR#2 at the beginning of anaerobic reaction.b Represents the contents of components in activated sludge from SBR#1 and SBR#2 at the end of aerobic reaction. | ||||
| MLSS (mg L−1) | 3583 ± 117 | 3486 ± 126 | 3583 ± 117 | 3448 ± 139 |
| TB-EPS content (mg g−1 MLSS) | 116.38 ± 4.91 | 118.91 ± 5.23 | 130.34 ± 5.73 | 140.49 ± 6.18 |
| LB-EPS content (mg g−1 MLSS) | 16.19 ± 0.66 | 19.88 ± 0.82 | 20.65 ± 0.85 | 28.40 ± 1.16 |
| Protein in TB-EPS (mg g−1 MLSS) | 57.00 ± 2.51 | 54.53 ± 2.40 | 45.51 ± 2.00 | 48.22 ± 2.12 |
| Protein in LB-EPS (mg g−1 MLSS) | 6.87 ± 0.28 | 8.92 ± 0.37 | 7.79 ± 0.32 | 8.78 ± 0.36 |
| Carbohydrates in TB-EPS (mg g−1 MLSS) | 37.61 ± 1.66 | 41.42 ± 1.82 | 63.76 ± 2.81 | 67.18 ± 2.96 |
| Carbohydrates in LB-EPS (mg g−1 MLSS) | 6.10 ± 0.25 | 6.89 ± 0.28 | 8.85 ± 0.36 | 10.46 ± 0.43 |
| Humic substances in TB-EPS (mg g−1 MLSS) | 21.76 ± 0.96 | 22.93 ± 1.01 | 21.06 ± 0.93 | 25.09 ± 1.10 |
| Humic substances in LB-EPS (mg g−1 MLSS) | 3.22 ± 0.13 | 4.07 ± 0.17 | 4.01 ± 0.16 | 9.16 ± 0.38 |
| Increased P content in TB-EPS (mg L−1) | — | 2.67 ± 0.09 | — | 3.08 ± 0.12 |
| Increased P content in LB-EPS (mg L−1) | — | 0.98 ± 0.03 | — | 1.37 ± 0.06 |
| Increased P content in TB-EPS (%) | — | 8.64 ± 0.28 | — | 9.52 ± 0.37 |
| Increased P content in LB-EPS (%) | — | 3.17 ± 0.10 | — | 4.23 ± 0.19 |
3.3. Application of ASM-GDA method
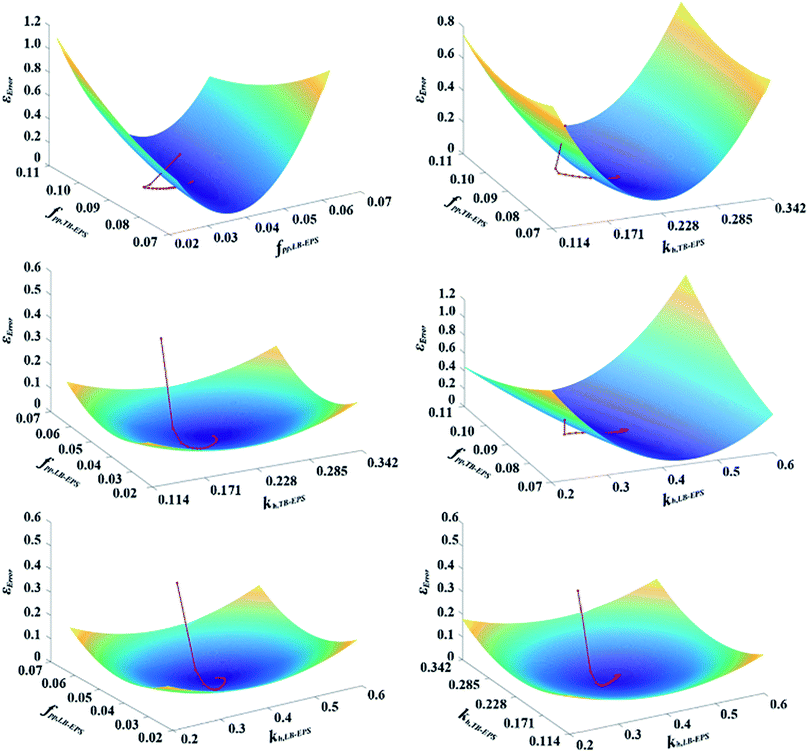
The values of the kinetic and stoichiometric parameters are shown in Table S2.† New parameters of kh,TB-EPS, kh,LB-EPS, fPP,TB-EPS, and fPP,LB-EPS to elucidate the relationship between the variations in TB-EPS, LB-EPS, and P components in the anaerobic–aerobic process are determined based on eqn (11)–(19). Fig. 4 expresses the three-dimensional display of five-dimensional spaces: 3-D plots represent the εError convergence curves under the four new parameters by using the proposed ASM-GDA method. In this study, the data set in Fig. 3 (operated under 20 °C) is applied to estimate the kinetic parameters, then the red curves represented the gradient descent direction, are described to determine these new parameters, kh,TB-EPS, kh,LB-EPS, fPP,TB-EPS, and fPP,LB-EPS (Fig. 4). As shown in Fig. 4, at the terminal of red curve, the extreme point, that is, the final value of the parameter can be found. The partial derivative matrixes of the four parameters derived in eqn (18) and (19) are built to get the optimal values under respective anaerobic and aerobic reactions.
 | (18) |
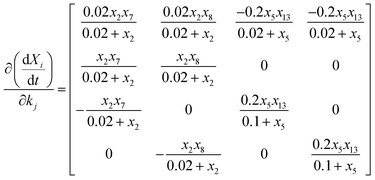 | (19) |
Based on the derived partial derivative matrixes, the three-dimensional display of the five-dimensional space, including εError, kh,TB-EPS, kh,LB-EPS, fPP,TB-EPS, and fPP,LB-EPS, is depicted in Fig. 4. In our work, one experiment was conducted to estimate the initial values. After 50![[thin space (1/6-em)]](https://www.rsc.org/images/entities/char_2009.gif) 156 iterations by the proposed ASM-GDA, the kh,TB-EPS, kh,LB-EPS, fPP,TB-EPS, and fPP,LB-EPS, values were calculated as 0.228 d−1, 0.4 d−1, 0.09 SPO4 per gXTB-EPS, and 0.04 SPO4 per gXLB-EPS, respectively. To evaluate the extent to whether the new parameters used in the extended ASM2 can influence the target output variables (SPO4, XTB-EPS, XLB-EPS, and XPP), the coefficients δi,j of the four new parameters are calculated (eqn (S1)†). According to the sensitivity analysis in ESI,† a 50% increase in the input variable is applied for calculating the normalised sensitivity coefficient (δi,j) in this study. Fig. 5 displays the sensitivity analysis of fPP,TB-EPS, fPP,LB-EPS, kh,TB-EPS, and kh,LB-EPS on the model outputs of SPO4, XTB-EPS, XLB-EPS, and XPP. The sequence of the four parameters influencing the effluent PO43−-P concentrations was fPP,TB-EPS < kh,LB-EPS < fPP,LB-EPS < kh,TB-EPS. Overall, as for the four target output variables, the coefficient δi,j for all the parameters were below 0.5, indicating that the chosen parameters have no significant influences on the four model output variables.
156 iterations by the proposed ASM-GDA, the kh,TB-EPS, kh,LB-EPS, fPP,TB-EPS, and fPP,LB-EPS, values were calculated as 0.228 d−1, 0.4 d−1, 0.09 SPO4 per gXTB-EPS, and 0.04 SPO4 per gXLB-EPS, respectively. To evaluate the extent to whether the new parameters used in the extended ASM2 can influence the target output variables (SPO4, XTB-EPS, XLB-EPS, and XPP), the coefficients δi,j of the four new parameters are calculated (eqn (S1)†). According to the sensitivity analysis in ESI,† a 50% increase in the input variable is applied for calculating the normalised sensitivity coefficient (δi,j) in this study. Fig. 5 displays the sensitivity analysis of fPP,TB-EPS, fPP,LB-EPS, kh,TB-EPS, and kh,LB-EPS on the model outputs of SPO4, XTB-EPS, XLB-EPS, and XPP. The sequence of the four parameters influencing the effluent PO43−-P concentrations was fPP,TB-EPS < kh,LB-EPS < fPP,LB-EPS < kh,TB-EPS. Overall, as for the four target output variables, the coefficient δi,j for all the parameters were below 0.5, indicating that the chosen parameters have no significant influences on the four model output variables.
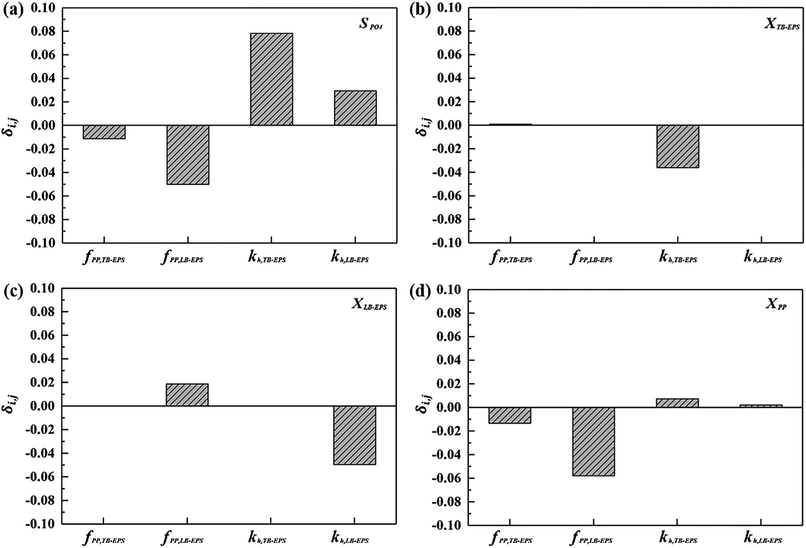 | ||
| Fig. 5 Sensitivity analysis of fPP,TB-EPS, fPP,LB-EPS, kh,TB-EPS, and kh,LB-EPS on the model outputs: (a) SPO4, (b) XTB-EPS, (c) XLB-EPS, and (d) XPP. | ||
For this proposed novel ASM-GDA approach, few or even one data set was needed to obtain the accurate model parameters, as demonstrated in this work. Results indicated that the proposed ASM-GDA model provided a rapid, accurate, and convenient method to determine the model parameters by using any databases. The convenience and accuracy of this method are very attractive for biological wastewater treatment processes, which are typically characterized by their complexity, low repeatability, time-consumption, and the variation of uncertainty in their practical applications.
3.4. Model verification
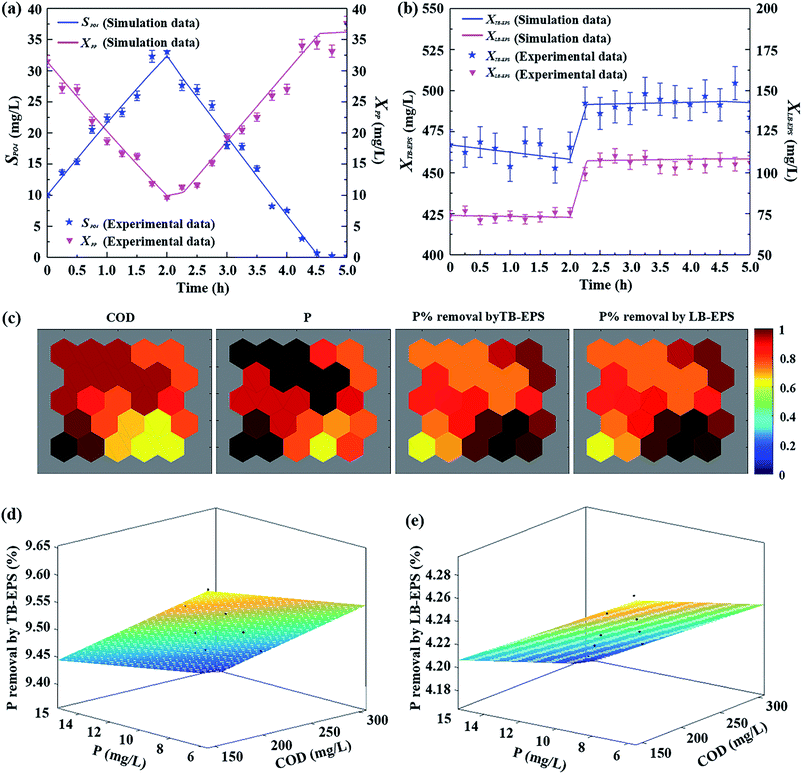
To further evaluate the role of the formation and degradation processes of LB-EPS, TB-EPS, and P in activated sludge and liquid, model verification is conducted through comparing the measured results and the simulated data from batch experiments conducted under different substrate concentrations. Fig. 6a and b compare the variations of the extended ASM2 model simulations and the experimental results of SPO4, XPP, XTB-EPS, and XLB-EPS, with an influential COD of 250 mg L−1 and P of 10 mg L−1. Being accompanied by the release and uptake processes of SPO4 during the alternating anaerobic/aerobic reaction (Fig. 6a), the concentrations of XPP in activated sludge changed first decreased at anaerobic process and then an upward trend at the subsequent aerobic process, while became slightly fluctuation when SPO4 was completely consumed. As shown in Fig. 6a, high correlation analyses values (R2 = 0.987 for SPO4 and R2 = 0.977 for XPP) of measured results and simulated data indicated that the model outputs from the extended ASM2 captured the experimental trends for this experiment in terms of the production and degradation of P under anaerobic/aerobic processes.Observed in Fig. 6b, new components of XTB-EPS and XLB-EPS introduced in this extended ASM2 showed a good agreement between the model outputs and the experimental data. Compared with the simulation data, the maximum differences observed in the measured values of TB-EPS and LB-EPS was 6%, and 95% of the results had a difference of less than 5%, proving the validity of the extended ASM2 with the estimated kinetic parameters. As shown in Fig. 6b, the production of TB-EPS and LB-EPS occurred during substrate consumption period, once the substrate was completely consumed, no further increases in TB-EPS and LB-EPS contents were observed in the modelling and experimental results. Under anaerobic and the latter aerobic processes after the depletion of the external substrate, the slow downward trends in TB-EPS and LB-EPS in activated sludge were attributed to the hydrolysis of EPS or microbial decay.
To evaluate the roles of LB-EPS and TB-EPS in P removal in BPR process, the variations of P components in polyP, TB-EPS, LB-EPS were further calculated. Although 81.15% of P in the liquid was removed through the aerobic storage process of XPP during aerobic reaction, respective 9.49% and 4.22% of P removal by XTB-EPS and XLB-EPS can be observed at the end of P aerobic absorption process. The results further confirmed that TB-EPS played a more important role in P removal than LB-EPS. The contributions of both the TB-EPS and LB-EPS pose significantly influences on the dynamics of anaerobic P-release/aerobic P-uptake in BPR process.
3.5. Influence of influential COD and P on the roles of TB-EPS and LB-EPS in BPR
It is noticed that the process of BPR under alternating anaerobic and aerobic process was dependent upon the initial COD and P concentrations in previous studies.38–40 In order to better understanding the roles of TB-EPS and LB-EPS in the transformation and transportation of P in a dynamic biological-treatment model, eight batch experiments (numbered as #1, #2, …, #8) conducted under different influential COD concentrations varied from 150 to 300 mg L−1 and influential P concentrations varied from 6 to 15 mg L−1 were tested. To analyse the correlation between the influential COD/P concentrations and the P% removal by TB-EPS (and LB-EPS) at the end of aerobic stage, a Self-Organizing Map (SOM), an unsupervised artificial neural network learning algorithm, is applied and details are described in ESI.† Fig. 6c displays the component planes of the intrinsic relationships of the four input data sets obtained from the eight batch experiments. Clustering by SOM, each input data set can be mapped into 25 output neurons being represented by hexagon in the subgraph (Fig. 6c). SOM can extract the eigenvalues of the original input data. The extracted eigenvalues are the output neurons in the SOM.41 In this study, 25 output neurons are used as the feature matrix of the original data, that is, each hexagon in the graph represents a neuron in the output layer, while the number of neurons does not affect the result analysis. The weight of each eigenvalue (neuron) is represented by color.41 Darker color represents higher correlation between each input parameter and the corresponding output neurons. Closer colors of the same intermediate parameters in different subgraphs suggest the stronger correlation between the two inputs. It can be seen from Fig. 6c, there were significantly high correlations between the 4 inputs data sets and the 25 output neurons (r > 0.65). Besides, closer colors (value of chromatism < 0.2) of the corresponding output neurons sites between the influential COD (and P) and the P% removal by TB-EPS (and LB-EPS) demonstrated their stronger correlation, indicating that the SOM has shown its high performance for visualization and abstraction for exhibiting the high correlations of the influential COD/P concentrations and the P% removal by TB-EPS (and LB-EPS) during the BPR process.Further quantitatively analyses of the effects of initial COD and P concentrations on P removal by respective TB-EPS and LB-EPS are showed in Fig. 6d and e. By inoculating with different initial COD and P concentrations, 9.37–9.64% of P removal by TB-EPS (Fig. 6d) and 4.17–4.29% of P removal by LB-EPS (Fig. 6e) were achieved. Through the GDA model, two linear models to explain the relationship between the influential COD and P concentrations with P removal by LB-EPS and TB-EPS at the end of aerobic reaction were obtained: P% removal by TB-EPS = 9.839 − 0.0005795P − 0.02023COD; P% removal by LB-EPS = 4.276 − 0.0002833P − 0.0008372COD. A better understanding of the influence of influential COD and P on BPR processes helps us establishing a comprehensive reference for the mechanism of biological P removal by incorporating the roles of TB-EPS and LB-EPS in BPR process.
4. Conclusions
Experimental data operated under 10 °C and 20 °C were compared to discuss the roles of TB-EPS and LB-EPS in the transformation and transportation of P under an anaerobic–aerobic process. Operational temperature was proved imposes significant influence on the contents of carbohydrates, proteins, and humic substances in LB-EPS and TB-EPS, as well as the capability of P removal in a BPR process.An extended ASM2 kinetic modeling by introducing three new components of XTB-EPS, XLB-EPS, and SEPS was established. An effective and convenient ASM-GDA approach was developed to determine the best-fit values of the new model parameters. Sensitivity analyses indicated that the influencing sequence of the four new parameters for the effluent SPO4 was fPP,TB-EPS < kh,LB-EPS < fPP,LB-EPS < kh,TB-EPS. The model simulations matched the experimental measurements and provided a new recognition into the dynamics reaction mechanism of P by incorporating the roles of LB-EPS and TB-EPS in BPR process.
Eight batch experiments conducted under different influential COD and P were quantitatively and qualitatively analyzed. SOM has shown its high performance for visualization and abstraction for exhibiting the high correlations of the influential COD/P concentrations and the P% removal by TB-EPS (and LB-EPS) during BPR process. Through the GDA model, two linear models were obtained: P% removal by TB-EPS = 9.839 − 0.0005795P − 0.02023COD; P% removal by LB-EPS = 4.276 − 0.0002833P − 0.0008372COD. Results demonstrated that there are 9.37–9.64% of P was removed by TB-EPS and 4.17–4.29% of P was removed by LB-EPS under different influential COD concentrations varied from 150 to 300 mg L−1 and influential P concentrations varied from 6 to 15 mg L−1.
Conflicts of interest
There are no conflicts to declare.Acknowledgements
The authors gratefully acknowledge the financial support by the National Nature Science Foundation of China (Grant No. 51708154), the State Key Laboratory of Urban Water Resource and Environment (Grant No. ES201906), the Key Laboratory of Research center for Eco-Environmental Science, Chinese Academy of Sciences (Grant No. kf2018002).References
- Y. X. Zhao, C. F. Chao, S. Y. Zhai, Z. J. Wang and M. Ji, Treatment of Rural Wastewater Using a Spiral Fiber Based Salinity-Persistent Sequencing Batch Biofilm Reactor, Water, 2017, 9, 970 CrossRef.
- N. Li, N. Ren, X. Wang and H. Kang, Effect of temperature on intracellular phosphorus absorption and extra-cellular phosphorus removal in EBPR process, Bioresour. Technol., 2010, 101, 6265–6268 CrossRef CAS PubMed.
- J. W. Pang, S. S. Yang, L. He, Y. D. Chen, G. L. Cao, L. Zhao, X. Y. Wang and N. Q. Ren, An influent responsive control strategy with machine learning: Q-learning based optimization method for a biological phosphorus removal system, Chemosphere, 2019, 234, 893–901 CrossRef CAS PubMed.
- W. W. Li, H. L. Zhang, G. P. Sheng and H. Q. Yu, Roles of extracellular polymeric substances in enhanced biological phosphorus removal process, Water Res., 2015, 86, 85–95 CrossRef CAS PubMed.
- Q. Li, P. F. Xia, Z. Y. Tao and S. G. Wang, Modeling Biofilms in Water Systems with New Variables: A Review, Water, 2017, 9, 462 CrossRef.
- W. J. Zhang, B. D. Cao, D. S. Wang, T. Ma and D. H. Yu, Variations in distribution and composition of extracellular polymeric substances (EPS) of biological sludge under potassium ferrate conditioning: Effects of pH and ferrate dosage, Biochem. Eng. J., 2016, 106, 37–47 CrossRef CAS.
- B. Wang, X. Liu, J. Chen, D. Peng and F. He, Composition and functional group characterization of extracellular polymeric substances (EPS) in activated sludge: the impacts of polymerization degree of proteinaceous substrates, Water Res., 2018, 129, 133–142 CrossRef CAS PubMed.
- P. N. Hong, R. Honda, M. Noguchi and T. Ito, Optimum selection of extraction methods of extracellular polymeric substances in activated sludge for effective extraction of the target components, Biochem. Eng. J., 2017, 127, 136–146 CrossRef CAS.
- Y. Shi, J. Huang, G. Zeng, Y. Gu, Y. Chen, Y. Hu, B. Tang, J. Zhou, L. Yang and L. Shi, Exploiting extracellular polymeric substances (EPS) controlling strategies for performance enhancement of biological wastewater treatments: An overview, Chemosphere, 2017, 180, 396–411 CrossRef CAS PubMed.
- X. Long, R. Tan, Z. Fang, C. Xie, Y. Li and G. Xian, The roles of loosely-bound and tightly-bound extracellular polymer substances in enhanced biological phosphorus removal, Chemosphere, 2017, 189, 679–688 CrossRef CAS PubMed.
- Q. He, Q. Song, S. Zhang, W. Zhang and H. Wang, Simultaneous nitrification, denitrification and phosphorus removal in an aerobic granular sequencing batch reactor with mixed carbon sources: reactor performance, extracellular polymeric substances and microbial successions, Chem. Eng. J., 2018, 331, 841–849 CrossRef CAS.
- M. Henze, W. Gujer, T. Mino, T. Matsuo, M. C. Wentzel, G. V. R. Marais and L. M. C. M. Van, Activated sludge model No. 2d, Water Sci. Technol., 1999, 39, 165–182 CrossRef CAS.
- X. Wu, Y. Yang, G. Wu, J. Mao and T. Zhou, Simulation and optimization of a coking wastewater biological treatment process by activated sludge models (ASM), J. Environ. Manage., 2016, 165, 235–242 CrossRef CAS PubMed.
- S. Yang, W. Guo, Y. Chen, S. Peng, J. Du, H. Zheng, X. Feng and N. Ren, Simultaneous in situ sludge reduction and nutrient removal in an A2MO-M system: Performances, mechanisms, and modeling with an extended ASM2d model, Water Res., 2016, 88, 524–537 CrossRef CAS PubMed.
- J. E. Baeten, L. M. C. M. Van and E. I. P. Volcke, Modelling aerobic granular sludge reactors through apparent half-saturation coefficients, Water Res., 2018, 146, 134–145 CrossRef CAS PubMed.
- M. F. R. Zuthi, W. S. Guo, H. H. Ngo, L. D. Nghiem and F. I. Hai, Enhanced biological phosphorus removal and its modeling for the activated sludge and membrane bioreactor processes, Bioresour. Technol., 2013, 139, 363–374 CrossRef CAS PubMed.
- A. B. Lanham, A. Oehmen, A. M. Saunders, G. Carvalho, P. H. Nielsen and M. A. M. Reis, Metabolic modelling of full-scale enhanced biological phosphorus removal sludge, Water Res., 2014, 66, 283–295 CrossRef CAS PubMed.
- Z. Y. Zhu, R. Y. Wang and Y. M. Li, Evaluation of the control strategy for aeration energy reduction in a nutrient removing wastewater treatment plant based on the coupling of ASM1 to an aeration model, Biochem. Eng. J., 2017, 124, 44–53 CrossRef CAS.
- B. Ni, R. Zeng, F. Fang, W. Xie, G. Sheng and H. Yu, Fractionating soluble microbial products in the activated sludge process, Water Res., 2010, 44, 2292–2302 CrossRef CAS PubMed.
- J. Climent, L. Basiero, R. Martínez-Cuenca, J. G. Berlanga, B. Julián-López and S. Chiva, Biological reactor retrofitting using CFD-ASM modelling, Chem. Eng. J., 2018, 348, 1–14 CrossRef CAS.
- R. Chris, G. Sara, H. Claire, P. Julio and L. M. C. M. Van, Incorporating the influent cellulose fraction in activated sludge modelling, Water Res., 2018, 144, 104–111 CrossRef PubMed.
- L. H. Smith, P. L. McCarty and P. K. Kitanidis, Spreadsheet Method for Evaluation of Biochemical Reaction Rate Coefficients and Their Uncertainties by Weighted Nonlinear Least-Squares Analysis of the Integrated Monod Equation, Appl. Environ. Microbiol., 1998, 64, 2044–2050 CrossRef CAS PubMed.
- B. Ni, F. Fang, W. Xie, J. Xu and H. Yu, Formation of Distinct Soluble Microbial Products by Activated Sludge: Kinetic Analysis and Quantitative Determination, Environ. Sci. Technol., 2012, 46, 1667–1674 CrossRef CAS PubMed.
- S. Pathan, K. G. Prabhu and P. C. Siddalingaswamy, Techniques and algorithms for computer aided diagnosis of pigmented skin lesions-A review, Biomed. Signal Process. Control, 2018, 39, 237–262 CrossRef.
- T. M. Mitchell, Machine Learning, McGraw-Hill Science/Engineering/Math, 1997, March 1, pp. 367–379, ISBN: 0070428077 Search PubMed.
- H. Zhang, W. Fang, Y. Wang, G. Sheng, R. Zeng, W. Li and H. Yu, Phosphorus Removal in an Enhanced Biological Phosphorus Removal Process: Roles of Extracellular Polymeric Substances, Environ. Sci. Technol., 2013, 47, 11482–11489 CrossRef CAS PubMed.
- A. Z. Gu, A. Saunders, J. B. Neethling, H. D. Stensel and L. L. Blackall, Functionally relevant microorganisms to enhanced biological phosphorus removal performance at full-scale wastewater treatment plants in the United States, Water Environ. Res., 2008, 80, 688–698 CrossRef CAS.
- A. Onnis-Hayden, N. Majed, A. Schramm and A. Z. Gu, Process optimization by decoupled control of key microbial populations: Distribution of activity and abundance of polyphosphate-accumulating organisms and nitrifying populations in a full-scale IFAS-EBPR plant, Water Res., 2011, 45, 3845–3854 CrossRef CAS PubMed.
- C. S. Laspidou and B. E. Rittmann, Non-steady state modeling of extracellular polymeric substances, soluble microbial products, and active and inert biomass, Water Res., 2002, 36, 1983–1992 CrossRef CAS PubMed.
- X. Li and S. Yang, Influence of loosely bound extracellular polymeric substances (EPS) on the flocculation, sedimentation and dewaterability of activated sludge, Water Res., 2007, 41, 1022–1030 CrossRef CAS PubMed.
- G. Yu, P. He and L. Shao, Characteristics of extracellular polymeric substances (EPS) fractions from excess sludges and their effects on bioflocculability, Bioresour. Technol., 2009, 100, 3193–3198 CrossRef CAS PubMed.
- Standard Methods for the Examination of Water and Wastewater, American Public Health Association (APHA), Washington DC, USA, 21st edn, 2005 Search PubMed.
- Y. Ge, Phosphorus Removal Effect and Microbial Community Structure Analyses in the EBPR system, Doctor's degree dissertation, Tianjin University, 2012 Search PubMed.
- J. Myung, W. M. Galega, J. D. Van Nostrand, T. Yuan, J. Zhou and C. S. Criddle, Long-term cultivation of a stable Methylocystis-dominated methanotrophic enrichment enabling tailored production of poly(3-hydroxybutyrate-co-3-hydroxyvalerate), Bioresour. Technol., 2015, 198, 811–818 CrossRef CAS PubMed.
- D. T. Spona, Investigation of extracellular polymer substances (EPS) and physicochemical properties of different activated sludge flocs under steady-state conditions, Enzyme Microb. Technol., 2003, 32, 375–385 CrossRef.
- D. T. Sponza, Investigation of extracellular polymer substances (EPS) and physicochemical properties of different activated sludge flocs under steady-state conditions, Enzyme Microb. Technol., 2003, 32, 375–385 CrossRef CAS.
- Y. Liu, S. Yu, G. Xue and F. Zhao, Role of extracellular exopolymers in biological phosphorus removal, Water Sci. Technol., 2006, 54, 257–265 CrossRef CAS PubMed.
- Y. Wang, Y. Peng and T. Stephenson, Effect of influent nutrient ratios and hydraulic retention time (HRT) on simultaneous phosphorus and nitrogen removal in a two-sludge sequencing batch reactor process, Bioresour. Technol., 2009, 100, 3506–3512 CrossRef CAS PubMed.
- G. Bertanza, R. Pedrazzani, L. Manili and L. Menoni, Bio-P release in the final clarifiers of a large WWTP with co-precipitation: Key factors and troubleshooting, Chem. Eng. J., 2013, 230, 195–201 CrossRef CAS.
- H. Chen, Y. Liu, B. Ni, Q. Wang, D. Wang, C. Zhang, X. Li and G. Zeng, Full-scale evaluation of aerobic/extended-idle regime inducing biological phosphorus removal and its integration with intermittent sand filter to treat domestic sewage discharged from highway rest area, Biochem. Eng. J., 2016, 113, 114–122 CrossRef CAS.
- S. O. Haykin, Neural Networks and Learning Machines, McMaster University, Ontario Canada, 3rd edn, 2009 Search PubMed.
Footnote |
| † Electronic supplementary information (ESI) available. See DOI: 10.1039/c9ra06845g |
| This journal is © The Royal Society of Chemistry 2020 |

