 Open Access Article
Study on the dynamic characteristics of soft soil†
Feng Qiao a,
JingShan Boab,
WenHao Qia,
Liang Wangc,
ChaoYu Changab,
ZhaoPeng Zhangd and
Jing Wang*e
aKey Laboratory of Earthquake Engineering and Engineering Vibration, Institute of Engineering Mechanics, China Earthquake Administration, Harbin 150080, China
bInstitute of Disaster Prevention, Sanhe 065201, China
cXian Research Institute of China Coal Research Institute, Xi'an 710077, China
dNorth University of China, Taiyuan 030051, China
eSichuan Earthquake Administration, Chengdu 610041, China. E-mail: 627725128@qq.com
First published on 29th January 2020
Abstract
Soft soil is a special type of under-consolidated soil widely distributed in coastal areas of China. In recent years, with the rapid development of Tianjin, an increasing number of public and civil buildings have been built on soft soil. Soft soil poses an imperceptible risk to the safety of buildings in the area. This paper statistically analyzes the physical and dynamic properties of soft soil in Tianjin, and gives the corresponding range values. The results are as follows. (1) Except for the liquidity index, there is a certain correlation between other physical properties; (2) analyzed by experiment, the effects of consolidation time, consolidation ratio, and effective confining pressure on the dynamic shear modulus ratio and damping ratio of soft soil are given. (3) A model of the relationship between shear wave velocity and burial depth of clay and silty clay in the region is given. (4) The influence of different kinetic parameters on the design response spectrum is analyzed. The work described in this article is valuable for workers engaged in soft soil research.
1. Introduction
Soft soil is a special type of under-consolidated soil widely distributed in coastal areas of China and has characteristics of high water content, low strength and large deformation; it is generally not suitable for use in construction engineering. The regulations for geotechnical investigation in soft clay areas stipulates1 that when the fortification intensity is equal to or greater than 7 degrees, the possibility of soft soil subsidence should be discriminated for areas with distributions of thick soft soil.Located on the west side of Bohai Bay, Tianjin has a 153 km long muddy coastline. Tianjin soft soil is a typical soft soil area. In recent years, China has aggressively developed coastal areas. Tianjin is an important city due to its superior geographical location, abundant natural resources and low-cost wasteland and tidal flats. However, with the rapid development of the economy, an increasing number of buildings have to be built on soft soil, so the problem of determining the characteristics of Tianjin soft soil has become an important constraint for engineering construction. The soft soil subsidence and the magnified effect of the soft soil sites pose a serious threat to the foundation stability and seismic design of the buildings in the area.2 During the Tangshan earthquake, some high-intensity anomalies formed in the area.3 Peng Yanju4 conducted a seismic response analysis on a Tianjin coastal soft soil site and found that the soft soil creates a significant ground motion amplification effect; the peak acceleration was amplified 1.9 times at this site.
This paper collected 134 drilling measurement datasets in the Tianjin area and supplemented that drilling data with data from 7 new drilling holes, totalling 141 drilling datasets. Through the classification of the drilling data, and using SPSS software, the relationship between the physical and dynamic properties of soft soil in Tianjin was studied, and the effects of different dynamic parameters and ground motion input on the design response spectrum were studied.
2. Research area geological overview
Tianjin is located in the northeast of the North China Platform and east of the Bohai Sea. Tianjin was constructed in the north-central part of a fault block depression. Furthermore, it is located at the intersection of the Hebei Plain fault zone (northeast) and the Zhangjiakou–Bohai fault zone (northwest); the strong earthquakes occurring in the area are mainly caused by these two sets of fault zones.5The Quaternary system in Tianjin is divided into the Pixian County mountainous area, the northern plains area and the southern plains area. The mountainous area and the northern plains area of Jizhou District mainly consist of terrestrial alluvial and alluvial deposits; the Quaternary sedimentary deposit in this area is thin, and the lithofacies change rapidly. The southern plains are dominated by alluvial, lake and marine deposits. The widely distributed Quaternary sedimentary deposit is this area is thick and stable.6–9
The Tianjin area was dominated by terrestrial facies during the early and middle Pleistocene, and the oceanic effect during this time was small; since the late Pleistocene, the oceanic effect has been strong, and the western margin of the Bohai Bay is dominated by marine sediments, forming a typical marine–continental interaction stratum in Tianjin. The first marine layer formed in the middle Holocene is mainly composed of silty soil and is the main soft soil foundation in Tianjin. This horizon hosts a relatively high concentration of engineering geological problems in the region.10 The main sludge and silty soil characteristics in this area are as follows.
Silt: grey or taupe. Fluid-like, high-plasticity, uneven soil, containing a small amount of broken shells, partially mixed with a large amount of silt and silty sand, with a thin interlayer of silt.
Silt soil (clay and silty clay): grey. Soft, plastic, uneven soil, containing a small amount of broken shells and silt clumps, with a thin interlayer of silt.
3. Physical properties of the soft soil
3.1 Overview of the physical properties of the soft soil
The physical property values of silt, clay and silty clay were extracted from 141 borehole data in Tianjin, and the range of corresponding material properties of soft soil in Tianjin was given (the scatter plot is proven in ESI Appendix 1–3†). Analysis of the correlation between the indicators. The results are as follows.(1) Silt. The water content is between 53.2% and 82.4%; the void ratio is between 1.46 and 2.37; the density is between 1.48 and 1.73 g cm3; the liquid limit is between 43.4% and 55.6%; and the plastic limit is between 23.7% and 27.9%. The liquidity index is between 1.08 and 2.6; the plasticity index is between 19.5 and 27.7.
(2) Clay. The water content is between 35.3% and 57.5%; the void ratio is between 1.00 and 1.68; the density is between 1.61 and 1.90 g cm3; the liquid limit is between 32.4% and 56.5%; and the plastic limit is between 18.1% and 30.2%. The liquidity index is between 0.57 and 1.62; the plasticity index is between 13.9 and 26.3.
(3) Silty clay. The water content is between 35.1% and 55.1%; the void ratio is between 1.00 and 1.56; the density is between 1.62 and 1.86 g cm3; the liquid limit is between 26.7% and 52.3%; and the plastic limit is between 13.4% to 28.0%. The liquidity index is between 0.73 and 2.48; the plasticity index is between 11.4 and 24.3.
Through the analysis of the physical property index values of the Tianjin soft soil, it is proven that (1) the coefficient of variations of the various physical property indexes of soft soil are low, indicating that the index values have good stability, and that (2) the correlation coefficients for the physical property indexes of the soft soil are greater than 0.5, and those for the value of each index are less than 0.5, indicating that there is a relationship between various physical properties.
3.2 Correlation analysis between physical properties of the soft soil
In this paper, SPSS software is used to analyse the correlation between physical properties of the soft soil in Tianjin. Tables 1–3 compare various regression fitting equations, from which the optimal model is selected (the scatter plot is proven in ESI Appendix 1–3†).| Regression equation | Goodness of fit | Correlation coefficient | Regression equation | Goodness of fit | Correlation coefficient | ||
|---|---|---|---|---|---|---|---|
| a ω is the natural water content, e is the void ratio, ρ is the density, ωL is the liquid limit, ωP is the plastic limit, IL is the liquidity index, and IP is the plasticity index. | |||||||
| 1 | e = 0.0296ω − 0.1179 | 0.98 | 0.99 | 10 | IL = 1.0494e2 − 2.9296e + 3.3896 | 0.71 | 0.82 |
| 2 | ρ = −0.0071ω + 2.0744 | 0.90 | 0.95 | 11 | IP = −8.9098e2 + 39.538e − 16.772 | 0.54 | 0.70 |
| 3 | ωL = −0.0172ω2 + 2.6045ω − 44.391 | 0.70 | 0.77 | 12 | ωL = −214.85ρ2 + 656.83ρ − 448.52 | 0.54 | 0.69 |
| 4 | ωP = −0.0022ω2 + 0.4093ω + 9.0174 | 0.69 | 0.82 | 13 | ωP = −39.378ρ2 + 112.19ρ − 52.183 | 0.70 | 0.83 |
| 5 | IL = 0.0012ω2 − 0.1326ω + 4.9448 | 0.75 | 0.83 | 14 | IP = −180.083ρ2 + 558.35ρ − 406.26 | 0.54 | 0.65 |
| 6 | IP = −0.0083ω2 + 1.2944ω − 23.303 | 0.54 | 0.70 | 15 | ωP = 0.344ωL + 8.5092 | 0.73 | 0.85 |
| 7 | ρ = −0.2443e + 2.0572 | 0.96 | 0.98 | 16 | IP = 0.6692ωL − 9.1832 | 0.93 | 0.96 |
| 8 | ωL = −14.199e2 + 62.215e − 14.193 | 0.59 | 0.73 | 17 | IP = 1.2714ωP − 8.12 | 0.54 | 0.73 |
| 9 | ωP = −4.5394e2 + 20.589e + 4.0415 | 0.74 | 0.83 | ||||
| Regression equation | Goodness of fit | Correlation coefficient | Regression equation | Goodness of fit | Correlation coefficient | ||
|---|---|---|---|---|---|---|---|
| a ω is the natural water content, e is the void ratio, ρ is the density, ωL is the liquid limit, ωP is the plastic limit, IL is the liquidity index, and IP is the plasticity index. | |||||||
| 1 | e = 0.0282ω − 0.0016 | 0.95 | 0.97 | 7 | IP = 14.778e + 1.0117 | 0.78 | 0.88 |
| 2 | ρ = −0.0084ω + 2.1368 | 0.74 | 0.86 | 8 | ωL = 126.22ρ2 − 515.2ρ + 557.71 | 0.58 | 0.76 |
| 3 | ωL = 0.8707ω + 3.293 | 0.84 | 0.92 | 9 | ωP = 98.508ρ2 − 382.74ρ + 390.92 | 0.59 | 0.75 |
| 4 | ωP = 0.0078ω2 − 0.2677ω + 18.877 | 0.80 | 0.89 | 10 | ωP = 0.5078ωL + 1.2231 | 0.92 | 0.96 |
| 5 | IP = 0.4246ω + 0.5761 | 0.76 | 0.87 | 11 | IP = 0.4915ωL − 1.1916 | 0.92 | 0.96 |
| 6 | ρ = 0.1997e2 − 0.8427e + 2.5001 | 0.89 | 0.94 | 12 | IP = 0.8187ωP + 0.9869 | 0.71 | 0.84 |
| Regression equation | Goodness of fit | Correlation coefficient | Regression equation | Goodness of fit | Correlation coefficient | ||
|---|---|---|---|---|---|---|---|
| a ω is the natural water content, e is the void ratio, ρ is the density, ωL is the liquid limit, ωP is the plastic limit, IL is the liquidity index, and IP is the plasticity index. | |||||||
| 1 | e = 0.0267ω + 0.0543 | 0.96 | 0.98 | 8 | ωP = −8.0079e2 + 33.503e − 7.1824 | 0.66 | 0.81 |
| 2 | ρ = −0.0092ω + 2.1662 | 0.86 | 0.93 | 9 | IP = 12.22e2 − 16.143e + 17.822 | 0.53 | 0.72 |
| 3 | ωL = 0.0123ω2 − 0.4672ω + 33.86 | 0.60 | 0.77 | 10 | ωL = 125.78ρ2 − 504.53ρ + 535.48 | 0.59 | 0.76 |
| 4 | ωP = −0.0042ω2 + 0.7277ω − 2.1384 | 0.62 | 0.78 | 11 | ωP = −37.452ρ + 87.631 | 0.62 | 0.79 |
| 5 | IP = 0.0099ω2 − 0.4891ω + 18.81 | 0.51 | 0.70 | 12 | ωP = 0.5309ωL + 1.6425 | 0.74 | 0.86 |
| 6 | ρ = −0.3493e + 2.1918 | 0.92 | 0.96 | 13 | IP = 0.4691ωL − 1.6425 | 0.69 | 0.83 |
| 7 | ωL = 9.6916e2 − 0.6796e + 23.513 | 0.65 | 0.80 | 14 | IP = 0.0715ωP2 − 2.3741ωP + 33.681 | 0.51 | 0.66 |
(1) Silt. There is a certain relationship among the natural water content, void ratio, density, liquid limit, plastic limit, and plasticity index; the correlation coefficient for the natural water content, void ratio and density is greater than 0.95, indicating a significant correlation between these three properties. There are significant correlations between the liquid index and the natural water content and pore ratio, but the correlations with the other four indicators are poor (Table 1).
(2) Clay. There is a significant correlation among the natural moisture content, the liquid limit, the plastic limit, and the plasticity index. There are significant correlations between the void ratio and the natural water content, density, and plasticity index, but the correlation between the liquid limit and the plastic limit is poor. There are significant correlations between the density and the natural water content, pore ratio, density, liquid limit, and plastic limit, but the correlation with the plasticity index is poor. The correlations between the liquid index and the above six indicators are poor (Table 2).
(3) Silty clay. There is a significant correlation among the natural moisture content, the pore ratio, the liquid limit, the plastic limit, and the plasticity index. There re significant correlations between the density and the natural water content, void ratio, liquid limit, and plastic limit, but the correlation between the liquid index and the plasticity index is poor. The correlations between the liquid index and the above six indicators are poor. The correlation coefficient among the natural water content, void ratio and density is greater than 0.90, indicating that the three have a significant correlation (Table 3).
From Tables 1–3 and ESI Appendix Fig. 1–3,† we can prove that the discreteness of physical properties is the main factor affecting the fitting.
4. Dynamic shear modulus ratio and damping ratio of soft soil
The dynamic shear modulus ratio and the damping ratio are important kinetic parameters of soil and are also important indicators of the dynamic characteristics of soils. They are also an indispensable parameter in site seismic response analysis calculations. The dynamic shear modulus and damping ratio describe the deformation characteristics of soil under dynamic loading, the dynamic shear modulus decreases with increasing shear strain, and damping ratio increases with increasing shear strain. Both the dynamic shear modulus ratio and the damping ratio can be obtained by indoor dynamic triaxial and resonant column testing.11,12 The dynamic triaxial test can closely simulate the stress of the actual environment of the soil. Cyclic loading is used to determine the dynamic elastic modulus and damping ratio of the soil. The relationship between the dynamic shear modulus and the dynamic elastic modulus of the soil the conversion is performed to obtain the required dynamic shear modulus and damping ratio. The resonance column test uses the propagation characteristics of vibration waves to determine the dynamic shear modulus and damping ratio of the soil. This paper summarizes the range of dynamic shear modulus ratio and damping ratio of soft soil in Tianjin by statistics of 141 drilling data (Tables 4 and 5). Notably, due to the small amount of sludge data, only the ranges for the silt soil are given.| Parameter | Shear strain (10−4) | ||||||||
|---|---|---|---|---|---|---|---|---|---|
| 0.05 | 0.1 | 0.5 | 1 | 5 | 10 | 50 | 100 | ||
| a G/Gmax is the dynamic shear modulus ratio, λ is the damping ratio. | |||||||||
| Maximum value | G/Gmax | 0.9991 | 0.9982 | 0.9910 | 0.9821 | 0.9163 | 0.8456 | 0.5227 | 0.5210 |
| λ | 0.0658 | 0.0742 | 0.0996 | 0.1136 | 0.1672 | 0.1953 | 0.3232 | 0.3285 | |
| Minimum value | G/Gmax | 0.9878 | 0.9758 | 0.8897 | 0.8013 | 0.4455 | 0.2874 | 0.0747 | 0.0388 |
| λ | 0.0151 | 0.0201 | 0.0385 | 0.0506 | 0.0904 | 0.1108 | 0.1490 | 0.1572 | |
| Average value | G/Gmax | 0.9960 | 0.9921 | 0.9619 | 0.9272 | 0.7269 | 0.5777 | 0.2277 | 0.1439 |
| λ | 0.0371 | 0.0458 | 0.0741 | 0.0909 | 0.1373 | 0.1581 | 0.1951 | 0.2030 | |
| Parameter | Shear strain (10−4) | ||||||||
|---|---|---|---|---|---|---|---|---|---|
| 0.05 | 0.1 | 0.5 | 1 | 5 | 10 | 50 | 100 | ||
| a G/Gmax is the dynamic shear modulus ratio, λ is the damping ratio. | |||||||||
| Maximum value | G/Gmax | 0.9972 | 0.9945 | 0.9729 | 0.9472 | 0.7821 | 0.6422 | 0.2642 | 0.1522 |
| λ | 0.0446 | 0.0543 | 0.0855 | 0.1040 | 0.1552 | 0.1788 | 0.2198 | 0.2288 | |
| Minimum value | G/Gmax | 0.9919 | 0.9839 | 0.9243 | 0.8592 | 0.5497 | 0.3790 | 0.1088 | 0.0508 |
| λ | 0.0205 | 0.0267 | 0.0489 | 0.0630 | 0.1068 | 0.1240 | 0.1512 | 0.1568 | |
| Average value | G/Gmax | 0.9953 | 0.9906 | 0.9548 | 0.9139 | 0.6853 | 0.5253 | 0.1856 | 0.1028 |
| λ | 0.0342 | 0.0426 | 0.0707 | 0.0873 | 0.1336 | 0.1531 | 0.1836 | 0.1900 | |
4.1 Comparative analysis of the statistical results
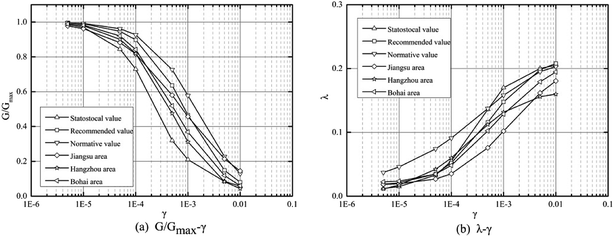
There are two main sets of reference values for the dynamic shear modulus ratio and damping ratio of soft soil in Tianjin: the first are the recommended values of the conventional soil dynamic shear modulus ratio and damping ratio given in the “Code for Seismic Safety Evaluation of Engineering Sites”13 promulgated by the China Earthquake Administration in 1994 (hereinafter called the “normative values”); second, in 2000, a team from the Institute of Engineering Mechanics of China Earthquake Administration led by Yuan Xiao-ming14 used the modified resonance column to give recommendations for group experiments on conventional soils from dozens of different regions in Beijing, Shanghai, Tianjin, Nanjing, etc. (hereinafter called the “recommended values”). Fig. 1 is a comparison of the average values (hereinafter called the “statistical values”) of the dynamic shear modulus ratio and damping ratio of the silty clay from the study area of this paper with the normative values, recommended values, and recommended values of silty clay from different regions.Fig. 1 proves that there is a difference between the dynamic shear modulus ratio and the damping ratio of soft soils from different regions, which may be different due to differences in the environment in which the soft soil is located. This result proves that the dynamic shear modulus ratio and damping ratio of soft soil have regional characteristics and that the values of different regions cannot be simply applied in practice.
4.2 Analysis of factors affecting the dynamic shear modulus ratio and damping ratio
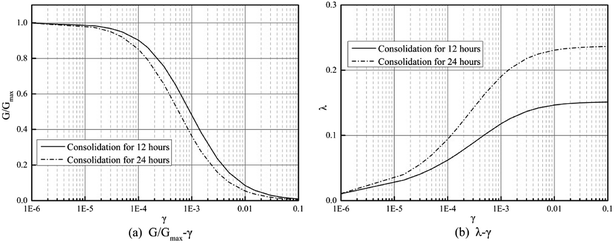
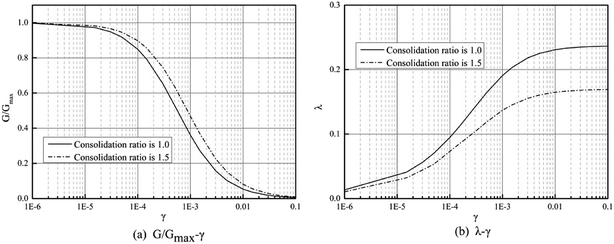
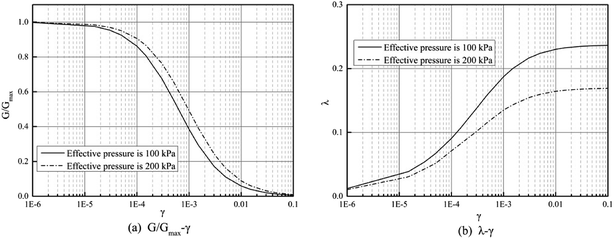
There are many factors that affect the dynamic shear modulus ratio and damping ratio test. Consolidation time, consolidation ratio, effective confining pressure and et al. will affect the test results. In view of this problem, in this paper, indoor dynamic triaxial tests are used to analyze and study the consolidation time, consolidation ratio, and effective confining pressure. The results are as follows,We have proven some valuable conclusions from Fig. 2–4. The dynamic shear modulus ratio is inversely proportional to the consolidation time but proportional to the consolidation ratio and the effective confining pressure. However, the damping ratio exhibits the opposite relationships; the damping ratio is proportional to the consolidation time but inversely proportional to the consolidation ratio and the effective confining pressure.
5. Shear wave velocity of soft soil
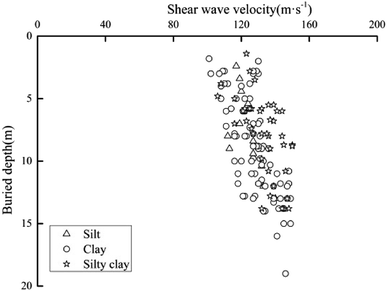
The shear wave velocity can reflect the hardness and compactness of a soil layer. The shear wave velocity is not only one of the important parameters in soil seismic response analysis but also an important indicator of site division. The platform values and characteristic periods of the design response spectrum are different for different site categorie.15,16 The shear wave velocity of a soil is generally determined by the field drilling wave velocity test. This paper collected borehole data measured in the study area and then sorted this borehole data to determine the ranges of the shear wave velocity and depth of the soft soil in Tianjin (see Table 6 for details); then, SPSS software was used to fit the optimal model that describes the correlation between these two properties. Fig. 5 is a scatter plot of shear wave velocity and burial depth of soft soil in Tianjin area. Notably, due to the large dispersion between the shear wave velocity of the silt soil and the burial depth, there is no correlation, so no fitting formula for silt is given in this paper.| Silt | Clay | Silty clay | ||
|---|---|---|---|---|
| a H is the burial depth, Vs is the shear wave velocity. | ||||
| H (m) | 0.4–15.0 | 1.8–19.0 | 1.4–13.8 | |
| Vs (m s−1) | Range | 112.0–140.0 | 101.0–149.0 | 106.0–150.0 |
| Average | 123.58 | 127.66 | 132.76 | |
| Variance | 66.41 | 129.27 | 116.80 | |
| Standard deviation | 8.15 | 11.37 | 10.81 | |
| Correlation coefficient | 0.67 | 0.69 | 0.61 | |
| Coefficient of variation | 0.07 | 0.09 | 0.08 | |
| Regression equation | Vs = 0.17441H2 − 0.4642H + 122.01 | Vs = 0.1481H2 + 0.5777H + 128.57 | ||
| Goodness of fit | 0.7696 | 0.8225 | ||
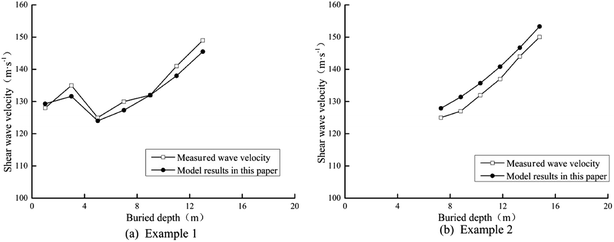
This article uses Ninghe County straw incineration power generation project no. A1 drilling data (example 1) and Xinhua Road 220 kV substation project no. DZ2 drilling data (example 2) as examples; the accuracy and reliability of the shear wave velocity prediction model are verified, and the corresponding error values of each layer are given. Notably, this paper only gives the regression model of the soft soil in the Tianjin area, so only the soft soil layer data in the example borehole is selected as the basis of verification.
As proven in Tables 7, 8 and Fig. 6, for the muddy clay and silty clay, the regression model given in this paper exhibits a small divergence from the measured data, and the error is less than 4%.
| Burial depth/m | Soil | Shear wave velocity/m s−1 | Model of this paper | |
|---|---|---|---|---|
| Calculated value/m s−1 | Error/% | |||
| 1.0 | Silty clay | 128.0 | 129.3 | 1.0 |
| 3.0 | Silty clay | 135.0 | 131.6 | 2.5 |
| 5.0 | Clay | 125.0 | 124.0 | 0.8 |
| 7.0 | Clay | 130.0 | 127.3 | 2.1 |
| 9.0 | Clay | 132.0 | 132.0 | 0.0 |
| 11.0 | Clay | 141.0 | 138.0 | 2.1 |
| 13.0 | Clay | 149.0 | 145.5 | 2.4 |
| Burial depth/m | Soil | Shear wave velocity/m s−1 | Model of this paper | |
|---|---|---|---|---|
| Calculated value/m s−1 | Error/% | |||
| 7.3 | Clay | 125.0 | 127.9 | 2.3 |
| 8.8 | Clay | 127.0 | 131.4 | 3.5 |
| 10.3 | Clay | 132.0 | 135.7 | 2.8 |
| 11.8 | Clay | 137.0 | 140.8 | 2.8 |
| 13.3 | Clay | 144.0 | 146.7 | 1.9 |
| 14.8 | Clay | 150.0 | 153.3 | 2.2 |
6. Seismic response analysis of soft soil
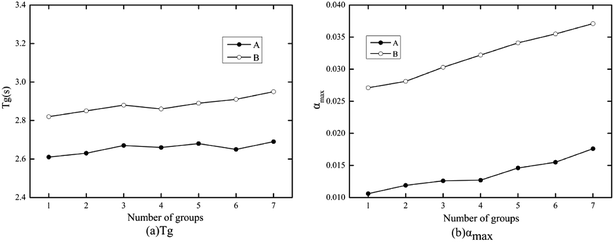
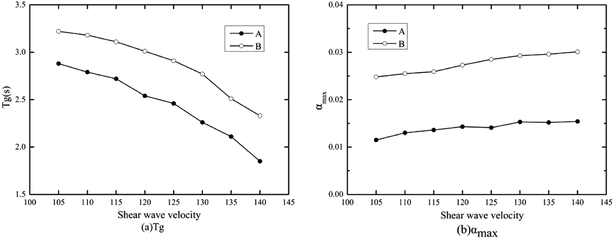
The platform value and characteristic period are the main influencing factors in the design response spectrum. The characteristic period is the period corresponding to the cut-off point between the design response spectrum platform segment and the curve descending segment. The response spectrum platform value is an important parameter for studying the seismic frequency spectrum characteristics. In China, the platform value can be expressed by the maximum value of seismic influence coefficient αmax or the maximum value of dynamic amplification coefficient βmax. The relationship between the two is αmax = kβmax, where k is the product of the seismic coefficient, the peak acceleration a of the ground motion, and the acceleration g of gravity.This paper establishes a soft soil single layer model, and two synthetic seismic waves, A and B, with acceleration peaks of 0.1 g and 0.2 g, respectively, are selected as input ground motions. The one-dimensional equivalent linearization method is used to quantitatively analyse the output. The degree of influence of the dynamic shear modulus ratio, damping ratio and shear wave velocity on the characteristic period and platform value of the design response spectrum was quantitatively analysed.
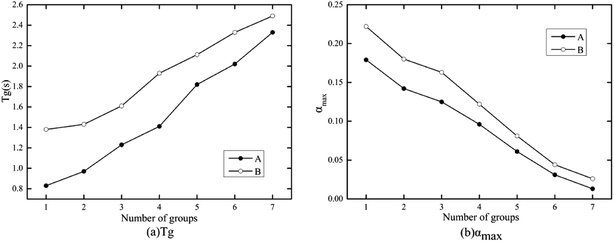
The calculation parameters are selected, the shear wave velocity of the soil layer is 120 m s−1, and the bedrock density is 1.76 g cm−3, and the thickness is 10.0 m, the ground motions A and B are used as the input ground motions. The shear wave velocity of the bedrock is 500 m s−1, and the bedrock density is 2.2 g cm−3. The dynamic shear modulus ratio and the damping ratio are selected by using the average value of the Tianjin clay results (Table 4), as shown in Table 9. Notably, In Fig. 8–10, Tg is the characteristic period and αmax is platform value. Then, the calculation continues with the following groupings:
| Parameter | Shear strain (10−4) | |||||||
|---|---|---|---|---|---|---|---|---|
| 0.05 | 0.1 | 0.5 | 1 | 5 | 10 | 50 | 100 | |
| G/Gmax | 0.9960 | 0.9921 | 0.9619 | 0.9272 | 0.7269 | 0.5777 | 0.2277 | 0.1439 |
| λ | 0.0371 | 0.0458 | 0.0741 | 0.0909 | 0.1373 | 0.1581 | 0.1951 | 0.2030 |
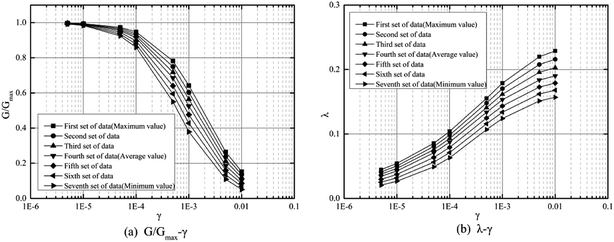
(1) From the statistical range of the dynamic shear modulus ratio of the clay in the Tianjin area, given in Table 4, seven sets of values varying from the maximum value to the minimum value are selected instead of the average value (Fig. 7(a)). The rest of the parameters remain unchanged, and a calculation is performed with each dynamic shear modulus ratio. The effects of the dynamic shear modulus ratio on the characteristic period and platform value of the design response spectrum were analysed.
(2) From the statistical range of the damping ratio of the clay in the Tianjin area, given in Table 4, seven sets of values varying from the maximum value to the minimum value are selected instead of the average value (Fig. 7(b)). The rest of the parameters remain unchanged, and a calculation is performed with each damping ratio. The influence of the damping ratio on the characteristic period and platform value of the design response spectrum is analysed.
(3) Eight sets of increasing shear wave velocity (105 m s−1 to 140 m s−1) are selected instead of the shear wave velocity of the original soil layer. The rest of the parameters remain unchanged, and a calculation is performed for each set of shear wave velocity. The influence of the shear wave velocity on the characteristic period and platform value of the design response spectrum is analysed.
Fig. 8–10 proven the following valuable conclusions:
(1) The characteristic period increases with the decrease in the shear modulus ratio, but under the action of strong ground motion, the rate of increase decreases. The characteristic period is inversely proportional to the change in the shear wave velocity and is proportional to the change in the input ground motion intensity. The characteristic period is not sensitive to the change in the damping ratio and generally increases with the decrease in the damping ratio.
(2) The plateau value decreases as the shear modulus ratio decreases, but the rate of decrease is lower under strong ground motion. The platform value is inversely proportional to the change in the damping ratio and is proportional to the change in the input ground motion intensity. The platform value generally increases with the shear wave velocity, but the change trend is relatively flat.
7. Conclusions
Based on the collation of soft soil data from Tianjin, this paper analyses the physical properties, dynamic characteristics and seismic response characteristics of soft soil in the region. The results are as follows:(1) The physical indicators of soft soil in the Tianjin area have good stability. There was a significant correlation among the natural water content, void ratio, density, liquid limit, plastic limit and plasticity index. The correlation coefficient among the natural water content, void ratio and density was approximately 0.9. The correlations between the liquid index and the natural water content and void ratio are strong, but the correlations with the other four indicators are poor.
(2) The statistics show the ranges of the dynamic shear modulus ratio and damping ratio of the soft soil in the Tianjin area; these results were compared with the normative value and recommended values of soft soil in different regions. There was a difference in the dynamic shear modulus ratio and the damping ratio of soft soil among different regions, showing that the dynamic shear modulus ratio and damping ratio of soft soil have regional characteristics. The effects of consolidation time, consolidation ratio and effective confining pressure on the dynamic shear modulus ratio and damping ratio of the soft soil were analysed by indoor triaxial testing. The results show that the dynamic shear modulus ratio was proportional to the consolidation ratio and the effective confining pressure but inversely proportional to the consolidation time. The trends of the damping ratio were exactly the opposite: the damping ratio is proportional to the consolidation time and inversely proportional to the consolidation ratio and the effective confining pressure.
(3) Using SPSS software to analyse the correlation between the shear wave velocity and depth of the soft soil in the Tianjin area, various regression models were compared to select the optimal model, as recommended by this paper. Two measured drilling datasets were selected to verify the accuracy and reliability of the recommended model.
(4) A soft soil single layer model was established, and the effects of different dynamic shear modulus ratios, damping ratios, shear wave velocities and ground motions strengths on the characteristic period and platform value of the design response spectrum are compared by using the one-dimensional equivalent linearization method. The results show that the characteristic period is inversely proportional to the dynamic shear modulus ratio and the shear wave velocity, is proportional to the input ground motion intensity, and is not sensitive to the change in the damping ratio, while the platform value is proportional to the dynamic shear modulus ratio, the shear wave velocity, and the input ground motion intensity but is inversely proportional to the damping ratio.
In this paper, three aspects, namely, the physical properties, dynamic characteristics and seismic response characteristics, of Tianjin soft soil were studied. The conclusions haven value as a reference for various types of engineering construction in the region and were conducive to the elucidation of the soft soil characteristics in this area.
Conflicts of interest
There are no conflicts to declare.References
- Ministry of Housing and Urban-Rural Development of the People's Republic of China, Specification for geotechnical investigation in soft clay area (JGJ83-2011), China Architecture and Building Press, Beijing, 2011, pp. 13–80 Search PubMed.
- S. C. Griffiths, B. R. Cox and E. M. Rathje, Challenges associated with site response analyses for the soft soil subjected to high-intensity input ground motions, Soil Dynam. Earthq. Eng., 2016, 85(1–10), 18 Search PubMed.
- Tianjin Earthquake Office, Earthquake damage caused by the Tangshan earthquake in Tianjin, Tianjin Science and Technology Press, Tianjin, 1984, pp. 33–68 Search PubMed.
- J. Y. Peng, R. Y. Tang, Y. J. Lv and H. J. Sha, Tianjin seashore site classification and its effect on ground motion, Earthq. Eng. Eng. Vib., 2004, 24(2), 46–52 Search PubMed.
- Tianjin Bureau of Geology and Mineral Resources and Tianjin Regional Geology, Science Press, Beijing, 1992, pp. 11–23.
- H. X. Wang and Y. Z. Xin, The classification of geological hazards (factors) in offshore area of China, Chin. J. Geol. Hazard Control, 1997,(02), 68–72 CAS.
- H. Wang, Geo-environmental changes on the Bohai bay muddy coast(II): results and discussions, Quat. Sci., 2003,(04), 393–403 Search PubMed , 462–464.
- L. C. Miu, Soft Soil Mechanical Properties and Engineering Practice, Science Press, Beijing, 2012, pp. 10–51 Search PubMed.
- D. J. Du, A. W. Yang, J. J. Zhao, et al., Tianjin Binhai Soft Soil, Science Press, Beijing, 2012, pp. 33–100 Search PubMed.
- E. Q. Xing, G. H. Xu, G. H. Hu, H. W. Fang and H. Xu, Statistical characteristics of engineering geology properties of the Tianjin coastal strata, Coast Eng., 2005,(01), 48–52 Search PubMed.
- T. Kagawa, Moduli and damping factors of soft Marine clays, J. Geotech. Eng., 1992, 118(9), 1360–1375 CrossRef.
- P. Kallioglou, T. Tika and K. Pitilakis, Shear modulus and damping ratio of cohesive soils, J. Earthq. Eng., 2008,(12), 879–913 CrossRef.
- People's Republic of China earthquake industry standard, Evaluation of seismic safety for engineering sites (DB001-94), Seismological Press, Beijing, 1994, pp. 52–68 Search PubMed.
- X. M. Yuan, R. Sun, J. Sun, S. J. Meng and Z. J. Shi, Laboratory experimental study on dynamic shear modulus ratio and damping ratio of soils, Earthq. Eng. Eng. Vib., 2000,(04), 133–139 Search PubMed.
- Z. P. Liao, Seismic microzonation: theory and practice, Earthquake Press, Beijing, 1989, pp. 18–87 Search PubMed.
- J. Y. Lan, J. S. Bo and Y. J. Lv, Study on the Effect of Shear Wave Velocity on the Design Spectrum, Technol. Earthq. Disaster Prev., 2007,(01), 19–24 Search PubMed.
Footnote |
| † Electronic supplementary information (ESI) available. See DOI: 10.1039/c9ra05700e |
| This journal is © The Royal Society of Chemistry 2020 |

