The synthesis of nitrogen and sulfur co-doped graphene quantum dots for fluorescence detection of cobalt(II) ions in water†‡
Wissuta
Boonta
 a,
Chanon
Talodthaisong
a,
Suchinda
Sattayaporn
b,
Chiraporn
Chaicham
c,
Anusak
Chaicham
d,
Somboon
Sahasithiwat
e,
Laongdao
Kangkaew
e and
Sirinan
Kulchat
a,
Chanon
Talodthaisong
a,
Suchinda
Sattayaporn
b,
Chiraporn
Chaicham
c,
Anusak
Chaicham
d,
Somboon
Sahasithiwat
e,
Laongdao
Kangkaew
e and
Sirinan
Kulchat
 *a
*a
aMaterials Chemistry Research Center, Department of Chemistry and Center of Excellence for Innovation in Chemistry, Faculty of Science, Khon Kaen University, Khon Kaen 40002, Thailand. E-mail: sirikul@kku.ac.th; Fax: +66-432-02373; Tel: +66-430-09700
bSynchrotron Light Research Institute (Public Organization), 111 University Avenue, Muang District, Nakorn Ratchasima, 30000, Thailand
cSupramolecular Chemistry Research Unit, Department of Chemistry, Faculty of Science, Chulalongkorn University, Phayathai Road, Patumwan, Bangkok, 10330, Thailand
dFaculty of Science, Department of Chemistry, Chandrakasem Rajabhat University, Bangkok, 10900, Thailand
eNational Metal and Materials Technology Center, National Science and Technology Development Agency, Pathumthani, 12120, Thailand
First published on 29th November 2019
Abstract
A fluorescent sensor based on nitrogen and sulfur co-doped graphene quantum dots (N,S-GQDs) has been developed for the convenient, sensitive, and selective detection of cobalt(II) ions (Co2+). Co2+ can quench the fluorescence intensity of N,S-GQDs through metal–ligand interaction between the metal ions and the surface functional groups of the fluorescent probe. Furthermore, the addition of Co2+ induces the aggregation of N,S-GQDs, resulting in an enhancement of UV-Visible absorption at 430 nm and color change from colorless to yellow-brown within 3 minutes. The fluorescence intensity of N,S-GQDs can be used to sense Co2+ under the optimal circumstances with a detection limit of 1.25 μM and a working linear range of 0–40 μM. In addition, the sensor probe was applied successfully to the determination of Co2+ in real water samples. Due to its low cytotoxicity, the proposed sensor may potentially be applied in environmental and biological fields.
1. Introduction
Graphene quantum dots (GQDs) are sp2 hybridized carbon-based fluorescent materials1 with low dimensionality (0D), and a size range between 1–10 nm.2–6 GQDs were first synthesized by Pan et al. in 2010 using a simple hydrothermal method to cut down graphene sheets (GSs). As such GQDs have a similar crystalline structure to single or few layer GSs but with an average diameter of 9.6 nm.7 GQDs exhibit many favourable material properties, including excellent dispersivity in water and high photostability, and are sources of cheap raw materials that are easily scalable.2,4,8–10 Moreover, GQDs also have the advantages of high biocompatibility and nontoxicity.11,12 Thus, they can be applied for various applications, for instance, (bio)chemical sensing,10,13–15 catalysis,16,17 drug delivery,18,19 and bioimaging.9,20 Band-gap energy tuning by doping atomic impurities into GQDs, such as boron, nitrogen, phosphorus, and sulfur including co-doped atoms, is an effective method to control the optical properties of GQDs. Most importantly for this work however, quantum confinement effects in GQDs make their photoluminescence (PL) properties highly sensitive to size, layer, shape and edge configuration, and thus potentially excellent environmental sensors.8,21–23One pressing environmental sensing challenge is water, soil, and food resource contamination by toxic heavy metals, which causes critical problems for both eco-systems and human health.24 Contamination of soil and water with heavy metals such as lead (Pb), chromium (Cr), manganese (Mn), iron (Fe), cobalt (Co), nickel (Ni), copper (Cu), zinc (Zn), and mercury (Hg) is an environment issue on a global scale and becoming increasingly significant as a result of the increase of heavy industries.25,26
Cobalt ions (Co2+) are a significant, water soluble heavy metal contaminant. In trace amounts they are an essential element in human biology with roles including as a component of cyanocobalamin (vitamin B12) and cobalt-containing co-enzymes.27 They also catalyze some reactions such as methionine synthesis, metabolism of purines and folates, treatment of high cholesterol, and red blood cell production.27–31 However, exposure to excessive levels of cobalt ions and cobalt compounds in daily life through breathing air, soil, water, and diet causes many deleterious side effects to human health including cardiotoxicity and low cardiac output.27,32 Moreover, cobalt oxides may affect the heart and lungs and are possibly carcinogenic, causing several diseases, for example, asthma, thyroid damage, and memory impairment.27,33–35 Therefore, the determination of cobalt ions in the environment, especially in drinking water and natural waters at concentration ranges hazardous to human health, is of crucial concern.
Up to the present time, many analysis methods have been developed to detect cobalt ions, for example, electrochemical methods,36,37 inductively coupled plasma optical emission spectrometry (ICP-OES),38 and colorimetric methods.32,39–41 Among these techniques, fluorometry has attracted much interest for metal sensing owing to its simplicity, high sensitivity, rapid response, low-cost detection, and convenience. Over the last few years, several kinds of fluorescent probes such as carbon dots,42 nitrogen-doped carbon dots,43 phosphorus and nitrogen co-doped carbon quantum dots,44 nitrogen and sulfur co-doped carbon-based dots,45 and thioglycolic acid-capped CuInS2/ZnS quantum dots46 have been reported for the efficient detection of Co2+.
Herein, we develop a fluorescent sensor system for cobalt ions in real water samples utilizing nitrogen and sulfur co-doped graphene quantum dots (N,S-GQDs). The N,S-GQDs are prepared from low-cost raw materials using a simple hydrothermal method. We used citric acid as a carbon source, and cysteamine hydrochloride for the nitrogen and sulfur sources. We show that the proposed sensor system can be applied to detect Co2+ sensitively and selectively in real samples. Furthermore, the sensor can be fabricated on paper strips for visual screening with potential for further development of simple analytical devices.
2. Experimental section
2.1 Materials
Citric acid (C6H8O7, 99.5%), sodium hydroxide anhydrous (NaOH, 99%), lead(II) nitrate (Pb(NO3)2, 99%), nickel(II) nitrate hexahydrate (Ni(NO3)2·6H2O, 99%), cadmium nitrate tetrahydrate (Cd(NO3)2·4H2O, 99%), and mercury(II) chloride (HgCl2, ≥99.5%) were purchased from Carlo Erba. Cysteamine hydrochloride (C2H7NS·HCl, ≥98%), manganese(II) nitrate tetrahydrate (Mn(NO3)2·4H2O, ≥97%), dimethyl sulfoxide (DMSO, ≥99.5%), fetal bovine serum (FBS), and LUDOX® AS-40 colloidal silica, 40 wt% suspension in water were purchased from Sigma Aldrich. Tris(hydroxymethyl)methylamine (C4H11NO3, 99.8%), sodium nitrate (NaNO3, ≥99%), magnesium nitrate (Mg(NO3)2, 99.4%), barium nitrate (Ba(NO3)2, ≥99%), aluminium nitrate (Al(NO3)3, 98%), and cobalt(II) nitrate hexahydrate (Co(NO3)2·6H2O, ≥98%) were purchased from Univar. Hydrochloric acid (37%) was purchased from RCI Labscan. Potassium nitrate (KNO3, ≥99%) was purchased from BDH. Calcium chloride (CaCl2, 95%) was purchased from Scharlau. Iron(III) nitrate (Fe(NO3)3, 98.5%) was purchased from QRëC. Copper(II) nitrate trihydrate (Cu(NO3)2·3H2O, ≥99%) and zinc nitrate hexahydrate (Zn(NO3)2·6H2O, ≥99%) were purchased from Fluka. Penicillin, streptomycin, and RPMI 1640 medium were obtained from Gibco™. 3-(4,5-Dimethylthiazol-2-yl)-2,5-diphenyltetrazolium bromide (MTT reagent) was obtained from Invitrogen™. Ultrapure water with specific resistivity of 18.2 MΩ cm and conductivity of 0.055 μS cm−1 (Millipore water purification system) from ELGA- Ultra GE MK2 was used to prepare all aqueous solutions.2.2 Synthesis of N,S-GQDs
Hydrothermal procedures were applied to synthesize N,S-GQDs by modifying a previous report.16 Briefly, citric acid (0.21 g, 1 mmol) and cysteamine·HCl (0.2314 g, 3 mmol) were dissolved in 5 mL of water, followed by stirring until a clear solution was observed. After that, the clear solution was sealed in a 20 mL Teflon-lined autoclave and heated hydrothermally at 160 °C for 4 hours. Then, the autoclave was taken out and cooled to RT. The thus obtained yellow solution of N,S-GQDs was purified by centrifugation at 6000 rpm for 20 min to remove unreacted residues and impurities. The purified solution was kept at −20 °C before freeze-drying in order to obtain solid GQDs. Aqueous solutions of the GQDs for characterization were made up to 0.2 M (as calculated by comparison with the original carbon source (citric acid)).2.3 Characterizations
Fluorescence and absorption spectra were monitored using a RF-6000 spectrofluorometer (Shimadzu, Japan) with slit widths at 5 nm/5 nm and a Cary60 Agilent Technologies spectrofluorometer, respectively, using 1.0 cm quartz cells. The pH values of the solutions were indicated using a UB-10 Ultra Basic pH meter (Denver Instrument). The micrographs of GQDs were obtained by transmission electron microscope (TEM) using a Tecnai G2-20 (FEI, Netherland) system at an acceleration voltage of 200 kV. Attenuated total reflection Fourier transform infrared (ATR-FT-IR) spectra were studied to determine the surface functional groups of the GQDs using a Bruker TENSOR 27 spectrometer by scanning from 4000 to 600 cm−1. FT-Raman spectra were measured using a PerkinElmer Spectrum GX FTIR/FT-Raman spectrometer. The powder X-ray diffraction (XRD) pattern was performed using a PANalytical EMPYREAN X-ray diffractometer with Cu Kα radiation (λ = 1.5406 Å) in the 2θ range of 5–50°. The zeta potential of GQDs in aqueous suspension was monitored using a Zetasizer Nano ZS (Malvern Instrument, UK). Furthermore, X-ray photoelectron spectroscopy (XPS) was performed using a PHI5000 Versa Probe II (ULVAC-PHI, Japan) at the SUT-NANOTEC-SLRI joint research facility, BL 5.3, Synchrotron Light Research Institute (SLRI), Thailand. Monochromatic Al Kα X-rays (1486.6 eV) were used as an excitation source. The fluorescence lifetimes were measured using a FluoroMax-4 spectrofluorometer equipped with a time-correlated single photon counting unit (TCSPC). Scattered excitation light from 0.01% LUDOX AS-40 aqueous solution was used for determining the instrument response function (IRF). The NMR spectra were recorded using a Bruker Avance 400 MHz spectrometer (Bruker, Germany) using D2O as a solvent. The high-resolution transmission electron microscopy (HRTEM) was studied using a Thermo Scientific TALOS F200X system.2.4 Fluorescent sensing of Co2+ ions
Experiments for the determination of Co2+ ions were undertaken at RT. Firstly, Co(NO3)2·6H2O was dissolved in water for preparing a stock solution of 10 mM Co2+ ions. Stock solutions of other metal ions were prepared by the same procedure using their respective salts. For a typical process, to a 10 mL volumetric flask were added in order: 10 μL of 0.2 M of N,S-GQDs solution, 500 μL of 1.0 M Tris–HCl buffer (pH 9.0), and a known volume of a standard metal ion solution (depending on the experiment). Next, the mixture was adjusted to 10.00 mL with ultrapure water. Finally, the fluorescence intensity of the solution was monitored at λem/λex = 425/345 nm. The selectivity for Co2+ was confirmed by comparison with other metal ions under the same circumstances. All determinations were repeated at least three times.2.5 Determination of Co2+ ions in real samples
Real water samples were obtained from the second floor of the Department of Chemistry, Faculty of Science, Khon Kaen University. Samples included commercial drinking water, drinking water from a water dispenser and tap water (from an inorganic laboratory). The spiked samples were made up by adding controlled concentrations of Co2+ into each real water sample.2.6 Preparation of paper strips for Co2+ ion detection
First of all, the filter paper (Whatman™ No. 1, ϕ = 110 mm) was cut to dimensions of 1.5 cm (W) × 1.5 cm (L). The N,S-GQD-based paper strips were produced by immersion of the filter paper into solutions of 20 mM N,S-GQDs in 0.5 M Tris–HCl buffer pH 9.0 for 20 min under sonication. The paper strips were then removed from the solution and dried for 30 min at RT. Then Co2+ solutions of different concentrations were dropped on the paper strips. After that, the paper strips were also dried at RT for about 30 min. Finally, the emission of the paper strips was monitored under UV lamp irradiation with a wavelength of 365 nm for Co2+ detection.2.7 MTT assays
The cytotoxicity of the N,S-GQDs was analyzed by MTT assay. Typically, HeLa cells (8000 cells/100 μL) were first cultured in a 96-well plate containing RPMI-1640 medium supplemented with streptomycin (10![[thin space (1/6-em)]](https://www.rsc.org/images/entities/char_2009.gif) 000 μg mL−1), penicillin (10
000 μg mL−1), penicillin (10![[thin space (1/6-em)]](https://www.rsc.org/images/entities/char_2009.gif) 000 U mL−1), and 10% fetal bovine serum (FBS). Every cell was collected under a humidified atmosphere at 37 °C and 5% CO2 to adhere cells to the surface. Then, the medium was replaced with fresh RPMI-1640 supplemented with various concentrations of N,S-GQDs (0, 0.5, 1.0, 1.5, 2.0, 2.5 and 3.0 mM), and incubated at 37 °C for 24, 48 and 72 hours. After incubation, the culture medium was removed and 10 μL of 5.0 mg mL−1 MTT reagent was added into each well. Then, the cells were incubated with MTT at 37 °C for 2.5 hours, at which time the solution was replaced by an MTT solution with 100 μL of DMSO with shaking for 10 min at RT. Finally, the absorbance at 550 nm and the reference wavelength at 655 nm were analyzed using a microplate reader (EZ Red 2000 microplate reader). The percent cell viabilities of all the samples were calculated as shown in the equation below.
000 U mL−1), and 10% fetal bovine serum (FBS). Every cell was collected under a humidified atmosphere at 37 °C and 5% CO2 to adhere cells to the surface. Then, the medium was replaced with fresh RPMI-1640 supplemented with various concentrations of N,S-GQDs (0, 0.5, 1.0, 1.5, 2.0, 2.5 and 3.0 mM), and incubated at 37 °C for 24, 48 and 72 hours. After incubation, the culture medium was removed and 10 μL of 5.0 mg mL−1 MTT reagent was added into each well. Then, the cells were incubated with MTT at 37 °C for 2.5 hours, at which time the solution was replaced by an MTT solution with 100 μL of DMSO with shaking for 10 min at RT. Finally, the absorbance at 550 nm and the reference wavelength at 655 nm were analyzed using a microplate reader (EZ Red 2000 microplate reader). The percent cell viabilities of all the samples were calculated as shown in the equation below.3. Results and discussion
3.1 Characterization of N,S-GQDs
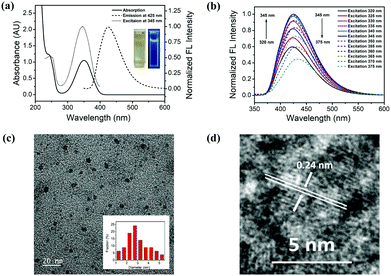
The optical properties of the as-prepared N,S-GQDs were first characterized by absorption and fluorescence spectroscopy as shown in Fig. 1(a and b). The absorption spectrum shows a small absorption band at 240 nm corresponding to π → π* transitions of C![[double bond, length as m-dash]](https://www.rsc.org/images/entities/char_e001.gif) C bonds in aromatic sp2 domains of N,S-GQDs, and a clear absorption band at 349 nm consistent with n → π* transitions of the C
C bonds in aromatic sp2 domains of N,S-GQDs, and a clear absorption band at 349 nm consistent with n → π* transitions of the C![[double bond, length as m-dash]](https://www.rsc.org/images/entities/char_e001.gif) O bond.16,47 The emission spectra of N,S-GQDs exhibit slight excitation-dependent emission, with the emission intensity maximum at 425 nm and when excitation is at 345 nm (Fig. 1b). That the emission wavelength and intensity depend on excitation wavelength is a common phenomenon of carbon-based dots (CDs), typically reflecting both the effect of GQD size distribution and a distribution of emissive sites on each nanoparticle.16,21
O bond.16,47 The emission spectra of N,S-GQDs exhibit slight excitation-dependent emission, with the emission intensity maximum at 425 nm and when excitation is at 345 nm (Fig. 1b). That the emission wavelength and intensity depend on excitation wavelength is a common phenomenon of carbon-based dots (CDs), typically reflecting both the effect of GQD size distribution and a distribution of emissive sites on each nanoparticle.16,21
The morphology of N,S-GQDs was assessed by transmission electron microscopy (TEM). The results show that the particles are homogeneously spherical shape and well dispersed without agglomeration (Fig. 1c). The average diameter of N,S-GQD nanocrystals was calculated using the ImageJ program and they have an average size of 3.0 ± 1.0 nm (n = 79) with the size distribution in the range of 1.1–5.4 nm (inset of Fig. 1c). The HRTEM image of N,S-GQDs (Fig. 2d) reveals that most of the N,S-GQDs have a high degree of crystallinity with the lattice spacing of 0.24 nm, indicating the (1120) lattice fringes of graphene.15 The excellent optical and morphological properties of the synthesized N,S-GQDs suggest that they can be useful for further fabrication of sensor probes to detect metal ions.
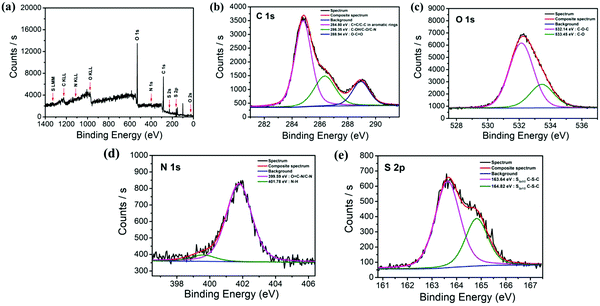 | ||
| Fig. 2 (a) XPS full scan spectra of N,S-GQDs and (b, c, d, and e) the XPS analysis of C1s, O1s, N1s, and S2p of N,S-GQDs, respectively. | ||
The XRD pattern of N,S-GQDs exhibits a broad diffraction peak at 23.47° consistent with the (002) plane of graphite, attributed to a highly disordered graphene-like structure for the N,S-GQDs (Fig. S1A, ESI‡).15,48 In addition, Raman spectrum confirm the successful synthesis of N,S-GQDs as described in Fig. S1b (ESI‡). The disordered (D) band at 1385 cm−1 and the crystalline (G) band at 1535 cm−1 indicate the existence of sp3 defect sites and in-plane vibrations of sp2-hybridized graphitic carbon atoms on the surface of the N,S-GQDs, respectively.49,50
The chemical compositions and surface functional groups of the N,S-GQDs were studied by X-ray photoelectron spectroscopy (XPS) and attenuated total reflection Fourier transform infrared spectroscopy (ATR-FT-IR). The result as shown in Fig. 2a indicates the full range XPS spectra of the as-prepared material. It can be seen that there are four elements in the spectrum as shown in the following details: C1s (284.66 eV), O1s (530.56 eV), N1s (398.83 eV), S2p (162.32 eV), and S2s (228.03 eV). The high resolution spectrum of C1s has also been deconvoluted into three single peaks at 284.80 eV, 286.35 eV, and 288.94 eV corresponding to C![[double bond, length as m-dash]](https://www.rsc.org/images/entities/char_e001.gif) C and C–C bonds in aromatic rings, C–OH/C–O/C–N, and O–C
C and C–C bonds in aromatic rings, C–OH/C–O/C–N, and O–C![[double bond, length as m-dash]](https://www.rsc.org/images/entities/char_e001.gif) O, respectively (Fig. 2b).51–53 The O1s spectrum revealed the presence of C–O–C at 532.14 eV and C–O at 533.45 eV as shown in Fig. 2c.54 The N1s spectrum could be fitted with two main peaks centered at 399.59 eV and 401.78 eV, attributed to both O
O, respectively (Fig. 2b).51–53 The O1s spectrum revealed the presence of C–O–C at 532.14 eV and C–O at 533.45 eV as shown in Fig. 2c.54 The N1s spectrum could be fitted with two main peaks centered at 399.59 eV and 401.78 eV, attributed to both O![[double bond, length as m-dash]](https://www.rsc.org/images/entities/char_e001.gif) C–N and C–N, and N–H, respectively (Fig. 2d).42,51
C–N and C–N, and N–H, respectively (Fig. 2d).42,51
Moreover, the high resolution spectrum of S2p contains two spin–orbit doublet peaks of 2p3/2 and 2p1/2 at 163.64 eV and 164.82 eV, respectively (Fig. 2e), confirming the presence of C–S–C units.14,51 The results discussed above confirm the doping of N and S heteroatoms into the graphene network via the hydrothermal method.
Importantly, the surface of the GQDs may feature specific functional groups which can influence water solubility and PL efficiency. The ATR-FT-IR results indicate the formation of nitrogen, oxygen, and sulfur-rich groups on the N,S-GQD surface (Fig. S1c, ESI‡). The broad absorption bands at around 3000–3500 cm−1 correspond to O–H and N–H stretches. These results suggest that there are plenty of amino, hydroxyl, and carboxylic groups on the surface of N,S-GQDs, affording its hydrophilicity. The weak broad band at 2565 cm−1 can be assigned to S–H stretches. The two bands at 1707 cm−1 and 1623 cm−1 are ascribed to the stretching vibrations of C![[double bond, length as m-dash]](https://www.rsc.org/images/entities/char_e001.gif) O in carboxylic groups, and N–H bending, respectively. The strong band at 1500 cm−1 indicates the bending of C
O in carboxylic groups, and N–H bending, respectively. The strong band at 1500 cm−1 indicates the bending of C![[double bond, length as m-dash]](https://www.rsc.org/images/entities/char_e001.gif) C,16 while the bands at 1228 cm−1 and 1143 cm−1 are the stretching vibrations of C–O–C and C–N, respectively. In addition, a weak C–S stretching band was found at 645 cm−1.14 The above results verify the presence of nitrogen and sulfur, functionalized on the surface and doped into the lattice of the graphitic carbon skeleton of the N,S-GQDs.51 In addition, the structure of the N,S-GQDs was characterized by the 1H-NMR and 13C-NMR measurements in D2O solvent as shown in Fig. S2 and S3 (ESI‡), respectively. In the 1H-NMR spectrum, the aromatic protons are observed at 6.79–7.83 ppm indicating that an aromatic rich carbon is formed in the N,S-GQDs. The peaks from 2.81–4.51 ppm belong to sp3 carbons. Moreover, the broad peaks of NH2 in the 1H-NMR spectrum are also observed at 3.19 ppm and 3.38 ppm.
C,16 while the bands at 1228 cm−1 and 1143 cm−1 are the stretching vibrations of C–O–C and C–N, respectively. In addition, a weak C–S stretching band was found at 645 cm−1.14 The above results verify the presence of nitrogen and sulfur, functionalized on the surface and doped into the lattice of the graphitic carbon skeleton of the N,S-GQDs.51 In addition, the structure of the N,S-GQDs was characterized by the 1H-NMR and 13C-NMR measurements in D2O solvent as shown in Fig. S2 and S3 (ESI‡), respectively. In the 1H-NMR spectrum, the aromatic protons are observed at 6.79–7.83 ppm indicating that an aromatic rich carbon is formed in the N,S-GQDs. The peaks from 2.81–4.51 ppm belong to sp3 carbons. Moreover, the broad peaks of NH2 in the 1H-NMR spectrum are also observed at 3.19 ppm and 3.38 ppm.
In the 13C-NMR spectrum, the peaks from 21.4–73.3 are the indication of the aliphatic sp3-carbons, C–O, and C–N bonds, while the characteristic peaks of aromatic sp2-carbons were observed at around 101.9–179.9 ppm. In addition, the peaks from 173.5–179.9 are ascribed to the peak of C![[double bond, length as m-dash]](https://www.rsc.org/images/entities/char_e001.gif) O bonds of carboxylic groups.55,56
O bonds of carboxylic groups.55,56
3.2 Fluorescence quenching of N,S-GQDs in the presence of Co2+
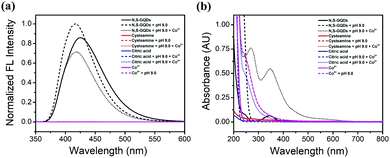
Fluorescence and UV-Visible spectroscopy were used to prove the possible development of a Co2+ sensor system using GQDs, as described in Fig. 3(a and b). The results reveal that the fluorescence intensity of N,S-GQDs increases under basic conditions but it is quenched after the addition of Co2+ (Fig. 3a). The absorption peaks at 270, 375, and 430 nm (Fig. 3b) are attributed to metal–ligand interactions, observed as the GQD solution color changes from colorless to yellow-brown.41 Consequently, both fluorescence and UV-Visible spectroscopy might be applied for the Co2+ ion detection. Given its high sensitivity, we focused on using the fluorescence to develop the sensor, evaluating parameters such as the effect of pH, N,S-GQD concentration, and reaction time, as outlined next.3.3 Effect of pH value
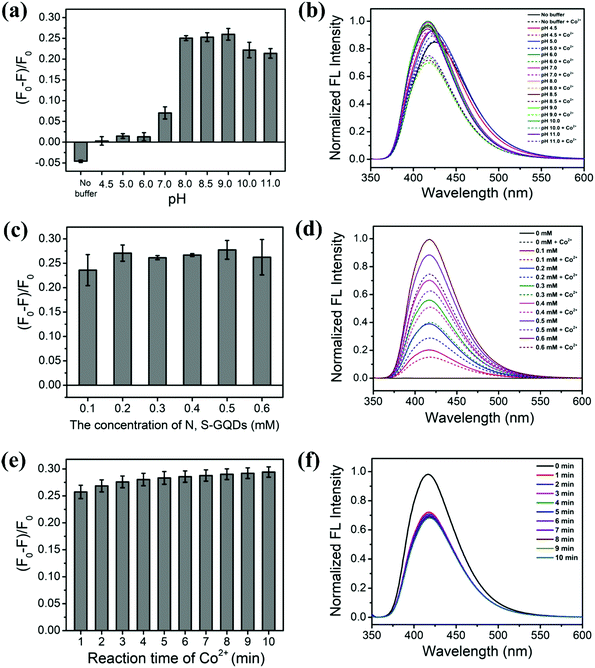
The performance of the N,S-GQDs and Co2+ systems was investigated in acidic, neutral, and basic conditions using HOAc buffers (pH 4.5, 5.0, and 6.0), phosphate buffer (pH 7.0), Tris–HCl buffers (pH 8.0, 8.5, and 9.0), and Tris–NaOH buffers (pH 10.0 and 11.0) as shown in Fig. 4(a and b). It was found that pH values in the range of 8.0–9.0 resulted in high fluorescence quenching, while the pH value of 9.0 showed a maximum quenching effect. Therefore a Tris–HCl buffer pH 9.0 was used throughout further experiments.3.4 Effect of N,S-GQD concentration
Next, the optimal concentration of N,S-GQDs for sensing experiments was investigated. Solutions of various concentrations of N,S-GQDs (0–0.6 mM) were treated with Co2+ at 30 μM in Tris–HCl buffer solution at pH 9.0. Fluorescence spectra of N,S-GQDs at various concentrations in the absence and presence of 30 μM Co2+ are presented in Fig. 4(c and d). The N,S-GQD fluorescence quenching was fairly constant (ca. 25%) over this concentration range and a N,S-GQD concentration of 0.2 mM was selected for further Co2+ sensing experiments.3.5 Effect of reaction time
The reaction time for interaction between GQDs and Co2+ was also optimized in the presence of 50 mM Tris–HCl buffer pH 9.0. Various incubation times between 0 and 10 min were investigated as shown in Fig. 4(e and f) to determine the optimal fluorescence quenching efficiency. After mixing Co2+ ions with the probe, the color of the solution changed immediately and the fluorescence intensity was stable after only 3 min. Thus, we chose a reaction time of 3 min in all further experiments.3.6 Selectivity studies
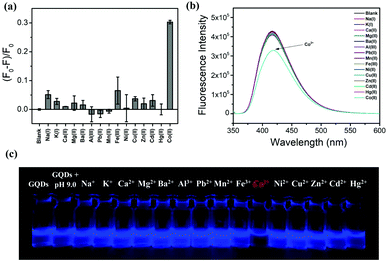
The selectivity of the proposed sensor for the detection of Co2+ was studied next using fluorescence spectroscopy as described in Fig. 5(a–c). The results suggest that while the addition of Co2+ ions caused drastic fluorescence intensity change for the N,S-GQDs, no significant change was observed upon addition of different metal cations including Na+, K+, Ca2+, Mg2+, Ba2+, Al3+, Pb2+, Mn2+, Fe3+, Ni2+, Cu2+, Zn2+, Cd2+, and Hg2+. These results comfirm that the fluorescent probe has a much higher selectivity towards Co2+ than other metal cations.3.7 Analytical performance of the sensor
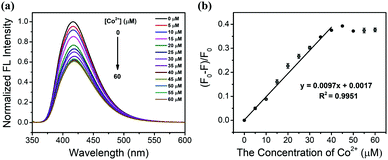
Quantitative analysis was undertaken next. The degree of fluorescence quenching (F0 − F/F0) of N,S-GQDs at different concentrations of Co2+ was monitored under the optimized conditions discussed above. The fluorescence intensity of the probe was gradually quenched by increasing the concentration of Co2+ as shown in Fig. 6a. The fluorescence intensity decreased linearly in the presence of Co2+ in the range of 0–40 μM (Fig. 6b). A linear best-fit equation function of (F0 − F)/F0 = 0.0097[Co2+] + 0.0017 was determined with a correlation coefficient square (R2) of 0.9951 where F0 and F are the fluorescence intensities of N,S-GQDs in the absence and presence of Co2+ under the optimal conditions, respectively. From these results, the limit of detection (LOD) and limit of quantitation (LOQ) were calculated to be 1.25 μM and 4.59 μM, respectively, according to the concentration of Co2+ required to quench GQD fluorescence intensity (F0 − F/F0) equal to 3 standard deviations of F0 for LOD, and 10 standard deviations of F0 for LOQ.3.8 The sensing mechanism
It was reported that carboxyl, amino, and thiol groups can interact with cobalt(II) ions via the metal–ligand interaction.32,36,39,40,42,45,46,57,58 In this work, we observed that the color of the solution changed from colorless to yellow-brown (Fig. S4, ESI‡), likely due to complexation of Co2+ with the N,S-GQDs via carboxyl, amino, and thiol groups as shown in Fig. 7. The mechanism of the accompanying fluorescence quenching of the N,S-GQDs was investigated next using a variety of analytical techniques including TEM, and zeta potential analysis.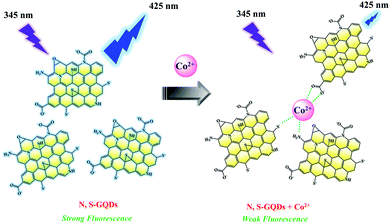 | ||
| Fig. 7 Schematic representation of the complexation of Co2+ and N,S-GQDs via metal–ligand interactions and accompanying fluorescence quenching. | ||
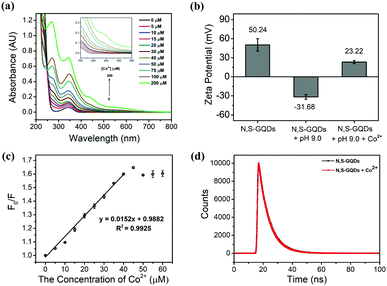
The absorption peaks at 270 and 375 nm of the N,S-GQDs in neat solution were incrementally increased without significant shift in the presence of Co2+, however a broad new absorption band around 430 nm was observed attributed to complex formation (Fig. 8a). As already seen in Fig. 3a, the fluorescence spectra of N,S-GQDs in the absence and presence of Tris–HCl buffer at pH 9.0 feature emission peaks at 425 nm and 417 nm, respectively. In addition, the intensity of the peak was decreased in basic solution and shifted to shorter wavelength (blue shift) by 8 nm. This may indicate that the size of the GQDs decreased in basic solution at pH 9.0. Furthermore, the emission peak of the GQDs at pH 9.0 and in the presence of Co2+ was quenched and shifted to a longer wavelength (red shift) by about 3 nm. This implies that Co2+ can interact with functional groups on the surface of GQDs through metal–ligand interaction causing an increasing particle size (aggregation) of N,S-GQDs.
To confirm this hypothesis, TEM was used to investigate GQD particle size (Fig. S5a–c, ESI‡). It was clearly observed that the size of the GQDs was smaller after adding Tris–HCl buffer pH at 9.0 and the GQDs were well-dispersed with an average diameter of 1.8 ± 0.5 nm. However the particle size of the GQDs was increased to 2.2 ± 0.4 nm after the addition of Co2+. This indicates that the complexation of GQDs and metal ions indeed leads to aggregation of GQDs, causing both a color change and fluorescence quenching.
The zeta potential of the N,S-GQDs was reduced from +50.24 to −31.28 mV after addition of buffer pH 9.0 as shown in Fig. 8b. The significant reduction of zeta potential values suggests the deprotonation of the functional groups on the surface of the GQDs leaving an overall negative charge. This change makes the GQDs effectively stronger Lewis bases which can easily interact with Co2+ metal ions. When a solution of 30 μM of Co2+ ions was added to the GQDs in basic conditions at buffered pH 9.0, the zeta potential increased to +23.22 mV, indicating Co2+ indeed interacts with the negatively charged GQDs. The deprotonated functional groups on the surface of N,S-GQDs, including carboxyl, amino, and thiol groups, can bind with Co2+ ions through metal–ligand interactions leading to the reduction of the anionic character of the GQDs.
Furthermore, a Stern–Volmer plot was used to give insight into the quenching mechanism, given as F0/F = 1 + Ksv[Q], where F0 and F are the fluorescence intensities of N,S-GQDs in the absence and presence of Co2+, Ksv is the Stern–Volmer quenching constant, and [Q] is the concentration of quencher (Co2+). From the Stern–Volmer plot as shown in Fig. 8c, the curve is linear for Co2+ concentrations from 0 to 40 μM. A linear Stern–Volmer plot can result from either a purely dynamic (diffusive) queching mechanism, or a purely static (due to complexation) quenching mechanism. The calculated Ksv after fitting a linear curve to the Stern–Volmer plot was found to be 1.52 × 10⁴ M−1 (R2 = 0.9925), and this constant relates to an equilibrium constant for the binding of Co2+ on the surface of N,S-GQDs, assuming a static quenching mechanism.59 Confirmation of the static quenching mechanism comes from time-resolved fluorescence studies. The fluorescence decay of N,S-GQDs was obtained in the absence and presence of Co2+ as shown in Fig. 8d. The lifetimes of the N,S-GQDs and N,S-GQDs/Co2+ systems were 8.16 ns and 8.10 ns, respectively, almost the same despite the evidence of significant fluorescence quenching from steady state studies. Thus, complexation of N,S-GQDs by Co2+ leads to complete fluorescence quenching, and any fluorescence observed is due to uncomplexed N,S-GQDs.60
3.9 Application of N,S-GQDs for the determination of Co2+ ions in water samples
Next, the performance of the proposed Co2+ sensor was investigated with real water samples from the Khon Kaen University, consisting of commercial drinking water, dispenser drinking water (from the second floor of the chemistry building), and tap water (from the inorganic laboratory at the chemistry building). The concentration of Co2+ and recoveries were measured using the standard addition method by spiking known concentrations of Co2+ ions (5, 10 and 15 μM) into each sample, which were diluted to be within the working linear range. As shown in Table 1, the results showed a good agreement between the expected and found values with 91.2–108.2% of recovery and 0.1–7.3% of relative standard deviation (RSD).| Water sample studied | Amount of standard Co2+ ions added (μM) | Proposed method (n = 3) | |
|---|---|---|---|
| %Recovery ± SD | RSD (%) | ||
| Commercial drinking water | 5 | 105.41 ± 7.66 | 7.27 |
| 10 | 108.16 ± 0.97 | 0.89 | |
| 15 | 101.44 ± 4.14 | 4.08 | |
| Drinking water (from water dispenser) | 5 | 91.17 ± 0.09 | 0.10 |
| 10 | 98.55 ± 2.49 | 2.53 | |
| 15 | 99.25 ± 2.82 | 2.85 | |
| Tap water (from inorganic laboratory) | 5 | 100.19 ± 4.53 | 4.52 |
| 10 | 98.50 ± 6.26 | 6.36 | |
| 15 | 100.46 ± 0.36 | 0.36 | |
3.10 Comparison with other methods for cobalt determination
In recent years, many methods have been reported for the detection of Co2+ ions, and some examples are shown in Table 2. These techniques include electrochemistry, colorimetry, and fluorescence spectroscopy. However, the majority of these procedures exhibit some limitations, such as requiring extensive pre-treatments before measurement, expensive instrumentation, or lengthy analysis times. Although, some techniques show detection limits far lower than that of this work, Co2+ sensors do not always need to achieve ultra-low limits of detection to be useful. The normal amounts of Co2+ in human blood and urine are 0.18 μg L−1 (0.003 μM) and 1.0 μg L−1 (0.017 μM), respectively. When the serum Co2+ concentration is greater than 1.0 μg L−1, it is considered as excessive cobalt exposure. A value greater than 5 μg L−1 (0.085 μM) can be toxic.36 Thus, the procedures for the determination of Co2+ which have a higher limit of detection than the normal level of Co2+ in the body are important as they can indicate abnormal excess of Co2+. For instance, if Co2+ levels in serum reach 7 ng mL−1 (0.12 μM), peripheral neuropathy, sensorineural hearing loss, visual loss due to retinal-optic nerve damage, hypothyroidism, and cardiomyopathy are possible.61 Importantly, our detection limit and working linear range envelope the typical physiological levels of Co2+, with the sensor also exhibiting remarkable simplicity, selectivity, and low-cost.| Methods | Materials | Linear range (μM) | Detection limit (μM) | Ref. |
|---|---|---|---|---|
| Abbreviations: MWCNTs, multiwalled carbon nanotubes; AuNPs, gold nanoparticles; CuInS2/ZnS/TGA QDs, thioglycolic acid-capped CuInS2/ZnS quantum dots. | ||||
| Electrochemistry | 1-Diazo-2-naphthol-4-sulfonic acid/MWCNT modified electrode | 1.7–42.4 | 1.36 | 37 |
| Zn/Al-2(3-chlorophenoxy)propionate modified carbon paste electrode | 0.01–1000 | 0.01 | 62 | |
| Benzenesulfonohydrazide modified glassy carbon electrode | 0.0001–100![[thin space (1/6-em)]](https://www.rsc.org/images/entities/char_2009.gif) 000 000 |
0.00009 | 63 | |
| Colorimetry | Coumarin skeleton | 0-90 | 7.09 | 32 |
| 4-Aminothiophenol-functionalized AuNPs | 1000–15![[thin space (1/6-em)]](https://www.rsc.org/images/entities/char_2009.gif) 000 000 |
57.90 | 39 | |
| Cysteine-linked core–satellite AuNPs | 0.1–10 | 0.01 | 40 | |
| Silver nanoparticles | 5–100 | 7.00 | 57 | |
| Thiosulfate-stabilized AuNPs | 0.1–0.7 | 0.04 | 58 | |
| Peptide-modified AuNPs | 2–10 | 2.00 | 64 | |
| Fluorescence | Phenol–ruthenium(II) tris(bipyridine) complex | 0.1–50 | 0.05 | 65 |
| CuInS2/ZnS/TGA QDs | 0.3–90.4 | 0.16 | 66 | |
| 1,2-Dihydroxyanthraquinone/β-cyclodextrin | 1.2–3.6 | 0.02 | 67 | |
| Carbon dots (CDs) | 0–40 | 0.45 | 42 | |
| P,N-Doped carbon quantum dots | 0–60 | 0.053 | 44 | |
| N,S-Doped carbon dots | 0.08–100 | 0.08 | 45 | |
| N-Doped carbon dots | 1–100 | 0.68 | 68 | |
| N,S-Doped graphene quantum dots | 0–40 | 1.25 | This work | |
3.11 The screening of Co2+ ions by the N,S-GQD-based paper strips
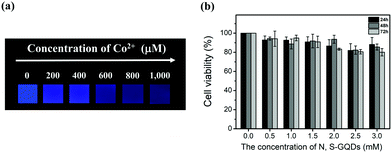
N,S-GQD-based paper strips were developed next as an avenue for the rapid, visual sensing of Co2+ ion concentrations. Fig. 9a shows the fluorescence from GQD paper strips made by immersing the strips into N,S-GQDs in buffer solution pH 9.0. After dropping Co2+ solutions with concentrations of 200, 400, 600, 800, and 1000 μM onto the strips, they were rinsed and fluorescence images and spectra were taken. The emission from the paper strips darkened gradually with increasing Co2+ concentration in the range of 0–1000 μM. The result confirms that the addition of Co2+ causes the fluorescence quenching of the sensor probe which could be applied to screen Co2+ with low-cost and simple paper strip sensors with a rapid response.3.12 Cell toxicity
The cellular toxicity of the N,S-GQDs was assessed by MTT assay using HeLa cells. As shown in Fig. 9b, the N,S-GQDs have low cytotoxicity with more than 80% of the cells remaining viable upon addition of N,S-GQDs over a concentration range of 0.5–3.0 mM and after incubation for 24, 48, and 72 hours. These results demonstrate the biocompatibility of the N,S-GQDs, which suggests that they may potentially be applied to biological systems.4. Conclusions
We have successfully synthesized N,S-GQDs through a hydrothermal synthesis method as a sensitive and selective fluorescent probe for the detection of Co2+. The fluorescence intensity of N,S-GQDs was quenched after the addition of Co2+ due to metal–ligand binding interactions (a change from colorless to yellow-brown also occurs). Our proposed sensor provides a feasible approach to quantitative detection of Co2+ with high selectivity towards Co2+ over other metal ions. This sensor has a LOD and LOQ of 1.25 μM and 4.59 μM, respectively, and a good linear response to Co2+ in the range of 0–40 μM, ideal for testing of abnormal excess of Co2+ diseases in humans. The N,S-GQDs can be applied for the detection of Co2+ in real water using the standard addition method with satisfactory results. In addition, N,S-GQD-based paper strips were successfully applied for the rapid and visual screening of Co2+. More importantly, the N,S-GQDs have low cytotoxicity and so the proposed sensor might be very useful to apply in environmental and biological fields as described in recent reports.69–73Conflicts of interest
There are no conflicts to declare.Acknowledgements
W. B. was supported by Development and Promotion of Science and Technology Talents Project (DPST). C. T. was supported by The Science achievement scholarship of Thailand (SAST). S. K. acknowledges the financial and laboratory support from Faculty of Science, Khon Kaen University, the Center of Excellence for Innovation in Chemistry (PERCH-CIC), Ministry of Higher Education, Science, Research and Innovation and Mekong Health Science Research Institute Khon Kaen University. We thank Dr Narong Chanlek for XPS test support at BL 5.3 and Mr Anuchit Ruangvittayanon for HRTEM measurement at Synchrotron Light Research Institute (SLRI), Thailand.References
- A. Cayuela, M. L. Soriano, C. Carrillo-Carrión and M. Valcárcel, Chem. Commun., 2016, 52, 1311–1326 RSC
.
- H. Sun, L. Wu, W. Wei and X. Qu, Mater. Today, 2013, 16, 433–442 CrossRef CAS
.
- Z. Zhang, J. Zhang, N. Chen and L. Qu, Energy Environ. Sci., 2012, 5, 8869–8890 RSC
.
- J. Shen, Y. Zhu, X. Yang and C. Li, Chem. Commun., 2012, 48, 3686–3699 RSC
.
- S. N. Baker and G. A. Baker, Angew. Chem., Int. Ed., 2010, 49, 6726–6744 CrossRef CAS PubMed
.
- A. K. Geim and K. S. Novoselov, Nat. Mater., 2007, 6, 183–191 CrossRef CAS PubMed
.
- D. Pan, J. Zhang, Z. Li and M. Wu, Adv. Mater., 2010, 22, 734–738 CrossRef CAS PubMed
.
- X. Hai, J. Feng, X. Chen and J. Wang, J. Mater. Chem. B, 2018, 6, 3219–3234 RSC
.
- S. Sangam, A. Gupta, A. Shakeel, R. Bhattacharya, A. K. Sharma, D. Suhag, S. Chakrabarti, S. K. Garg, S. Chattopadhyay, B. Basu, V. Kumar, S. K. Rajput, M. K. Dutta and M. Mukherjee, Green Chem., 2018, 20, 4245–4259 RSC
.
- A. Suryawanshi, M. Biswal, D. Mhamane, R. Gokhale, S. Patil, D. Guin and S. Ogale, Nanoscale, 2014, 6, 11664–11670 RSC
.
- X. T. Zheng, A. Ananthanarayanan, K. Q. Luo and P. Chen, Small, 2015, 11, 1620–1636 CrossRef CAS PubMed
.
- S. Zhu, S. Tang, J. Zhang and B. Yang, Chem. Commun., 2012, 48, 4527–4539 RSC
.
- L. Chen, G. Yang, P. Wu and C. Cai, Biosens. Bioelectron., 2017, 96, 294–299 CrossRef CAS PubMed
.
- T. K. Mondal, D. Dinda and S. K. Saha, Sens. Actuators, B, 2018, 257, 586–593 CrossRef CAS
.
- C. Qu, D. Zhang, R. Yang, J. Hu and L. Qu, Spectrochim. Acta, Part A, 2019, 206, 588–596 CrossRef CAS PubMed
.
- D. Qu, M. Zheng, P. Du, Y. Zhou, L. Zhang, D. Li, H. Tan, Z. Zhao, Z. Xie and Z. Sun, Nanoscale, 2013, 5, 12272–12277 RSC
.
- V. Sharma and P. K. Jha, Sol. Energy Mater. Sol. Cells, 2019, 200, 109908–109915 CrossRef CAS
.
- Y. Gao, S. Zhong, L. Xu, S. He, Y. Dou, S. Zhao, P. Chen and X. Cui, Microporous Mesoporous Mater., 2019, 278, 130–137 CrossRef CAS
.
- Y. Jing, Y. Zhu, X. Yang, J. Shen and C. Li, Langmuir, 2011, 27, 1175–1180 CrossRef CAS PubMed
.
- J. H. Liu, R. S. Li, B. Yuan, J. Wang, Y. F. Li and C. Z. Huang, Nanoscale, 2018, 10, 17402–17408 RSC
.
- L. Li, G. Wu, G. Yang, J. Peng, J. Zhao and J.-J. Zhu, Nanoscale, 2013, 5, 4015–4039 RSC
.
- Y. Li, Y. Zhao, H. Cheng, Y. Hu, G. Shi, L. Dai and L. Qu, J. Am. Chem. Soc., 2012, 134, 15–18 CrossRef CAS PubMed
.
- Y. Park, J. Yoo, B. Lim, W. Kwon and S. W. Rhee, J. Mater. Chem. A, 2016, 4, 11582–11603 RSC
.
- P. Wu, T. Zhao, S. Wang and X. Hou, Nanoscale, 2014, 6, 43–64 RSC
.
- N.-u. Amin and T. Ahmad, RSC Adv., 2015, 5, 14322–14329 RSC
.
- L. Järup, Br. Med. Bull., 2003, 68, 167–182 CrossRef PubMed
.
- D. G. Barceloux and D. Barceloux, J. Toxicol., Clin. Toxicol., 1999, 37, 201–216 CrossRef CAS PubMed
.
- H. B. Castellanos-Sinco, C. O. Ramos-Peñafiel, A. Santoyo-Sánchez, J. Collazo-Jaloma, C. Martínez-Murillo, E. Montaño-Figueroa and A. Sinco-Ángeles, Rev. Med. Hosp. Gen., 2015, 78, 135–143 Search PubMed
.
- S. Elliott, Br. J. Pharmacol., 2008, 154, 529–541 CrossRef CAS PubMed
.
- T. Kawakami, N. Hanao, K. Nishiyama, Y. Kadota, M. Inoue, M. Sato and S. Suzuki, Toxicol. Appl. Pharmacol., 2012, 258, 32–42 CrossRef CAS PubMed
.
- S. L. Roderick and B. W. Matthews, Biochemistry, 1993, 32, 3907–3912 CrossRef CAS PubMed
.
- D. Vashisht, K. Kaur, R. Jukaria, A. Vashisht, S. Sharma and S. K. Mehta, Sens. Actuators, B, 2019, 280, 219–226 CrossRef CAS
.
- I. Sheikh, J. Med. Toxicol., 2016, 2, 1–6 Search PubMed
.
- R. Lauwerys and D. Lison, Sci. Total Environ, 1994, 150, 1–6 CrossRef CAS PubMed
.
- D. Lison, M. De Boeck, V. Verougstraete and M. Kirsch-Volders, Occup. Environ. Med., 2001, 58, 619–625 CrossRef CAS PubMed
.
- A. Mirabi, A. S. Rad and M. Abdollahi, ChemistrySelect, 2017, 2, 4439–4444 CrossRef CAS
.
- M. Zamhari, A. Numnuam, W. Limbut, P. Kanatharana and P. Thavarungkul, Electroanalysis, 2017, 29, 2348–2357 CrossRef CAS
.
- M. Bartosiak, K. Jankowski and J. Giersz, J. Pharm. Biomed. Anal., 2018, 155, 135–140 CrossRef CAS PubMed
.
- U. B. Patel, V. N. Mehta, M. A. Kumar and S. K. Kailasa, Res. Chem. Intermed., 2013, 39, 771–779 CrossRef CAS
.
- F. Mazur, L. Liu, H. Li, J. Huang and R. Chandrawati, Sens. Actuators, B, 2018, 268, 182–187 CrossRef CAS
.
- A. H. Gore, D. B. Gunjal, M. R. Kokate, V. Sudarsan, P. V. Anbhule, S. R. Patil and G. B. Kolekar, ACS Appl. Mater. Interfaces, 2012, 4, 5217–5226 CrossRef CAS PubMed
.
- D. Kong, F. Yan, Z. Han, J. Xu, X. Guo and L. Chen, RSC Adv., 2016, 6, 67481–67487 RSC
.
- N. Jing, M. Tian, Y. Wang and Y. Zhang, J. Lumin., 2019, 206, 169–175 CrossRef CAS
.
- S. Liao, F. Zhu, X. Zhao, H. Yang and X. Chen, Sens. Actuators, B, 2018, 260, 156–164 CrossRef CAS
.
- Y. Chen, P. Shang, Y. Dong and Y. Chi, Sens. Actuators, B, 2017, 242, 1210–1215 CrossRef CAS
.
- L. Zi, Y. Huang, Z. Yan and S. Liao, J. Lumin., 2014, 148, 359–363 CrossRef CAS
.
- Z. L. Wu, M. X. Gao, T. T. Wang, X. Y. Wan, L. L. Zheng and C. Z. Huang, Nanoscale, 2014, 6, 3868–3874 RSC
.
- S. Qu, X. Wang, Q. Lu, X. Liu and L. Wang, Angew. Chem., Int. Ed., 2012, 51, 12215–12218 CrossRef CAS PubMed
.
- S. Wang, L. Zhang, Z. Xia, A. Roy, D. W. Chang, J.-B. Baek and L. Dai, Angew. Chem., Int. Ed., 2012, 51, 4209–4212 CrossRef CAS PubMed
.
- J. Liang, Y. Jiao, M. Jaroniec and S. Z. Qiao, Angew. Chem., Int. Ed., 2012, 51, 11496–11500 CrossRef CAS PubMed
.
- R. Zhang, J. R. Adsetts, Y. Nie, X. Sun and Z. Ding, Carbon, 2018, 129, 45–53 CrossRef CAS
.
- H. Ding, Y. Ji, J.-S. Wei, Q.-Y. Gao, Z.-Y. Zhou and H.-M. Xiong, J. Mater. Chem. B, 2017, 5, 5272–5277 RSC
.
- R. Zhang and W. Chen, Biosens. Bioelectron., 2014, 55, 83–90 CrossRef CAS PubMed
.
- C. Chaicham, T. Tuntulani, V. Promarak and B. Tomapatanaget, Sens. Actuators, B, 2019, 282, 936–944 CrossRef CAS
.
- L. Song, J. Shi, J. Lu and C. Lu, Chem. Sci., 2015, 6, 4846–4850 RSC
.
- S. Zhu, Q. Meng, L. Wang, J. Zhang, Y. Song, H. Jin, K. Zhang, H. Sun, H. Wang and B. Yang, Angew. Chem., Int. Ed., 2013, 52, 3953–3957 CrossRef CAS PubMed
.
- Y. Yao, D. Tian and H. Li, ACS Appl. Mater. Interfaces, 2010, 2, 684–690 CrossRef CAS PubMed
.
- Z. Zhang, J. Zhang, T. Lou, D. Pan, L. Chen, C. Qu and Z. Chen, Analyst, 2012, 137, 400–405 RSC
.
- S. Kulchat, W. Boonta, A. Todee, P. Sianglam and W. Ngeontae, Spectrochim. Acta, Part A, 2018, 196, 7–15 CrossRef CAS PubMed
.
- D. Su, M. Wang, Q. Liu, Z. Qu and X. Su, New J. Chem., 2018, 42, 17083–17090 RSC
.
- R. Yu, Journal of Endocrinology and Thyroid Research, 2017, 1, 1–4 CrossRef
.
- I. M. Isa, S. Nur, A. Dahlan, N. Hashim, M. Ahmad and S. Ghani, Int. J. Electrochem. Sci., 2012, 7, 7797–7808 CAS
.
- M. M. Hussain, A. M. Asiri, M. N. Arshad and M. M. Rahman, Chem. Eng. J., 2018, 339, 133–143 CrossRef CAS
.
- M. Zhang, Y.-Q. Liu and B.-C. Ye, Analyst, 2012, 137, 601–607 RSC
.
- C.-Y. Li, X.-B. Zhang, Z. Jin, R. Han, G.-L. Shen and R.-Q. Yu, Anal. Chim. Acta, 2006, 580, 143–148 CrossRef CAS PubMed
.
- L. Zi, Y. Huang, Z. Yan and S. Liao, J. Lumin., 2014, 148, 359–363 CrossRef CAS
.
- S. Mohandoss and T. Stalin, RSC Adv., 2017, 7, 16581–16593 RSC
.
- X. Wen, L. Shi, G. Wen, Y. Li, C. Dong, J. Yang and S. Shuang, Sens. Actuators, B, 2016, 235, 179–187 CrossRef CAS
.
- X. Tan, Y. Li, X. Li, S. Zhou, L. Fan and S. Yang, Chem. Commun., 2015, 51, 2544–2546 RSC
.
- S. Li, S. Zhou, Y. Li, X. Li, J. Zhu, L. Fan and S. Yang, ACS Appl. Mater. Interfaces, 2017, 9, 22332–22341 CrossRef CAS PubMed
.
- M. Zhang, L. Bai, W. Shang, W. Xie, H. Ma, Y. Fu, D. Fang, H. Sun, L. Fan, M. Han, C. Liu and S. Yang, J. Mater. Chem., 2012, 22, 7461–7467 RSC
.
- R. Guo, S. Zhou, Y. Li, X. Li, L. Fan and N. H. Voelcker, ACS Appl. Mater. Interfaces, 2015, 7, 23958–23966 CrossRef CAS PubMed
.
- Y. Liu, S. Zhou, L. Fan and H. Fan, Microchim. Acta, 2016, 183, 2605–2613 CrossRef CAS
.
Footnotes |
| † Dedicated to Prof. Jean-Marie Lehn on the occasion of his 80th birthday |
| ‡ Electronic supplementary information (ESI) available. See DOI: 10.1039/c9qm00587k |
| This journal is © the Partner Organisations 2020 |


