DOI:
10.1039/D0QI00907E
(Review Article)
Inorg. Chem. Front., 2020,
7, 4711-4753
Usage of P–V–L bond theory in studying the structural/property regulation of microwave dielectric ceramics: a review†
Received
27th July 2020
, Accepted 22nd September 2020
First published on 24th September 2020
Abstract
Structure/property regulation is widely investigated for providing theoretical foundations and guidance for designing microwave dielectric ceramics. P–V–L bond theory targets the provision of detailed structural parameters of crystals and fundamental chemical bond characteristics, such as bond ionicity, bond covalency and bond susceptibility. In this review, the concept of P–V–L bond theory, the binary bonding formula theory of complex polycrystalline and the usage of P–V–L bond theory regarding the structural effects on dielectric properties in various crystal structures are introduced. And the bond traits provided via P–V–L bond theory in several ion-doping modification systems are generalized with structural evolution and dielectric properties. Furthermore, conjectures about the development and application directions of P–V–L bond theory in the study of structure/properties of microwave dielectric ceramics are put forward.
 Hongyu Yang | Hongyu Yang is a PhD candidate in the School of Electronic Science and Engineering, University of Electronic Science and Technology of China, Chengdu. He obtained his Bachelor's Degree in 2015 from the Southwest University of Science and Technology, China. His research interests include microwave dielectric materials and low temperature co-fired ceramics. |
 Shuren Zhang | Shuren Zhang is a professor in the School of Electronic Science and Engineering, University of Electronic Science and Technology of China, Chengdu. His research interests include electronic materials and devices, electronic materials and engineering, electronic thin films and integrated devices. |
 Hongcheng Yang | Hongcheng Yang is a PhD candidate in the School of Electronic Science and Engineering, University of Electronic Science and Technology of China, Chengdu. She obtained her Bachelor's Degree in 2016 from the Southwest University of Science and Technology, China. Her research interests include microwave dielectric materials and low temperature co-fired ceramics. |
 Enzhu Li | Enzhu Li is a professor in the School of Electronic Science and Engineering, University of Electronic Science and Technology of China, Chengdu. She received her PhD degree from Tokyo Institute of Technology in 2008. Her research interests include microwave dielectric materials and low temperature co-fired ceramics. |
1. Introduction
Microwave dielectric ceramics (MWDCs) are widely used in microwave frequency (300 MHz–300 GHz) circuits as dielectric materials to supply one or more functions. MWDCs have become promising in electronic communication technology for their widespread applications in filters, resonators, RF/antennae, frequency discriminators in electronic countermeasures, navigation, radar, home satellite live television receivers and hand-held mobile phones.1,2 For their practical application, three key indicators are required: a moderate dielectric constant εr value to make the size of the device controllable, a high Q × f value (Q = 1/tan![[thin space (1/6-em)]](https://www.rsc.org/images/entities/char_2009.gif) δ, f is the resonant frequency) to reduce the insertion loss of the application, and a near zero τf value to ensure the carrier signal of the application does not drift with the working environment of the communication devices.3,4 Specifically, ceramics with various εr values show different application fields: e.g. εr < 20: Al2O3 (εr = 10, Q × f = 500
δ, f is the resonant frequency) to reduce the insertion loss of the application, and a near zero τf value to ensure the carrier signal of the application does not drift with the working environment of the communication devices.3,4 Specifically, ceramics with various εr values show different application fields: e.g. εr < 20: Al2O3 (εr = 10, Q × f = 500![[thin space (1/6-em)]](https://www.rsc.org/images/entities/char_2009.gif) 000 GHz)5 for electronic circuit packages and dielectric resonance antennae, Zn2SiO4 (εr = 6.6, Q × f = 219
000 GHz)5 for electronic circuit packages and dielectric resonance antennae, Zn2SiO4 (εr = 6.6, Q × f = 219![[thin space (1/6-em)]](https://www.rsc.org/images/entities/char_2009.gif) 000 GHz, τf = −61 ppm per °C)6 and (Mg1−xZnx)Al2O4 (εr = 7.9–8.5, Q × f = 82
000 GHz, τf = −61 ppm per °C)6 and (Mg1−xZnx)Al2O4 (εr = 7.9–8.5, Q × f = 82![[thin space (1/6-em)]](https://www.rsc.org/images/entities/char_2009.gif) 000–106
000–106![[thin space (1/6-em)]](https://www.rsc.org/images/entities/char_2009.gif) 000 GHz, τf = −73 ppm per °C)7 for microwave substrates; 20 < εr < 70: Ba(B1/3B′1/3)O3 (B = Zn/Mg/Co/Ni, B′ = Ta/Nb) series of complex perovskite structures1,8–11 (BaZn1/3Ta2/3O3: εr = 29, Q × f = 150
000 GHz, τf = −73 ppm per °C)7 for microwave substrates; 20 < εr < 70: Ba(B1/3B′1/3)O3 (B = Zn/Mg/Co/Ni, B′ = Ta/Nb) series of complex perovskite structures1,8–11 (BaZn1/3Ta2/3O3: εr = 29, Q × f = 150![[thin space (1/6-em)]](https://www.rsc.org/images/entities/char_2009.gif) 000 GHz, τf = 0 ppm per °C), BaTi4O9,12 Ba2Ti9O2013 and (Zr, Sn)TiO414,15 for microwave dielectric resonance devices; εr > 70: BaO–Ln2O3–TiO2 (Ln = Sm, Nd)16–18 and CaO–Li2O–Ln2O3–TiO219–21 systems. Up to now, several MWDC materials with εr values of 5–100 have been commercialized, possessing excellent high Q × f values and zero τf values:1e.g. BaB1/3Ta2/3O3 (B = Mg, Zn), Ba(Co,Zn)1/3Nb2/3O3, SrTiO3–LaAlO3, and ZrTiO4–ZnNb2O6. Driven by the rapid development of the internet of things (IoT) and 5th generation wireless systems (5G), much effort has been devoted to the exploration of novel MWDC materials with excellent dielectric performances.
000 GHz, τf = 0 ppm per °C), BaTi4O9,12 Ba2Ti9O2013 and (Zr, Sn)TiO414,15 for microwave dielectric resonance devices; εr > 70: BaO–Ln2O3–TiO2 (Ln = Sm, Nd)16–18 and CaO–Li2O–Ln2O3–TiO219–21 systems. Up to now, several MWDC materials with εr values of 5–100 have been commercialized, possessing excellent high Q × f values and zero τf values:1e.g. BaB1/3Ta2/3O3 (B = Mg, Zn), Ba(Co,Zn)1/3Nb2/3O3, SrTiO3–LaAlO3, and ZrTiO4–ZnNb2O6. Driven by the rapid development of the internet of things (IoT) and 5th generation wireless systems (5G), much effort has been devoted to the exploration of novel MWDC materials with excellent dielectric performances.
Considering that crystal structures of different microwave dielectric ceramics are quite different, it is of great significance to study the influence of crystal structure and the origin of dielectric properties of ceramics in the microwave region for improvements in design and performance.22,23 The properties of microwave dielectric ceramics are affected mainly by the crystal structure and fabrication process. The fabrication process, such as raw materials, preparation technology, phase structure, numbers of grain boundaries per volume, grain growth, porosity and sintering aids, inevitably results in extrinsic loss of microwave dielectric properties. For instance, the choice of boric acid as a raw material instead of boron oxide is attributed to its better solubility and dispersion in deionized water when preparing Li2O–B2O3–SiO2 glass frit.24 A sol–gel method realizes better uniformity at the molecular level than a solid-state process, which is beneficial for improving the Q × f value.25 A high sintering temperature positively affects the cation ordering of Ba(Mg1/3Ta2/3)O3 ceramics and then improves the Q × f value.26 Ceramic samples with compact microstructures and uniform distributions of average grain size can also reduce the extrinsic dielectric loss.27 When controlling external factors, such as preparation/fabrication technology, the influence of crystal structure as an internal factor has a crucial impact on microwave dielectric performance. Up to now, several theories have been developed to study the regulation between crystal structure and dielectric properties. For example, THz time-domain spectroscopy and far-infrared reflectance spectroscopy can be used to analyse the intrinsic properties of the lattice vibration of material systems;28–31 the Clausius–Mossotti equation predicts the macroscopic dielectric constant of an ionic crystal by using ionic polarizabilities;32,33 bond-valence theory gives the actual valence state of ions in a crystal structure and provides the basis for the state of the ions.34–37 These concepts help researchers gain better insights into the relationship between crystal structure and dielectric properties.
Nowadays, the chemical bond theory named the P–V–L bond theory, established by Phillips, Van Vechten and Levine,38–43 which provides fundamental bond characteristics, has been paid increasing attention and been applied to various dielectric ceramic systems to discuss the influence of crystal structure on the variation in chemical bond parameters and to establish the relationship between chemical bond characteristics and dielectric properties.
Chemical bond characteristics of crystals are crucial for analysing and studying the chemical and solid-state physical aspects of crystal structures. Several crystal features can be explained qualitatively using these concepts: e.g. the greater the electronegativity difference between A and B atoms in binary compounds, the more likely it is that a rock salt structure can be formed, otherwise an open covalent structure is preferred.41 During the early 1970s, the chemical bond theory first proposed by Phillips and Van Vechten (abbreviated as P–V) was applied to characterize crystal features quantitatively. This theory relies on the dielectric definition of crystals and defines the calibration of chemical bond characteristics and the relationship between various micro-parameters in crystals. It has been used effectively to calculate many aspects of crystals, such as bond charge,44,45 elastic and piezoelectric constants,46,47 electronic structure,48 thermodynamic properties,49 cohesive energies and heats of formation,50 nonlinear optical susceptibilities,51–53 effective lattice charges,54 valence band parameters,55 band structures,56 impurity binding energies,57 photoelastic constants,58,59 and electro-optic and elasto-optic phenomena.60 It should be noted that the P–V theory applies only to eight-electron ANB8−N type crystals with one type of chemical bond: e.g. zinc blende, wurtzite, and rock salt. Following that, Levine then expanded the application of P–V bond theory to AmBn (NaCl, AIVBVI, ANB16−N), AIBIIICVI2, AIIBIVCV2 and AIIIBVCVI4 systems by dividing the crystal properties into parameters related to a single bond, such as polarizability, ionic properties and the average number of electrons per bond.42 However, it should be realized that there are limitations since two types of bonds, with the same coordination number and nearly the same nearest-neighbour distances should be satisfied simultaneously. Even so, a normalization idea attributing the crystal properties to individual chemical bonds was developed.
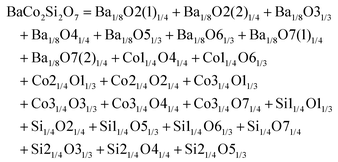
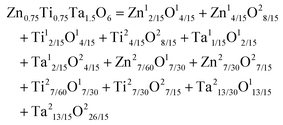
In order to make P–V–L bond theory more applicable to extensive and complex multi-component crystals (AaBbCcDd), Zhang put forward the idea of decomposing complex polycrystals into binary crystals, where the crystal can be regarded as an aggregation of chemical bonds between ions.61,62 Suppose that two ions that make up the chemical bond have the same symmetrical positions in the crystal, and bonds with the same length belong to one type of bond. Each kind of chemical bond with a binary expression has its own specific bond parameters, spatial configuration and proportion of elements. If the element proportional relationship of this kind of chemical bond is called a binary bond formula, then each kind of chemical bond in a crystal corresponds to a unique binary bond formula. The complex crystal is the aggregation of all the kinds of chemical bonds, and the molecular formula of the crystal is the sum of all the kinds of binary bond formulae. Then P–V–L bond theory can be applied to calculate the binary bond formula. Finally, once the relationship between the binary bond formula and complex crystals has been established, the purpose of studying the chemical bond properties of multiple complex crystals can be understood, and the relationship between microstructural parameters and macroperformance can be constructed. With these considerations in mind, P–V–L bond theory has been applied to several complex compounds. For instance, in a high-temperature oxide superconductor structure, the relationships between critical transition temperature and covalency have been established in REBa2Cu3O7 (RE = Ln)63,64 and HgBa2Can−1CunO2n+2+δ systems.65 The calculation of chemical bond parameters of a hexagonal ferrite (such as M-type BaFe12O19 or W-type BaCo2Fe16O27) crystal solved the calculation of isomeric displacement of Mössbauer spectra;66 the stability of crystal structures was predicted via the calculations of lattice energy and thermal expansion of solid materials,67,68etc. Therefore, the physical and chemical properties of complex crystals have been explained at the scale of chemical bonds. Similarly, with the help of the binary bond splitting theory of polycrystalline materials, the P–V–L bond theory is expected to be applicable in MWDC systems.
In this contribution, we review the bond theory established by Phillips, Van Vechten and Levine and the binary bonding formula theory of complex polycrystals proposed by Zhang, and we specifically precis current studies focusing on structure–properties relationships discussed using P–V–L bond theory, and summarizing how P–V–L bond theory correlates with microwave dielectric properties.
2. P–V–L bond theory
The chemical bond theory established by Phillips, Van Vechten and Levine (P–V–L) is a dielectric description of the chemical bonds in a crystal structure, which correlates the structure and dielectric properties of a crystal. Firstly, in the theoretical calculation of a binary crystal ANB8−N, Phillips chose to build a unit cell with two atoms, where a symmetrical coordinate system is based on the middle position of the atoms.41 Thus, the periodic potential of a crystal is expanded by Fourier transformation:| |  | (1) |
| | | VG = [VA(G) + VB(G)]·cos(G·r) + i[VA (G) − VB (G)]·sin(G·r) | (2) |
where G refers to the reciprocal lattice vector, VA and VB are the pseudopotentials of atoms A and B, and VA + VB is the homopolar potential, and VA − VB is the ionic potential. Therefore, eqn (2) between real basis functions is:| |  | (3) |
That is, the average energy gap between bonding and anti-bonding molecular orbitals Eg is divided into two parts: the average covalent energy gap Eh caused by homopolar potential energy and the average ionic energy gap C caused by ionic potential energy. The following relationship was put forward:
The expressed form of the complex dielectric function is given as ε(ω) = ε1(ω) + iε2(ω), which is correlated with the Kramers–Kronig relationship:
| |  | (5) |
By using a nearly free electron model isotropically applied to three dimensions, the low frequency limit ε1(0) was given as follows:69
| |  | (6) |
| |  | (7) |
| |  | (8) |
where ℏ
ωp refers to the Planck constant,
EF is the Fermi energy,
Eg is the energy gap,
N equals 4/atomic volume, and
ωp is the free electron plasma frequency.
Following that, Van Vechten provided calculation methods for the electronic dielectric constants of 68 crystals.39,40 The homopolar part Eh is in reverse proportion to the nearest-neighbour distance, and the expression of the heteropolar part C is given as:
| |  | (10) |
| |  | (11) |
where
r refers to the ionic radius of atom A/B,
Z is the number of valence electrons on atom A/B, e
−k′′sR is the Thomas–Fermi screening factor,
b is the value of order of unity obtained from
ref. 39, which lies in the range 1.4–1.6,
a0 is the Bohr radius, and
Ne refers to eight electrons per diatomic volume.
Ne is calculated as:
| |  | (14) |
for a crystal with one type of bond,
vb = 1/
Nb (
Nb refers to the bond density, which is also the number of bonds per unit volume),
ZA is the valence electron of atom A, and
NCA is the coordination number of atom A.
The effect of the d state in atomic cores should be considered; therefore, ε0 is adjusted as:
| |  | (15) |
| | | D = ΔαΔβ − (δαδβ)·(Zα − Zβ)2 | (16) |
Δ and
δ are parameters for the rows of the periodic table corresponding to
α and
β, which are chosen from
Table 1. Therefore, the dielectric constants of crystals, such as diamond, zinc blende, wurtzite and rock-salt type crystals can be predicted
via P–V bond theory.
Table 1
Δ and δ values of elements from the periodic table
| row |
Δ
|
δ
|
| 1 |
1.0 |
1.0 |
| 2 |
1.0 |
1.0 |
| 3 |
1.0 |
1.0 |
| 4 |
1.12 |
1.0025 |
| 5 |
1.21 |
1.0050 |
| 6 |
1.31 |
1.0075 |
As is known, chemical bonds are strong interaction forces between two or more atoms/cations in a molecule or crystal. Generally, the bonds formed by electrostatic attraction and electron transfer between atoms are called ionic bonds, in which ions can be single or atomic groups, such as Na+, Cl− or NO3−. While bonds formed between atoms by sharing pairs of electrons (overlapping clouds of electrons) are covalent bonds: e.g. HCl: H–Cl polar bond, and Cl2: Cl–Cl nonpolar bond. In crystals, chemical bonds are beneficial for discussing several aspects of chemical and solid-state physical properties: for instance, the heat absorption and exothermic effects of a chemical reaction, the stability of a crystal structure, the melting/boiling point and the hardness of a crystal. Therefore, it is of great importance to study the chemical bonds at great length to achieve a better understanding of a crystal structure and its chemical–physical properties.
People find it appealing to determine the ionic and covalent contribution of chemical bonds since they are not in a fully ionic or covalent state. In an ANB8−N crystal, Pauling defined the ionicity from a thermochemical point of view, where the ionicity originates from extra-ionic energy ΔAB, which is proportional to the absolute value of the electronegativity difference between A and B atoms (M refers to the number of resonating bonds):41
| |  | (17) |
To give a spectroscopic definition of ionicity and covalency, Phillips defined the polar coordinates as in Fig. 1:
| |  | (18) |
| |  | (19) |
| |  | (20) |
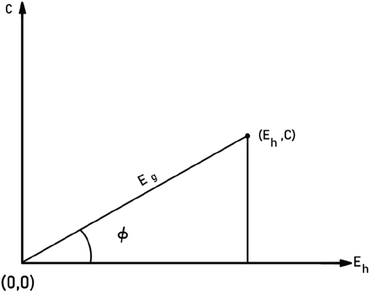 |
| | Fig. 1 A sketch showing how (Eg, φ) polar coordinates correspond to the covalent and ionic energies represented as Cartesian coordinates (Eh, C). The polar angle φ is called the ionicity phase angle (reprinted with permission from ref. 41. 2020 Copyright American Physical Society) (http://dx.doi.org/10.1103/RevModPhys.42.317). | |
Therefore, the ionicity or covalency of an ANB8−N crystal can be quantitatively calculated. By using the concept of ionicity, the coordination environments of 68 ANB8−N crystals, such as diamond, zinc blende, wurtzite and rock-salt type, were predicted precisely, as shown in Fig. 2, where crystals tend to be four-fold coordinated if fi < 0.785 ± 0.010; otherwise, they are six-fold coordinated.
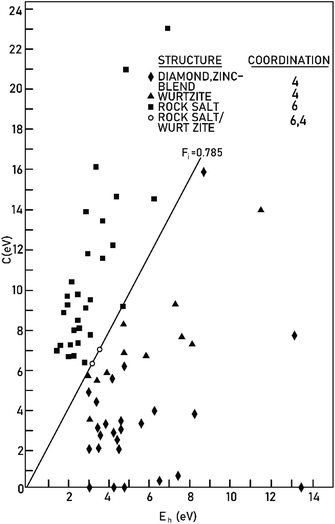 |
| | Fig. 2 The separation of four-fold and six-fold coordinated structures, using the spectroscopically defined covalent and ionic energy gaps Eh and C, respectively (reprinted with permission from ref. 41. Copyright 2020 American Physical Society) (http://dx.doi.org/10.1103/RevModPhys.42.317). | |
However, it should be noted that P–V theory is restricted to ANB8−N crystals with only one type of chemical bond. To make it more applicable to other complex systems, Levine expanded the P–V theory to AmBn-type crystals and some systems with multiple bonds by using the idea of decomposing bulk properties into individual chemical bonds. Therefore, the macro-properties of crystal can be regarded as the sum of micro-contributions of chemical bonds. In his modification, one can expect the macro-susceptibility to be given by:42
| |  | (21) |
where
Fμ represents the proportion of
μ-type bonds among all chemical bonds of crystals,
χμ is the susceptibility of
μ-type bonds,
Nμb is the bond density of
μ-type bonds, that is, the number of
μ-type chemical bonds per unit volume, and
χμb is the susceptibility of an individual bond in the
μ-type bonds. The dielectric constant and susceptibility of
μ-type bonds can be expressed as:
| |  | (22) |
where
εμ is the dielectric constant of a
μ bond, and
Ωμp is the plasma frequency of a
μ bond, which is composed of:
| |  | (24) |
where
Nμe is the number of valence electrons of a
μ bond,
Aμ and
Dμ, similar to eqn
(7) and (15) corresponding to a
μ bond. The Fermi energy
EμF is calculated from the Fermi wave vector
kμF:
| |  | (25) |
where
Nμe is defined as:
| |  | (27) |
| |  | (28) |
| |  | (29) |
with
nμv the number of valence electrons per
μ bond, and
vμb the bond volume.
A special note for Levine's theory is that the heteropolar part C in an AmBn crystal is different and is adjusted as:
| |  | (30) |
| |  | (31) |
where
rμ0 = (
rA +
rB)/2, and the value of
bμ is correlated with the average coordination number
Nμc:
| |  | (32) |
Therefore, Levine's modification expanded the application of P–V theory to AmBn binary systems. Although it is still not practical for more complex multi-systems, the idea of decomposing the macro-properties into individual bonds is beneficial for future work.
3. Binary bonding formula theory of complex polycrystals
In the process of materials research, compositions of materials are generally not confined to binary systems. For instance, high-entropy alloys, usually formed of five or more equal or approximately equal metals, have excellent properties in hardness, high temperature resistance, corrosion resistance, and wear resistance.70 In the MWDC field, the ionic modification is usually based on a ternary system as well, such as Bi2O3–TiO2–V2O5,71 ZnO–TiO2–Nb2O5,72 or BaO–MgO–Nb2O573 systems. It is important to have a better understanding of the impact of chemical bond features on crystal structure. Therefore, P–V–L bond theory should be appropriately adjusted for a good fit with multi-systems.
The composition of a crystal can be expressed by the chemical molecular formula, which represents the atomic ratio among various chemical elements that constitute the crystal. However, the expression does not correspond to the spatial configuration in the specific crystal structure. On the other hand, the crystal can also be regarded as the aggregation of various ions and chemical bonds between ions. If the two ions that compose the chemical bond sharing the same symmetrical positions in a crystal and bond length are classified as the same type of bond, then this type of bond with the same specific properties, spatial configuration, and proportion of elements is called a binary bonding formula. Since more than one type of bond exists in a crystal, each kind of bond corresponds to a unique binary bonding formula. The crystal is the aggregation of various types of chemical bonds, so that the molecular formula of the crystal should also be the sum of the binary bonding formulas. Hence, one can deal with the binary bonding formula with P–V–L bond theory to obtain bond features. Once the proportional relationship between the binary bonding formula and complex multi-element crystal formula has been built, the purpose of dealing with the complex polycrystalline system is realized. Briefly speaking, the key idea is to convert the chemical formula of a complex polycrystal into a combination of binary bonding formulas.
Zhang developed the method for decomposing complex polycrystals into the binary bonding formula of a crystal when the crystal structure, coordination environment and element proportion in the crystal formula have been determined.
Suppose that the molecular formula of any complex crystal is:62,74
| |  | (34) |
where A and B refer to cations and anions, respectively, A
i and B
j symbolise different elements or symmetry positions of equivalent elements,
ai and
bj indicate the number of elements. Correspondingly, the binary bonding formula of any type of A–B bond can be resolved under the conditions of given coordination numbers
NCAi and
NCBj:
| |  | (35) |
| |  | (36) |
| |  | (37) |
where
N(B
j − A
i) is the number of A
i cations in the ligand of the B
j ion, and
N(A
i − B
j) is the number of B
j cations in the ligand of the A
i ion. The binary bonding formula should be electrically neutral like the crystal, and the same ion shows different valence states in different bonding formulas. Therefore, it is crucial to determine the effective valence electron number of the ion in the specific bonding formula.
Suppose that A and B ions in any μ bond present valences of Pμ(A–B) and Pμ(B–A), the following equation is expected:
| |  | (38) |
The effective charges qμA and qμB of A and B ions are calculated as:
| |  | (39) |
| |  | (40) |
Therefore, the valence electron numbers ZA and ZB values in P–V–L bond theory should be adjusted as effective valence electron numbers (ZA)* and (ZB)*:75
Combining P–V–L bond theory and the binary bonding formula expression, crucial fundamental bond parameters could be achieved, and two key indicators of MWDC, dielectric polarization εr and Q × f value, could be discussed. Starting from the crystal structure configuration, one can calculate the detailed bond volume vμb using crystal structure parameters from the ICSD database or Rietveld refinement results. Combined with the coordinate environment and valence electrons of atoms, the parameter for the number of valence electrons of a μ bond, Nμe, could be obtained, and finally the bond ionicity fi, bond covalency fc and bond susceptibility χ could be specially assigned, which is helpful in discussing dielectric polarization. Furthermore, lattice energy U presents the binding ability between ions, where a high U value stands for a stable structure, and the internal loss caused by anharmonic vibration would be reduced. For MWDC, it reflects the internal dielectric loss tan![[thin space (1/6-em)]](https://www.rsc.org/images/entities/char_2009.gif) δ (Q = 1/tan
δ (Q = 1/tan![[thin space (1/6-em)]](https://www.rsc.org/images/entities/char_2009.gif) δ, f is the resonant frequency), which is closely corelated with the Q × f value. As mentioned, there is no 100% ionic chemical bond in a crystal; therefore, the ionic part of a chemical bond's contribution to lattice energy Ubi and the covalent part of contribution Ubc should be considered. The lattice energy U is calculated as follows:68
δ, f is the resonant frequency), which is closely corelated with the Q × f value. As mentioned, there is no 100% ionic chemical bond in a crystal; therefore, the ionic part of a chemical bond's contribution to lattice energy Ubi and the covalent part of contribution Ubc should be considered. The lattice energy U is calculated as follows:68
| |  | (45) |
| |  | (46) |
where
Zμ+ and
Zμ− are the valence states of the cation and anion,
dμ is the bond length, and the
m/
n value is obtained from the binary bonding formula.
4. Usage of P–V–L bond theory in dielectric ceramics
As mentioned above, much attention has been paid to the application of P–V–L bond theory in the MWDC field in recent years because investigations of chemical bond parameters are instrumental in studying structural features, and then providing the basis for ionic doping modification and the design of novel materials, which is helpful for understanding microwave dielectric properties. Up to now, several ceramic systems with excellent dielectric performances have been developed, as listed in Table 2.13,76–95 In this section, current studies of applying P–V–L bond theory in the MWDC field with regard to structural-property investigations are summarized.
Table 2 Representative microwave dielectric ceramic systems with different dielectric constants
| Material systems |
ST (°C) |
ε
r
|
Q × f (GHz) |
τ
f (ppm per °C) |
Ref. |
| Mg2SiO4 |
1450 |
6.8 |
270![[thin space (1/6-em)]](https://www.rsc.org/images/entities/char_2009.gif) 000 000 |
−60 |
76
|
| Al2O3 |
1550 |
10.0 |
333![[thin space (1/6-em)]](https://www.rsc.org/images/entities/char_2009.gif) 000 000 |
−60 |
77
|
| 0.75MgAl2O4–0.25TiO2 |
1400–1460 |
11.0 |
105![[thin space (1/6-em)]](https://www.rsc.org/images/entities/char_2009.gif) 400 400 |
−12 |
78
|
| Mg4(TaNb0.975V0.025)O9 |
1200 |
12.0 |
200![[thin space (1/6-em)]](https://www.rsc.org/images/entities/char_2009.gif) 000 000 |
−73 |
79
|
| MgWO4 |
1150 |
13.1 |
69![[thin space (1/6-em)]](https://www.rsc.org/images/entities/char_2009.gif) 000 000 |
−58 |
80
|
| Mg2TiO4 |
1500 |
14.2 |
160![[thin space (1/6-em)]](https://www.rsc.org/images/entities/char_2009.gif) 000 000 |
|
81
|
| NdNbO4 |
1250 |
19.6 |
33![[thin space (1/6-em)]](https://www.rsc.org/images/entities/char_2009.gif) 000 000 |
−24 |
82
|
| 0.95MgTiO3–0.05CaTiO3 |
1400 |
20.0 |
56![[thin space (1/6-em)]](https://www.rsc.org/images/entities/char_2009.gif) 000 000 |
0 |
83
|
| (Zn0.7Mg0.3)TiO3 |
950 |
22.0 |
65![[thin space (1/6-em)]](https://www.rsc.org/images/entities/char_2009.gif) 000 000 |
−80 |
84
|
| Ba(Mg1/3Ta2/3)O3 |
1640 |
24.0 |
430![[thin space (1/6-em)]](https://www.rsc.org/images/entities/char_2009.gif) 000 000 |
5 |
85
|
| 0.9LaAlO3–0.1SrTiO3 |
1680 |
26.7 |
139![[thin space (1/6-em)]](https://www.rsc.org/images/entities/char_2009.gif) 000 000 |
−50 |
86
|
| Zn1.01Nb2O6/TiO2/Zn1.01Nb2O6 |
1200 |
26.8 |
99![[thin space (1/6-em)]](https://www.rsc.org/images/entities/char_2009.gif) 500 500 |
0.5 |
87
|
| La(Mg1/2Ti1/2)O3 |
1650 |
29.0 |
114![[thin space (1/6-em)]](https://www.rsc.org/images/entities/char_2009.gif) 000 000 |
−81 |
88
|
| ZnTiNb2O8 |
1250 |
34.0 |
42![[thin space (1/6-em)]](https://www.rsc.org/images/entities/char_2009.gif) 500 500 |
−52 |
89
|
| BaTi4O9 |
1250 |
36.0 |
50![[thin space (1/6-em)]](https://www.rsc.org/images/entities/char_2009.gif) 470 470 |
16 |
13
|
| Ba2Ti9O20 |
1300 |
37.0 |
57![[thin space (1/6-em)]](https://www.rsc.org/images/entities/char_2009.gif) 000 000 |
−6 |
13
|
| Zr0.8Sn0.2TiO4 |
1600 |
38.9 |
51![[thin space (1/6-em)]](https://www.rsc.org/images/entities/char_2009.gif) 500 500 |
0.7 |
90
|
| Ba5Nb4O15 |
1380 |
39.0 |
23![[thin space (1/6-em)]](https://www.rsc.org/images/entities/char_2009.gif) 700 700 |
78 |
91
|
| CaLa4Ti4O15 |
1550 |
41.1 |
50![[thin space (1/6-em)]](https://www.rsc.org/images/entities/char_2009.gif) 240 240 |
−25 |
92
|
| 0.76ZrTiO4–0.24ZnNb2O6 |
1260–1300 |
47.0 |
34![[thin space (1/6-em)]](https://www.rsc.org/images/entities/char_2009.gif) 000 000 |
0 |
93
|
| Li0.95Nb0.45Ti0.7O3 |
1100 |
56.2 |
8350 |
15 |
94
|
| BaO–Sm2O3–TiO2 |
1300–1450 |
74.0 |
12![[thin space (1/6-em)]](https://www.rsc.org/images/entities/char_2009.gif) 000 000 |
10 |
95
|
4.1 Monoclinic clinopyroxene-type
Clinopyroxene-type ABC2O6 (A = Ca; B = Co, Mg, Zn, Fe; C![[double bond, length as m-dash]](https://www.rsc.org/images/entities/char_e001.gif) Si, Ge) materials are crystallized as a monoclinic structure with a C2/c space group.96–98 Huber found out that the petedunnite CaZnSi2O6 phase stabilizes at P > 0.8 GPa; otherwise, it decomposes into Zn2SiO4, Ca2ZnSi2O7 and SiO2 if the pressure is low and temperature exceeds 650 °C.99 Distortions of the polyhedra were quantitatively analysed by Heuer in a CaBSi2O6 system (B = Fe, Zn).96 Recently, microwave dielectric properties of CaBSi2O6 (B = Co, Mg) were reported: εr = 6.04, Q × f = 12
Si, Ge) materials are crystallized as a monoclinic structure with a C2/c space group.96–98 Huber found out that the petedunnite CaZnSi2O6 phase stabilizes at P > 0.8 GPa; otherwise, it decomposes into Zn2SiO4, Ca2ZnSi2O7 and SiO2 if the pressure is low and temperature exceeds 650 °C.99 Distortions of the polyhedra were quantitatively analysed by Heuer in a CaBSi2O6 system (B = Fe, Zn).96 Recently, microwave dielectric properties of CaBSi2O6 (B = Co, Mg) were reported: εr = 6.04, Q × f = 12![[thin space (1/6-em)]](https://www.rsc.org/images/entities/char_2009.gif) 457 GHz, and τf = −18.91 ppm per °C for B = Co,100 sintered at 1175 °C; and εr = 7.46, Q × f = 59
457 GHz, and τf = −18.91 ppm per °C for B = Co,100 sintered at 1175 °C; and εr = 7.46, Q × f = 59![[thin space (1/6-em)]](https://www.rsc.org/images/entities/char_2009.gif) 638 GHz, and τf = −46 ppm per °C for B = Mg,101 sintered at 1290 °C. CaMgSi2O6 ceramics are suitable candidates for electronic circuit packaging and microwave substrates as a result of their low εr value and low dielectric loss. Therefore, a number of studies focus on improving its dielectric properties and reducing its sintering temperature to lower than 950 °C to make it applicable in low-temperature cofired ceramic (LTCC) technology: e.g. if Mn2+, Co2+, Zn2+, Cu2+, (Mn1/2Zn1/2)2+ cations are used to partially substitute for Mg sites,102–105 improvements in Q × f value could be achieved: an εr of 8.01, a Q × f of about 83
638 GHz, and τf = −46 ppm per °C for B = Mg,101 sintered at 1290 °C. CaMgSi2O6 ceramics are suitable candidates for electronic circuit packaging and microwave substrates as a result of their low εr value and low dielectric loss. Therefore, a number of studies focus on improving its dielectric properties and reducing its sintering temperature to lower than 950 °C to make it applicable in low-temperature cofired ceramic (LTCC) technology: e.g. if Mn2+, Co2+, Zn2+, Cu2+, (Mn1/2Zn1/2)2+ cations are used to partially substitute for Mg sites,102–105 improvements in Q × f value could be achieved: an εr of 8.01, a Q × f of about 83![[thin space (1/6-em)]](https://www.rsc.org/images/entities/char_2009.gif) 469 GHz, and a τf of ca. −45.27 ppm per °C for CaMg0.98Mn0.02Si2O6. In the CaMg0.96Cu0.04Si2O6 system: εr = 7.41, Q × f = 160
469 GHz, and a τf of ca. −45.27 ppm per °C for CaMg0.98Mn0.02Si2O6. In the CaMg0.96Cu0.04Si2O6 system: εr = 7.41, Q × f = 160![[thin space (1/6-em)]](https://www.rsc.org/images/entities/char_2009.gif) 100 GHz, and τf = −42 ppm per °C. Furthermore, sintering aids, such as Li2O–MgO–ZnO–B2O3–SiO2, LiF, and Li2CO3–V2O5, were used to decrease the sintering temperature of CaMgSi2O6 ceramics, where it was effectively reduced from 1300 °C to 900 °C using 15 wt% Li2O–MgO–ZnO–B2O3–SiO2 with great microwave dielectric performances: εr = 8.2, Q × f = 32
100 GHz, and τf = −42 ppm per °C. Furthermore, sintering aids, such as Li2O–MgO–ZnO–B2O3–SiO2, LiF, and Li2CO3–V2O5, were used to decrease the sintering temperature of CaMgSi2O6 ceramics, where it was effectively reduced from 1300 °C to 900 °C using 15 wt% Li2O–MgO–ZnO–B2O3–SiO2 with great microwave dielectric performances: εr = 8.2, Q × f = 32![[thin space (1/6-em)]](https://www.rsc.org/images/entities/char_2009.gif) 000 GHz, and τf = −48 ppm per °C.106
000 GHz, and τf = −48 ppm per °C.106
The schematic monoclinic crystal structure of CaMgSi2O6 can be seen in Fig. 3(a) and (b). A phase transition takes place between C2/c and P21/c when the arrangements of tetrahedral [SiO4] frameworks change, as indicated in Fig. 3(c).104 Structural parameters of the monoclinic phase reported by Thompson (COD #1000007) are:107 lattice parameters of a = 9.7397 Å, b = 8.9174 Å, c = 5.2503 Å, α = γ = 90°, β = 105.866°, and Vcell = 438.631 Å.3 In its structure, atoms of Mg and Ca occupy the 4e Wyckoff position while Si and O (three types of O: O1, O2 and O3) atoms are in the 8f site. The structure is built from three types of oxygen polyhedra, where the Ca cation is eight-fold coordinated, forming a [CaO8] dodecahedron, the Mg cation is coordinated with six oxygen anions and forms an [MgO6] octahedron, and the Si cation is surrounded by four oxygen anions and tetrahedral [SiO4] is constructed. Specifically, Ca–O1 × 2, Ca–O2 × 2, Ca–O3(1) × 2 and Ca–O3(2) × 2 bonds appear in the [CaO8] dodecahedron. While the Mg cation coordinates with O1 and O2 anions, in which four Mg–O1 bonds and two Mg–O2 bonds exist: Mg–O1(1) × 2, Mg–O1(1) × 2 and Mg–O1(1) × 2 bonds. Si–O1, Si–O2 and Si–O3(1) and Si–O3(2) exist in an [SiO4] tetrahedron. Based on the crystal structure and coordination environments of ceramic CaMgSi2O6, the binary bonding formula was considered first:
 |
| | Fig. 3 CaMgSi2O6 crystal structure with different phases and Ca-clusters: (a) the C2/c structure patterns, (b) a cluster of eight-fold coordinated Ca polyhedra, (c) the P21/c structure (reprinted with permission from ref. 104. Copyright 2019 Elsevier). | |
For cations, the effective valence electronic numbers are ZCa = 2, ZMg = 2, and ZSi = 4, respectively, while the Zo value of O2− anion depends on the electric neutrality in any chemical bond, which differs along with the bonding formula. For instance, Zo equals 3, 9/4 and 3 in Ca–O1, Ca–O2 and Ca–O3 bonds.
Ohsato reported that silicates presenting with low εr values, such as forsterite Mg2SiO4 (εr ∼ 6.8) and willemite Zn2SiO4 (εr ∼ 6.6), are caused by the large covalency of the [SiO4] tetrahedral framework.108 In a CaMgSi2O6 ceramic, average chemical bond covalency (Afc) values quantitatively calculated by Li are sequenced in descending order:102Afc(Si–O) = 35.55% > Afc(Mg–O) = 29.97% > Afc(Ca–O) = 16.50%, supporting the Si–O bond having a large bond covalency. Meanwhile, one can compare the contributions of chemical bonds to bond susceptibility χ to judge the dominant source of dielectric polarization. The bond susceptibility χ value calculated via their chemical bond parameters, can be seen in Table 1S in ESI,† where the contribution from Si–O bonds reaches approximately 66%, while Ca–O and Mg–O bonds provide small contributions of about 14% and 20%. This conclusion indicates that Si–O bonds play leading roles in dielectric polarizability. The calculated lattice energy Utotal of the CaMgSi2O6 system is as large as 39645 kJ mol−1, where Si–O bonds contribute 85% (33![[thin space (1/6-em)]](https://www.rsc.org/images/entities/char_2009.gif) 627 kJ mol−1), which is 6 times the total lattice energy of Ca–O and Mg–O bonds. Reported with same crystal structure, a CaCoSi2O6 ceramic with a Utotal value (19899 kJ mol−1) shows a Q × f value of about 12
627 kJ mol−1), which is 6 times the total lattice energy of Ca–O and Mg–O bonds. Reported with same crystal structure, a CaCoSi2O6 ceramic with a Utotal value (19899 kJ mol−1) shows a Q × f value of about 12![[thin space (1/6-em)]](https://www.rsc.org/images/entities/char_2009.gif) 457 GHz, which is smaller than that of CaMgSi2O6 (59
457 GHz, which is smaller than that of CaMgSi2O6 (59![[thin space (1/6-em)]](https://www.rsc.org/images/entities/char_2009.gif) 638 GHz) and also indicates the importance of structural stability to dielectric loss.100
638 GHz) and also indicates the importance of structural stability to dielectric loss.100
To improve microwave dielectric performances, bivalent Mn2+ cations have been used to partially replace Mg sites in Ca(Mg1−xMnx)Si2O6, and a solid solution forms in the region of x = 0–0.08, as shown in Fig. 4.102 The introduction of the Mn element leads to an increase in the average bond covalency fc value, where the fc value for Si–O bonds is still as large as 32%, resulting in an increasing trend in ionic polarizability based on the Clausius–Mossotti equation. Thus, the εr value increases monotonously. The increase in Utotal suggests an enhancement in structural stability. The reported Raman spectra in Fig. 5 also show the most intense peak around 1011 cm−1, which is caused by O–Si–O stretching vibration, which dominates the Raman-active vibration. On the other hand, by using the far-infrared reflectivity spectrum and obtaining the complex dielectric function by the Kramers–Kronig relationship, the intrinsic dielectric properties were acquired via a three-parameter classical harmonic oscillator model. The results indicate that the Mn2+ cation increases the εr value and decreases the dielectric loss (x = 0.02, Q × f = 83![[thin space (1/6-em)]](https://www.rsc.org/images/entities/char_2009.gif) 469 GHz), also reflects the improvement in structural stability of Ca(Mg0.98Mn0.02)Si2O6.
469 GHz), also reflects the improvement in structural stability of Ca(Mg0.98Mn0.02)Si2O6.
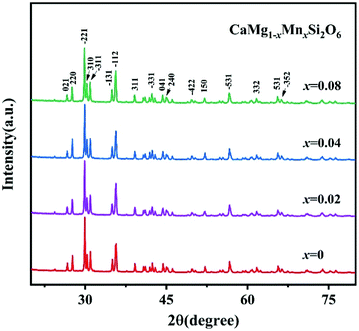 |
| | Fig. 4 The XRD patterns of CaMg1−xMnxSi2O6 (x = 0–0.08) ceramics sintered at 1300 °C (reprinted with permission from ref. 102. Copyright 2019 Elsevier). | |
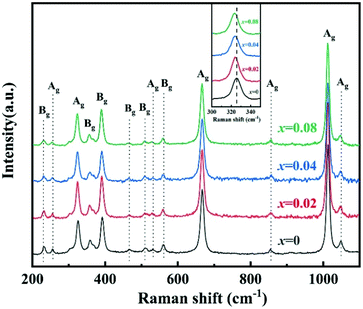 |
| | Fig. 5 The Raman spectra of CaMg1−xMnxSi2O6 (x = 0–0.08) ceramics (reprinted with permission from ref. 102. Copyright 2019 Elsevier). | |
4.2 Tetragonal akermanite and monoclinic melilite-type
4.2.1 Tetragonal A2BSi2O7 structure.
Based on a calculation of monoclinic CaMgSi2O6 ceramic, it is determined that Si–O bonds have the largest bond covalencies and play leading roles in dielectric polarization and crystal structural stability. However, it is not appropriate to jump to the conclusion that the fc value of the Si–O bond is the largest in all silicates according to P–V–L bond theory. Because for a specific crystal, such as a silicate structure, [MO4] (such as M = Co, Mg, Zn, Mn) and [SiO4] tetrahedral configurations coexist in tetragonal akermanite Sr2MSi2O7 compared with the existence of [MgO6] and [SiO4] frameworks in CaMgSi2O6, where the coordinate environments obviously change.109 Therefore, careful considerations should be taken into account.
A tetragonal akermanite-type A2BSi2O7 structure with a space group of P![[4 with combining macron]](https://www.rsc.org/images/entities/char_0034_0304.gif) 21m(113) usually exists in A2BSi2O7 (A = Sr, Ca; B = Mg, Zn, Co, Mn) systems. It has attracted public attention for it broad application prospects, such as lighting, display, photoelectric conversion, optoelectronic information, and biomolecular identification. Moreover, its excellent dielectric properties109 (Sr2MgSi2O7: εr = 8.3, Q × f = 55
21m(113) usually exists in A2BSi2O7 (A = Sr, Ca; B = Mg, Zn, Co, Mn) systems. It has attracted public attention for it broad application prospects, such as lighting, display, photoelectric conversion, optoelectronic information, and biomolecular identification. Moreover, its excellent dielectric properties109 (Sr2MgSi2O7: εr = 8.3, Q × f = 55![[thin space (1/6-em)]](https://www.rsc.org/images/entities/char_2009.gif) 000 GHz, and τf = −47.5 ppm per °C; Sr2MnSi2O7: εr = 8.8, Q × f = 32
000 GHz, and τf = −47.5 ppm per °C; Sr2MnSi2O7: εr = 8.8, Q × f = 32![[thin space (1/6-em)]](https://www.rsc.org/images/entities/char_2009.gif) 000 GHz, and τf = −58.5 ppm per °C; Ca2ZnSi2O7: εr = 11.0, Q × f = 13
000 GHz, and τf = −58.5 ppm per °C; Ca2ZnSi2O7: εr = 11.0, Q × f = 13![[thin space (1/6-em)]](https://www.rsc.org/images/entities/char_2009.gif) 500 GHz, and τf = −64.3 ppm per °C) also indicate their huge potential in the microwave communication field. Recently, Xiao investigated the structural effects of a tetragonal Sr2MgSi2O7 microwave dielectric ceramic via P–V–L bond theory, providing an insight into the structural properties of tetragonal silicates.110 According to the tetragonal structure of Sr2MgSi2O7 reported by Endo (COD #4317123),111 as can be seen from Fig. 6, the Sr2+ cation is surrounded by eight O2− anions, and Mg/Zn2+ and Si4+ cations are four-fold coordinated. An [MgO4] tetrahedron connects with an [SiO4] tetrahedron sharing a vertex (O3), while the [SiO4] framework interconnects through shared vertices (O1). The structural detail is listed in Table 3. Therefore, the binary bonding formula is expressed as:
500 GHz, and τf = −64.3 ppm per °C) also indicate their huge potential in the microwave communication field. Recently, Xiao investigated the structural effects of a tetragonal Sr2MgSi2O7 microwave dielectric ceramic via P–V–L bond theory, providing an insight into the structural properties of tetragonal silicates.110 According to the tetragonal structure of Sr2MgSi2O7 reported by Endo (COD #4317123),111 as can be seen from Fig. 6, the Sr2+ cation is surrounded by eight O2− anions, and Mg/Zn2+ and Si4+ cations are four-fold coordinated. An [MgO4] tetrahedron connects with an [SiO4] tetrahedron sharing a vertex (O3), while the [SiO4] framework interconnects through shared vertices (O1). The structural detail is listed in Table 3. Therefore, the binary bonding formula is expressed as:
 |
| | Fig. 6 Diagrammatic sketch of a tetragonal Sr2MgSi2O7 crystal structure. | |
Table 3 Structural parameters of tetragonal Sr2MgSi2O7 with a space group of P![[4 with combining macron]](https://www.rsc.org/images/entities/char_0034_0304.gif) 21m, where the lattice parameters are: a = b = 8.011 Å, c = 5.164 Å, α = β = γ = 90° and Vcell = 331.355 Å3
21m, where the lattice parameters are: a = b = 8.011 Å, c = 5.164 Å, α = β = γ = 90° and Vcell = 331.355 Å3
| Atom |
Position |
Fractional coordinates |
Occ |
|
x
|
y
|
z
|
| Sr |
4e |
0.3341 |
0.1659 |
0.5074 |
1.0 |
| Mg |
2a |
0.0000 |
0.0000 |
0.0000 |
1.0 |
| Si |
4e |
0.1353 |
0.3647 |
0.9458 |
1.0 |
| O1 |
2c |
0.5000 |
0.0000 |
0.1580 |
1.0 |
| O2 |
4e |
0.1384 |
0.3616 |
0.2506 |
1.0 |
| O3 |
8f |
0.0788 |
0.1947 |
0.8111 |
1.0 |
| Bond length (Å) |
[SrO8]: Sr–O1 × 1: 2.6050; Sr–O2(1) × 2: 2.7480; Sr–O2(2) × 1: 2.5830; Sr–O3(1) × 2: 2.7920; Sr–O3(2) × 2: 2.5870 |
| [MgO4]: Mg–O3 × 4: 1.9450 |
| [SiO4]: Si–O1 × 1: 1.6240; Si–O2 × 1: 1.5740; Si–O3 × 2: 1.5950 |
To make comparisons of bond features in tetragonal phases, a representative A2BSi2O7 (A = Sr, Ca; B = Mg, Mn) with both reported structural details111,112 and microwave dielectric performances (a Ca2MgSi2O7 ceramic is not used as a comparison here due to the fact that secondary phase SiO2 exists along with the Ca2MgSi2O7 phase113) is chosen. Detailed comparisons of bond parameters can be found in Table 2S in ESI.†
Table 4 shows the average bond ionicity, lattice energy and proportion of bond susceptibility of T-type A2BSi2O7 (A = Sr, Ca; B = Mg, Mn) structures. The variations in bond covalencies fc are not similar to those in CaMgSi2O6, where the largest average bond covalencies are revealed in B–O bonds (46%–48%), followed by those in Si–O bonds and then A–O bonds. This different situation is possibly caused by the coordination environments of the B cation. However, based on the Utotal and χ values, specifically, the U value of Si–O bonds drops from 34![[thin space (1/6-em)]](https://www.rsc.org/images/entities/char_2009.gif) 891 to 34347.kJ mol−1 (the Utotal for all bonds still decreases), which illustrates that Sr2MgSi2O7 is intrinsically more stable than the Ca2ZnSi2O7 structure. Although the actual Q × f value is also affected by external loss, such as densification, grain growth, and sintering process. The higher lattice stability explains the lower intrinsic dielectric loss. The proportion of Si–O bond susceptibility shows an increasing trend from 47.26% to 51.72%, corresponding to the increase in εr value from 8.3 to 11.0, suggesting the importance of Si–O bonds in dielectric polarizability.
891 to 34347.kJ mol−1 (the Utotal for all bonds still decreases), which illustrates that Sr2MgSi2O7 is intrinsically more stable than the Ca2ZnSi2O7 structure. Although the actual Q × f value is also affected by external loss, such as densification, grain growth, and sintering process. The higher lattice stability explains the lower intrinsic dielectric loss. The proportion of Si–O bond susceptibility shows an increasing trend from 47.26% to 51.72%, corresponding to the increase in εr value from 8.3 to 11.0, suggesting the importance of Si–O bonds in dielectric polarizability.
Table 4 Average bond ionicity Afi value, total lattice energy Utotal and proportion of bond susceptibility χ/∑χ of T-type A2BSi2O7 (A = Sr, Ca; B = Mg, Mn, Zn) structures
| Structure |
Bond type |
Af
i (%) |
U
total (kJ mol−1) |
χ/∑χ (%) |
| Sr2MgSi2O7 |
Sr–O |
85.75 |
5042 |
22.42 |
| Mg–O |
47.99 |
4058 |
30.32 |
| Si–O |
65.44 |
34![[thin space (1/6-em)]](https://www.rsc.org/images/entities/char_2009.gif) 891 891 |
47.26 |
| Sr2MnSi2O7 |
Sr–O |
85.81 |
5025 |
22.39 |
| Mn–O |
48.69 |
3910 |
30.33 |
| Si–O |
65.55 |
34![[thin space (1/6-em)]](https://www.rsc.org/images/entities/char_2009.gif) 859 859 |
47.27 |
| Ca2ZnSi2O7 |
Ca–O |
85.57 |
5166 |
22.40 |
| Zn–O |
47.00 |
4271 |
25.88 |
| Si–O |
65.66 |
34![[thin space (1/6-em)]](https://www.rsc.org/images/entities/char_2009.gif) 347 347 |
51.72 |
Hanuza reported the Raman and IR spectra of A2BSi2O7 (A = Sr, Ca; B = Mg, Zn) and calculated vibrational modes through lattice dynamic calculation,114 where the most intense and sharp Raman peaks around 901 cm−1, 650 cm−1 and 615 cm−1, are attributed to the symmetric stretching modes of the SiO3 groups, symmetric stretching modes of the SiOSi (where O refers to the bridging oxygen), and bending modes of SiO3 groups. IR spectra of Ca2ZnSi2O7 show that the largest oscillator strength Δε (1.497) originates from the E mode, which is determined by the bending mode of δ(SiOSi), the bending mode of the SiO3 group δ(SiO3) and the symmetric stretching mode of [CaO8] T′(Ca2+). This result also show that Si–O bonds are important for intrinsic dielectric properties.
In A2BSi2O7 structures, it is found that although Si–O bonds do not show the largest bond covalency value, they still play an indispensable role in structural stability and dielectric polarization.
4.2.2 Monoclinic A2BSi2O7 and AB2Si2O7 structures.
Monoclinic melilite-type structure silicate compounds can be found in A2BSi2O7 (A = Ba; B = Co, Zn, Cu, Mg) and AB2Si2O7 (A = Ba; B = Co, Zn) systems. However, structural diversities appear in Ba2ZnSi2O7 and BaCo2Si2O7 crystal structures. This phenomenon is caused by the different arrangements of the tetrahedral framework, as sketched in Fig. 7,115 [SiO4] interconnects with [ZnO4] in the a–c plane in Ba2ZnSi2O7, while [CoO4] connects with [SiO4] in the a–b plane. The structural details and bond parameters of Ba2ZnSi2O7 can be obtained using COD #8100589 reported by Kaiser.116 Song investigated the bond features in the BaCo2Si2O7 system through P–V–L bond theory.115 Due to the different coordination environments in Ba2ZnSi2O7 and BaCo2Si2O7 systems, as can be seen in Tables 3S and 4S in ESI,† the binary bonding formulas show large differences:
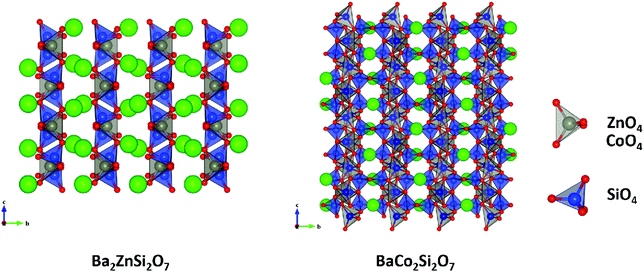 |
| | Fig. 7 Crystal structure of Ba2ZnSi2O7 and BaCo2Si2O7. | |
After comparing the bond parameters of Ba2ZnSi2O7 from Table 5S in ESI,† and BaCo2Si2O7 from ref. 115 in Table 5, similar conclusions can be drawn as in the tetragonal akermanite structure that although the Si–O bond does not have the largest bond covalency, its contribution to lattice energy and bond susceptibility still determines its importance in dielectric polarization and lattice stability.
Table 5 Average bond ionicity Afi value, total lattice energy Utotal and microwave properties of M-type Ba2ZnSi2O7 and BaCo2Si2O7
| Structure |
Bond type |
Af
i (%) |
U
total (kJ mol−1) |
Properties |
| Ba2ZnSi2O7 |
Ba–O |
85.35 |
4851 |
ε
r = 8.8 |
| Zn–O |
46.90 |
4033 |
Q × f = 34![[thin space (1/6-em)]](https://www.rsc.org/images/entities/char_2009.gif) 000 GHz 000 GHz |
| Si–O |
64.55 |
34![[thin space (1/6-em)]](https://www.rsc.org/images/entities/char_2009.gif) 326 326 |
| BaCo2Si2O7 |
Ba–O |
83.65 |
2331 |
ε
r = 9.3 |
| Co–O |
44.94 |
7644 |
Q × f = 31![[thin space (1/6-em)]](https://www.rsc.org/images/entities/char_2009.gif) 000 GHz 000 GHz |
| Si–O |
59.75 |
33![[thin space (1/6-em)]](https://www.rsc.org/images/entities/char_2009.gif) 088 088 |
4.3 Rock salt structure
Driven by the requirements for high reliability and high-frequency applications, the pursuit of novel material systems with low εr value and ultra-high Q × f (Q× f ≥100![[thin space (1/6-em)]](https://www.rsc.org/images/entities/char_2009.gif) 000 GHz) value has been underway. Li2O–AO–BO2 based systems can be regarded as the substitution of the A site in AO (A = Mg, Zn, Ni) with Li2BO3 (B = Ti, Sn, Zr). For example, Li2TiO3 and MgO are subordinated to the same rock-salt-type structure, and the ionic radii of cations are close to each other (IRLi,Ti = 0.708 Å, IRMg = 0.72 Å),117 which is beneficial for forming a solid solution. Therefore, material systems with the chemical formula of Li2xA1−xBxO1+2x (A = Mg, Zn, Ni; B = Ti, Sn, Zr)118,119 show large diversities as x varies. For instance, x = 1/5: Li2Mg4TiO7,120x = 1/4: Li2Mg3TiO6,121x = 2/5: Li4Mg3Ti2O9122 and x = 1/2: Li2MgTiO4.123 In 2016, novel rock-salt ceramics with the chemical formula of Li2O–3MgO–TiO2 (B = Ti, Sn, Zr) ceramics possess excellent microwave dielectric performances: εr = 8.8–15.2, Q × f = 86
000 GHz) value has been underway. Li2O–AO–BO2 based systems can be regarded as the substitution of the A site in AO (A = Mg, Zn, Ni) with Li2BO3 (B = Ti, Sn, Zr). For example, Li2TiO3 and MgO are subordinated to the same rock-salt-type structure, and the ionic radii of cations are close to each other (IRLi,Ti = 0.708 Å, IRMg = 0.72 Å),117 which is beneficial for forming a solid solution. Therefore, material systems with the chemical formula of Li2xA1−xBxO1+2x (A = Mg, Zn, Ni; B = Ti, Sn, Zr)118,119 show large diversities as x varies. For instance, x = 1/5: Li2Mg4TiO7,120x = 1/4: Li2Mg3TiO6,121x = 2/5: Li4Mg3Ti2O9122 and x = 1/2: Li2MgTiO4.123 In 2016, novel rock-salt ceramics with the chemical formula of Li2O–3MgO–TiO2 (B = Ti, Sn, Zr) ceramics possess excellent microwave dielectric performances: εr = 8.8–15.2, Q × f = 86![[thin space (1/6-em)]](https://www.rsc.org/images/entities/char_2009.gif) 000–152
000–152![[thin space (1/6-em)]](https://www.rsc.org/images/entities/char_2009.gif) 000 GHz (f = 8.3–10.7 GHz).124 Besides, the raw materials are cheap and easy to obtain, attracting a lot of public attention. However, it is noticed that the sintering characteristics are not satisfactory. For instance, the secondary-phase Mg2SnO4 exists along with the formation of the Li2Mg3SnO6 phase,125 ZrO2 usually accompanies the existence of the Li2Mg3ZrO6 phase.124 Most importantly, a large number of micropores formed by the volatilization of lithium at high temperature lead to cracks or fractures in the microstructure, which is detrimental to the development of properties. Therefore, it is crucial to solve these fundamental and nonnegligible issues.
000 GHz (f = 8.3–10.7 GHz).124 Besides, the raw materials are cheap and easy to obtain, attracting a lot of public attention. However, it is noticed that the sintering characteristics are not satisfactory. For instance, the secondary-phase Mg2SnO4 exists along with the formation of the Li2Mg3SnO6 phase,125 ZrO2 usually accompanies the existence of the Li2Mg3ZrO6 phase.124 Most importantly, a large number of micropores formed by the volatilization of lithium at high temperature lead to cracks or fractures in the microstructure, which is detrimental to the development of properties. Therefore, it is crucial to solve these fundamental and nonnegligible issues.
The volatilization of lithium can be compensated by burying the Li2Mg3BO6 (B = Ti, Sn, Zr) green pellets in sacrificial powders of the same composition, which improves the sintering densification and acquiring the pure phase.126 A non-stoichiometric ratio of the lithium of Li2(1+x)Mg3ZrO6 partially inhibits ZrO2 and impurities, achieving a Q × f value as high as 307319 GHz.127 By using a novel atmosphere-controlled sintering process, where ZrO2 powder provides a protective atmosphere, and Li2CO3 powder provides an Li-rich sintering atmosphere, Li2(1+x)Mg3SnO6 ceramics with very dense microstructures were achieved.125,128 Therefore, it is reasonable to discuss the structural–property relationship when the external loss caused by the fabrication process and sintering characteristics is controlled.
4.3.1 Variation of ionic occupancy in cubic Li2xMg1−xTixO1+2x (x = 1/4, 2/5 and 1/2) systems.
Li2xMg1−xTixO1+2x (x = 1/4, 2/5 and 1/2) systems belong to a rock-salt cubic structure with an Fm3m(225) space group. A schematic diagram of the crystal structure is presented in Fig. 8, where the Li/Mg/Ti atoms are randomly distributed in the 4a Wyckoff position, and one type of O atom is in the 4b site. All the cations are six coordinated, forming an [MO6] octahedron (M = Li/Mg/Ti).
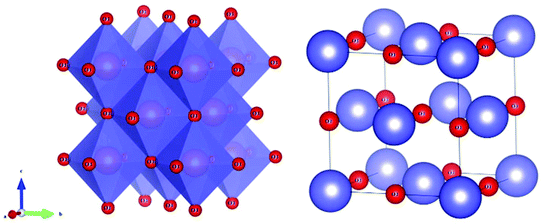 |
| | Fig. 8 Crystal structure of a cubic Li2xMg1−xTixO1+2x (x = 1/4, 2/5 and 1/2) system. | |
It is interesting to note that the above-mentioned systems share the same crystal structure, spatial configuration, coordinate environments and distribution of valence states. While the only difference lies in ionic occupancy, which directly leads to variations in N(Bj − Ai) and AmBn expression. Therefore, it is necessary to discover the impact of ionic occupancy on bond parameters and dielectric properties. The synthesis and structural properties of Li2xMg1−xTixO1+2x (x = 1/4, 2/5 and 1/2) ceramics were discussed by several researchers using P–V–L bond theory,122,123,126 where the binary bonding formulas are shown as:
| (x = 1/4)Li2Mg3TiO6 = Li2O12 + Mg3O13 + TiO1 |
| (x = 2/5)Li4Mg3Ti2O9 = Li4O14 + Mg3O13 + Ti2O12 |
| (x = 1/2)Li2MgTiO4 = Li2O12 + MgO |
where all the O
2− anions in Li–O, Mg–O and Ti–O bonds have the same effective valence electronic numbers (
Zo) of 3, 6, 12, while for the cations they are
ZLi = 1,
ZMg = 2, and
ZTi = 4, respectively. The relative bond features of Li
2xMg
1−xTi
xO
1+2x (
x = 1/4, 2/5 and 1/2) systems are listed in
Table 6.
Table 6 Bond parameters, bond ionicity and bond susceptibilities of Li2xMg1−xTixO1+2x (x = 1/4, 2/5 and 1/2) systems
| System |
Bond type |
E
h (eV) |
E
g (eV) |
d (Å) |
f
i (%) |
U (kJ mol−1) |
χ
μ
|
F
μ
|
χ
|
χ/∑χ (%) |
|
x = 1/4 |
Li–O |
6.379 |
11.561 |
2.09065 |
69.537 |
2102 |
1.8019 |
0.3333 |
0.60 |
31.89 |
| Mg–O |
6.379 |
16.029 |
2.09065 |
84.148 |
11![[thin space (1/6-em)]](https://www.rsc.org/images/entities/char_2009.gif) 711 711 |
1.9310 |
0.5000 |
0.97 |
51.26 |
| Ti–O |
6.379 |
22.611 |
2.09065 |
92.033 |
15![[thin space (1/6-em)]](https://www.rsc.org/images/entities/char_2009.gif) 402 402 |
1.9054 |
0.1667 |
0.32 |
16.86 |
|
x = 2/5 |
Li–O |
6.451 |
11.676 |
2.08160 |
69.500 |
4204 |
1.7871 |
0.4444 |
0.79 |
42.90 |
| Mg–O |
6.451 |
16.191 |
2.08160 |
84.143 |
11![[thin space (1/6-em)]](https://www.rsc.org/images/entities/char_2009.gif) 710 710 |
1.9138 |
0.3333 |
0.64 |
34.46 |
| Ti–O |
6.451 |
22.852 |
2.08160 |
92.041 |
30![[thin space (1/6-em)]](https://www.rsc.org/images/entities/char_2009.gif) 801 801 |
1.8861 |
0.2222 |
0.42 |
22.64 |
|
x = 1/2 |
Li–O |
6.470 |
11.709 |
2.07910 |
69.467 |
2111 |
1.7865 |
0.5000 |
0.89 |
48.47 |
| Mg–O |
6.470 |
16.239 |
2.07910 |
84.126 |
3920 |
1.9131 |
0.2500 |
0.48 |
25.95 |
| Ti–O |
6.470 |
22.923 |
2.07910 |
92.034 |
15![[thin space (1/6-em)]](https://www.rsc.org/images/entities/char_2009.gif) 467 467 |
1.8850 |
0.2500 |
0.47 |
25.57 |
From Table 6, it is straightforward to find that variation in ionic occupancy leads to a difference in bond proportion Fμ, where the Fμ values of Li–O and Ti–O bonds increase along with the x value, while for the Mg–O bond, it decreases. Average bond ionicity (fi) value shows a monotonous downward trend from 81.906% to 81.876%, where the fi value is descending as fi(Ti–O) > fi(Mg–O) > fi(Li–O). The lattice energy of the Ti–O bond UTi–O accounts for the majority contribution in the three types of systems. The susceptibility χμ of the Mg–O bond is the largest in the three types of systems; however, as indicated, the proportion of Mg–O bonds decreases, leading to different situations for the contribution to bond susceptibility, where the contributions of Li–O and Ti–O increase with the x value. The above-mentioned systems have the same structure and configuration; however, the primary relationship between the contribution of chemical bonds to bond susceptibility obviously changes along with the ionic occupancy, and then different bond features are displayed. This conclusion shows that it is necessary to consider variation in ionic occupancy when calculating bond properties of the same structure. Also, one can expect from Table 6 that the total lattice energy U in an x = 2/5 system has the largest value of 46715 kJ mol−1 and the smallest value of 21499 kJ mol−1 in an x = 1/2 system, which suggests superior structural stability in the Li4Mg3Ti2O9 system. And total bond susceptibility ∑χ shows a slight decline from 1.88 to 1.84 as x increases, indicating a gradually weakening dielectric polarization due to the χ value being proportional to bond susceptibility. Combined with the reported microwave dielectric performances: Li2Mg3TiO6 ceramic well-sintered at 1600 °C with an εrp (porosity corrected) of about 16.0, a tan![[thin space (1/6-em)]](https://www.rsc.org/images/entities/char_2009.gif) δ of about 7.3 × 10⁻⁵, and τf of ca. −13 ppm per °C;129 for Li4Mg3Ti2O9 ceramic sintered at 1450 °C: εrp = 15.9, tan
δ of about 7.3 × 10⁻⁵, and τf of ca. −13 ppm per °C;129 for Li4Mg3Ti2O9 ceramic sintered at 1450 °C: εrp = 15.9, tan![[thin space (1/6-em)]](https://www.rsc.org/images/entities/char_2009.gif) δ = 6.0 × 10⁻⁵, and τf = −7 ppm per °C;122 for Li2MgTiO4 ceramic sintered at 1350 °C: εrp = 15.1, tan
δ = 6.0 × 10⁻⁵, and τf = −7 ppm per °C;122 for Li2MgTiO4 ceramic sintered at 1350 °C: εrp = 15.1, tan![[thin space (1/6-em)]](https://www.rsc.org/images/entities/char_2009.gif) δ = 8.4 × 10⁻⁵, and τf = −4 ppm per °C,123 it is shown that experimental results provide evidence for the calculations. It is notable that the Q × f value is not only affected by intrinsic structural effects, but is very sensitive to extrinsic parts, such as sintering temperature, which promotes the growth of grain and alters the amount of grain boundaries. Thus, another nonnegligible contribution to actual dielectric loss comes from extrinsic loss.
δ = 8.4 × 10⁻⁵, and τf = −4 ppm per °C,123 it is shown that experimental results provide evidence for the calculations. It is notable that the Q × f value is not only affected by intrinsic structural effects, but is very sensitive to extrinsic parts, such as sintering temperature, which promotes the growth of grain and alters the amount of grain boundaries. Thus, another nonnegligible contribution to actual dielectric loss comes from extrinsic loss.
4.3.2 Ionic modification of the Mg/Ti site in cubic Li2Mg3TiO6 systems.
As important as the AmBn binary bonding formula expression, the discrepancy in elementary substance also affects the bond parameters because of their differences in ionic radii and electronegativity. To improve the microwave dielectric properties of Li2Mg3TiO6 ceramics, ionic substitutions of the Mg/Ti sites were extensively studied: e.g. divalent cations M2+ (M = Zn, Co, Cu) for the Mg site and tetravalent cations M4+ (M = Zr, Sn, Mg/Sb, M/Ta) for the Ti site. The relationship between bond parameters and microwave dielectric properties were correlated using P–V–L bond theory.
By using Cu2+ cations to partially replace Mg sites, it is shown that a cubic solid solution is formed within x = 0.00–0.20 in Li2Mg3−xCuxTiO6, as shown in Fig. 9.130 Lattice parameters a, b, c, and Vcell monotonously increase due to the larger ionic radii of Cu2+ than Mg2+ at CN = 6 (0.73 Å > 0.72 Å). With the increase in Cu2+ content, the ionicity fi values of all types of bonds present increasing trends with the εr value, indicating an enhancement in dielectric polarization. This conclusion is confirmed by the increases in observed and theoretical dielectric polarizability using the addition rule of dielectric polarizability, as shown in Fig. 10. The lattice energy U value decreases along with the x value, reflecting that the stability of crystal structure is gradually weakening and then the intrinsic loss would be reduced. Variations in the Q × f value shown in Fig. 11 provide evidence for the drop in dielectric loss. On the other hand, Kim defined the evaluating indicator of packing fraction (PF) in a scheelite compound as the proportion of volume of packed ions to the volume of a primitive unit cell, which is directly proportional to the Q × f value.131 In a cubic rock salt Li2Mg3TiO6 structure, a similar relationship between PF and the Q × f value can be revealed as well.
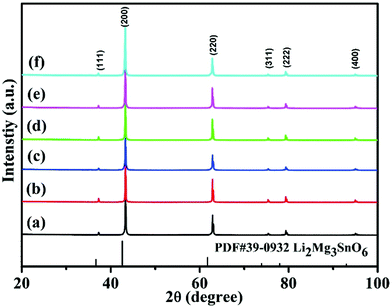 |
| | Fig. 9 The XRD patterns of Li2Mg3−xCuxTiO6 (x = 0.00–0.20) ceramics obtained at optimum temperatures: (a) x = 0, 1310 °C, (b) x = 0.04, 1280 °C, (c) x = 0.08, 1250 °C, (d) x = 0.12, 1250 °C, (e) x = 0.16, 1220 °C, (f) x = 0.20, 1220 °C (reprinted with permission from ref. 130. Copyright 2019 Elsevier). | |
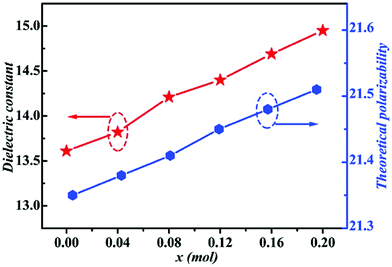 |
| | Fig. 10 The theoretical polarizability and εr of Li2Mg3−xCuxTiO6 (x = 0.00–0.20) ceramics obtained at optimal densification temperatures (reprinted with permission from ref. 130. Copyright 2019 Elsevier). | |
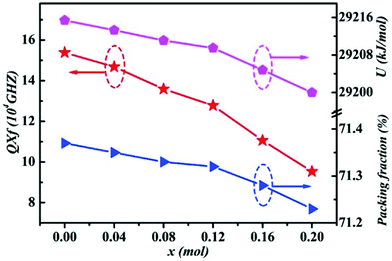 |
| | Fig. 11 The packing fraction, total lattice energy and Q × f of Li2Mg3−xCuxTiO6 (x = 0.00–0.20) ceramics obtained at optimal densification temperatures (reprinted with permission from ref. 130. Copyright 2019 Elsevier). | |
In an Li2(Mg1−xCox)3TiO6 (0 ≤ x ≤ 0.4) system doped with Co2+ cations, the chemical bond length increases from 2.091 to 2.095 Å, which leads to an increasing trend for all types of bond ionicity fi values.129 The εr value increases with x value. Here, an increase in bond ionicity indicates increased dielectric polarization, which can be confirmed by dielectric polarizability using the Clausius–Mossotti equation. Similarly, the introduction of Co2+ cations decreases the crystal structural stability; as a result, the intrinsic loss would be increased. The decline in PF value also serves as a verification of this conclusion. Furthermore, ZnO is usually used as a substitution source for Mg sites. Yang reported the Zn2+ ionic doping of an Li2(Mg1−xZnx)3TiO6 (x = 0–0.2) system. In the region of x = 0–0.15, a cubic solid solution is formed, the secondary Zn2TiO4 phase appears when the solid solution exceeds the limit of x = 0.15. Similarly, the crystal structural parameters increase for the larger ionic radius of the Zn2+ cation than Mg2+ (0.74 Å > 0.72 Å) cation.132 Based on P–V–L bond theory calculation, it is also found that ionicity for all types of bonds increases with x value, corresponding to an increase in dielectric polarization and εr value. The decline in lattice energy also shows a similar variation trend to PF and Q × f value. The Mg site was also reported with Ca2+ ionic replacement; however, due to the large discrepancy between ionic radii (39% > 15%), it is unlikely to form a solid solution even over a small concentration range (x = 0.03) in Li2Mg3−xCaxTiO6.133
From the three cases, one can find a common interesting phenomenon that the dielectric polarization increases, and the structural stability drops when the Mg site is replaced by a larger radius of cations. According to the definition of bond ionicity:
| |  | (47) |
The homopolar potential energy Eh can only be smaller as bond length increases, while heteropolar energy Eg decreases. Thus, the variations in fi value should depend on the changing ratio of homopolar energy to heteropolar energy. In a cubic structure, since cations randomly distribute at the same site, and one type of M–O1 bond exists in an [MO6] (M = Li/Mg/Ti) octahedron, decreasing ratios of Eh in all type of bonds are larger than the decreasing ratios of Eg. Thus, this phenomenon causes an increase in the bond ionicity fi value.
For substitution of Ti sites, single cations Zr4+, Sn4+, Ge4+ and complex cations (Mg1/3Sb2/3)4+, (Mg1/3Nb2/3)4+ and (Mg1/3Ta2/3)4+ were chosen as sources for substitution. When a Ti site was replaced by an Sn4+ cation in an Li2Mg3Sn1−xTixO6 system, a solid solution could be formed over the entire range of x = 0–1, as shown in Fig. 12.134 Due to the larger radius of the Sn4+ (0.69 Å) cation than Ti4+ (0.605 Å), the introduction of SnO2 leads to an increase in the crystal structural parameters a, b, c, and Vcell (from x = 1 to 0) and bond length. Based on reported bond features, it is found that the bond covalency fc value decreases with the increase in SnO2 content, which is in accordance with the variation in the εr value. This different result indicates that dielectric polarizability decreases as the content of SnO2 increases, which is confirmed by the drop in ionic polarizability. Such a situation exists in other systems as well, such as the Ca(Mg1−xMnx)Si2O6 system.102 Also, increasing content of SnO2 leads to a declining trend in structural stability and then the intrinsic loss would be increased, as shown in Fig. 13. To determine whether this phenomenon is an exception or exists in most Ti site doping cases for Li2Mg3TiO6 ceramics, ZrO2 was chosen in Li2Mg3Zr1−xTixO6 (0 ≤ x ≤ 1).135 Similarly, a solid solution was formed over the whole range of x = 0–1. An increase in Zr4+ cations (ionic radius: 0.72 Å) leads to an expansion of cell volume and an increase in bond length. The covalency fc value of all bonds decreases, accompanied by a decrease in εr value. Structural stability also shows a similar tendency to PF and Q × f values.
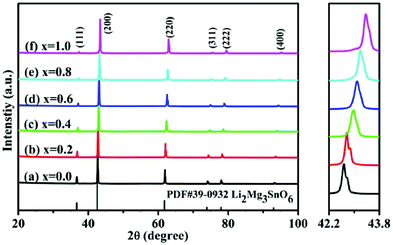 |
| | Fig. 12 The XRD patterns of Li2Mg3Sn1−xTixO6 (x = 0.0–1.0) ceramics obtained at optimal temperatures: (a) x = 0.0, 925 °C, (b) x = 0.2, 925 °C, (c) x = 0.4, 925 °C, (d) x = 0.6, 900 °C, (e) x = 0.8, 900 °C, (f) x = 1.0, 900 °C (reprinted with permission from ref. 134. Copyright 2020 Elsevier). | |
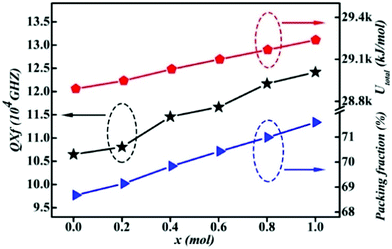 |
| | Fig. 13 The total lattice energy Utotal, packing fraction and Q × f of the Li2Mg3Sn1−xTixO6 (x = 0.0–1.0) samples obtained at optimal temperatures (reprinted with permission from ref. 134. Copyright 2020 Elsevier). | |
By substituting Ti sites with (Mg1/3Ta2/3)4+ complex cations (ionic radius: 0.72 Å) in Li2Mg3Ti1−x(Mg1/3Ta2/3)xO6 (0 ≤ x ≤ 0.2) system,136 the cell volume and bond length increase, and based on P–V–L bond theory, the decreasing trend in bond covalency fc value is also consistent with the εr value. From another point of view, Pan confirmed this decrease in εr value using far-infrared reflectivity. By transforming infrared spectra into a complex dielectric function with the Kramers–Kronig relationship and fitting it with a classical Lorentz three-parameter model, the real part and the imaginary part of the dielectric constant are shown in Fig. 14, and the intrinsic εr value is also confirmed as decreasing from 13.68 to 12.57 along with the increase in x value.
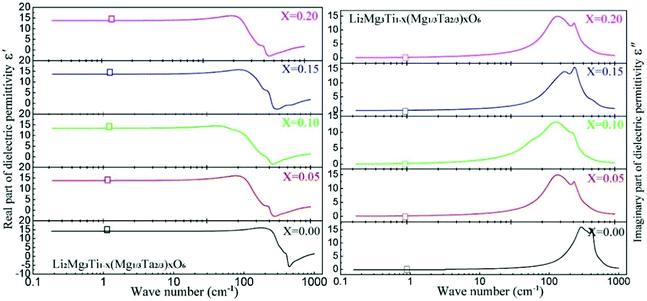 |
| | Fig. 14 Real and imaginary parts of complex permittivity for Li2Mg3Ti1−x(Mg1/3Ta2/3)xO6 (0 ≤ x ≤ 0.2) ceramics sintered at the optimum temperatures (reprinted with permission from ref. 136. Copyright 2018 Elsevier). | |
To make comparisons between the B site in cubic Li2Mg3BO6 (B = Ti, Sn, Zr) systems, the bond parameters are listed in Table 7. From Table 7,126,128,138 a similar conclusion could be jumped to that an increase in bond length from Ti to Zr leads to a similar decrease in the bond covalency fc value, which corresponds to a decline in the εr value. Also, the higher structural stability in the B = Ti system shows its smaller intrinsic loss, and the Q × f value presents the largest value among Li2Mg3BO6 (B = Ti, Sn, Zr) systems. Also, in (Mg1/3Sb2/3)4+ and (Mg1/3Nb2/3)4+ complex ionic substitution, the cell volume increases, and the εr value presents a decreasing trend. At this point, one may guess that it is more convenient to predict the variation in dielectric polarization through the addition rule of ionic polarizability (αtheo). However, this guess does not fit with the substitution in the Ti site with Zr4+, (Mg1/3Sb2/3)4+, (Mg1/3Nb2/3)4+ or (Mg1/3Ta2/3)4+ cations136–138 for their large αtheo values of about 3.25, 3.29, 3.09 and 3.59 compared with the 2.93 of the Ti cation. Here, we summarize modified Li2Mg3BO6 (B = Ti, Sn, Zr) ceramics with bond ionicities and bond covalency values and lattice energies in Table 8.
Table 7 Comparisons between bond ionicity, lattice energy and microwave dielectric properties of B site difference in cubic Li2Mg3BO6 (B = Ti, Sn, Zr) systems
| B |
Bond type |
Bond length |
f
i (%) |
U (kJ mol−1) |
ε
r
|
Q × f (GHz) |
| Ti |
Li–O |
2.0900 |
69.54 |
2102 |
14.8 |
175![[thin space (1/6-em)]](https://www.rsc.org/images/entities/char_2009.gif) 000 000 |
| Mg–O |
2.0900 |
84.15 |
11711 |
|
|
| Ti–O |
2.0900 |
92.03 |
15402 |
|
|
|
Af
i = 81.91%, Utotal = 29215 kJ mol−1 |
|
|
| Sn |
Li–O |
2.1216 |
69.78 |
2078 |
12.4 |
168![[thin space (1/6-em)]](https://www.rsc.org/images/entities/char_2009.gif) 330 330 |
| Mg–O |
2.1216 |
84.25 |
11510 |
|
|
| Sn–O |
2.1216 |
92.06 |
15231 |
|
|
|
Af
i = 82.03%, Utotal = 28819 kJ mol−1 |
|
|
| Zr |
Li–O |
2.1365 |
69.89 |
2066 |
12.2 |
113![[thin space (1/6-em)]](https://www.rsc.org/images/entities/char_2009.gif) 000 000 |
| Mg–O |
2.1365 |
84.29 |
11519 |
|
|
| Zr–O |
2.1365 |
92.07 |
15150 |
|
|
|
Af
i = 82.08%, Utotal = 28735 kJ mol−1 |
|
|
Table 8 Modified Li2Mg3BO6 (B = Ti, Sn, Zr) ceramics with bond ionicity, bond covalency value, lattice energy and microwave dielectric properties
| System |
V
cell
|
f
i/fc |
ε
r
|
U
|
Q × f |
| Li2Mg3−xCuxTiO6 |
↗ |
f
i ↗ |
↗ |
↘ |
↘ |
| Li2(Mg1−xCox)3TiO6 |
↗ |
f
i ↗ |
↗ |
↘ |
↘ |
| Li2(Mg1−xZnx)3TiO6 |
↗ |
f
i ↗ |
↗ |
↘ |
↘ |
| Li2Mg3Sn1−xTixO6 |
↘ |
f
c ↗ |
↗ |
↗ |
↗ |
| Li2Mg3Zr1−xTixO6 |
↘ |
f
c ↗ |
↗ |
↗ |
↗ |
| Li2Mg3Ti1−x(Mg1/3Ta2/3)xO6 |
↗ |
f
c ↘ |
↘ |
↘ |
↘ |
Therefore, we may find that the expansion or shrinkage in cell volume relies on the radius of the donor ion, while Mg site substitution with a large size of ion leads to an increase in bond ionicity fi value and εr value. While in B site substitution, the variation in εr value is proportional to the bond covalency fc value. Based on the bond features and microwave dielectric properties, we may put forward a conjecture that one could improve the Q × f value with a smaller size ionic substitution. Xiang reported Ti sites partially replaced with smaller sized Ge4+ cations (0.535 Å), and the result also showed an improvement from 1.1 × 10⁵ at x = 0.04 to 1.35 × 10⁵ at x = 0.1.139 However, whether this conjecture is ubiquitous in cubic Li2Mg3BO6 systems still requires considerable future experiments.
4.3.3 Bond features in orthorhombic Li3Mg2NbO6 systems.
Li3Mg2NbO6 is another typical rock salt structure studied worldwide because of its excellent microwave dielectric properties: εr = 14.9, Q × f = 100![[thin space (1/6-em)]](https://www.rsc.org/images/entities/char_2009.gif) 965 GHz, τf = 21.96 ppm per °C when sintered at 1225 °C for 4 h.140 It is crystallized as an orthorhombic structure with an Fddd space group. The XRD patterns of Li3Mg2NbO6 ceramics sintered at 1175–1300 °C are shown in Fig. 15.140 A diagrammatic sketch of a crystal structure is presented in Fig. 16, where in its structure, three types of Li and Mg atoms and two types of O atoms are shown, where Li1Mg1 and Li2Mg2 atoms occupy the 16 g Wyckoff position, while Li3Mg3 atoms are in the 8b site and Nb is in the 8a site. 16f and 32 h sites are distributed with O(1) and O(2) atoms. All the cations are six-fold coordinated, forming an oxygen octahedron. Detailed structural parameters can be traced in ref. 140. Recently, the relationships between bond characteristics and microwave dielectric properties were studied by several researchers based on the actual crystal structure, coordinate environments, and ionic occupancy. First and foremost, the binary bonding formula expression was considered by Wu:140
965 GHz, τf = 21.96 ppm per °C when sintered at 1225 °C for 4 h.140 It is crystallized as an orthorhombic structure with an Fddd space group. The XRD patterns of Li3Mg2NbO6 ceramics sintered at 1175–1300 °C are shown in Fig. 15.140 A diagrammatic sketch of a crystal structure is presented in Fig. 16, where in its structure, three types of Li and Mg atoms and two types of O atoms are shown, where Li1Mg1 and Li2Mg2 atoms occupy the 16 g Wyckoff position, while Li3Mg3 atoms are in the 8b site and Nb is in the 8a site. 16f and 32 h sites are distributed with O(1) and O(2) atoms. All the cations are six-fold coordinated, forming an oxygen octahedron. Detailed structural parameters can be traced in ref. 140. Recently, the relationships between bond characteristics and microwave dielectric properties were studied by several researchers based on the actual crystal structure, coordinate environments, and ionic occupancy. First and foremost, the binary bonding formula expression was considered by Wu:140
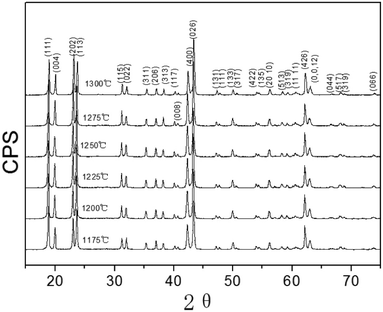 |
| | Fig. 15 X-ray diffraction patterns of Li3Mg2NbO6 ceramics sintered at different sintering temperature from 1175 °C to 1300 °C for 4 h (reprinted with permission from ref. 140. Copyright 2016 Elsevier). | |
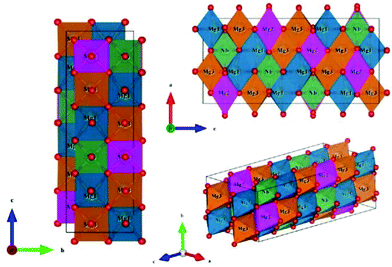 |
| | Fig. 16 Diagrammatic sketch of Li3Mg2NbO6 structure. | |
According to P–V–L bond theory calculation, it is found that Nb–O bonds have the largest average ionicity fi value of about 98.72%, followed by that of Li–O bonds (95.72%) and Mg–O bonds (93.62%). As the following relationship indicates,141 the εμ of a μ bond is proportional to the fi value; it is then supposed that Nb–O bonds make the predominant contribution to dielectric polarization. Meanwhile, due to the larger total lattice energy of Nb–O bonds (25382 kJ mol−1) than Mg–O (9378 kJ mol−1) or Li–O (5308 kJ mol−1) bonds, the importance of Nb–O bonds on structural stability is noneligible, affecting the dielectric loss:
| |  | (48) |
where
n is the refractive index. Up to now, several attempts have been made to improve the microwave dielectric properties of Li
3Mg
2NbO
6 ceramics at Li, Mg and Nb sites. For instance, Li
+/Ti
4+ ions were chosen as a substitution source in an Li
3+xMg
2Nb
1−xTi
xO
6 (
x = 0.02–0.08) system, where the cell volume drops along with the
x value.
142 In the region of
x = 0.02–0.06, the
εr value and
Q ×
f value show an increasing tendency. The Mg site can usually be replaced with Mn
2+, Ca
2+, Zn
2+, Ni
2+, and Co
2+ ions.
143–147 Tetravalent Ti
4+ and pentavalent V
5+, Sb
5+, Ta
5+, and hexavalent W
6+ ions are reported to substitute for Nb sites.
148–154 For instance, a Ta
5+ ion replaces an Nb site in Li
3Mg
2Nb
1−xTa
xO
6 (
x = 0–0.04) system leading to a decrease in cell volume, and the
εr value increases along with the
x value owing to the enhancement in dielectric polarizability. The
Q ×
f value consistent with PF and relative density show an increasing trend with the
x value. The Nb site also can be replaced with an Ti
4+ ion because of the smaller discrepancy in ionic radius, resulting in the formation of a solid solution. Similarly, the
εr value and
Q ×
f value both increase from
x = 0 to 0.04, improving the
Q ×
f value from 1 × 10
5 to 1.31 × 10
5 GHz. An Sb
5+ cation was used to substitute for the Nb site in an Li
3Mg
2(Nb
1−xSb
x)O
6 system (
x = 0.02–0.08). An orthorhombic solid solution was formed and the cell volume declined as
x increased. It is also found that Sb
2O
5 leads to an increase in total bond ionicity
fi value, corresponding to an increase in
εr value. By controlling the extrinsic loss, such as densified temperature, the extrinsic contribution to dielectric properties is minimized. The total lattice energy in accordance with the variation in
Q ×
f value increases in the range
x = 0.02–0.06, illustrating that the dielectric loss is highly correlated with structural stability in an Li
3Mg
2NbO
6 system. Furthermore, for reported Li bond parameters in an Zn
2+ doped Li
3Mg
2SbO
6 system, a proportional relationship between bond ionicity
fi value and
εr value can still be found, whereas the gradually decreasing total lattice energy reflects the decline in
Q ×
f values.
155
Just as section 4.1 shows, however, even Ca–O bonds obtain a larger bond ionicity (86.267%) value than Si–O bonds (67.983%) in a CaMgSi2O6 system, and the results show that the majority contribution to dielectric polarization originates from Si–O bonds because of their largest proportion of bond susceptibility value. Besides, it is also shown from the lattice dynamic calculation that the largest oscillator strength Δε (1.497) in the IR spectra of Ca2ZnSi2O7 shows that Si–O bonds are important for the intrinsic dielectric properties. A possible reason is that the refractive index differs with an AmBn crystal; therefore, it would be more convincing to compare bond susceptibility in an Li3Mg2NbO6 system to predict the variation in dielectric polarization.
4.4 Tetragonal scheelite CaWO4 structure
As a tetragonal scheelite structure, alcium tungstate (CaWO4) is broadly applied in laser, phosphor, and scintillation counters due to the merits of outstanding luminescence characters. The microwave dielectric properties of scheelite-type A2+B6+O4 (A2+: Ca, Pb, Ba; B6+: Mo, W) ceramics were first reported, where CaWO4 ceramics sintered at 1100 °C show excellent dielectric properties: εr = 10.4, Q × f = 76![[thin space (1/6-em)]](https://www.rsc.org/images/entities/char_2009.gif) 550 GHz, τf = −24.4 ppm per °C.131
550 GHz, τf = −24.4 ppm per °C.131
Based on the structural detail reported by Rodríguez–Hernández (COD #1546034),156 lattice parameters of a = b = 5.205 Å, c = 11.275 Å, and Vcell = 305.46 Å3 with a space group of I41/a are shown. In its crystal structure (Z = 4), as shown in Fig. 17, the W5+ cation is four-fold coordinated, while the Ca2+ cation is surrounded by eight oxygen anions. The O2− anion, however, is nearly close to two Ca2+ ions and one W5+ ion, showing that its coordination number CN = 3. Thus, according to the actual structural configuration, its binary bonding formula is expressed as:
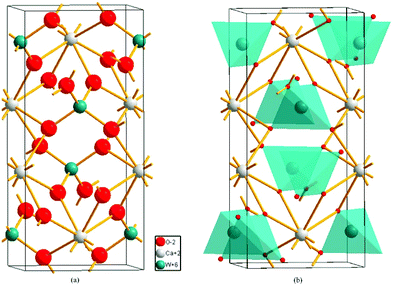 |
| | Fig. 17 Crystal structure of CaWO4: (a) the coordination number of ions in CaWO4, (b) the unit cell of CaWO4 (reprinted with permission from ref. 159. Copyright 2018 Elsevier). | |
The effective valence electronic numbers of O2− anions in a Ca–O bond and a W–O bond are 2.25 and 13.5, respectively. The ionicity fi value for Ca–O(2) bond is largest (75.87%), followed by that for the Ca–O(1) bond of about 75.80%, and the smallest fi value is observed in the W–O bond (68.86%).
Shao investigated the electronic structure of the CaWO4 crystal by choosing the molecular-cluster model with the framework of the fully relativistic self-consistent Dirac–Slater theory equipped with the DV-Xα method, and reported the total/partial densities of states of a perfect CaWO4 crystal in Fig. 18.157 It is proved that O 2p and W 5d states both provide contributions to the top of the valence bands and the bottom of the conduction bands, which illustrates that the W–O bond has a much stronger covalent property than other bonds in the CaWO4 crystal. This finding provides evidence for P–V–L bond theory calculation. Moreover, the lattice energy UW–O (29564 kJ mol−1) is about ten times larger than that in Ca–O(1) (2722 kJ mol−1) or Ca–O(2) (2720 kJ mol−1) bonds, emphasizing the significance of W–O bonds in structural stability and intrinsic loss. It is widely acknowledged that the Raman peak with the highest intensity dominates the Raman-active vibrations, and most researchers found that the half width (FWHM) value of the most intense Raman peak is closely related with dielectric loss because the half width of the Raman scattering peak is related to the damping coefficient of structural vibration. The larger the damping coefficient of Raman scattering, the wider the half width of the peak. The damping coefficient of structure vibration is a parameter directly related to the intrinsic loss of microwave dielectric ceramics. The larger the damping coefficient of structural vibration is, the larger the intrinsic loss of microwave dielectric ceramic material would be; as a result, a lower Q × f value is presented. Gracia reported the Raman spectrum of the CaWO4 crystal, as shown in Fig. 19.158 It is shown that the most intense peak around 912 cm−1 is attributed to the Ag mode of the stretching vibrational behaviour of the WO4 unit. This conclusion also supports that W–O bonds provide the major contributions to the intrinsic loss. Moreover, due to the close ionic radius between Ca2+ (IR = 1.12 Å at CN = 8) and Sr2+ (IR = 1.26 Å at CN = 8) ions, Xiao prepared a series of tetragonal Ca1−xSrxWO4 (x = 0–0.1) solid solutions, where the total bond covalency fc shows a decreasing trend, corresponding to a decline in dielectric polarization, while the introduction of an Sr2+ cation is beneficial for improving the structural stability, which demonstrates an improvement in Q × f value.159
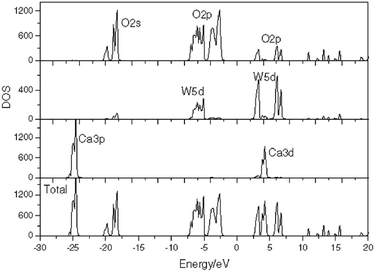 |
| | Fig. 18 Total densities of states and partial densities of states for a perfect CaWO4 crystal (reprinted with permission from ref. 157. Copyright 2007 John Wiley and Sons). | |
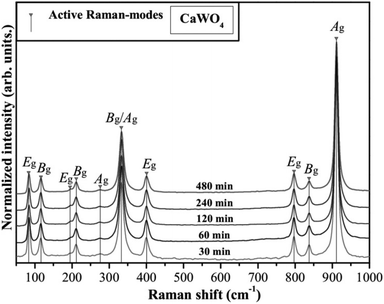 |
| | Fig. 19 FT-Raman spectra in the range from 50 to 1000 cm−1 of CaWO4 crystals processed at 140 °C for different times in the MH system (reprinted with permission from ref. 158. Copyright 2011 AIP Publishing). | |
4.5 Glass-free systems for LTCC application
As a key technology of RF passive integration, several merits of low temperature cofired ceramic (LTCC) have attracted a lot of public attention: e.g. adjustability of dielectric properties of LTCC material based on different ingredients, allowing circuit design flexibility; adaptability to the requirements of high current and high temperature resistance, high reliability for application to harsh environments; circuit boards with multiple layers and passive components can be integrated, avoiding the costs of packaging, realizing the integration of passive and active components, and improving the assembly density of circuits; and excellent compatibility with other multi-layer cabling technologies.160
However, the excellent microwave dielectric properties of material candidates sintered at a temperature lower than 950 °C and chemical compatibility with Ag and Cu electrodes are required. Until now, two mainstream methods to prepare LTCC materials have been broadly acknowledged, where one type is to add low melting point glass frits into a ceramic matrix. The sample can be well-sintered at low temperatures with the help of a liquid phase formed by glass, such as Li2O–B2O3–SiO2, BaO–ZnO–B2O3, ZnO–B2O3–SiO2, and CuO–B2O3.161–163 However, dielectric performances have deteriorated due to the large dielectric loss of glass. Another type of ceramic has the feature of being “glass-free”, where the ceramic contains low-melting oxides on their own: for instance, BiVO4, Bi2O3–MoO3, Li2MoO4, NaAgMoO4 and (Ca,Bi)(Mo,V)O4.164–168 They can be sintered at low temperature without additives.
4.5.1 Orthorhombic olivine structure.
LiMPO4 (M = Mg, Mn, Co, Ni, Zn) compounds make themselves promising in LTCC because of the existence of low melting phosphates. Not only the magnetoelectric and electrochemical aspects, but the dielectric properties in the microwave region were explored: e.g. a low εr value of 6.6, a Q × f of about 79![[thin space (1/6-em)]](https://www.rsc.org/images/entities/char_2009.gif) 100 GHz, and τf of ca. −55 ppm per °C for M = Mg when sintered at 950 °C.169 For M = Ni sintered at 825 °C: εr = 7.18, Q × f = 27
100 GHz, and τf of ca. −55 ppm per °C for M = Mg when sintered at 950 °C.169 For M = Ni sintered at 825 °C: εr = 7.18, Q × f = 27![[thin space (1/6-em)]](https://www.rsc.org/images/entities/char_2009.gif) 754 GHz, τf = −67.7 ppm per °C.170 The chemical compatibility of LiMnPO4 with Ag presents excellent properties: εr = 8.1, Q × f = 44
754 GHz, τf = −67.7 ppm per °C.170 The chemical compatibility of LiMnPO4 with Ag presents excellent properties: εr = 8.1, Q × f = 44![[thin space (1/6-em)]](https://www.rsc.org/images/entities/char_2009.gif) 224 GHz, τf = −90 ppm per °C.171 Due to the excellent microwave properties of LiMPO4 ceramics at low temperatures, several efforts have been made to analyse the structure–property relationship.
224 GHz, τf = −90 ppm per °C.171 Due to the excellent microwave properties of LiMPO4 ceramics at low temperatures, several efforts have been made to analyse the structure–property relationship.
Based on the crystal structure reported by Abrahams (COD #2001689), as presented in Fig. 20,172 LiMPO4 crystallizes as an orthorhombic structure with Pnma space group, where the lattice parameters are: a = 10.0317 Å, b = 5.8539 Å, c = 4.6748 Å, and Vcell = 274.643 Å3. In this structure, the Li atom is in a 4a Wyckoff position, while Ni and P are in 4c sites. Besides, three types of O atoms are shown where O(1) and O(2) are in 4c sites, and O(3) is in a 8d site. Li+ and Ni2+ cations are surrounded by six O2− anions, forming [LiO6] and [NiO6] octahedra, while the P5+ cation is four-fold coordinated and presents a [PO4] tetrahedron. The [LiO6] octahedron interconnects with itself along the b-axis direction through sharing an edge (O(1)–O(2)). The [PO4] tetrahedron links with the [LiO6] octahedron by sharing a corner (O(1)) and an edge (O(3)–O(3)). The Li+ cation appears in the top corner, face center of the ac plane and body center, thus, multi-layer [LiO6] units appear, where [NiO6] octahedra interpenetrate between layers and connect with the [LiO6] octahedron by sharing edge (O(1)–O(3)) and corner (O(3)). By decomposing LiMPO4 into binary compounds, the binary bonding formula is obtained as:170
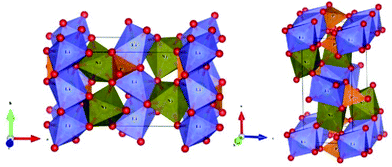 |
| | Fig. 20 Crystal structure of the orthorhombic LiNiPO4 system. | |
The coordination environment and charge distribution can be briefly explained in Fig. 21.170 Citing O(3) as an instance, it connects with Li+, Ni2+ and P5+ ions, where the effective valence electron numbers (Z) for the cations are 1, 2 and 5, respectively. Combined with the coordination number, an electron number of 1/6 from the Li+ cation is given to the Li–O(3) bond. The Z values for O in Li–O, Ni–O and P–O bonds are 2, 4 and 15, respectively. Based on these considerations, the bond parameters can be calculated via P–V–L bond theory.
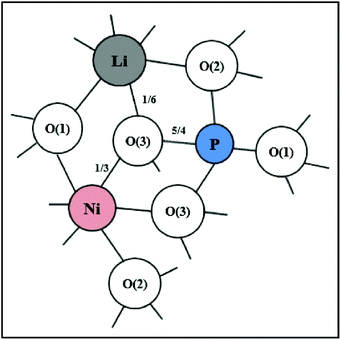 |
| | Fig. 21 The coordination number and charge distribution of ions in LiNiPO4 ceramics (reprinted with permission from ref. 170. Copyright 2018 Elsevier). | |
The average ionicity Afi values are sequenced as: Afi(Ni–O) = 76.4% > Afi(P–O) = 74.2% > Afi(Li–O) = 57.1%, emphasizing the indispensable role of Ni–O and P–O bonds in the εr value. While the lattice energy of P–O bonds provides about an 86.5% contribution (28055 kJ mol−1), followed by that of Ni–O (3379 kJ mol−1) and Li–O (986 kJ mol−1) bonds, suggesting that P–O bonds are also important in determining the structural stability. Furthermore, as just mentioned, it would be more convincing to compare contributions to bond susceptibility to predict the εr value since the refractive index in eqn (48) varies with the type of binary crystal. By applying the reported bond parameters, bond susceptibility values are listed in Table 9.
Table 9 Susceptibility of chemical bonds in an LiNiPO4 system
| Bond type |
N
e
μ
(Å−3) |
E
g (eV) |
χ
μ
|
F
μ
|
χ
|
χ/∑χ (%) |
| Li–O(1) |
0.123 |
9.162 |
1.549 |
0.125 |
0.194 |
8.16 |
| Li–O(2) |
0.144 |
10.317 |
1.430 |
0.125 |
0.179 |
7.54 |
| Li–O(3) |
0.134 |
9.788 |
1.482 |
0.125 |
0.185 |
7.81 |
| Ni–O(1) |
0.265 |
13.074 |
1.900 |
0.063 |
0.119 |
5.01 |
| Ni–O(2) |
0.277 |
13.486 |
1.861 |
0.063 |
0.116 |
4.90 |
| Ni–O(3)1 |
0.285 |
13.765 |
1.836 |
0.125 |
0.229 |
9.67 |
| Ni–O(3)2 |
0.236 |
11.975 |
2.017 |
0.125 |
0.252 |
10.63 |
| P–O(1) |
2.746 |
28.722 |
4.148 |
0.063 |
0.259 |
10.93 |
| P–O(2) |
2.256 |
24.722 |
4.610 |
0.063 |
0.288 |
12.15 |
| P–O(3) |
2.454 |
26.365 |
4.405 |
0.125 |
0.551 |
23.21 |
As Table 9 shows, the contributions of P–O bonds reach about 46.3%, while the secondary contribution comes from Ni–O bonds (30.2%), and after that Li–O bonds account for 23.5%. These results suggest that P–O bonds may possibly be the dominant factor for dielectric polarization. Xiao reported the vibrational spectra of LiMPO4 ceramics to study the Raman and IR active vibrations. Specifically, the Raman scatting spectra are shown in Fig. 22.173 The Raman-active vibrational behaviours are divided into three regions, where in the frequency of 50–400 cm−1, Raman peaks are related to lattice vibration. Internal modes associated with P–O–P bending vibrational modes are detected in 400–700 cm−1, while Raman peaks in 930–1100 cm−1 are stretching vibrations of the [PO4] tetrahedral unit. As can clearly be seen, the most intense peaks located at 940 cm−1 and 1010 cm−1 are assigned to the [PO4] tetrahedron, suggesting its dominant role in Raman-active vibration. It is also found the peak position of the mode at 940 cm−1 is contrary to the change in εr value. This phenomenon is explained by the fact that when the Raman peak blue-shifts, the Vcell and electron mobility space are increased, causing the crystal to be polarized and improving the εr value. That is to say, the [PO4] tetrahedron is significant for dielectric polarization. If we look further, the damping value (FWHM) of both this mode (940 cm−1, the symmetric stretching of the [PO4] tetrahedron) is in inverse proportion to the Q × f value, suggesting the relationship between damping coefficient of structure vibration and dielectric loss. Again, the importance of P–O bonds is emphasized.
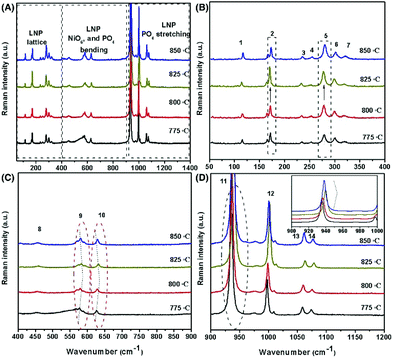 |
| | Fig. 22 (A) The Raman spectra of LNP ceramics; (B) the modes in 50–400 cm−1 representing the lattice modes; (C) the modes in 400–900 cm−1 representing mainly symmetric and antisymmetric bending modes of O–P–O and Ni–O; (D) the modes in 900–1200 cm−1 representing the symmetric and asymmetric stretching mode vibrations of the [PO4]3− anion (reprinted with permission from ref. 173. Copyright 2019 John Wiley and Sons). | |
Furthermore, far-infrared reflectivity spectra of LiNiPO4 were also recorded in Fig. 23173 and analysed using a four-parameter semi-quantum (FPSQ) model to obtain intrinsic dielectric properties, as shown in Fig. 24.173 Based on the fitted phonon parameters, it is suggested that [LiO6] and [NiO6] octahedra account for 50.86% of the εr value. This finding is close to P–V–L bond theory calculation, where 53.71% contributions to bond susceptibility are indicated for [LiO6] and [NiO6] octahedra. However, infrared spectra analysis shows the majority contribution to dielectric loss (85.79%) originates from [LiO6] and [NiO6] octahedra, while bond theory shows 86.54% contributions come from P–O bonds. One possible reason for this discrepancy is that there is no specific assignment of infrared modes via first principle calculations, and only general vibrations of polyhedra are classified. Thus, it is reasonable to use first-principles calculation to find out the reason for this difference.
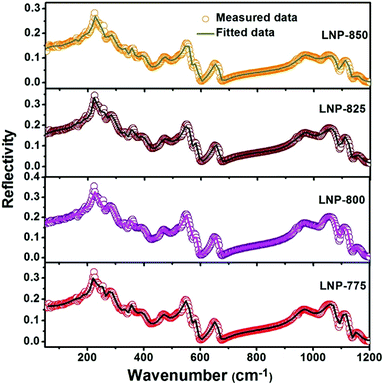 |
| | Fig. 23 Measured and fitted infrared reflectivity spectrum of LNP ceramics, together with the real parts (Re(ε)) and the imaginary parts (Im(ε)) of the complex dielectric function, as well as the reciprocal (Im(ε−1)), obtained from K–K analysis and the 4-P model as indicated (reprinted with permission from ref. 173. Copyright 2019 John Wiley and Sons). | |
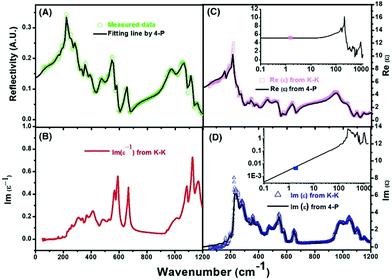 |
| | Fig. 24 (A) Fitted and measured infrared reflectivity spectra of an LNP ceramic; (B) the reciprocal of the imaginary part of permittivity obtained from K–K; (C) the real part of permittivity obtained from K–K and 4-P; and (D) the imaginary part of permittivity obtained from K–K and 4-P (reprinted with permission from ref. 173. Copyright 2019 John Wiley and Sons). | |
4.5.2 Double trigonal molybdate structure.
Mo-rich compounds, such as (Na0.5Bi0.5)MoO4, Bi2Mo2O9, Li2MoO4, (NaxAg2−x)MoO4, and Bi(Sc1/3Mo2/3)O4 ceramic systems,164,174–177 have the feature of low-temperature sintering because of the low melting point of MoO3 of about 795 °C without using additives. Thus, the preparation technology and microwave dielectric properties are much easier to control since there is no concern about the effects of additives on phase formation, microstructure or crystal structure. Their excellent microwave dielectric performances, for instance: (Na1.2Ag0.8)MoO4: εr = 8.1, Q × f = 44![[thin space (1/6-em)]](https://www.rsc.org/images/entities/char_2009.gif) 800 GHz, τf = −82 ppm per °C when sintered at 410 °C, Li2MoO4: εr = 5.5, Q × f = 46
800 GHz, τf = −82 ppm per °C when sintered at 410 °C, Li2MoO4: εr = 5.5, Q × f = 46![[thin space (1/6-em)]](https://www.rsc.org/images/entities/char_2009.gif) 000 GHz, τf = −160 ppm per °C when sintered at 540 °C, show prospects in LTCC usage. Recently, a series of molybdate-based trigonal structures with the chemical formulas of Ln2Zr3(MoO4)9 (Ln = La, Ce, Eu, Gd) have been reported with excellent properties when sintered at a low temperature (Ln = Gd: ST = 725 °C, εr = 11.2, Q × f = 57
000 GHz, τf = −160 ppm per °C when sintered at 540 °C, show prospects in LTCC usage. Recently, a series of molybdate-based trigonal structures with the chemical formulas of Ln2Zr3(MoO4)9 (Ln = La, Ce, Eu, Gd) have been reported with excellent properties when sintered at a low temperature (Ln = Gd: ST = 725 °C, εr = 11.2, Q × f = 57![[thin space (1/6-em)]](https://www.rsc.org/images/entities/char_2009.gif) 460 GHz, τf = −31.9 ppm per °C).178 By applying P–V–L bond theory, it is easier to understand the structure–property relationship.
460 GHz, τf = −31.9 ppm per °C).178 By applying P–V–L bond theory, it is easier to understand the structure–property relationship.
Ln2Zr3(MoO4)9 shows a trigonal structure with a space group of R![[3 with combining macron]](https://www.rsc.org/images/entities/char_0033_0304.gif) c(167). Its crystal structure is sketched in Fig. 25 (Ln = Ce is a case in point),179 where two types of Zr (Zr(1) and Zr(2)) and Mo (Mo(1) and Mo(2)) atoms are presented, and six different O atoms exist. Ce and Zr2 atoms occupy 12c Wyckoff sites, and Zr1 is in a 6b site, while Mo1 and Mo2 atoms distribute in 36f and 18e sites, respectively. For O atoms, they all occupy 36f sites. The structure consists of five types of polyhedra because of different coordination environments of cations. For instance, the Ce3+ ion is surrounded by nine O2+ anion, where the bond types are classified as Ce–O1 × 3, Ce–O2 × 3 and Ce–O6 × 3. Both Zr(1)4+ and Zr(2)4+ ions are six-fold coordinated, while the Zr(1)4+ ion is only in the center of an O42+ anion, forming a [Zr(1)O6] octahedron, and O32− and O52− anions are around the Zr(2)4+ ion: Zr(2)–O3 × 3 and Zr(2)–O5 × 3. For the [MoO4] tetrahedron, Mo(1)–O1 × 1, Mo(1)–O2 × 1, Mo(1)–O3 × 1 and Mo(1)–O4 × 1 bonds are shown in [Mo(1)O4], while Mo(2)–O5 × 2 and Mo(2)–O5 × 2 bonds are presented in [Mo(2)O4].
c(167). Its crystal structure is sketched in Fig. 25 (Ln = Ce is a case in point),179 where two types of Zr (Zr(1) and Zr(2)) and Mo (Mo(1) and Mo(2)) atoms are presented, and six different O atoms exist. Ce and Zr2 atoms occupy 12c Wyckoff sites, and Zr1 is in a 6b site, while Mo1 and Mo2 atoms distribute in 36f and 18e sites, respectively. For O atoms, they all occupy 36f sites. The structure consists of five types of polyhedra because of different coordination environments of cations. For instance, the Ce3+ ion is surrounded by nine O2+ anion, where the bond types are classified as Ce–O1 × 3, Ce–O2 × 3 and Ce–O6 × 3. Both Zr(1)4+ and Zr(2)4+ ions are six-fold coordinated, while the Zr(1)4+ ion is only in the center of an O42+ anion, forming a [Zr(1)O6] octahedron, and O32− and O52− anions are around the Zr(2)4+ ion: Zr(2)–O3 × 3 and Zr(2)–O5 × 3. For the [MoO4] tetrahedron, Mo(1)–O1 × 1, Mo(1)–O2 × 1, Mo(1)–O3 × 1 and Mo(1)–O4 × 1 bonds are shown in [Mo(1)O4], while Mo(2)–O5 × 2 and Mo(2)–O5 × 2 bonds are presented in [Mo(2)O4].
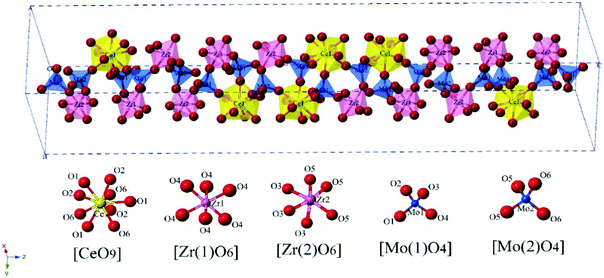 |
| | Fig. 25 Schematic diagram of the crystal structure for Ce2Zr3(MoO4)9 ceramics (reprinted with permission from ref. 179. Copyright 2019 Elsevier). | |
Firstly, the binary bonding formula is decomposed into:
The effective valence electron numbers of O anions in Ce–O, Zr–O and Mo–O bonds are Zo = 2, 4 and 9, respectively. The coordination environment and charge distribution of the Ln = Zr system are sketched in Fig. 26.180 Just as shown in section 4.3.2, discrepancies in Mg sites and Ti sites lead to different variations between ionicity and εr values in the Li2Mg3TiO6 system. To figure out whether this situation occurs in trigonal Ln2Zr3(MoO4)9 structures, comparisons of bond ionicity, lattice energy and microwave dielectric properties among Ln2Zr3(MoO4)9 (Ln = La, Ce, Eu, Gd) systems are first listed in Table 10.179–183
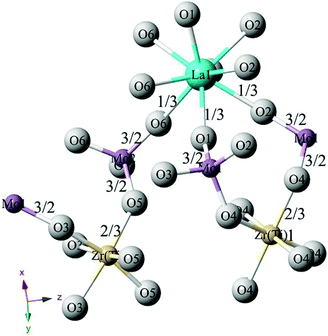 |
| | Fig. 26 The coordination number and charge distribution of ions in La2(Zr1−xTix)3(MoO4)9 ceramics (reprinted with permission from ref. 180. Copyright 2019 John Wiley and Sons). | |
Table 10 Comparisons between average bond ionicity, lattice energy and microwave dielectric properties of the Ln2Zr3(MoO4)9 (Ln = La, Ce, Eu, Gd) system
| Average bond ionicity Afi value (%) |
| Ln site |
Ln–O |
Zr–O |
Mo–O |
Af
itotal
|
ε
r
|
| La |
85.146 |
79.306 |
72.801 |
79.324 |
10.17 |
| Ce |
85.178 |
78.975 |
73.250 |
79.321 |
10.69 |
| Eu |
84.967 |
79.100 |
72.575 |
79.121 |
10.75 |
| Gd |
85.000 |
78.825 |
72.863 |
79.097 |
11.17 |
| Total lattice energy Utotal (kJ mol−1) |
| Ln site |
Ln–O |
Zr–O |
Mo–O |
U
total
|
Q × f |
| La |
3302 |
10![[thin space (1/6-em)]](https://www.rsc.org/images/entities/char_2009.gif) 752 752 |
43![[thin space (1/6-em)]](https://www.rsc.org/images/entities/char_2009.gif) 253 253 |
364![[thin space (1/6-em)]](https://www.rsc.org/images/entities/char_2009.gif) 555 555 |
51![[thin space (1/6-em)]](https://www.rsc.org/images/entities/char_2009.gif) 578 578 |
| Ce |
3317 |
10![[thin space (1/6-em)]](https://www.rsc.org/images/entities/char_2009.gif) 933 933 |
42![[thin space (1/6-em)]](https://www.rsc.org/images/entities/char_2009.gif) 856 856 |
363![[thin space (1/6-em)]](https://www.rsc.org/images/entities/char_2009.gif) 358 358 |
24![[thin space (1/6-em)]](https://www.rsc.org/images/entities/char_2009.gif) 720 720 |
| Eu |
3331 |
10![[thin space (1/6-em)]](https://www.rsc.org/images/entities/char_2009.gif) 835 835 |
43![[thin space (1/6-em)]](https://www.rsc.org/images/entities/char_2009.gif) 559 559 |
367![[thin space (1/6-em)]](https://www.rsc.org/images/entities/char_2009.gif) 241 241 |
74![[thin space (1/6-em)]](https://www.rsc.org/images/entities/char_2009.gif) 900 900 |
| Gd |
3336 |
10![[thin space (1/6-em)]](https://www.rsc.org/images/entities/char_2009.gif) 988 988 |
43![[thin space (1/6-em)]](https://www.rsc.org/images/entities/char_2009.gif) 180 180 |
366![[thin space (1/6-em)]](https://www.rsc.org/images/entities/char_2009.gif) 144 144 |
57![[thin space (1/6-em)]](https://www.rsc.org/images/entities/char_2009.gif) 460 460 |
In Table 10, it is shown that Ln–O bonds present the largest bond ionicity value, and the Afitotal values show a decreasing trend as the Ln site ionic radius declines (IR values for La, Ce, Eu, Gd at CN = 9 are 1.216 Å, 1.196 Å, 1.120 Å, and 1.107 Å, respectively), while the increase in εr value indicates an enhancement in dielectric polarization. Considering that the densified temperatures are different, the εrc value after porosity is corrected also increases from 11.31 to 12.01. This phenomenon is similar to the ionic modification of the Ti site in Li2Mg3TiO6 ceramics, suggesting that the bond covalency value of the Ln-site in Ln2Zr3(MoO4)9 (Ln = La, Ce, Eu, Gd) systems may possibly be closely related to the dielectric polarization. For lattice energy, one can still find that the largest intrinsic structural stability exists in Ln = Eu, followed by that in Gd, La, and Ce systems, which corresponds to the variations in Q × f values, where the Ln = Eu system obtains the largest value of about 74![[thin space (1/6-em)]](https://www.rsc.org/images/entities/char_2009.gif) 900 GHz. This conclusion emphasizes the proportional relationship between structural stability and intrinsic dielectric loss in Ln2Zr3(MoO4)9 (Ln = La, Ce, Eu, Gd) systems. More importantly, by applying far-infrared reflectivity spectra, taking Ln = La as an example, as can be seen in Fig. 27,184 the intrinsic dielectric loss is fitted and sequenced as: Eu (1.3 × 10⁻⁴) < Gd (2.4 × 10⁻⁴) < La (2.9 × 10⁻⁴) < Ce (2.3 × 10⁻³). This finding is also solid evidence to support the relationship between structural stability and dielectric loss. However, due to different sinterabilities, for instance, the densified temperatures of Ln = La, Ce, Eu, Gd are 650 °C, 575 °C, 600 °C, and 725 °C, the actual growth of grains and amounts of grain boundaries are different, which also negatively affects the dielectric loss.
900 GHz. This conclusion emphasizes the proportional relationship between structural stability and intrinsic dielectric loss in Ln2Zr3(MoO4)9 (Ln = La, Ce, Eu, Gd) systems. More importantly, by applying far-infrared reflectivity spectra, taking Ln = La as an example, as can be seen in Fig. 27,184 the intrinsic dielectric loss is fitted and sequenced as: Eu (1.3 × 10⁻⁴) < Gd (2.4 × 10⁻⁴) < La (2.9 × 10⁻⁴) < Ce (2.3 × 10⁻³). This finding is also solid evidence to support the relationship between structural stability and dielectric loss. However, due to different sinterabilities, for instance, the densified temperatures of Ln = La, Ce, Eu, Gd are 650 °C, 575 °C, 600 °C, and 725 °C, the actual growth of grains and amounts of grain boundaries are different, which also negatively affects the dielectric loss.
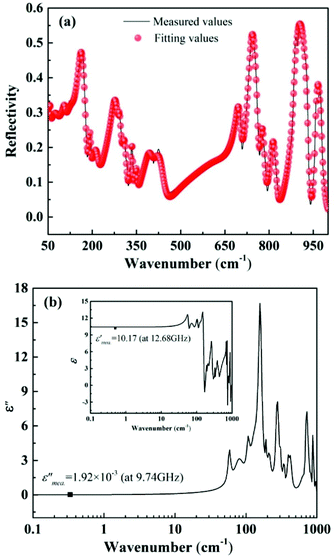 |
| | Fig. 27 (a) Measured (black line) and fitted (red line) IR reflectivity spectrum of La2Zr3(MoO4)9 ceramic prepared by a reaction-sintering process sintered at 650 °C for 4 h; (b) real and imaginary parts of complex permittivity for an La2Zr3(MoO4)9 ceramic prepared by a reaction-sintering process sintered at 650 °C for 4 h (points are measured values in the microwave region) (reprinted with permission from ref. 184. Copyright 2019 Elsevier). | |
TiO2 is usually chosen as the Zr site substitution source. In La2(Zr1−xTix)3(MoO4)9 ceramics, solid solutions are formed in the range x = 0–0.1.180 The introduction of a Ti4+ cation leads to an expansion in cell volume and bond length. Based on P–V–L theory calculation, decreasing bond ionicity is consistent with the εr value, which is confirmed by the observed and theoretical dielectric polarizability. It should also be mentioned that the Ti site situation can be also referred to the Li2Mg3TiO6 system (Mg site substitution). Also, when the Zr site is partially replaced by an Sn4+ cation in Ce2(Zr0.94Sn0.06)3(MoO4)9, one can still find a declining trend between bond ionicity and εr values in Ce2Zr3(MoO4)9 and Ce2(Zr0.94Sn0.06)3(MoO4)9 systems, where the Aftotal (εr) values are 79.32% (10.69) and 74.00% (10.35), respectively.185 This conclusion indicates that in Zr site substitution, the bond ionicity value may possibly be proportional to dielectric polarization.
4.6 Cubic spinel structures
MgO–TiO2 systems are appealing to the public for their richness in raw materials, low cost and excellent microwave dielectric properties. For instance, three main crystalline phases are reported in the binary MgO–TiO2 phase diagram: spinel Mg2TiO4, ilmenite MgTiO3 and pseudobrookite MgTi2O5, where Mg2TiO4 and MgTiO3 exhibit low εr values and ultra-low dielectric loss (Mg2TiO4: ST = 1480 °C, εr = 14.51, Q × f = 161![[thin space (1/6-em)]](https://www.rsc.org/images/entities/char_2009.gif) 570 GHz, and τf = −49.3 ppm per °C; MgTiO3: ST = 1400 °C, εr = 17.75, Q × f = 250
570 GHz, and τf = −49.3 ppm per °C; MgTiO3: ST = 1400 °C, εr = 17.75, Q × f = 250![[thin space (1/6-em)]](https://www.rsc.org/images/entities/char_2009.gif) 000 GHz, and τf = −42.5 ppm per °C).186,187
000 GHz, and τf = −42.5 ppm per °C).186,187
Li reported the chemical bond characteristics of the Mg2TiO4 system by using P–V–L bond theory. The Mg2TiO4 system has a cubic structure with a space group of Fd3m(227) and lattice parameters of a = b = c = 8.443 Å and Vcell = 601.84 Å3. Structural details, including fractional coordinate, atomic position and occupancy are listed in Table 11.186
Table 11 Crystal structural detail, fractional coordinate, atomic position and occupancy of cubic spinel Mg2TiO4 structures
| Atom |
Position |
Fractional coordinate |
Occ |
|
x
|
y
|
z
|
| Mg1 |
8a |
0.1250 |
0.1250 |
0.1250 |
0.964 |
| Mg2 |
16d |
0.5000 |
0.5000 |
0.5000 |
0.518 |
| Ti1 |
8a |
0.1250 |
0.1250 |
0.1250 |
0.036 |
| Ti2 |
16d |
0.5000 |
0.5000 |
0.5000 |
0.482 |
| O |
32e |
0.2616 |
0.2616 |
0.2616 |
1.000 |
The crystal structure is presented in Fig. 28, where the M1 site (8a) is occupied by Mg1 and Ti1, while Mg2 and Ti2 are in the M2 site (16d). A cation in the M1 site is four-fold coordinated, forming an [M1O4] tetrahedron, and an octahedral ligand [M2O8] forms in the M2 site. The O2− anion is surrounded by four cations. The binary bonding formula is then expressed as:188
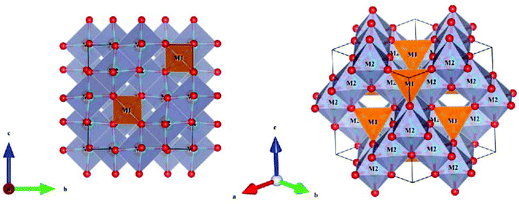 |
| | Fig. 28 Crystal structure of a cubic spinel Mg2TiO4 crystal. | |
Thus, Ti–O bonds show larger bond ionicity (88.34%) values than Mg–O bonds (76.62%), and the lattice energy of Ti–O bonds (13290 kJ mol−1) is two times larger than that of Mg–O bonds (7473 kJ mol−1). By substituting the Ti site with an Sn4+ cation in Mg2(Ti1−xSnx)O4, a cubic solid solution was formed over the whole range of x = 0–1. An increase in Sn4+ content leads to an enhancement in bond lengths. Based on P–V–L bond theory calculation, it is found that the decrease in average bond covalency is responsible for the drop in εr value, as shown in Fig. 29.186 The structural stability reflected by the Utotal value gradually weakens as x increases. To verify the structural changes, Raman scatting spectra are presented in Fig. 30.186 Raman-active vibrational modes are assigned into three parts, where the Raman modes located in the high-frequency region (600–750 cm−1) are attributed to the symmetric stretching (A1g) and asymmetric stretching behaviours (T12g) of the [M1O4] tetrahedron. Modes in (350–600 cm−1) are classified as symmetric (T22g) and asymmetric (Eg) bending behaviours of the [M1O4] tetrahedron. The mode at 323 cm−1 implies a local lattice in the octahedral sub-lattice. The most intense Raman peak (A1g) usually has a dominant effect on structural variation. It is shown that the A1g mode redshifts as x increases, which verifies that the increase in cell volume and bond length leads to a decrease in vibrational energy. Thus, the decrease in the εr value is verified by the shift in A1g Raman peak position.
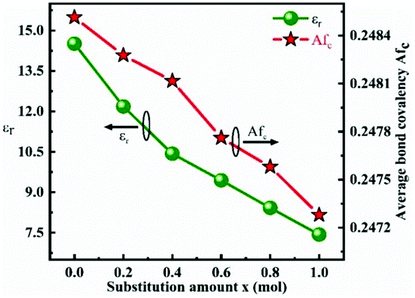 |
| | Fig. 29 The dielectric constant εr and the average bond covalency Afc variation with x varying from 0 to 1 (reprinted with permission from ref. 186. Copyright 2019 Elsevier). | |
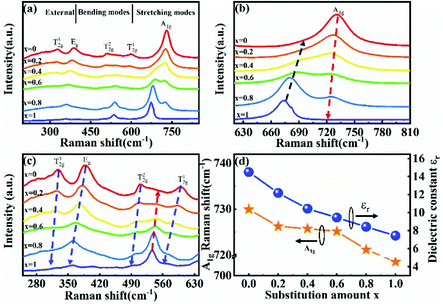 |
| | Fig. 30 (a) The Raman spectra of Mg2(Ti1−xSnx)O4 compounds in the range 200 cm−1–850 cm−1; (b) the variation in Raman shift in the high frequency region (600 cm−1–730 cm−1); (c) the variation in Raman shift in the range 280 cm−1–630 cm−1; (d) the relationship between dielectric constant and A1g Raman shift (reprinted with permission from ref. 186. Copyright 2019 Elsevier). | |
4.7 Orthorhombic europium titanium structure
Ln2TiO5 ceramics have potential in the usage of forms of nuclear waste because of their excellent chemical durability and tolerance to high-energy particles. Recently, Zheng reported a novel orthorhombic europium titanium type Eu2TiO5 microwave dielectric system and analysed the bond parameters using P–V–L bond theory for the first time.189
Unlike reported crystal structural types, Eu2TiO5 is an orthorhombic structure with a Pnam(62) space group and lattice parameters of a = 10.5342 Å, b = 11.2957 Å, c = 3.7785 Å and Vcell = 449.61 Å3, where cations are mixed with seven and five-fold coordination, as shown in Fig. 31. Two types of Eu atoms, and six different types of O atoms are shown. Specifically, both Eu13+ and Eu23+ cations are seven-fold coordinated, which is regarded as an irregular octahedron with the addition of a seventh atom. It is also reported that based on the polyhedral configuration of seven-fold coordination, the coordination of the Ln cation (for instance Ln = Y) can be regarded as a cube missing one oxygen atom, and a distorted trigonal prism with a seventh oxygen atom connected via a face.190 The Ti4+ cation is surrounded by five O2− anions. Eu1 is the center cation connecting with three O1, two O2, one O3 and one O4 anions in an Eu1 polyhedron; however, Eu2 connects with one O1, one O2, one O3, two O4 and two O5 anions in an Eu2 polyhedron. The Ti4+ cation links with one O2, two O3, one O4 and one O5 anion. The binary bonding formula is written as:189
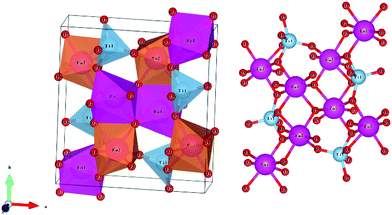 |
| | Fig. 31 Crystal structure of an orthorhombic Eu2TiO5 crystal. | |
It is important to note that even for the same cation, taking Eu(2) as an example, the effective valence electron numbers of the O anion (Zo) in Eu–O bonds are different: Zo = 36/7 in an Eu(2)–O(4) bond, and Zo = 27/7 in an Eu(2)–O(5) bond. Those values in Ti–O bonds also vary as the m and n values in AmBn change.
After taking these factors into consideration, the average bond ionicity fi value is arranged as follows: fi(Eu1−O) = 88.17% > fi(Eu2−O) = 85.99% > fi(Ti–O) = 77.04%, where the chemical bonds tend to be more ionic, and the largest fi value is found in the Eu1–O bond. For the lattice energy, Ti–O bonds have the largest average lattice energy AU value of about 3626 kJ mol−1, followed by that of Eu1–O (1251 kJ mol−1) and then Eu2–O (1241 kJ mol−1) bonds, which shows that Ti–O bonds play an indispensable role in determining the structural stability of an orthorhombic Eu2TiO5 structure.
Niu reported the electron localization function (ELF) based on first principles calculation to give an insightful estimate of the ionicity or covalency aspects of bonds in orthorhombic Ln2TiO5 systems (Ln = La, Sm, Gd, Dy), as presented in Fig. 32.191 As a dimensionless, empirical function, the ELF that generated comparatively large values (>0.5) is ascribed to the bonding/nonbonding localized electrons and smaller values (<0.5) for delocalized electrons. It is found that in both Ln/Ti–O bonds, the bond ionicity should be the essential factor, and Ti–O bonds are more covalent than Ln–O bonds for the σ-bonding Ti (3d)–O(2p) orbital interaction. This theoretical calculation also provides evidence for the bond ionicity results that Ti–O bonds have the largest bond covalency value of about 22.96% compared to that of Eu–O bonds of 14.01%.
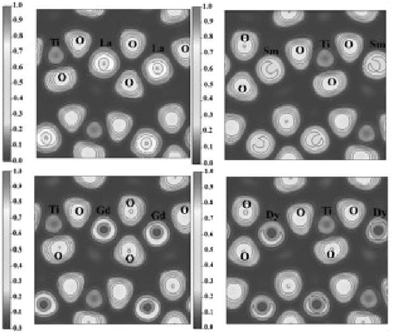 |
| | Fig. 32 ELF at the (040) plane for La2TiO5, Sm2TiO5, Gd2TiO5 and Dy2TiO5. (reprinted with permission from ref. 191. Copyright 2011 Cambridge University Press). | |
4.8 Monoclinic fergusonite structure
As a typical case of fergusonite RENbO4, NdNbO4 is interesting to the public and is widely studied for its widespread application prospects. For instance, a phase transformation of RENbO4 takes place between a tetragonal scheelite structure and a monoclinic ferroelastic structure at about 550 °C.192 It could be promising for the application of anode-supporting substrates, proton conducting cells and energy-absorption by virtue of its surface properties, chemical compatibility and the strain resulting from the phase transformation.193–196 For MWDC applications, a RENbO4 ceramic also shows excellence in dielectric performance because of the existence of an [NbO6] framework and rare-earth elements. e.g. an εr of 19.6, a Q × f value of about 33![[thin space (1/6-em)]](https://www.rsc.org/images/entities/char_2009.gif) 000 GHz and a τf of −24 ppm per °C are obtained for an NdNbO4 ceramic,82 and for an LaNbO4 ceramic sintered at 1275 °C: εr = 20.3, Q × f = 59
000 GHz and a τf of −24 ppm per °C are obtained for an NdNbO4 ceramic,82 and for an LaNbO4 ceramic sintered at 1275 °C: εr = 20.3, Q × f = 59![[thin space (1/6-em)]](https://www.rsc.org/images/entities/char_2009.gif) 740 GHz, τf = 7.44 ppm per °C,197 and a much lower dielectric loss is found in (La0.92Sm0.08)NbO4 ceramics with an εr value about 19.37, a Q × f value of 62
740 GHz, τf = 7.44 ppm per °C,197 and a much lower dielectric loss is found in (La0.92Sm0.08)NbO4 ceramics with an εr value about 19.37, a Q × f value of 62![[thin space (1/6-em)]](https://www.rsc.org/images/entities/char_2009.gif) 203 GHz and a τf of ca. 2.57 ppm per °C.198 Thus, much effort has been put into studying the structure–property relationship and improving the microwave dielectric properties.
203 GHz and a τf of ca. 2.57 ppm per °C.198 Thus, much effort has been put into studying the structure–property relationship and improving the microwave dielectric properties.
Based on the reported monoclinic fergusonite crystal structure configuration of NdNbO4 ceramic: a = 5.146 Å, b = 11.294 Å, c = 5.451 Å and Vcell = 317.25 Å3 with a space group of I2/a(15), as shown in Fig. 33,199 the structure consists of a distorted [NdO8] dodecahedron and [NbO6] octahedron. [NbO6] frames form a one-dimensional zigzag chain by sharing an edge, while the [NdO8] units are set in the propagating chains of [NbO6] sharing the oxygen. Both Nd and Nb atoms are in a 4e Wyckoff site, and both connect with two Nd3+ cations and two Nb5+ cations (CN = 4), while the O2 anion links with two Nd3+ cations and one Nb5+ cation (CN = 3). This discrepancy results in different effective valence electron numbers for the O anion (Zo). Firstly, the binary bonding formula should be decomposed into:199
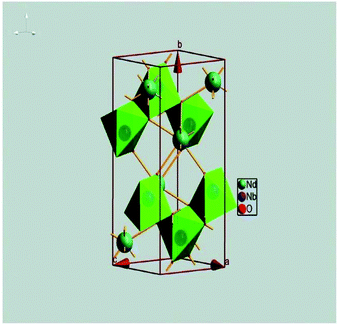 |
| | Fig. 33 The crystal structure patterns of the (1 × 1 × 1) supercell of monoclinic fergusonite structured NdNbO4 (reproduced from ref. 199 with permission from the PCCP Owner Societies). | |
Apparently, the Zo values in Nd1/4–O(1), Nd1/4–O(2), Nb1/3–O(1) and Nb1/3–O(2) are 4.5, 3.375, 10 and 7.5, respectively. With the same crystal structure, bonding environment and binary bonding expressions of RENbO4 (RE = Nd, La) ceramics, detailed comparisons between chemical bond features are listed in Table 6S.† Here, we summarize the bond ionicity, lattice energy and microwave dielectric properties in Table 12.197,199
Table 12 Comparisons of average bond ionicity, total lattice energy and microwave dielectric properties in RENbO4 (RE = Nd, La) ceramics
| RE |
Bond type |
Af
i (%) |
U
total (kJ mol−1) |
χ/∑χ (%) |
ε
r
|
Q × f (GHz) |
| Nd |
Nd–O |
85.55 |
5767 |
48.22 |
19.6 |
33![[thin space (1/6-em)]](https://www.rsc.org/images/entities/char_2009.gif) 000 000 |
| Nb–O |
85.56 |
19![[thin space (1/6-em)]](https://www.rsc.org/images/entities/char_2009.gif) 530 530 |
51.78 |
|
|
| ∑χ = 2.98, Afitotal = 85.55%, Utotal = 25297 kJ mol−1 |
| La |
La–O |
84.82 |
5412 |
53.87 |
20.3 |
59![[thin space (1/6-em)]](https://www.rsc.org/images/entities/char_2009.gif) 740 740 |
| Nb–O |
84.61 |
20![[thin space (1/6-em)]](https://www.rsc.org/images/entities/char_2009.gif) 553 553 |
46.13 |
|
|
| ∑χ = 3.62, Afitotal = 84.73%, Utotal = 25965 kJ mol−1 |
Combined with Table 6S in ESI† and Table 12, it can be found that all the ionicity fi values of the chemical bonds in LaNbO4 are smaller than those in the NdNbO4 system. For the two structures, specifically, Afi values of Nd–O bonds are very close to those of Nb–O bonds, and their susceptibility contribution ratios are also very similar. However, large contributions of lattice energy originate from Nb–O bonds (79%). This is to say, both Nd–O and Nb–O bonds are responsible for the dielectric polarization, but Nb–O bonds are the crucial factor for stabilizing the crystal structure. Moreover, it is also shown that the εr value of LaNbO4, which is higher than that of NdNbO4, corresponds to a lower bond ionicity value, suggesting that in the Nd–La transformation, an increase in bond covalency may possibly be closely related to dielectric polarization. This can be confirmed by the increase in bond susceptibility. High stability in LaNbO4 ceramics also agrees with a higher Q × f value, which indicates that the structural stability in monoclinic fergusonite RENbO4 (RE = Nd, La) is also an intrinsic factor determining intrinsic dielectric loss. Zhang reported the substitution of an La3+ ion on an Nd site in (Nd1−xLax)NbO4 ceramics,199 and the results show that an increase in the εr value is consistent with average bond covalency, and an increasing content of La2O3 (x = 0–0.06) is beneficial to improving the structural stability and Q × f value. This finding supports the conclusion above. The Nd site also can be replaced by an Sm3+ cation in (Nd1−xSmx)NbO4 ceramics. Interestingly, the bond ionicity decreases along with the εr value, and an increase in the Q × f value is also attributed to the enhancement in Utotal value.200 There is a temperature-induced phase transition in SmNbO4 ceramics from a monoclinic to a tetragonal structure when the temperature exceeds 800 °C but no relevant chemical bond parameters have been reported for SmNbO4; therefore, it is difficult to compare detailed bond features in RE = Nd, Sm systems.201
As noted, Nb–O bonds are the dominant influence on structural stability, apart from Nd site substitution. The Nb site is also substituted by pentavalent single ions and complex ions to improve the Q × f value: e.g. in the solid solution region of the (1 − x)LaNbO4–xLaVO4 system (x = 0–0.1), the drop in εr value is also ascribed to the decrease in bond ionicity, which can be confirmed by the drop in dielectric polarizability of V5+ (2.92 Å) compared to Nb5+ (3.97 Å) and an increase in Utotal value confirms the great improvement in Q × f value from 6770 GHz to 62370 GHz.202 Substitution of the Nb site using Ta2O5 as a source in LaNbO4 ceramics presents a similar trend, where the εr value consistently decreases with bond ionicity, and the increase in structural stability induced by the Ta5+ cation improves the Q × f value from 47![[thin space (1/6-em)]](https://www.rsc.org/images/entities/char_2009.gif) 000 GHz to 66000 GHz.203
000 GHz to 66000 GHz.203
Complex ions, such as (Al1/3W2/3)5+, (Mg1/4W3/4)5+, (Zr1/2W1/2)5+ and (AMo)5+ (A = Mg, Al, Si, Zr) were used to replace the Nb site. For instance, Yang took variations of (Al1/3W2/3)5+ and (Mg1/4W3/4)5+ ionic occupancies into consideration in modified NdNbO4 systems,204,205 and the results show that even the cell volume shows different changes. Both the average bond ionicity values are responsible for the εr value, and, for the Q × f value, variations in lattice energy and actual average size of grain together make contributions to the actual dielectric loss. They also found a close relationship between total lattice energy and cell volume in (AMo)5+ (A = Mg, Al, Si, Zr) substitution, as shown in Fig. 34,206 where shrinkage in cell volume improves the structural stability, consequently reducing the intrinsic loss. Based on their reports on microwave dielectric properties, an SiMo doping system also shows the largest Q × f value of about 49![[thin space (1/6-em)]](https://www.rsc.org/images/entities/char_2009.gif) 466 GHz, which is higher than that of the undoped situation of 24
466 GHz, which is higher than that of the undoped situation of 24![[thin space (1/6-em)]](https://www.rsc.org/images/entities/char_2009.gif) 750 GHz.
750 GHz.
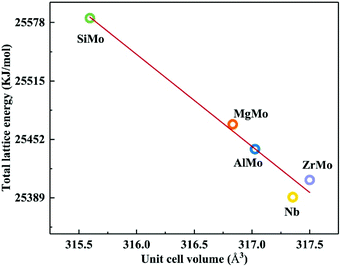 |
| | Fig. 34 Correlation between the lattice energy and molecular volume of different NdNbO4-based ceramics (reprinted with permission from ref. 206. Copyright 2019 Elsevier). | |
4.9 Complex perovskite structure
Complex perovskite Ba(M1/3M′2/3)O3 (M = Mg, Ni, Zn; M′ = Nb, Ta) structures are well known for and have been broadly studied for their outstanding microwave dielectric properties For instance, Ba(Mg1/3Ta2/3)O3 ceramic has a moderate εr value of about 24, an ultra-high Q × f value of 250![[thin space (1/6-em)]](https://www.rsc.org/images/entities/char_2009.gif) 000 GHz and a near-zero τf value,1 and it is mostly used in resonators and has achieved widespread commercial value and thus continuously attracts public attention. Until now, much effort has been put into exploring the intrinsic structural impacts on dielectric performances: e.g. a 1
000 GHz and a near-zero τf value,1 and it is mostly used in resonators and has achieved widespread commercial value and thus continuously attracts public attention. Until now, much effort has been put into exploring the intrinsic structural impacts on dielectric performances: e.g. a 1![[thin space (1/6-em)]](https://www.rsc.org/images/entities/char_2009.gif) :
:![[thin space (1/6-em)]](https://www.rsc.org/images/entities/char_2009.gif) 2 ordered structure was clearly revealed using transmission electron microscopy in Ba((Co0.5Zn0.3Mg0.2)1/3Nb2/3)O3 ceramic along 〈110〉c, 〈111〉c and 〈112〉c projections, where the ordering of M and M′ cations was considered to be a crucial factor for microwave dielectric properties.207
2 ordered structure was clearly revealed using transmission electron microscopy in Ba((Co0.5Zn0.3Mg0.2)1/3Nb2/3)O3 ceramic along 〈110〉c, 〈111〉c and 〈112〉c projections, where the ordering of M and M′ cations was considered to be a crucial factor for microwave dielectric properties.207
The Raman active and infrared active modes were assigned in detail by using first principles lattice dynamics calculation based on density functional theory, with the conclusion that the low dielectric loss found in this ordered Ba(Mg1/3Ta2/3)O3 ceramic can be ascribed to the long phonon lifetime and weak coupling among phonons.208 The Ba(Mg1/3Ta2/3)O3 system is crystallized as a hexagonal structure with a P![[3 with combining macron]](https://www.rsc.org/images/entities/char_0033_0304.gif) m1(164) space group, as shown in Fig. 35. Based on reported structural details (COD #4000400) of a = b = 5.77385 Å, c = 7.09376 Å, Vcell = 204.804 Å3 and P–V–L bond theory consideration, coordination environments for each cation are listed in Table 13. Also, the binary bonding formula is written as:
m1(164) space group, as shown in Fig. 35. Based on reported structural details (COD #4000400) of a = b = 5.77385 Å, c = 7.09376 Å, Vcell = 204.804 Å3 and P–V–L bond theory consideration, coordination environments for each cation are listed in Table 13. Also, the binary bonding formula is written as:
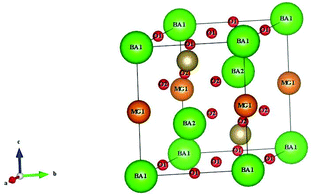 |
| | Fig. 35 Crystal structure of a hexagonal Ba(Mg1/3Ta2/3)O3 system. | |
Table 13 Coordinate environments of the Ba(Mg1/3Ta2/3)O3 system
| Ba3MgTa2O9 = Ba11Ba21MgTa2O13O26 |
| CN: coordination number, N(Bj–Ai) represents the number of Ai cations in the ligand of the Bj ion. |
| Ba1 |
Ba2 |
Mg |
Ta |
| CN = 12 |
CN = 12 |
CN = 6 |
CN = 6 |
| N(Ba1–O1) = 6 |
N(Ba1–O1) = 3 |
N(Mg–O2) = 6 |
N(Ta–O1) = 3 |
| N(Ba1–O2) = 6 |
N(Ba1–O2) = 9 |
|
N(Ta–O2) = 3 |
| O1 |
O2 |
|
|
| CN = 6 |
CN = 6 |
|
|
| N(O1–Ba1) = 2 |
N(O2–Ba1) = 1 |
|
|
| N(O1–Ba2) = 2 |
N(O2–Ba2) = 3 |
|
|
| N(O1–Ta) = 2 |
N(O2–Mg) = 1 |
|
|
|
|
N(O2–Ta) = 1 |
|
|
Detailed bond features of the Ba(Mg1/3Ta2/3)O3 system can be found in Table 7S in ESI.† The average bond ionicity, effective valence electron number of oxygen anions, total lattice energy and bond susceptibility are summarized in Table 14.
Table 14 Average bond ionicity, effective valence electron number of oxygen anion, total lattice energy and bond susceptibility of the Ba(Mg1/3Ta2/3)O3 system
| Bond type |
Afi (%) |
Z
o
|
U
total (kJ mol−1) |
χ
|
χ/∑χ (%) |
| Ba1–O |
95.61 |
3 |
2309 |
0.174 |
9.93 |
| Ba2–O |
95.61 |
3 |
3443 |
0.353 |
20.11 |
| Mg–O |
77.40 |
6 |
3864 |
0.564 |
32.14 |
| Ta–O |
89.78 |
15 |
49![[thin space (1/6-em)]](https://www.rsc.org/images/entities/char_2009.gif) 016 016 |
0.664 |
37.82 |
Based on the results from Table 14, it can be seen that Ba–O bonds have the largest bond ionicity fi value; however, the majority contributions to bond susceptibility come from Ta–O bonds, followed by Mg–O and Ba–O bonds. Furthermore, Ta–O bonds contribute about 89.8% of total lattice energy. This conclusion illustrates that Ta–O bonds in [TaO6] octahedra may be the dominant factor determining the dielectric properties.
By performing first principles calculations to obtain thorough vibrational modes and comparing them with an experimental far-infrared reflectivity spectrum, Wang assigned the specific vibrational behaviours in a Ba(Mg1/3Ta2/3)O3 system.209 For instance, symmetry coordinates and polarization are illustrated in Fig. 36. According to their fitting results of the FIR reflection spectrum using a four-parameter semiquantum model, it is shown that the Eu(4) mode at 220 cm−1 and the Eu(5) mode at 241 cm−1 provide the largest theoretical contributions to dielectric properties. More importantly, the Eu(4) and Eu(5) modes are assigned as the vibrations of [TaO6] octahedra (Ta motion versus O and vibration of O octahedra); that is to say, based on first principles calculation, it is confirmed that [TaO6] octahedra should be the dominant reason for the dielectric properties, which is consistent with the results from P–V–L bond theory. Furthermore, the Eu(4) and Eu(5) modes in total contribute about 53.8% and 90.2% to the dielectric constant εr and dielectric loss tan![[thin space (1/6-em)]](https://www.rsc.org/images/entities/char_2009.gif) δ, which are also close to the results from Table 14. Similarly, first principles calculation indicates that the Eu(1) mode at 149 cm−1 and the A2u(2) mode at 212 cm−1, where the vibrational behaviours closely related to [NbO6] octahedra, dominate the dielectric properties in the Ba(Mg1/3Nb2/3)O3 system.210
δ, which are also close to the results from Table 14. Similarly, first principles calculation indicates that the Eu(1) mode at 149 cm−1 and the A2u(2) mode at 212 cm−1, where the vibrational behaviours closely related to [NbO6] octahedra, dominate the dielectric properties in the Ba(Mg1/3Nb2/3)O3 system.210
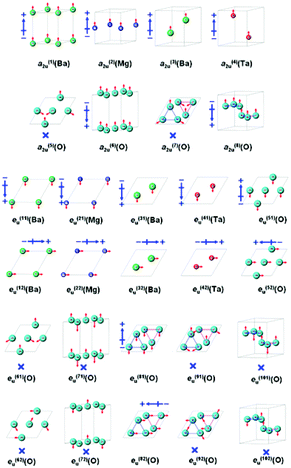 |
| | Fig. 36 Symmetry coordinates and polarization of Ba(Mg1/3Ta2/3)O3. The arrows ( ) stand for the polarizing direction and the crosses (×) stand for no polarization (reprinted with permission from ref. 209. Copyright 2010 John Wiley and Sons). ) stand for the polarizing direction and the crosses (×) stand for no polarization (reprinted with permission from ref. 209. Copyright 2010 John Wiley and Sons). | |
At this point, we are driven to wonder whether the dominant factor in a complex perovskite structure is dependent on the heavier atom. Another typical complex perovskite can be found in cubic Ba(Mg1/2W1/2)O3 ceramics (εr = 17, Q × f = 42![[thin space (1/6-em)]](https://www.rsc.org/images/entities/char_2009.gif) 000 GHz, τf = −33.6 ppm per °C). Based on reported first principles calculations, it is shown that the F1u(2) mode at 277 cm−1 makes about 47.5% and 80.5% contributions to εr and tan
000 GHz, τf = −33.6 ppm per °C). Based on reported first principles calculations, it is shown that the F1u(2) mode at 277 cm−1 makes about 47.5% and 80.5% contributions to εr and tan![[thin space (1/6-em)]](https://www.rsc.org/images/entities/char_2009.gif) δ, while the mode is regarded as the stretching behaviours of [MgO6] and [WO6] octahedra.211 Ba(Mg1/2W1/2)O3 is a cubic structure with a space group of Fm3m and lattice parameters of: a = b = c = 8.112 Å, and Vcell = 533.807 Å3 as reported by Filip'ev from COD #1537301.212 In the view of P–V–L bond theory, its coordination environment of cations is totally different from that in the Ba(Mg1/3Ta2/3)O3 system, where the binary bonding formula is much simpler with only one type of bond shown in the oxygen polyhedron:
δ, while the mode is regarded as the stretching behaviours of [MgO6] and [WO6] octahedra.211 Ba(Mg1/2W1/2)O3 is a cubic structure with a space group of Fm3m and lattice parameters of: a = b = c = 8.112 Å, and Vcell = 533.807 Å3 as reported by Filip'ev from COD #1537301.212 In the view of P–V–L bond theory, its coordination environment of cations is totally different from that in the Ba(Mg1/3Ta2/3)O3 system, where the binary bonding formula is much simpler with only one type of bond shown in the oxygen polyhedron:
| Ba2MgWO6 = Ba2O4 + MgO + WO |
The bond parameters are listed in Table 15. Comparing Table 15 with Table 14, it can be seen that even the fi values are close to each other; however, the contributions to bond susceptibility are quite different, where the Mg–O bond accounts for 58.36% of the total bond susceptibility in this situation, illustrating that the Mg–O bond is indispensable for dielectric polarization. First principles calculation also shows that the [MgO6] octahedra make large contributions to dielectric loss, while P–V–L bond theory indicates that W–O bonds are indispensable in structural stability. This difference may possibly be related to the boundary condition constraints in the establishment of the model. Therefore, the theoretical conclusions must be verified through experiments on Mg site and W site substitutions to give more precise results.
Table 15 Bond ionicity, lattice energy, and bond susceptibility in Ba(Mg1/2W1/2)O3 system
| Bond type |
f
i (%) |
U (kJ mol−1) |
χ
μ
|
F
μ
|
χ
|
χ/∑χ (%) |
| Ba–O |
95.6 |
4627 |
0.71 |
0.67 |
0.47 |
30.12 |
| Mg–O |
77.6 |
3756 |
5.49 |
0.17 |
0.91 |
58.36 |
| W–O |
91.3 |
37![[thin space (1/6-em)]](https://www.rsc.org/images/entities/char_2009.gif) 319 319 |
1.08 |
0.17 |
0.18 |
11.51 |
The discrepancy between the two structures may possibly lie in structural differences and ionic occupancies. From this section, it can be concluded that although both belong to complex perovskites, differences in structures, coordination environment and effective valence electron number of ions together lead to different bond parameters and different contributing sources to bond susceptibility and lattice energy.
This conclusion is similar in cubic Li2xMg1−xTixO1+2x (x = 1/4, 2/5 and 1/2) systems that although all of them are subject to a cubic structure and have a similar bonding environment, a discrepancy in ionic occupancy results in a different bond susceptibility. By comparing the bond susceptibility, lattice energy and dielectric properties of Ba(Mg1/3Ta2/3)O3 and Ba(Mg1/2W1/2)O3 systems in Table 16, one can clearly find from Table 16 that there is also a close relationship between bond susceptibility, lattice energy and microwave dielectric properties, suggesting that bond features may also be crucial for intrinsic dielectric properties.
Table 16 Comparisons of bond susceptibility, lattice energy and microwave dielectric properties of complex perovskite Ba(Mg1/3Ta2/3)O3 and Ba(Mg1/2W1/2)O3 systems
| System |
χ
|
U
total (kJ mol−1) |
ε
r
|
Q × f (GHz) |
| Ba(Mg1/3Ta2/3)O3 |
1.755 |
58![[thin space (1/6-em)]](https://www.rsc.org/images/entities/char_2009.gif) 632 632 |
24 |
250![[thin space (1/6-em)]](https://www.rsc.org/images/entities/char_2009.gif) 000 000 |
| Ba(Mg1/2W1/2)O3 |
1.566 |
45![[thin space (1/6-em)]](https://www.rsc.org/images/entities/char_2009.gif) 702 702 |
17 |
42![[thin space (1/6-em)]](https://www.rsc.org/images/entities/char_2009.gif) 000 000 |
4.10 Monoclinic wolframite structure
Wolframite-type AZrB2O8 (A = Mn, Zn, Mg, Co, Ni; B = Nb, Ta) is crystallized as a monoclinic structure with a space group of P2/c (13).213 As mentioned in section 4.8, the appearance of [NbO6] units is beneficial for microwave dielectric properties, which is also the case for a wolframite structure. For instance, a ZnZrNb2O8 ceramic has a moderate εr value of 29.27, a high Q × f value of about 55![[thin space (1/6-em)]](https://www.rsc.org/images/entities/char_2009.gif) 460 GHz, and a negative τf value of ca. −77.21 ppm per °C. Improvements in the Q × f value have been reported with ionic modification on the cation site: e.g. small amounts of Ni2+ cation (0.08 mol) on the Zn site greatly improve the Q × f value to 73224 GHz.214 A Ti site replaced by a Ge4+ cation (0.2 mol) is beneficial for the development of the Q × f value to 80493 GHz.215 An Nb site partially substituted by Ta5+ and Sb5+ cations also testified to positive effects on the Q × f value (Sb = 0.08 mol, Q × f = 89
460 GHz, and a negative τf value of ca. −77.21 ppm per °C. Improvements in the Q × f value have been reported with ionic modification on the cation site: e.g. small amounts of Ni2+ cation (0.08 mol) on the Zn site greatly improve the Q × f value to 73224 GHz.214 A Ti site replaced by a Ge4+ cation (0.2 mol) is beneficial for the development of the Q × f value to 80493 GHz.215 An Nb site partially substituted by Ta5+ and Sb5+ cations also testified to positive effects on the Q × f value (Sb = 0.08 mol, Q × f = 89![[thin space (1/6-em)]](https://www.rsc.org/images/entities/char_2009.gif) 400 GHz).216 Therefore, structural impacts, especially the evolution of bond features in an AZrB2O8 monoclinic solid solution, may be crucial for discussing the structure–property relationship.
400 GHz).216 Therefore, structural impacts, especially the evolution of bond features in an AZrB2O8 monoclinic solid solution, may be crucial for discussing the structure–property relationship.
4.10.1 A site difference in AZrNb2O8 (A = Mn, Zn, Mg, Co).
The monoclinic structure of an AZrNb2O8 system is shown in Fig. 37.217 A and Zr atoms are in the 2f Wyckoff position while Nb is in a 2e site. All the cations are six-fold coordinated, forming structural basic units of [MO6] octahedra (M = A, Zr, Nb). Based on the coordination environments, the binary bonding formula is expressed as:
where the effective valence electron numbers of O anions in A–O, Zr–O and Nb–O bonds are considered to be 3, 6 and 7.5, respectively. The coordination number and charge distribution can be generalized as in Fig. 38.218
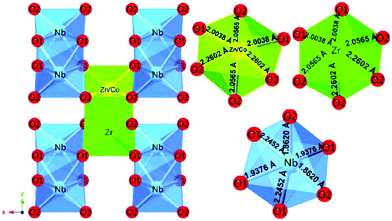 |
| | Fig. 37 Schematic representation of the Zn1−xCoxZrNb2O8 (2 × 2 × 2) supercell and the A-site (A = Zn2+/Co2+, Zr4+) and B-site (B = Nb5+) oxygen octahedrons of Zn0.94Co0.06ZrNb2O8 with their bond lengths (reproduced from ref. 217 with permission from the Royal Society of Chemistry). | |
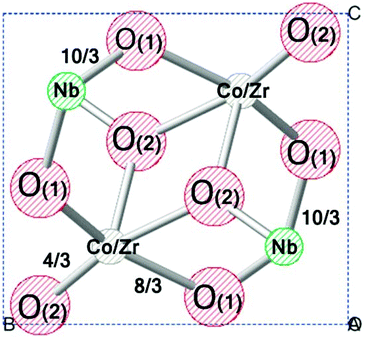 |
| | Fig. 38 The coordination number and charge distribution of ions in AZrNb2O8 ceramics (here A = Co ions) (reprinted with permission from ref. 218. Copyright 2016 Elsevier). | |
Due to the difference in ionic radii of A-site cations (IR values for Mn, Zn, Mg, Co at CN = 6 are 0.83, 0.74, 0.72, 0.65 Å), the Vcell and chemical bond lengths after Rietveld refinement present a declining trend from A = Mn to Co elements. Comparisons between bond ionicity, lattice energy, and microwave dielectric properties are listed in Table 17.218 The largest bond ionicity is shown in Nb–O bonds, followed by that in Zr–O and A–O bonds. The average fi for all types of bonds present a declining trend from 76.212% to 76.146%, corresponding to a decrease in dielectric polarization. As a result, the εr value declines from A = Mn to Co. This result indicates that variation in bond ionicity in different A site situations possibly affects the εr value. The largest total lattice energy value is found in A = Mg (52335 kJ mol−1), and then A = Zn (52297 kJ mol−1), while the smallest value is shown in A = Mn (51936 kJ mol−1), suggesting that the internal losses in A = Zn, Mg may be smaller than those in A = Mn, Co. By using the far-infrared reflectivity spectra, it is also found that the fitting of intrinsic loss by a classical three-parameter model of A = Zn, Mg systems is much smaller than those in A = Mn, Co systems.
Table 17 Comparisons between bond ionicity, lattice energy, and microwave dielectric properties of AZrNb2O8 ceramics (A = Mn, Zn, Mg, Co)
| A-site |
Bond type |
Af
i (%) |
U (kJ mol−1) |
ε
r
|
Q × f (GHz) |
| Mn |
Mn–O |
64.11 |
3212 |
27.56 |
27![[thin space (1/6-em)]](https://www.rsc.org/images/entities/char_2009.gif) 400 400 |
| Zr–O |
80.51 |
11![[thin space (1/6-em)]](https://www.rsc.org/images/entities/char_2009.gif) 673 673 |
| Nb–O |
84.02 |
37![[thin space (1/6-em)]](https://www.rsc.org/images/entities/char_2009.gif) 051 051 |
| Zn |
Zn–O |
64.02 |
3233 |
27.08 |
58![[thin space (1/6-em)]](https://www.rsc.org/images/entities/char_2009.gif) 000 000 |
| Zr–O |
80.48 |
11![[thin space (1/6-em)]](https://www.rsc.org/images/entities/char_2009.gif) 744 744 |
| Nb–O |
83.99 |
37![[thin space (1/6-em)]](https://www.rsc.org/images/entities/char_2009.gif) 320 320 |
| Mg |
Mg–O |
63.92 |
3255 |
26.55 |
68![[thin space (1/6-em)]](https://www.rsc.org/images/entities/char_2009.gif) 000 000 |
| Zr–O |
80.47 |
11![[thin space (1/6-em)]](https://www.rsc.org/images/entities/char_2009.gif) 824 824 |
| Nb–O |
84.05 |
37![[thin space (1/6-em)]](https://www.rsc.org/images/entities/char_2009.gif) 256 256 |
| Co |
Co–O |
64.00 |
3233 |
25.59 |
47![[thin space (1/6-em)]](https://www.rsc.org/images/entities/char_2009.gif) 100 100 |
| Zr–O |
80.47 |
11![[thin space (1/6-em)]](https://www.rsc.org/images/entities/char_2009.gif) 744 744 |
| Nb–O |
83.98 |
37![[thin space (1/6-em)]](https://www.rsc.org/images/entities/char_2009.gif) 320 320 |
NiO (0–0.08 mol) was used to partially replace the Zn sites in ZnZrNb2O8 ceramics, and the results also provide evidence that the decrease in fiNb–O value is responsible for the drop in the εr value, and the lattice energy consistently increases along with structural stability.214
4.10.2 Ionic doping on Zr/Nb sites in AZrNb2O8 (A = Zn, Mg).
Due to the excellence of the microwave dielectric properties in AZrNb2O8 (A = Zn, Mg) systems, a large number of studies have developed around the goal of further improving the Q × f value. Just as mentioned in section 4.10.1, the improvement in structural stability may possibly be positive for the development of the Q × f value. Thus, many studies around the MgZrNb2O8 system seek whether a similar relationship exists and what types of substitution sources are suitable.
For instance, taking the Zr site as an example, the cell volume is obviously decreasing when the Zr site is partially substituted by a Ge4+ cation in an Mg(Zr1−xGex)Nb2O8 (x = 0–0.4) system, which is caused by its smaller ionic radius of 0.53 than the 0.72 of a Zr4+ cation. Consequently, the Q × f value is greatly enhanced from 64![[thin space (1/6-em)]](https://www.rsc.org/images/entities/char_2009.gif) 784 GHz to 80493 GHz.215 The Sn4+ cation (IR = 0.69 at CN = 6) replacing a Zr site in an MgZr0.85Sn0.15Nb2O8 ceramic also shows that lattice energy is advantageous to the Q × f value, where the largest Utotal corresponds to the highest Q × f value of 94014 GHz.219
784 GHz to 80493 GHz.215 The Sn4+ cation (IR = 0.69 at CN = 6) replacing a Zr site in an MgZr0.85Sn0.15Nb2O8 ceramic also shows that lattice energy is advantageous to the Q × f value, where the largest Utotal corresponds to the highest Q × f value of 94014 GHz.219
For Nb site substitution, Ta5+, Sb5+, (Sn1/2W1/2)5+ cations are used to study the structure–property relationship based on P–V–L bond theory: e.g. in ZnZr(Nb1−xAx)2O8 (A = Ta, Sb) ceramics,216 an increasing content of donor reduces the cell volume, and the results show that a decrease in the Afi value for all types of bonds in a Ta5+ doping system (from 76.19% to 76.03%) should be responsible for the decline in εr value (from 26.7 to 25.7). Also, the increase in lattice energy improves the Q × f value (from 65![[thin space (1/6-em)]](https://www.rsc.org/images/entities/char_2009.gif) 100 GHz to 89
100 GHz to 89![[thin space (1/6-em)]](https://www.rsc.org/images/entities/char_2009.gif) 400 GHz). In an MgZrNb2O8 system, the Ta5+ cation is also proved to be an effective source to improve the lattice energy and Q × f value, and the average bond ionicity Afi value decreases similarly with the εr value.220 Complex (Sn1/2W1/2)5+ cation replacement for the Nb site in MgZrNb2O8 system (0–0.06 mol) is also confirmed by the similar variation tendency.221
400 GHz). In an MgZrNb2O8 system, the Ta5+ cation is also proved to be an effective source to improve the lattice energy and Q × f value, and the average bond ionicity Afi value decreases similarly with the εr value.220 Complex (Sn1/2W1/2)5+ cation replacement for the Nb site in MgZrNb2O8 system (0–0.06 mol) is also confirmed by the similar variation tendency.221
From the above-mentioned reports, it can be concluded that the variation in bond ionicity may be proportional to the dielectric polarization, and an improvement in lattice energy actually enhances the structural stability and further improves the Q × f value.
4.11 ZnO–TiO2–Nb2O5 ternary systems
The ternary system of ZnO–TiO2–Nb2O5 was firstly introduced by Baumgarte and Blachnik in 1992.222 It is proposed that in TiO2–Zn1/3Nb2/3O2, the rutile TiO2 phase appears when the molar content of Zn1/3Nb2/3O2 is lower than 58%, ixiolite ZnTiNb2O8 appears when the content is in the range of 69% to 85%, and columbite ZnNb2O6 is formed when the content is higher than 93%. In 2008, Kim first reported the formation and microwave dielectric properties of the Zn0.15Nb0.3Ti0.55O2 phase with a rutile structure.223 It should be noted that all the above systems contain Zn, Ti, and Nb elements and the molar ratio of Zn![[thin space (1/6-em)]](https://www.rsc.org/images/entities/char_2009.gif) :
:![[thin space (1/6-em)]](https://www.rsc.org/images/entities/char_2009.gif) Nb remains unchanged at about 1
Nb remains unchanged at about 1![[thin space (1/6-em)]](https://www.rsc.org/images/entities/char_2009.gif) :
:![[thin space (1/6-em)]](https://www.rsc.org/images/entities/char_2009.gif) 2. Further in-depth study shows that the above materials can be understood as the coordinated substitution of Ti4+ in TiO2 by (Zn1/3Nb2/3)4+ ions: (Zn1/3Nb2/3)xTi1−xO2 (x = 0.45, 0.75, 1). Phase structures vary with the increase in x value, as indicated in the ternary phase diagram of Fig. 39.
2. Further in-depth study shows that the above materials can be understood as the coordinated substitution of Ti4+ in TiO2 by (Zn1/3Nb2/3)4+ ions: (Zn1/3Nb2/3)xTi1−xO2 (x = 0.45, 0.75, 1). Phase structures vary with the increase in x value, as indicated in the ternary phase diagram of Fig. 39.
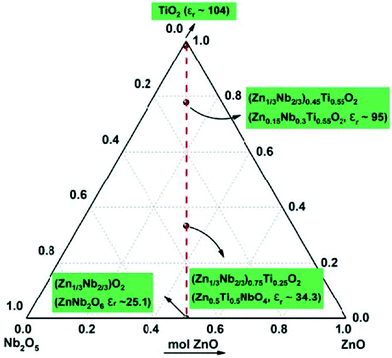 |
| | Fig. 39 Ternary ZnO–TiO2–Nb2O5 systems. | |
This ZnO–TiO2–Nb2O5 system has attracted much attention because of the excellence of its dielectric properties. For instance, columbite ZnNb2O6 has a considerable Q × f value of about 83![[thin space (1/6-em)]](https://www.rsc.org/images/entities/char_2009.gif) 700 GHz with a moderate εr value of about 25.89 Both ixiolite ZnTiNb2O8 and rutile Zn0.15Nb0.3Ti0.55O2 ceramics can be well-sintered at relatively low temperatures with various great dielectric performances (ixiolite: ST = 1100 °C, εr = 37.21, Q × f = 41
700 GHz with a moderate εr value of about 25.89 Both ixiolite ZnTiNb2O8 and rutile Zn0.15Nb0.3Ti0.55O2 ceramics can be well-sintered at relatively low temperatures with various great dielectric performances (ixiolite: ST = 1100 °C, εr = 37.21, Q × f = 41![[thin space (1/6-em)]](https://www.rsc.org/images/entities/char_2009.gif) 231 GHz; rutile: ST = 1050 °C, εr = 94.35, Q × f = 10
231 GHz; rutile: ST = 1050 °C, εr = 94.35, Q × f = 10![[thin space (1/6-em)]](https://www.rsc.org/images/entities/char_2009.gif) 889 GHz).224 Thus, many investigations have been undertaken to not only further improve the dielectric properties but also to decrease the sintering temperature, exploring applications in LTCC applications.
889 GHz).224 Thus, many investigations have been undertaken to not only further improve the dielectric properties but also to decrease the sintering temperature, exploring applications in LTCC applications.
From the point of view of crystal structure and P–V–L bond theory, an attractive feature of this system is that three distinctive crystal structural types appear with the variations in mole contents of the (Zn1/3Nb2/3)4+ ions. That is to say, the ionic occupancy is presented with large differences, which causes the different bond parameters. And taking this effect into consideration, one may have a better understanding of the structure–property relationship in the ZnO–TiO2–Nb2O5 system.
4.11.1 Variations in ionic occupancy in (Zn1/3Nb2/3)xTi1−xO2 (x = 0.45, 0.75, 1).
Just as indicated, variations in complex ionic occupancy lead to different phase compositions, which directly causes various bond parameters. For x = 1, a columbite orthorhombic ZnNb2O6 structure with a space group of Pbcn(60) is formed, and its crystal structural parameters are reported as: a = 14.213 Å, b = 5.732 Å, c = 5.040 Å, Vcell = 410.60 Å3. The crystal structure is shown in Fig. 40,225 where Zn and Nb atoms occupy 4c and 8d Wyckoff positions, and the structure consists of [ZnO6] and [NbO6] octahedral units, and it is arranged as Zn–Nb–Nb–Zn–Nb–Nb⋯ along the a-axis orientation. A [ZnO6] octahedron links with an [NbO6] octahedron through sharing a vertex, while both of them interconnect with each other via a shared edge when the x value changes to x = 0.75, and an ixiolite orthorhombic ZnTiNb2O8 phase exists. This phase can also be treated as the formation of an equimolar solid solution between ZnNb2O6 and TiO2. However, it should be noted that the disappearance of a superlattice diffraction peak (040) indicates the complete disorder of the solution structure, where Zn/Ti/Nb atoms are randomly distributed in 4c sites, coordinating with six oxygens to form [MO6] (M = Zn/Ti/Nb) octahedra, as shown in Fig. 41. Furthermore, when the x value reaches 0.45, the phase structure changes into rutile tetragonal Zn0.15Nb0.3Ti0.55O2, where the cations are also six-fold coordinated and in a 2a site.
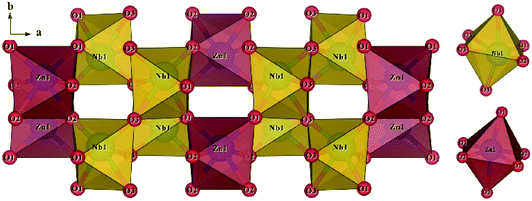 |
| | Fig. 40 Crystal structure of columbite ZnNb2O6 (reprinted with permission from ref. 225. Copyright 2019 John Wiley and Sons). | |
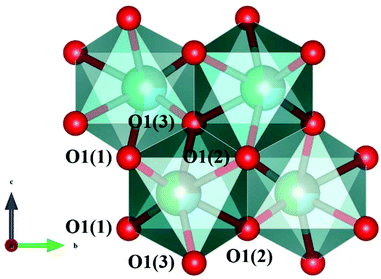 |
| | Fig. 41 Crystal structure of ixiolite ZnTiNb2O8. | |
It is necessary to investigate the structural impacts via P–V–L bond theory due to the three types of crystal structures showing large diversities in microwave dielectric properties. Based on a consideration of bonding environments and charge distributions, the binary bonding formulas for the three structures can be summarized as:224,225
Detailed comparisons between bond ionicity and lattice energy can be found in Table 8S in ESI.† Here we summarize the average bond ionicity, total lattice energy and microwave dielectric properties of (Zn1/3Nb2/3)xTi1−xO2 (x = 0.45, 0.75, 1) systems in Table 18. From Table 8S† and Table 18, it can be seen that the columbite structure is presented with a much lower average bond ionicity Afi value, while the largest Afi is shown in the rutile structure. More specifically, fiNb–O bonds in the three types of structure are largest, followed by Ti–O bonds and Zn–O bonds. The lattice energy U value for each bond also shows similar variation. The largest Utotal in the columbite ZnNb2O6 system shows excellent structural stability; correspondingly, its intrinsic loss would be a minimum. It is proved that Nb–O bonds make about a 68% contribution to dielectric polarization in the ZnNb2O6 system, emphasizing the importance of Nb–O bonds.
Table 18 Comparisons between average bond ionicity, total lattice energy and microwave dielectric properties in (Zn1/3Nb2/3)xTi1−xO2 (x = 0.45, 0.75, 1) systems
|
x (mol) |
Structure |
Af
i (%) |
U
total (kJ mol−1) |
ε
r
|
Q × f (GHz) |
| C, I and R refer to columbite, ixiolite and rutile structures. The U value is normalized based on the formula (Zn1/3Nb2/3)xTi1−xO2. |
| 1 |
C |
74.04 |
13![[thin space (1/6-em)]](https://www.rsc.org/images/entities/char_2009.gif) 532 532 |
23.1 |
72![[thin space (1/6-em)]](https://www.rsc.org/images/entities/char_2009.gif) 885 885 |
| 0.75 |
I |
76.06 |
13![[thin space (1/6-em)]](https://www.rsc.org/images/entities/char_2009.gif) 145 145 |
37.2 |
41![[thin space (1/6-em)]](https://www.rsc.org/images/entities/char_2009.gif) 231 231 |
| 0.45 |
R |
76.52 |
12![[thin space (1/6-em)]](https://www.rsc.org/images/entities/char_2009.gif) 872 872 |
94.4 |
10![[thin space (1/6-em)]](https://www.rsc.org/images/entities/char_2009.gif) 889 889 |
Furthermore, far-infrared reflectivity spectra were applied to further testify to the intrinsic dielectric properties in (Zn1/3Nb2/3)xTi1−xO2 (x = 0.45, 0.75, 1) systems; taking x = 1 as an example, the infrared spectrum is presented in Fig. 42.225 The real part and imaginary part of the complex dielectric constant fitted using a classical three-parameter model (LTPC) and a four-parameter semiquantum model (FPSQ) are shown in Fig. 43.225 Both these fitting processes indicate an intrinsic low εr value of about 23.3 and an ultra-high Q × f value of 122![[thin space (1/6-em)]](https://www.rsc.org/images/entities/char_2009.gif) 807 GHz. Similarly, intrinsic dielectric properties for ixiolite ZnTiNb2O8 (εr = 32.16, Q × f = 40
807 GHz. Similarly, intrinsic dielectric properties for ixiolite ZnTiNb2O8 (εr = 32.16, Q × f = 40![[thin space (1/6-em)]](https://www.rsc.org/images/entities/char_2009.gif) 151 GHz) and rutile Zn0.15Nb0.3Ti0.55O2 (εr = 97.63, Q × f = 10
151 GHz) and rutile Zn0.15Nb0.3Ti0.55O2 (εr = 97.63, Q × f = 10![[thin space (1/6-em)]](https://www.rsc.org/images/entities/char_2009.gif) 443 GHz) are also close to experimental values, indicating that the intrinsic factor may have a dominant effect on microwave dielectric performance.224
443 GHz) are also close to experimental values, indicating that the intrinsic factor may have a dominant effect on microwave dielectric performance.224
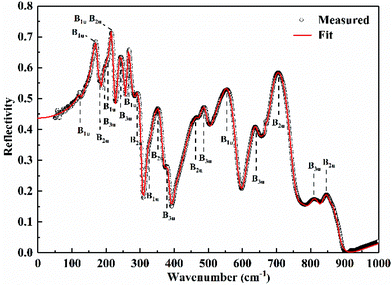 |
| | Fig. 42 Experimental and fitted far-infrared reflectivity spectra of ZnNb2O6 ceramic (reprinted with permission from ref. 225. Copyright 2019 John Wiley and Sons). | |
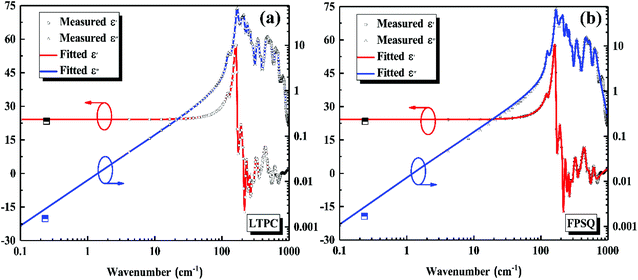 |
| | Fig. 43 Real ε′(ω) and imaginary parts ε′′(ω) of relative permittivity after (a) LTPC and (b) FPSQ mode fitting. FPSQ, four parameter semiquantum model; LTPC, Lorentz three parameter semiquantum model (reprinted with permission from ref. 225. Copyright 2019 John Wiley and Sons). | |
4.11.2 Ionic modification in (Zn1/3Nb2/3)xTi1−xO2 (x = 0.45, 0.75, 1).
In the three typical structures, columbite ZnNb2O6 and ixiolite ZnTiNb2O8 ceramics are mostly studied for their considerable dielectric properties with moderate εr values. However, a number of investigations have been undertaken to improve the negative τf values (−52 ppm per °C for ixiolite). For instance, in ZnTiNb2O8 ceramics, Mg2+, Co2+, Ni2+, Ca2+/Sn4+ and Ta5+ cations were used to substitute the cation site, and most studies have shown that the ceramic system with ionic doping presents an increase in εr value and the τf value could be adjusted to the positive side. Interestingly, based on previous reports, it is the formation of secondary rutile Zn0.15Nb0.3Ti0.55O2 that regulates the dielectric properties.226–229
In our previous study, combined with the phase diagram, Zn0.15+0.35xTi0.55−0.05xNb0.3+0.7xO2+2x ceramics (shortened to xZTN-(1-x)ZNT) were planned through directly introducing Zn0.15Nb0.3Ti0.55O2 into Zn0.5Ti0.5NbO4 ceramics.224 The purpose of this design is to understand the phase evolution and variations in bond features in both orthorhombic and tetragonal solid solution under the change in ionic occupancies in the absence of other donors. As shown by the XRD patterns in Fig. 44, orthorhombic and rutile solid solutions are formed in the ranges of x = 0–0.2 and x = 0.65–1. An increase in x value obviously leads to an expansion in cell volume and an enlargement in bond length. In section 4.3, it is noticed that occupancies in Li, Mg and Ti cations have different impacts on bond parameters. Thus, based on consideration of P–V–L bond theory, the binary bonding formula AmBn should vary with ionic occupancy, which can be found in Table 9S in ESI,† and the m value makes a large difference even in the same structure. Variations in average bond covalency are shown in Fig. 45. An increase in the x value in solid solution regions leads to a monotonous decrease in Afc value for all types of bonds. However, a small variation in Afc value is not enough to support the decrease in dielectric polarizability. Therefore, as indicated by the drop in total bond susceptibility value from 4.04 to 2.98 in the rutile structure and from 3.34 to 2.84 in the ixiolite structure, it is confirmed that the drop in average bond covalency is responsible for the decline in the εr value. Additionally, in the rutile solid solution, the variations in dapical/dequatorial reflect the cation rattling and εr value. Similarly, the ratio varying from 1.0089 to 1.0083 still supports the decrease in dielectric polarization. Intrinsically, the lattice energy shows a linearly increasing trend in both rutile and ixiolite solid solutions, showing an improvement in structural stability. It can clearly be seen that with the variation in Zn/Ti/Nb cations, the Q × f value is reasonably improved (from 10![[thin space (1/6-em)]](https://www.rsc.org/images/entities/char_2009.gif) 889 to 13
889 to 13![[thin space (1/6-em)]](https://www.rsc.org/images/entities/char_2009.gif) 017 GHz in rutile and from 42
017 GHz in rutile and from 42![[thin space (1/6-em)]](https://www.rsc.org/images/entities/char_2009.gif) 181 to 47
181 to 47![[thin space (1/6-em)]](https://www.rsc.org/images/entities/char_2009.gif) 829 GHz in ixiolite).
829 GHz in ixiolite).
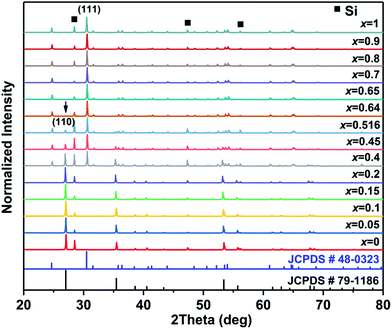 |
| | Fig. 44 X-ray diffraction patterns for all the compositions of xZTN-(1−x)ZNT ceramics for x = 0–1 (reprinted with permission from ref. 224. Copyright 2018 American Chemical Society). | |
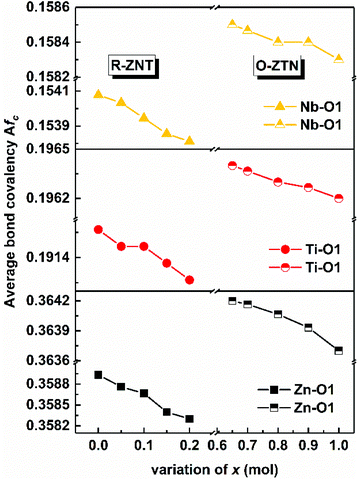 |
| | Fig. 45 Average bond covalency as a function of the x value in the R-ZNT phase and O-ZTN phase (reprinted with permission from ref. 224. Copyright 2018 American Chemical Society). | |
It can be concluded that in orthorhombic Zn0.5Ti0.5NbO4 and tetragonal Zn0.15Nb0.3Ti0.55O2 solid solutions, when the system is doped with larger sized cations, variations in dielectric polarization are affected by bond covalency.
Another case in point is the Zr1−xZn0.5xTi1−0.5xNbxO4 ceramic, where both ZrTiO4 and Zn0.5Ti0.5NbO4 belong to the same orthorhombic structure. With the increase in x value, both volume cell and bond length are increased. The covalency of all types of bonds declines in the range x = 0.1–0.5, corresponding to a drop in bond susceptibility. As a result, the εr value decreases as well. Similarly, the structural stability of Zr1−xZn0.5xTi1−0.5xNbxO4 is improved from 24![[thin space (1/6-em)]](https://www.rsc.org/images/entities/char_2009.gif) 150 to 25200 kJ mol−1, accompanied by an increase in Q × f value from 24
150 to 25200 kJ mol−1, accompanied by an increase in Q × f value from 24![[thin space (1/6-em)]](https://www.rsc.org/images/entities/char_2009.gif) 000 to 30558 GHz.230
000 to 30558 GHz.230
In the rutile Zn0.15Nb0.3Ti0.55O2 system, the larger sized Zr4+ cation was used for Ti site substitution231 in the Zn0.15Nb0.3(Ti1−xZrx)0.55O2 system, where the rutile phase transforms into the orthorhombic in the range x = 0.3–0.4. Still, the increase in cell volume and bond length eventually leads to a drop in covalency for all types of bonds, and the theoretical and experimental εr values decrease.
From the above cases, one can find that when the cation sites in Zn0.5Ti0.5NbO4 and Zn0.15Nb0.3Ti0.55O2 systems are replaced with larger sized ions, there is a proportional relationship between average bond covalency and εr value.
However, different situations occur if the cation site is doped with smaller sized ions. For instance, in our previous study, Ta2O5 was chosen as a substitution source to replace Nb sites in a rutile Zn0.15Nb0.3−xTaxTi0.55O2 (0 ≤ x ≤ 0.3) system,232 where an infinite solid solution can be formed because of the close size of the radii between Nb5+ and Ta5+ cations. With the substitution of Ta5+ cations, cell volume and bond length decrease, leading to decreasing tendencies for all types of bond ionicity. Due to the asynchronous change in bond length, the ratio of dapical/dequatorial shows a decreasing trend from 1.0086 to 1.0075, suggesting a decreasing trend for the εr value. Thus, the bond ionicity is reasonably correlated with the εr value, as indicated in Fig. 46. The lattice energy consistently increases along with the x value in x = 0–0.2, corresponding to a great improvement in Q × f value from 11![[thin space (1/6-em)]](https://www.rsc.org/images/entities/char_2009.gif) 012 to 22
012 to 22![[thin space (1/6-em)]](https://www.rsc.org/images/entities/char_2009.gif) 050 GHz.
050 GHz.
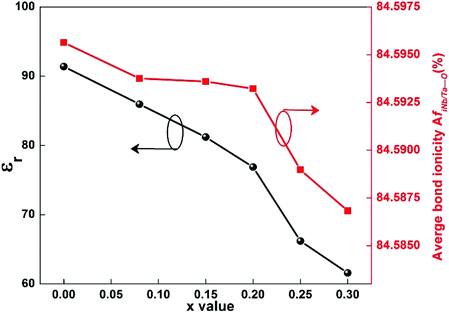 |
| | Fig. 46
ε
r and average Nb-site bond ionicity of Zn0.15Nb0.3−xTaxTi0.55O2 (0 ≤ x ≤ 0.3) ceramics (reprinted with permission from ref. 232. Copyright 2019 Elsevier). | |
Furthermore, Luo used complex ions (Al0.5Nb0.5)4+ with small size to partially replace Ti sites in a ZnTi1−x(Al0.5Nb0.5)xNb2O8 system and found that increasing structural stability has a positive relationship with bond covalency, where a high bond covalency indicates a low dielectric loss. By using THz time domain spectra to study the intrinsic dielectric properties, it is found that the εr value and dielectric loss in the THz region both present a declining trend; the variation of εr value is shown in Fig. 47.233
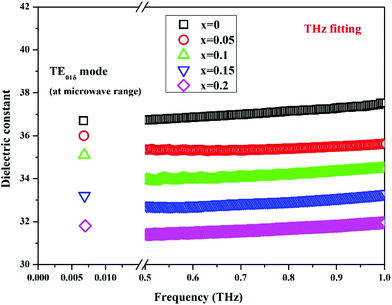 |
| | Fig. 47 Dielectric constant of ZnTi1−x(Al0.5Nb0.5)xNb2O8 ceramics in the microwave and terahertz range (reprinted with permission from ref. 233. Copyright 2019 John Wiley and Sons). | |
We may infer from the reports that in Zn0.5Ti0.5NbO4 and Zn0.15Nb0.3Ti0.55O2 systems, variations in bond covalency should play a dominant role in determining the εr value when the cation site is replaced with large sized ions; otherwise, it is the bond ionicity value that is proportional to dielectric polarization. Still, this conjecture should be tested with large amounts of experimental results in the future.
4.12 Tetragonal trirutile A0.75Ti0.75Ta1.5O6 structure (A = Co, Ni, Zn, Mg)
It is reported that in the substitution of the ZnTi(Nb1−xTax)2O8 system, the τf value is largely compensated for due to the existence of trirutile phases. Recently, pure tetragonal trirutile ceramics with chemical formula A0.75Ti0.75Ta1.5O6 have been investigated from the point of view of crystal structure and chemical bond features.
In general, the trirutile structure is regarded as an enlargement of the rutile structure along the c-axis length. Typical types of trirutile structures are shown in Fig. 48.234 All the cations are surrounded by six oxygens. However, the bond types and ionic occupancies are presented with large differences even though they share the same structural type, leading to different bonding formula expressions (A = Ni is similar to A=Co):234
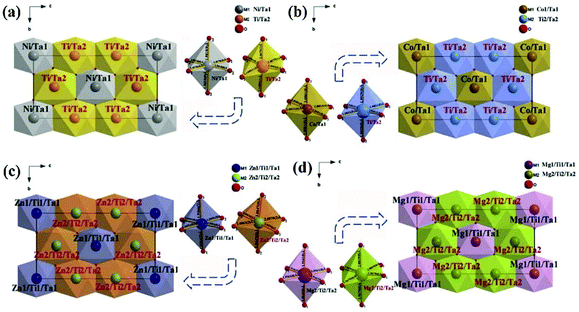 |
| | Fig. 48 The schematic diagram of the crystal structure of (a) Ni0.75Ti0.75Ta1.5O6, (b) Co0.75Ti0.75Ta1.5O6, (c) Zn0.75Ti0.75Ta1.5O6, (d) Mg0.75Ti0.75Ta1.5O6 ceramics (reprinted with permission from ref. 234. Copyright 2020 Elsevier). | |
Therefore, it is found that Ta–O bonds have larger bond ionicity values than Ti–O and A–O bonds. The largest lattice energy also shows the same tendency. Combined with the bond susceptibility value, this indicates that Ta–O bonds provide the majority contributions of about 60% and 70% to dielectric polarization and structural stability, illustrating the significance of Ta–O bonds in a trirutile structure.235 In the synthesis of A0.75Ti0.75Ta1.5O6 (A = Co, Ni, Zn, Mg) ceramics, Wang also found a proportional relationship between the bond ionicity value of Ta–O bonds and the εr value, where with the increase in ionic radius, the increase in fiTa–O value is mainly responsible for the εr value. The lattice energy, showing the maximum value in the A = Ni system (60941 kJ mol−1), also corresponds to the largest Q × f value (25![[thin space (1/6-em)]](https://www.rsc.org/images/entities/char_2009.gif) 051 GHz).
051 GHz).
5. Summary and future work
The primary goal of applying P–V–L bond theory to microwave dielectric ceramics is to provide guidance for the exploration of practical novel systems and ion doping modifications on the basis of comprehensive knowledge of crystal structure and chemical bond properties. With the help of the binary bonding formula theory of complex polycrystals, it is very advantageous to provide basic chemical bond characteristics, such as bond ionicity, bond covalency and bond susceptibility. By applying these fundamental traits, the structural evolution and developments of microwave dielectric properties can be explained reasonably well. For instance, a preliminary understanding of the polarization ability and structural stability of crystals can be gained on the condition of knowing the crystal structure and structural parameters alone. Intrinsically, the crystal structure would be more lattice stable with a higher lattice energy. Far-infrared reflectance spectroscopy and THz time-domain spectroscopy may possibly be effective methods for examining the evolution of intrinsic dielectric properties. On the other hand, some conjectures based on experimental results are proposed, which require a large number of experiments to verify and supplement them in the future. For instance, it is found that Mg sites being doped using larger radius ions results in a similar variation tendency between bond ionicity and dielectric constant, while smaller radius ion doping at Ti sites is beneficial for improving the structural stability of and reducing the internal dielectric loss in cubic rock salt Li2Mg3TiO6 systems. For most niobate systems, substitution of Nb sites by Ta ions obviously improves the structural stability of the crystal and further positively affects the Q × f value. Therefore, with the conclusions put forward, P–V–L bond theory can provide ideas for subsequent ion doping in other systems.
However, P–V–L bond theory is predictable theoretically, while the actual situation is still subject to influences from external factors, such as the experimental/fabrication process. Therefore, the use of bond theory is meaningful on the premise of improving the sinterability of materials and reducing the loss from external processes (such as the use of spark plasma sintering). Furthermore, we know that chemical bonds in polyhedra will be in stretched or compressed states, leading to discrepancies in ionic polarizabilities deviating from theoretical ionic polarization, as a result, affecting the dielectric constant of dielectric materials. In a binary system, the specific polarization ability of each kind of ion in a specific crystal can be determined according to bond theory given the crystal structure and dielectric constant. With the help of the binary bonding formula and calculation of bond susceptibility, the dielectric constant of a bond can be used to theoretically calculate the ionic polarizability and volume polarizability of the ions in the complex crystal. Combined with normalized chemical bond analysis, the variations in specific polarizability in the crystal can be quantitatively characterized, which is of great significance to discussing the change in dielectric polarization in microwave dielectric ceramics.
Conflicts of interest
There are no conflicts to declare.
Acknowledgements
Reproduced from ref. 199 with permission from the PCCP Owner Societies; Reproduced from ref. 217 with permission from the Royal Society of Chemistry. The authors acknowledge financial supports from the National Natural Science Foundation of China (Grant. 51872037). The authors would also like to thank Prof. Shu Zhang for her helpful discussions on the P–V–L bond theory.
Notes and references
- I. M. Reaney and D. Iddles, Microwave Dielectric Ceramics for Resonators and Filters in Mobile Phone Networks, J. Am. Ceram. Soc., 2006, 89, 2063–2072 CAS
 .
.
- M. T. Sebastian, R. Ubic and H. Jantunen, Low-loss dielectric ceramic materials and their properties, Int. Mater. Rev., 2015, 60, 392–412 CrossRef
 .
.
-
M. T. Sebastian, Dielectric Materials for Wireless Communication, Elsevier Science, 2008 Search PubMed
 .
.
- D. Zhou, L. X. Pang, D. W. Wang and I. M. Reaney, BiVO4 based high k microwave dielectric materials: a review, J. Mater. Chem. C, 2018, 6, 9290–9313 RSC
 .
.
- S. J. Penn, N. M. Alford, A. Templeton, X. Wang, M. Xu, M. Reece and K. Schrapel, Effect of Porosity and Grain Size on the Microwave Dielectric Properties of Sintered Alumina, J. Am. Ceram. Soc., 1997, 80, 1885–1888 CrossRef CAS
 .
.
- Y. Guo, H. Ohsato and K.-I. Kakimoto, Characterization and dielectric behavior of willemite and TiO2-doped willemite ceramics at millimeter-wave frequency, J. Eur. Ceram. Soc., 2006, 26, 1827–1830 CrossRef CAS
 .
.
- C. W. Zheng, S. Y. Wu, X. M. Chen and K. X. Song, Modification of MgAl2O4 Microwave Dielectric Ceramics by Zn Substitution, J. Am. Ceram. Soc., 2007, 90, 1483–1486 CrossRef CAS
 .
.
- D. J. Barber, K. M. Moulding, J. I. Zhou and M. Li, Structural order in Ba(Zn1/3Ta2/3)O3, Ba(Zn1/3Nb2/3)O3 and Ba(Mg1/3Ta2/3)O3 microwave dielectric ceramics, J. Mater. Sci., 1997, 32, 1531–1544 CrossRef CAS
 .
.
- C. W. Ahn, H. J. Jang, S. Nahm, H. M. Park and H. J. Lee, Effects of microstructure on the microwave dielectric properties of Ba(Co1/3Nb2/3)O3 and (1−x)Ba(Co1/3Nb2/3)O3−xBa(Zn1/3Nb2/3)O3 ceramics, J. Eur. Ceram. Soc., 2003, 23, 2473–2478 CrossRef CAS
 .
.
- M. H. Kim, J. B. Lim, J. C. Kim, S. Nahm, J. H. Paik, J. H. Kim and K. S. Park, Synthesis of BaCu(B2O5) Ceramics and their Effect on the Sintering Temperature and Microwave Dielectric Properties of Ba(Zn1/3Nb2/3)O3 Ceramics, J. Am. Ceram. Soc., 2006, 89, 3124–3128 CrossRef CAS
 .
.
- K. S. Hong, I. T. Kim and C. D. Kim, Order-Disorder Phase Formation in the Complex Perovskite Compounds Ba(Ni1/3Nb2/3)O3 and Ba(Zn1/3Nb2/3)O3, J. Am. Ceram. Soc., 1996, 79, 3218–3224 CrossRef CAS
 .
.
- W. Y. Lin, R. F. Speyer, W. S. Hackenberger and T. R. Shrout, Microwave Properties of Ba2Ti9O20 Doped with Zirconium and Tin Oxides, J. Am. Ceram. Soc., 1999, 82, 1207–1211 CrossRef CAS
 .
.
- J. H. Choy, Y. S. Han, J. H. Sohn and M. Itoh, Microwave Characteristics of BaO-TiO2 Ceramics Prepared via a Citrate Route, J. Am. Ceram. Soc., 1995, 78, 1169–1172 CrossRef CAS
 .
.
- T. Takada, S. F. Wang, S. Yoshikawa, S. J. Jang and R. E. Newnham, Effects of Glass Additions on (Zr,Sn)TiO4 for Microwave Applications, J. Am. Ceram. Soc., 1994, 77, 2485–2488 CrossRef CAS
 .
.
- C. L. Huang and M. H. Weng, Liquid phase sintering of (Zr,Sn)TiO4 microwave dielectric ceramics, Mater. Res. Bull., 2000, 35, 1881–1888 CrossRef CAS
 .
.
- R. Ubic, I. M. Reaney and W. E. Lee, Microwave dielectric solid–solution phase in system BaO–Ln2O3−TiO2 (Ln=lanthanide cation), Int. Mater. Rev., 1998, 43, 205–219 CrossRef CAS
 .
.
- J. B. Lim, K. H. Cho, S. Nahm, J. H. Paik and J. H. Kim, Effect of BaCu(B2O5) on the sintering temperature and microwave dielectric properties of BaO–Ln2O3−TiO2 (Ln=Sm, Nd) ceramics, Mater. Res. Bull., 2006, 41, 1868–1874 CrossRef CAS
 .
.
- Z. Xiong, B. Tang, Z. Fang, C. Yang and S. Zhang, Crystal structure, Raman spectroscopy and microwave dielectric properties
of Ba3.75Nd9.5Ti18−z(Al1/2Nb1/2)z,O54 ceramics, J. Alloys Compd., 2017, 723, 580–588 CrossRef CAS
 .
.
- Y. Chen, S. Zhang, E. Li, N. Niu and H. Yang, Sintering characteristic and microwave dielectric properties of 0.45Ca0.6Nd0.267TiO3–0.55Li0.5Nd0.5TiO3 ceramics with La2O3−B2O3−ZnO additive, Appl. Phys. A: Mater. Sci. Process., 2018, 124, 188 CrossRef CAS
 .
.
- K. Ezaki, Y. Baba, H. Takahashi, K. Shibata and S. Nakano, Microwave Dielectric Properties of CaO-Li2O-Ln2O3-TiO2 Ceramics, Jpn. J. Appl. Phys., 1993, 32, 4319–4322 CrossRef CAS
 .
.
- H. Takahashi, Y. Baba, K. Ezaki and K. Shibata, Microwave Dielectric Properties and Crystal Structure of CaO–Li2O–(1-x)Sm2O3–x,Ln2O3–TiO2 (Ln: lanthanide) Ceramics System, Jpn. J. Appl. Phys., 1996, 35, 5069–5073 CrossRef CAS
 .
.
- R. J. Cava, Dielectric materials for applications in microwave communications, J. Mater. Chem., 2001, 11, 54–62 RSC
 .
.
- T. A. Vanderah, Talking Ceramics, Science, 2002, 298, 1182–1184 CrossRef CAS
 .
.
- H. Yang, E. Li, H. Yang, H. He and R. S. Zhang, Synthesis of Zn0.5Ti0.5NbO4 microwave dielectric ceramics with Li2O-B2O3-SiO2 glass for LTCC application, Int. J. Appl. Glass Sci., 2018, 9, 392–402 CrossRef CAS
 .
.
- H. Wu and J. Bi, Synthesis, characterization, and microwave dielectric properties of monoclinal structure ZnZrNb2O8 ceramics through the aqueous sol–gel process, J. Mater. Sci.: Mater. Electron., 2016, 27, 3474–3480 CrossRef CAS
 .
.
- C. H. Wang, X. P. Jing, L. Wang and J. Lu, XRD and Raman Studies on the Ordering/Disordering of Ba(Mg1/3Ta2/3)O3, J. Am. Ceram. Soc., 2009, 92, 1547–1551 CrossRef CAS
 .
.
- C. F. Tseng, Microwave dielectric properties of low loss microwave dielectric ceramics: A0.5Ti0.5NbO4 (A=Zn, Co), J. Eur. Ceram. Soc., 2014, 34, 3641–3648 CrossRef CAS
 .
.
- K. Kanehara, T. Hoshina, H. Takeda and T. Tsurumi, Terahertz permittivity of rutile TiO2 single crystal measured by anisotropic far-infrared ellipsometry, J. Ceram. Soc. Jpn., 2015, 123, P5-1–P5-3 CrossRef
 .
.
- Y. Liao, S. Takezawa, H. Takeda, T. Tsurumi and T. Hoshina, Terahertz dielectric response of nano-grained barium titanate ceramics measured by far-infrared spectroscopic ellipsometry, Jpn. J. Appl. Phys., 2019, 58, SLLA07 CrossRef CAS
 .
.
- J. Guo, D. Zhou, Y. Li, T. Shao, Z. M. Qi, B. B. Jin and H. Wang, Structure–property relationships of novel microwave dielectric ceramics with low sintering temperatures: (Na0.5x,Bi0.5xCa1−x)MoO4, Dalton Trans., 2014, 43, 11888–11896 RSC
 .
.
- K. Kanehara, T. Hoshina, H. Takeda and T. Tsurumi, Hoshina, Takuya-Measurement of ionic polarization of SrTiO3 single crystal by far-infrared spectroscopic ellipsometry, Appl. Phys. Lett., 2014, 105, 042901 CrossRef
 .
.
- R. D. Shannon, Dielectric polarizabilities of ions in oxides and fluorides, J. Appl. Phys., 1993, 73, 348–366 CrossRef CAS
 .
.
- D. Zhou, X. Q. Fan, X. W. Jin, D. W. He and G. H. Chen, Structures, Phase Transformations, and Dielectric Properties of BiTaO4 Ceramics, Inorg. Chem., 2016, 55, 11979–11986 CrossRef CAS
 .
.
- M. M. Mao, X. Q. Liu and X. M. Chen, Structural Evolution and Its Effects on Dielectric Loss in Sr1+x,Sm1−xAl1−xTixO4 Microwave Dielectric Ceramics, J. Am. Ceram. Soc., 2011, 94, 2506–2511 CrossRef CAS
 .
.
- N. E. Brese and M. O'Keeffe, Bond-valence parameters for solids, Acta Crystallogr., Sect. B: Struct. Sci., 1991, 47, 192–197 CrossRef
 .
.
- X. C. Fan, X. M. Chen and X. Q. Liu, Structural Dependence of Microwave Dielectric Properties of SrRAlO4 (R=Sm, Nd, La) Ceramics: Crystal Structure Refinement and Infrared Reflectivity Study, Chem. Mater., 2008, 20, 4092 CrossRef CAS
 .
.
- A. Magrez, M. Cochet, O. Joubert, G. Louarn, A. M. Ganne and O. Chauvet, High Internal Stresses in Sr1−xLa1+xAl1−xMgxO4 Solid Solution (0 ≤ x ≤ 0.7) Characterized by Infrared and Raman Spectroscopies Coupled with Crystal Structure Refinement, Chem. Mater., 2001, 13, 3893–3898 CrossRef CAS
 .
.
- J. C. Phillips, Dielectric Definition of Electronegativity, Phys. Rev. Lett., 1968, 20, 550–553 CrossRef CAS
 .
.
- J. A. Van Vechten, Quantum Dielectric Theory of Electronegativity in Covalent Systems. I. Electronic Dielectric Constant, Phys. Rev., 1969, 182, 891–905 CrossRef CAS
 .
.
- J. A. Van Vechten, Quantum Dielectric Theory of Electronegativity in Covalent Systems. II. Ionization Potentials and Interband Transition Energies, Phys. Rev., 1969, 187, 1007–1020 CrossRef CAS
 .
.
- J. C. Phillips, Ionicity of the Chemical Bond in Crystals, Rev. Mod. Phys., 1970, 42, 317–356 CrossRef CAS
 .
.
- B. F. Levine, Bond susceptibilities and ionicities in complex crystal structures, J. Chem. Phys., 1973, 59, 1463–1486 CrossRef CAS
 .
.
- J. C. Phillips, Bonds and Bands in Semiconductors, Science, 1970, 169, 1035 CrossRef CAS
 .
.
- W. Kucharczyk, A bond-charge calculation of the quadratic electro-optic effect in LiF, J. Phys. C: Solid State Phys., 1987, 20, 1875–1880 CrossRef CAS
 .
.
- B. F. Levine, Bond-Charge Calculation of Nonlinear Optical Susceptibilities for Various Crystal Structures, Phys. Rev. B: Solid State, 1973, 8, 4046–4046 CrossRef
 .
.
- J. C. Phillips and J. A. Van Vechten, Charge Redistribution and Piezoelectric Constants, Phys. Rev. Lett., 1969, 23, 1115–1117 CrossRef CAS
 .
.
- R. M. Martin, Elastic Properties of ZnS Structure Semiconductors, Phys. Rev. B: Solid State, 1970, 1, 4005–4011 CrossRef
 .
.
- J. A. Van Vechten and T. K. Bergstresser, Electronic Structures of Semiconductor Alloys, Phys. Rev. B: Solid State, 1970, 1, 3351–3358 CrossRef
 .
.
- G. B. Stringfellow, Calculation of ternary phase diagrams of III–V systems, J. Phys. Chem. Solids, 1972, 33, 665–677 CrossRef CAS
 .
.
- J. C. Phillips and J. A. Van Vechten, Spectroscopic Analysis of Cohesive Energies and Heats of Formation of Tetrahedrally Coordinated Semiconductors, Phys. Rev. B: Solid State, 1970, 2, 2147–2160 CrossRef
 .
.
- B. F. Levine, Electrodynamical Bond-Charge Calculation of Nonlinear Optical Susceptibilities, Phys. Rev. Lett., 1969, 22, 787–790 CrossRef CAS
 .
.
- J. C. Phillips and J. A. Van Vechten, Nonlinear Optical Susceptibilities of Covalent Crystals, Phys. Rev., 1969, 183, 709–711 CrossRef CAS
 .
.
- B. F. Levine, A New Contribution to the Nonlinear Optical Susceptibility Arising from Unequal Atomic Radii, Phys. Rev. Lett., 1970, 25, 440–443 CrossRef CAS
 .
.
- P. Lawaetz, Effective Charges and Ionicity, Phys. Rev. Lett., 1971, 26, 697–700 CrossRef CAS
 .
.
- P. Lawaetz, Valence-Band Parameters in Cubic Semiconductors, Phys. Rev. B: Solid State, 1971, 4, 3460–3467 CrossRef
 .
.
- C. V. de Alvarez, J. P. Walter, M. L. Cohen, J. Stokes and Y. R. Shen, Wavelength-Modulation Spectra and Band Structures of InP and GaP, Phys. Rev. B: Solid State, 1972, 6, 1412–1419 CrossRef
 .
.
- A. Baldereschi and J. J. Hopfield, Binding to Isoelectronic Impurities in Semiconductors, Phys. Rev. Lett., 1972, 28, 171–174 CrossRef CAS
 .
.
- D. K. Biegelsen, Frequency dependence of the photoelastic coefficients of silicon, Phys. Rev. B: Solid State, 1975, 12, 2427–2431 CrossRef CAS
 .
.
- D. K. Biegelsen, Photoelastic Tensor of Silicon and the Volume Dependence of the Average Gap, Phys. Rev. Lett., 1974, 32, 1196–1199 CrossRef CAS
 .
.
- W. Kucharczyk, The anisotropy of the cubic susceptibility in alkali halides as related to electro-optic and elasto-optic phenomena, J. Phys. C: Solid State Phys., 1988, 21, L985–L988 CrossRef
 .
.
- X. Dongfeng and S. Zhang, Calculation of the nonlinear optical coefficient of the NdAl3(BO3)4 crystal, J. Phys.: Condens. Matter, 1996, 8, 1949–1956 CrossRef
 .
.
- Z. J. Wu, Q. B. Meng and S. Y. Zhang, Semiempirical study on the valences of
Cu and bond covalency in Y1−xCaxBa2Cu3O6+y, Phys. Rev. B: Condens. Matter Mater. Phys., 1998, 58, 958–962 CrossRef CAS
 .
.
- F. Gao, D. Li, J. He, Y. Tian, D. Yu and S. Zhang, Chemical bond properties and Mössbauer spectroscopy in REBa2Cu3O7 (RE=Eu, Y), Phys. C, 2002, 371, 151–155 CrossRef CAS
 .
.
- Q. B. Meng, Z. J. Wu and S. Y. Zhang, The bond ionicity in (R=Pr, Sm, Eu, Gd, Dy, Y, Ho, Er, Tm), J. Phys.: Condens. Matter, 1998, 10, L85–L88 CrossRef CAS
 .
.
- Z. J. Wu, S. Y. Zhang and H. J. Zhang, Relationship between chemical bond parameters and superconducting temperature in HgBa2Can−1CunO2n+2+δ (n=1, 2, 3, 4), J. Phys. Chem. Solids, 2002, 63, 193–196 CrossRef CAS
 .
.
- F. M. Gao, D. C. Li and S. Y. Zhang, M ssbauer spectroscopy and chemical bonds in BaFe12O19 hexaferrite, J. Phys.: Condens. Matter, 2003, 15, 5079–5084 CrossRef CAS
 .
.
- H. Li, S. Zhou, S. Zhang and X. Cao, Calculation of the thermal expansion coefficient for Bi2Sr2CaCu2O8, Phys. C, 2006, 449, 41–46 CrossRef CAS
 .
.
- D. Liu, S. Zhang and Z. Wu, Lattice energy estimation for inorganic ionic crystals, Inorg. Chem., 2003, 42, 2465–2469 CrossRef CAS
 .
.
- D. R. Penn, Wave-Number-Dependent Dielectric Function of Semiconductors, Phys. Rev., 1962, 128, 2093–2097 CrossRef CAS
 .
.
- S. W. Wu, G. Wang, Q. Wang, Y. D. Jia, J. Yi, Q. J. Zhai, J. B. Liu, B. A. Sun, H. J. Chu, J. Shen, P. K. Liaw, C. T. Liu and T. Y. Zhang, Enhancement of strength-ductility trade-off in a high-entropy alloy through a heterogeneous structure, Acta Mater., 2019, 165, 444–458 CrossRef CAS
 .
.
- D. Zhou, D. Guo, W.-B. Li, L.-X. Pang, X. Yao, D.-W. Wang and I. M. Reaney, Novel temperature stable high-er microwave dielectrics in the Bi2O3-TiO2-V2O5 system, J. Mater. Chem. C, 2016, 4, 5357–5362 RSC
 .
.
- H. Yang, S. Zhang, Y. Chen, H. Yang, Z. Fang, Y. Yuan and E. Li, Low-firing, temperature stable and improved microwave dielectric properties of ZnO-TiO2-Nb2O5 composite ceramics, J. Materiomics, 2019, 5, 471–479 CrossRef
 .
.
- C. L. Diao, C. H. Wang, N. N. Luo, Z. M. Qi, T. Shao, Y. Y. Wang, J. Lu, Q. C. Wang, X. J. Kuang, L. Fang, F. Shi and X. P. Jing, First-principle calculation and assignment for vibrational spectra of Ba(Mg1/3Nb2/3)O3 microwave dielectric ceramic, J. Appl. Phys., 2014, 115, 114103 CrossRef
 .
.
- J. S. Shi and S. Y. Zhang, Barycenter of Energy of Lanthanide 4fN-15d Configuration in Inorganic Crystals, J. Phys. Chem. B, 2004, 108, 18845–18849 CrossRef CAS
 .
.
- D. Xue and S. Zhang, Chemical Bond Analysis of Nonlinearity of Urea Crystal, J. Phys. Chem. A, 1997, 101, 5547–5550 CrossRef CAS
 .
.
- T. Tsunooka, M. Androu, Y. Higashida, H. Sugiura and H. Ohsato, Effects of TiO2 on sinterability and dielectric properties of high-Q forsterite ceramics, J. Eur. Ceram. Soc., 2003, 23, 2573–2578 CrossRef CAS
 .
.
- N. M. Alford and S. J. Penn, Sintered alumina with low dielectric loss, J. Appl. Phys., 1996, 80, 5895–5898 CrossRef CAS
 .
.
- K. P. Surendran, P. V. Bijumon, P. Mohanan and M. T. Sebastian, (1-x)MgAl2O4-xTiO2 dielectrics for microwave and millimeter wave applications, Appl. Phys. A: Mater. Sci. Process., 2005, 81, 823–826 CrossRef CAS
 .
.
- A. Kan, H. Ogawa and A. Yokoi, Sintering temperature dependence of microwave dielectric properties in Mg4(TaNb1−xVx)O9 compounds, Mater. Res. Bull., 2006, 41, 1178–1184 CrossRef CAS
 .
.
- S. H. Yoon, D. W. Kim, S. Y. Cho and K. S. Hong, Investigation of the relations between structure and microwave dielectric properties of divalent metal tungstate compounds, J. Eur. Ceram. Soc., 2006, 26, 2051–2054 CrossRef CAS
 .
.
- A. Belous, O. Ovchar, D. Durylin, M. Valant, M. Macek-Krzmanc and D. Suvorov, Microwave composite dielectrics based on magnesium titanates, J. Eur. Ceram. Soc., 2007, 27, 2963–2966 CrossRef CAS
 .
.
- D. W. Kim, D. K. Kwon, S. H. Yoon and K. S. Hong, Microwave Dielectric Properties of Rare-Earth Ortho-Niobates with Ferroelasticity, J. Am. Ceram. Soc., 2006, 89, 3861–3864 CrossRef CAS
 .
.
- C. L. Huang and M. H. Weng, Improved high q value of MgTiO3-CaTiO3 microwave dielectric ceramics at low sintering temperature, Mater. Res. Bull., 2001, 36, 2741–2750 CrossRef CAS
 .
.
- H. T. Kim, S. Nahm, J. D. Byun and Y. Kim, Low-Fired (Zn,Mg)TiO3 Microwave Dielectrics, J. Am. Ceram. Soc., 1999, 82, 3476–3480 CrossRef CAS
 .
.
- S. Nomura, Ceramics for microwave dielectric resonator, Ferroelectrics, 1983, 49, 61–70 CrossRef CAS
 .
.
- T. Shimada, K. Kura and S. Ohtsuki, Dielectric properties and far infrared reflectivity of lanthanum aluminate–strontium titanate ceramics, J. Eur. Ceram. Soc., 2006, 26, 2017–2021 CrossRef CAS
 .
.
- J. Zhang, Y. Luo, Z. Yue and L. Li, High-Q and temperature-stable microwave dielectrics in layer cofired Zn1.01Nb2O6/TiO2/Zn1.01Nb2O6 ceramic architectures, J. Am. Ceram. Soc., 2019, 102, 342–350 CrossRef CAS
 .
.
- M. P. Seabra, A. N. Salak, V. M. Ferreira, J. L. Ribeiro and L. G. Vieira, Dielectric properties of (1−x)La(Mg1/2Ti1/2)O3–xSrTiO3 ceramics, J. Eur. Ceram. Soc., 2004, 24, 2995–3002 CrossRef CAS
 .
.
- D. W. Kim, J. H. Kim, J. R. Kim and K. S. Hong, Phase Constitutions and Microwave Dielectric Properties of Zn3Nb2O8–TiO2, Jpn. J. Appl. Phys., 2001, 40, 5994–5998 CrossRef CAS
 .
.
- D. J. Kim, J. W. Hahn, G. P. Han, S. S. Lee and T. G. Choy, Effects of Alkaline-Earth-Metal Addition on the Sinterability and Microwave Characteristics of (Zr,Sn)TiO4 Dielectrics, J. Am. Ceram. Soc., 2000, 83, 1010–1012 CrossRef CAS
 .
.
- I. N. Jawahar, P. Mohanan and M. T. Sebastian, A5B4O15 (A=Ba, Sr, Mg, Ca, Zn; B=Nb, Ta) microwave dielectric ceramics, Mater. Lett., 2003, 57, 4043–4048 CrossRef CAS
 .
.
- Y. Tohdo, K. Kakimoto, H. Ohsato, H. Yamada and T. Okawa, Microwave dielectric properties and crystal structure of homologous compounds ALa4Ti4O15 (A=Ba, Sr and Ca) for base station applications, J. Eur. Ceram. Soc., 2006, 26, 2039–2043 CrossRef CAS
 .
.
- P. RiaziKhoei, F. Azough and R. Freer, The Influence of ZnNb2O6 on the Microwave Dielectric Properties of ZrTi2O6 Ceramics, J. Am. Ceram. Soc., 2006, 89, 216–223 CrossRef CAS
 .
.
- A. Borisevich and P. K. Davies, Microwave dielectric properties of Li1+x–yM1−x–3yTix+4yO3 (M=Nb5+, Ta5+) solid solutions, J. Eur. Ceram. Soc., 2001, 21, 1719–1722 CrossRef CAS
 .
.
- K. Fukuda, I. Fujii, R. Kitoh, Y. Cho and I. Awai, Influence of Rare Earth Ions on BaO-TiO2-Rare Earth Oxide Ceramics for Microwave Applications, Jpn. J. Appl. Phys., 1993, 32, 1712–1715 CrossRef CAS
 .
.
- M. Heuer, A. L. Huber, G. D. Bromiley, K. T. Fehr and K. Bente, Characterization of synthetic hedenbergite (CaFeSi2O6)–petedunnite (CaZnSi2O6) solid solution series by X-ray single crystal diffraction, Phys. Chem. Miner., 2005, 32, 552–563 CrossRef CAS
 .
.
- G. J. Redhammer and G. Roth, A comparison of the clinopyroxene compounds CaZnSi2O6 and CaZnGe2O6, Acta Crystallogr., Sect. C: Cryst. Struct. Commun., 2005, 61, i20–i22 CrossRef
 .
.
- G. J. Redhammer, G. Roth, W. Treutmann, W. Paulus, G. André, C. Pietzonka and G. Amthauer, Magnetic ordering and spin structure in Ca-bearing clinopyroxenes CaM2+(Si, Ge)2O6, M=Fe, Ni, Co, Mn, J. Solid State Chem., 2008, 181, 3163–3176 CrossRef CAS
 .
.
- A. L. Huber, S. Heuss-Aßbichler, K. T. Fehr and G. D. Bromiley, Petedunnite (CaZnSi2O6): Stability and phase relations in the system CaO-ZnO-SiO2, Am. Mineral., 2012, 97, 739–749 CrossRef CAS
 .
.
- M. Xiao, Y. Wei and P. Zhang, The effect of sintering temperature on the crystal structure and microwave dielectric properties of CaCoSi2O6 ceramic, Mater. Chem. Phys., 2019, 225, 99–104 CrossRef CAS
 .
.
- H. Sun, Q. Zhang, H. Yang and J. Zou, (Ca1−xMgx)SiO3: A low-permittivity microwave dielectric ceramic system, Mater. Sci. Eng., B, 2007, 138, 46–50 CrossRef CAS
 .
.
- H. Li, X. Chen, Q. Xiang, B. Tang, J. Lu, Y. Zou and S. Zhang, Structure, bond characteristics and Raman spectra of CaMg1−xMnxSi2O6 microwave dielectric ceramics, Ceram. Int., 2019, 45, 14160–14166 CrossRef CAS
 .
.
- J. Zhang, Y. Zhou and Z. Yue, Low-temperature sintering and microwave dielectric properties of LiF-doped CaMg1−xZnxSi2O6 ceramics, Ceram. Int., 2013, 39, 2051–2058 CrossRef CAS
 .
.
- Y. Lai, H. Su, G. Wang, X. Tang, X. Liang, X. Huang, Y. Li, H. Zhang, C. Ye and X. R. Wang, Improved microwave dielectric properties of CaMgSi2O6 ceramics through CuO doping, J. Alloys Compd., 2019, 772, 40–48 CrossRef CAS
 .
.
- H. Li, C. Cai, Q. Xiang, B. Tang, S. Yu, J. Xiao, H. Luo and S. Zhang, , Raman, complex chemical bond and structural studies of novel CaMg1−x(Mn1/2Zn1/2)x,Si2O6 (x=0-0.1) ceramics, Ceram. Int., 2019, 45, 23157–23163 CrossRef CAS
 .
.
- T. Joseph, M. T. Sebastian, H. Sreemoolanadhan and V. K. Sree Nageswari, Effect of Glass Addition on the Microwave Dielectric Properties of CaMgSi2O6 Ceramics, Int. J. Appl. Ceram. Technol., 2010, 7, E98–E106 CrossRef
 .
.
- R. M. Thompson and R. T. Downs, The crystal structure of diopside at pressure to 10 GPa, Am. Mineral., 2008, 93, 177–186 CrossRef CAS
 .
.
- H. Ohsato, T. Tsunooka, T. Sugiyama, K.-I. Kakimoto and H. Ogawa, Forsterite ceramics for millimeterwave dielectrics, J. Electroceram., 2006, 17, 445–450 CrossRef CAS
 .
.
- T. Joseph and M. T. Sebastian, Microwave Dielectric Properties of (Sr1−xAx)2(Zn1−xBx)Si2O7 Ceramics (A=Ca, Ba and B=Co, Mg, Mn, Ni), J. Am. Ceram. Soc., 2010, 93, 147–154 CrossRef CAS
 .
.
- M. Xiao, Y. Wei, H. Sun, J. Lou and P. Zhang, Crystal structure and microwave dielectric properties of low-permittivity Sr2MgSi2O7 ceramic, J. Mater. Sci.: Mater. Electron., 2018, 29, 20339–20346 CrossRef CAS
 .
.
- T. Endo, Y. Doi, M. Wakeshima and Y. Hinatsu, Crystal Structures and Magnetic Properties of New Europium Melilites Eu2MSi2O7 (M=Mg, Mn) and Their Strontium Analogues, Inorg. Chem., 2010, 49, 10809–10814 CrossRef CAS
 .
.
- B. E. Warren and O. R. Trautz, The structure of hardystonite Ca2ZnSi2O7, Z. Kristallogr., 1930, 75, 525–528 CAS
 .
.
- M. Xiao, Y. Wei and P. Zhang, The Correlations between Complex Chemical Bond Theory and Microwave Dielectric Properties of Ca2MgSi2O7 Ceramics, J. Electron. Mater., 2019, 48, 1652–1659 CrossRef CAS
 .
.
- J. Hanuza, M. Ptak, M. Mączka, K. Hermanowicz, J. Lorenc and A. A. Kaminskii, Polarized IR and Raman spectra of Ca2MgSi2O7, Ca2ZnSi2O7 and Sr2MgSi2O7 single crystals: Temperature-dependent studies of commensurate to incommensurate and incommensurate to normal phase transitions, J. Solid State Chem., 2012, 191, 90–101 CrossRef CAS
 .
.
- X. Q. Song, W. Lei, M. Q. Xie, J. Li, X. C. Wang and W. Z. Lu, Sintering behaviour, lattice energy and microwave dielectric properties of melilite-type BaCo2Si2O7 ceramics, Mater. Res. Express, 2020, 6, 126322 CrossRef
 .
.
- J. W. Kaiser and W. Jeitschko, Crystal structure of the new barium zinc silicate Ba2ZnSi2O7, Z. Kristallogr. - New Cryst. Struct., 2002, 217, 25–26 CAS
 .
.
- R. Shannon, Revised effective ionic radii and systematic studies of interatomic distances in halides and chalcogenides, Acta Crystallogr., Sect. A: Cryst. Phys., Diffr., Theor. Gen. Crystallogr., 1976, 32, 751–767 CrossRef
 .
.
- H. Zhou, X. Tan, J. Huang, N. Wang, G. Fan and X. Chen, Phase structure, sintering behavior and adjustable microwave dielectric properties of Mg1−x,Li2xTixO1+2x solid solution ceramics, J. Alloys Compd., 2017, 696, 1255–1259 CrossRef CAS
 .
.
- H. Zhou, X. Tan, J. Huang and X. Chen, Sintering behavior, phase evolution and microwave dielectric properties of thermally stable Li2O-3MgO-mTiO2 ceramics (1 ≤ m≤6), Ceram. Int., 2017, 43, 3688–3692 CrossRef CAS
 .
.
- J. X. Bi, C. C. Li, Y. H. Zhang, C. F. Xing, C. H. Yang and H. T. Wu, Crystal structure, infrared spectra and microwave dielectric properties of ultra low-loss Li2Mg4TiO7 ceramics, Mater. Lett., 2017, 196, 128–131 CrossRef CAS
 .
.
- P. Zhang, M. Yang and M. Xiao, Sintering behavior, crystalline structure and microwave dielectric properties of Li2(Ni1−xMgx)3TiO6 (0 ≤ x ≤ 1) ceramics, Ceram. Int., 2018, 44, 21607–21612 CrossRef CAS
 .
.
- J. Bi, Y. Niu and H. Wu, Li4Mg3Ti2O9: A novel low-loss microwave dielectric ceramic for LTCC applications, Ceram. Int., 2017, 43, 7522–7530 CrossRef CAS
 .
.
- H. L. Pan, C. F. Xing, X. S. Jiang and H. T. Wu, Characterization on low loss dielectric Li2MgTiO4 ceramics based on chemical bond theory at microwave frequency, J. Alloys Compd., 2016, 688, 416–421 CrossRef CAS
 .
.
- Z. Fu, P. Liu, J. Ma, X. Zhao and H. Zhang, Novel series of ultra-low loss microwave dielectric ceramics: Li2Mg3BO6 (B=Ti, Sn, Zr), J. Eur. Ceram. Soc., 2016, 36, 625–629 CrossRef CAS
 .
.
- Z. Fang, B. Tang, F. Si, E. Li, H. Yang and S. Zhang, Phase evolution, structure and microwave dielectric properties of Li2+x,Mg3SnO6 (x=0.00–0.12) ceramics, Ceram. Int., 2017, 43, 13645–13652 CrossRef CAS
 .
.
- H. Wu and E. S. Kim, Correlations between crystal structure and dielectric properties of high-Q materials in rock-salt structure Li2O–MgO–BO2 (B=Ti, Sn, Zr) systems at microwave frequency, RSC Adv., 2016, 6, 47443–47453 RSC
 .
.
- J. Song, J. Zhang and R. Zuo, Ultrahigh Q values and atmosphere-controlled sintering of Li2(1+x)Mg3ZrO6 microwave dielectric ceramics, Ceram. Int., 2017, 43, 2246–2251 CrossRef CAS
 .
.
- Z. Fang, B. Tang, Y. Yuan, X. Zhang and S. Zhang, Structure and microwave dielectric properties of the Li2/3(1−x)Sn1/3(1−x)MgxO systems (x=0-4/7), J. Am. Ceram. Soc., 2018, 101, 252–264 CrossRef CAS
 .
.
- H. L. Pan, L. Cheng and H. T. Wu, Relationships between crystal structure and microwave dielectric properties of Li2(Mg1−xCox)3TiO6 (0 ≤ x ≤ 0.4) ceramics, Ceram. Int., 2017, 43, 15018–15026 CrossRef CAS
 .
.
- X. Shi, H. Zhang, D. Zhang, F. Xu, Y. Zheng, G. Wang, C. Liu, L. Jin, J. Li and L. Jia, Correlation between structure characteristics and dielectric properties of Li2Mg3−xCuxTiO6 ceramics based on complex chemical bond theory, Ceram. Int., 2019, 45, 23509–23514 CrossRef CAS
 .
.
- E. S. Kim, B. S. Chun, R. Freer and R. J. Cernik, Effects of packing fraction and bond valence on microwave dielectric properties of A2+B6+O4 (A2+: Ca, Pb, Ba; B6+: Mo, W) ceramics, J. Eur. Ceram. Soc., 2010, 30, 1731–1736 CrossRef CAS
 .
.
- C. H. Yang, H. L. Pan, Y. K. Yang and H. T. Wu, Influence of Zn substitution on the crystal structures and microwave dielectric properties of Li2(Mg1−xZnx)3TiO6 (0 ≤ x≤0.2) ceramics, J. Alloys Compd., 2018, 764, 424–430 CrossRef CAS
 .
.
- Z. Fang, B. Tang, F. Si and S. Zhang, Temperature stable and high-Q microwave dielectric ceramics in the Li2Mg3−xCaxTiO6 system (x=0.00–0.18), Ceram. Int., 2017, 43, 1682–1687 CrossRef CAS
 .
.
- X. Shi, H. Zhang, D. Zhang, C. Liu, L. Shi and X. Wang, Structural characteristics and dielectric properties of Ti4+-substituted Li2Mg3SnO6 ceramics, Ceram. Int., 2020, 46, 16038–16046 CrossRef CAS
 .
.
- C. H. Yang, H. L. Pan, Y. K. Yang and H. T. Wu, Effects of Ti-substitution on the crystal structures, micro-structures and microwave dielectric properties of Li2Mg3Zr1−xTixO6 (0 ≤ x ≤ 1) ceramics, Ceram. Int., 2018, 44, 5155–5162 CrossRef CAS
 .
.
- H. L. Pan, Y. X. Mao, Y. K. Yang, Y. W. Zhang and H. T. Wu, Crystal structure, Raman spectra, infrared spectra and microwave dielectric properties of Li2Mg3Ti1−x(Mg1/3Ta2/3)xO6 (0 ≤ x ≤ 0.2) solid solution ceramics, Mater. Res. Bull., 2018, 105, 296–305 CrossRef CAS
 .
.
- H. L. Pan, Y. W. Zhang and H. T. Wu, Crystal structure, infrared spectroscopy and microwave dielectric properties of ultra low-loss Li2Mg3Ti0.95(Mg1/3Sb2/3)0.05O6 ceramic, Ceram. Int., 2018, 44, 3464–3468 CrossRef CAS
 .
.
- Y. K. Yang, H. L. Pan and H. T. Wu, Crystal structure, Raman spectra and microwave dielectric properties of Li2Mg3Ti1−x(Mg1/3Nb2/3)xO6 (0 ≤x ≤ 0.25) ceramics, Ceram. Int., 2018, 44, 11350–11356 CrossRef CAS
 .
.
- H. Xiang, C. Li, C. Yin, Y. Tang and L. Fang, A reduced sintering temperature and improvement in the microwave dielectric properties of Li2Mg3TiO6 through Ge substitution, Ceram. Int., 2018, 44, 5817–5821 CrossRef CAS
 .
.
- H. Wu and E. S. Kim, Characterization of low loss microwave dielectric materials Li3Mg2NbO6 based on the chemical bond theory, J. Alloys Compd., 2016, 669, 134–140 CrossRef CAS
 .
.
- S. S. Batsanov, Dielectric methods of studying the chemical bond and the concept of electronegativity, Russ. Chem. Rev., 1982, 51, 684–697 CrossRef
 .
.
- P. Zhang, K. Sun, X. Mao, M. Xiao and Z. Zheng, Crystal structures and high microwave dielectric properties in Li+/Ti4+ ions co-doped Li3Mg2NbO6 ceramics, Ceram. Int., 2020, 46, 8097–8103 CrossRef CAS
 .
.
- P. Zhang, L. Liu, M. Xiao and Y. Zhao, A novel temperature stable and high Q microwave dielectric ceramic in Li3(Mg1−xMnx)2NbO6 system, J. Mater. Sci.: Mater. Electron., 2017, 28, 12220–12225 CrossRef CAS
 .
.
- P. Zhang, K. Sun, L. Liu and M. Xiao, A novel low loss and low temperature sintering Li3(Mg1−xCax)2NbO6 microwave dielectric ceramics by doping LiF additives, J. Alloys Compd., 2018, 765, 1209–1217 CrossRef CAS
 .
.
- T. Zhang and R. Zuo, Effect of Li2O–V2O5 addition on the sintering behavior and microwave dielectric properties of Li3(Mg1−xZnx)2NbO6 ceramics, Ceram. Int., 2014, 40, 15677–15684 CrossRef CAS
 .
.
- H. L. Pan, Y. X. Mao, L. Cheng and H. T. Wu, New Li3Ni2NbO6 microwave dielectric ceramics with the orthorhombic structure for LTCC applications, J. Alloys Compd., 2017, 723, 667–674 CrossRef CAS
 .
.
- C. F. Xing, J. X. Bi and H. T. Wu, Effect of Co-substitution on microwave dielectric properties of Li3(Mg1−xCox)2NbO6 (0.00 ≤ x ≤ 0.10) ceramics, J. Alloys Compd., 2017, 719, 58–62 CrossRef CAS
 .
.
- X. Zhang, B. Tang, Z. Fang, H. Yang, Z. Xiong, L. Xue and S. Zhang, Structural evolution and microwave dielectric properties of a novel Li3Mg2−x/3Nb1–2x/3TixO6 system with a rock salt structure, Inorg. Chem. Front., 2018, 5, 3113–3125 RSC
 .
.
- G. Wang, H. Zhang, X. Huang, F. Xu, G. Gan, Y. Yang, D. Wen, J. Li, C. Liu and L. Jin, Correlations between the structural characteristics and enhanced microwave dielectric properties of V–modified Li3Mg2NbO6 ceramics, Ceram. Int., 2018, 44, 19295–19300 CrossRef CAS
 .
.
- P. Zhang, S. Wu and M. Xiao, Effect of Sb5+ ion substitution for Nb5+ on crystal structure and microwave dielectric properties for Li3Mg2NbO6 ceramics, J. Alloys Compd., 2018, 766, 498–505 CrossRef CAS
 .
.
- C. Pei, C. Hou, Y. Li, G. Yao, Z. Ren, P. Liu and H. Zhang, A low εr and temperature-stable Li3Mg2SbO6 microwave dielectric ceramics, J. Alloys Compd., 2019, 792, 46–49 CrossRef CAS
 .
.
- G. Wang, D. Zhang, X. Huang, Y. Rao, Y. Yang, G. Gan, Y. Lai, F. Xu, J. Li, Y. Liao, C. Liu, L. Jin, V. G. Harris and H. Zhang, Crystal structure and enhanced microwave dielectric properties of Ta5+ substituted Li3Mg2NbO6 ceramics, J. Am. Ceram. Soc., 2020, 103, 214–223 CrossRef CAS
 .
.
- P. Zhang, M. Hao, X. Mao, K. Sun and M. Xiao, Effects of W6+ substitution on crystal structure and microwave dielectric properties of Li3Mg2NbO6 ceramics, Ceram. Int., 2020, 46, 21336–21342 CrossRef CAS
 .
.
- G. Wang, D. Zhang, J. Li, G. Gan, Y. Rao, X. Huang, Y. Yang, L. Shi, Y. Liao, C. Liu, L. Jin and H. Zhang, Crystal structure, bond energy, Raman spectra, and microwave dielectric properties of Ti-doped Li3Mg2NbO6 ceramics, J. Am. Ceram. Soc., 2020, 103, 4321–4332 CrossRef CAS
 .
.
- H. Li, P. Zhang, X. Chen, B. Tang, S. Yu, J. Lu and S. Zhang, Effect of Zn2+ substitution for Mg2+ in Li3Mg2SbO6 and the impact on the bond characteristics and microwave dielectric properties, J. Alloys Compd., 2020, 832, 155043 CrossRef CAS
 .
.
- P. Rodríguez-Hernández, J. López-Solano, S. Radescu, A. Mujica, A. Muñoz, D. Errandonea, J. Pellicer-Porres, A. Segura, C. Ferrer-Roca, F. J. Manjón, R. S. Kumar, O. Tschauner and G. Aquilanti, Theoretical and experimental study of CaWO4 and SrWO4 under pressure, J. Phys. Chem. Solids, 2006, 67, 2164–2171 CrossRef
 .
.
- Z. X. Shao, Q. R. Zhang, T. Y. Liu and J. Y. Chen, First-principles study on electronic structures and absorption bands of CaWO4 crystals with interstitial oxygen atoms, Phys. Status Solidi A, 2007, 204, 3159–3164 CrossRef CAS
 .
.
- L. Gracia, V. M. Longo, L. S. Cavalcante, A. Beltrán, W. Avansi, M. S. Li, V. R. Mastelaro, J. A. Varela, E. Longo and J. Andrés, Presence of excited electronic state in CaWO4 crystals provoked by a tetrahedral distortion: An experimental and theoretical investigation, J. Appl. Phys., 2011, 110, 043501 CrossRef
 .
.
- M. Xiao, H. Sun, Z. Zhou and P. Zhang, Bond ionicity, lattice energy, bond energy, and microwave dielectric properties of Ca1−xSrxWO4 ceramics, Ceram. Int., 2018, 44, 20686–20691 CrossRef CAS
 .
.
- M. T. Sebastian, H. Wang and H. Jantunen, Low temperature co-fired ceramics with ultra-low sintering temperature: A review, Curr. Opin. Solid State Mater. Sci., 2016, 20, 151–170 CrossRef CAS
 .
.
- H. Yang, E. Li, Y. Yang, Y. Shi, H. He and S. Zhang, Co2O3 substitution effects on the structure and microwave dielectric properties of low-firing (Zn0.9Mg0.1)TiO3 ceramics, Ceram. Int., 2018, 44, 5010–5016 CrossRef CAS
 .
.
- Y. Chen, E. Li, S. Duan and S. Zhang, Low Temperature Sintering Kinetics and Microwave Dielectric Properties of BaTi5O11 Ceramic, ACS Sustainable Chem. Eng., 2017, 5, 10606–10613 CrossRef CAS
 .
.
- H. H. Guo, D. Zhou, C. Du, P. J. Wang, W. F. Liu, L. X. Pang, Q. P. Wang, J. Z. Su, C. Singh and S. Trukhanov, Temperature stable Li2Ti0.75(Mg1/3Nb2/3)0.25O3-based microwave dielectric ceramics with low sintering temperature and ultra-low dielectric loss for dielectric resonator antenna applications, J. Mater. Chem. C, 2020, 8, 4690–4700 RSC
 .
.
- D. Zhou, J. Li, L. X. Pang, D.-W. Wang and I. M. Reaney, Novel water insoluble (Nax,Ag2−x)MoO4 (0 ≤ x ≤ 2) microwave dielectric ceramics with spinel structure sintered at 410 degrees, J. Mater. Chem. C, 2017, 5, 6086–6091 RSC
 .
.
- H. H. Guo, D. Zhou, W. F. Liu, L. X. Pang, D. W. Wang, J. Z. Su and Z. M. Qi, Microwave dielectric properties of temperature-stable zircon-type (Bi, Ce)VO4 solid solution ceramics, J. Am. Ceram. Soc., 2020, 103, 423–431 CrossRef CAS
 .
.
- L. X. Pang, W. G. Liu, D. Zhou and Z. X. Yue, Novel glass-free low-temperature fired microwave dielectric ceramics: Bi(Ga1/3Mo2/3)O4, Ceram. Int., 2016, 42, 4574–4577 CrossRef CAS
 .
.
- H. H. Xi, D. Zhou, H. D. Xie, B. He and Q. P. Wang, Raman Spectra, Infrared Spectra, and Microwave Dielectric Properties of Low-Temperature Firing [(Li0.5Ln0.5)1−xCax]MoO4 (Ln=Sm and Nd) Solid Solution Ceramics with Scheelite Structure, J. Am. Ceram. Soc., 2015, 98, 587–593 CrossRef CAS
 .
.
- H. H. Guo, D. Zhou, L. X. Pang and Z. M. Qi, Microwave dielectric properties of low firing temperature stable scheelite structured (Ca,Bi)(Mo,V)O4 solid solution ceramics for LTCC applications, J. Eur. Ceram. Soc., 2019, 39, 2365–2373 CrossRef CAS
 .
.
- D. Thomas and M. T. Sebastian, Temperature-Compensated LiMgPO4: A New Glass-Free Low-Temperature Cofired Ceramic, J. Am. Ceram. Soc., 2010, 93, 3828–3831 CrossRef CAS
 .
.
- P. Zhang, S. Wu and M. Xiao, The microwave dielectric properties and crystal structure of low temperature sintering LiNiPO4 ceramics, J. Eur. Ceram. Soc., 2018, 38, 4433–4439 CrossRef CAS
 .
.
- X. Hu, Z. Cheng, Y. Li and Z. Ling, Dielectric relaxation and microwave dielectric properties of low temperature sintering LiMnPO4 ceramics, J. Alloys Compd., 2015, 651, 290–293 CrossRef CAS
 .
.
- I. Abrahams and K. S. Easson, Structure of lithium nickel phosphate, Acta Crystallogr., Sect. C: Cryst. Struct. Commun., 1993, 49, 925–926 CrossRef
 .
.
- E. C. Xiao, Z. Cao, J. Li, X. H. Li, M. Liu, Z. Yue, Y. Chen, G. Chen, K. Song, H. Zhou and F. Shi, Crystal structure, dielectric properties, and lattice vibrational characteristics of LiNiPO4 ceramics sintered at different temperatures, J. Am. Ceram. Soc., 2020, 103, 2528–2539 CrossRef CAS
 .
.
- D. Wang, D. Zhou, S. Zhang, Y. Vardaxoglou, W. G. Whittow, D. Cadman and I. M. Reaney, Cold-Sintered Temperature Stable Na0.5Bi0.5MoO4−Li2MoO4 Microwave Composite Ceramics, ACS Sustainable Chem. Eng., 2018, 6, 2438–2444 CrossRef CAS
 .
.
- D. Zhou, L. X. Pang, D. W. Wang, H. H. Guo, F. Yang, Z. M. Qi, C. Li, B. B. Jin and I. M. Reaney, Crystal structure, impedance and broadband dielectric spectra of ordered scheelite-structured Bi(Sc1/3Mo2/3)O4 ceramic, J. Eur. Ceram. Soc., 2018, 38, 1556–1561 CrossRef CAS
 .
.
- L. X. Pang, D. Zhou, Z. M. Qi and Z. X. Yue, Influence of W substitution on crystal structure, phase evolution and microwave dielectric properties of (Na0.5Bi0.5)MoO4 ceramics with low sintering temperature, Sci. Rep., 2017, 7, 3201 CrossRef
 .
.
- D. Zhou, H. Wang, L.-X. Pang, C. A. Randall and X. Yao, Bi2O3−MoO3 Binary System: An Alternative Ultralow Sintering Temperature Microwave Dielectric, J. Am. Ceram. Soc., 2009, 92, 2242–2246 CrossRef CAS
 .
.
- H. Yang, S. Zhang, H. Yang, Y. Yuan and E. Li, Gd2Zr3(MoO4)9 microwave dielectric ceramics with trigonal structure for LTCC application, J. Am. Ceram. Soc., 2020, 103, 1131–1139 CrossRef CAS
 .
.
- B. J. Tao, C. F. Xing, W. F. Wang, H. T. Wu and Y. Y. Zhou, A novel Ce2Zr3(MoO4)9 microwave dielectric ceramic with ultra-low firing temperature, Ceram. Int., 2019, 45, 24675–24683 CrossRef CAS
 .
.
- Y. Zhang and H. Wu, Crystal structure and microwave dielectric properties of La2(Zr1−xTix)3(MoO4)9 (0 ≤ x ≤ 0.1) ceramics, J. Am. Ceram. Soc., 2019, 102, 4092–4102 CrossRef CAS
 .
.
- Y. H. Zhang, J. J. Sun, N. Dai, Z. C. Wu, H. T. Wu and C. H. Yang, Crystal structure, infrared spectra and microwave dielectric properties of novel extra low-temperature fired Eu2Zr3(MoO4)9 ceramics, J. Eur. Ceram. Soc., 2019, 39, 1127–1131 CrossRef CAS
 .
.
- C. F. Xing, B. Wu, J. Bao, H. T. Wu and Y. Y. Zhou, Crystal structure, infrared spectra and microwave dielectric properties of a novel low-firing Gd2Zr3(MoO4)9 ceramic, Ceram. Int., 2019, 45, 22207–22214 CrossRef CAS
 .
.
- L. Shi, C. Liu, H. Zhang, R. Peng, G. Wang, X. Shi, X. Wang and W. Wang, Crystal structure, Raman spectroscopy, metal compatibility and microwave dielectric properties of Ce2Zr3(MoO4)9 ceramics, Mater. Chem. Phys., 2020, 250, 122954 CrossRef CAS
 .
.
- C. Xing, Y. Zhang, B. Tao, H. Wu and Y. Zhou, Crystal structure, infrared spectra and microwave dielectric properties of low-firing La2Zr3(MoO4)9 ceramics prepared by reaction-sintering process, Ceram. Int., 2019, 45, 22376–22382 CrossRef CAS
 .
.
- H. Tian, X. Liu, Y. Yang, H. Wu and Z. Zhang, Crystal Structure, Infrared Spectra, and Microwave Dielectric Properties of Ce2(Zr0.94Sn0.06)3(MoO4)9 Ceramics With Low Sintering Temperature, Front. Mater., 2020, 7, 145 CrossRef
 .
.
- H. Li, P. Zhang, S. Yu, H. Yang, B. Tang, F. Li and S. Zhang, Structural dependence of microwave dielectric properties of spinel structured Mg2(Ti1−xSnx)O4 solid solutions: Crystal structure refinement, Raman spectra study and complex chemical bond theory, Ceram. Int., 2019, 45, 11639–11647 CrossRef CAS
 .
.
- H. J. Jo, J. S. Kim and E. S. Kim, Microwave dielectric properties of MgTiO3-based ceramics, Ceram. Int., 2015, 41, S530–S536 CrossRef CAS
 .
.
- H. Li, R. Xiang, X. Chen, H. Hua, S. Yu, B. Tang, G. Chen and S. Zhang, Intrinsic dielectric behavior of Mg2TiO4 spinel ceramic, Ceram. Int., 2020, 46, 4235–4239 CrossRef CAS
 .
.
- J. Zheng, Y. Yang, H. Wu, Y. Zhou and Z. Zhang, Structure, infrared spectra and microwave dielectric properties of the novel Eu2TiO5 ceramics, J. Am. Ceram. Soc., 2020, 103, 4333–4341 CrossRef CAS
 .
.
- W. G. Mumme and A. D. Wadsley, The structure of orthorhombic Y2TiO5, an example of mixed seven- and fivefold coordination, Acta Crystallogr., Sect. B: Struct. Sci., 1968, 24, 1327–1333 CrossRef CAS
 .
.
- H. Niu, H. Gou, R. C. Ewing and J. Lian, First Principles Investigation of Structural, Elstic and Electronic Properties of Lanthanide Titanate Oxides Ln2TiO5, MRS Online Proc. Libr., 2011, 1298, 85–90 Search PubMed
 .
.
- W. I. F. David, The high-temperature paraelastic structure of LaNbO4, Mater. Res. Bull., 1983, 18, 749–756 CrossRef CAS
 .
.
- K. Hadidi, R. Hancke, T. Norby, A. E. Gunnæs and O. M. Løvvik, Atomistic study of LaNbO4; surface properties and hydrogen adsorption, Int. J. Hydrogen Energy, 2012, 37, 6674–6685 CrossRef CAS
 .
.
- B. Ma, B. Chi, J. Pu and L. Jian, LaNbO4 toughened NiO–Y2O3 stabilized ZrO2 composite for the anode support of planar solid oxide fuel cells, Int. J. Hydrogen Energy, 2013, 38, 4776–4781 CrossRef CAS
 .
.
- G. Canu, V. Buscaglia, C. Ferrara, P. Mustarelli, S. Gonçalves Patrício, A. I. Batista Rondão, C. Tealdi and F. M. B. Marques, Oxygen transport and chemical compatibility with electrode materials in scheelite-type LaWx,Nb1−xO4+x/2 ceramic electrolyte, J. Alloys Compd., 2017, 697, 392–400 CrossRef CAS
 .
.
- P. Sarin, R. W. Hughes, D. R. Lowry, Z. D. Apostolov and W. M. Kriven, High-Temperature Properties and Ferroelastic Phase Transitions in Rare-Earth Niobates (LnNbO4), J. Am. Ceram. Soc., 2014, 97, 3307–3319 CrossRef CAS
 .
.
- M. Xiao, P. Zhang, J. Lou, Y. Wei and P. Zhang, Combined synthesis methods for producing LaNbO4 ceramics and investigation of microwave dielectric properties based on complex chemical bond theory, J. Alloys Compd., 2020, 812, 152154 CrossRef CAS
 .
.
- M. Xiao, Q. Gu, Z. Zhou and P. Zhang, Study of the microwave dielectric properties of (La1−xSmx)NbO4 (x=0-0.10) ceramics via bond valence and packing fraction, J. Am. Ceram. Soc., 2017, 100, 3952–3960 CrossRef CAS
 .
.
- P. Zhang, Y. Zhao and L. Li, The correlations among bond ionicity, lattice energy and microwave dielectric properties of (Nd1−xLax)NbO4 ceramics, Phys. Chem. Chem. Phys., 2015, 17, 16692–16698 RSC
 .
.
- P. Zhang and Y. Zhao, Influence of Sm3+ substitutions for Nd3+ on the microwave dielectric properties of (Nd1−xSmx)NbO4 (x=0.02–0.15) ceramics, J. Alloys Compd., 2016, 654, 240–245 CrossRef CAS
 .
.
- S. D. Ramarao and V. R. K. Murthy, Structural phase transformation and microwave dielectric studies of SmNb1−x(Si1/2Mo1/2)xO4 compounds with fergusonite structure, Phys. Chem. Chem. Phys., 2015, 17, 12623–12633 RSC
 .
.
- D. Guo, D. Zhou, W. B. Li, L. X. Pang, Y. Z. Dai and Z.-M. Qi, Phase Evolution, Crystal Structure, and Microwave Dielectric Properties of Water-Insoluble (1-x)LaNbO4-xLaVO4 (0 ≤ x ≤ 0.9) Ceramics, Inorg. Chem., 2017, 56, 9321–9329 CrossRef CAS
 .
.
- M. Xiao, Y. Wei, Q. Gu, Z. Zhou and P. Zhang, Relationships between bond ionicity, lattice energy, bond energy and the microwave dielectric properties of La(Nb1−xTax)O4 (x=0–0.10) ceramics, J. Alloys Compd., 2019, 775, 168–174 CrossRef CAS
 .
.
- H. Yang, S. Zhang, H. Yang, Y. Yuan and E. Li, Influence of (Al1/3W2/3)5+ co-substitution for Nb5+ in NdNbO4 and the impact on the crystal structure and microwave dielectric properties, Dalton Trans., 2018, 47, 15808–15815 RSC
 .
.
- H. Yang, S. Zhang, H. Yang, Y. Yuan and E. Li, NdNb1−x(Mg1/4W3/4)xO4 (0.02 ≤ x ≤ 0.06) solid solution characterized by infrared spectrum and complex chemical theory, J. Alloys Compd., 2019, 787, 358–366 CrossRef CAS
 .
.
- H. Yang, S. Zhang, H. Yang, Y. Yuan and E. Li, Structure stability, bond characteristics and microwave dielectric properties of co-substituted NdNbO4 ceramics, Ceram. Int., 2019, 45, 3620–3626 CrossRef CAS
 .
.
- P. P. Ma, H. Gu and X. M. Chen, Evaluation of the 1
![[thin space (1/6-em)]](https://www.rsc.org/images/entities/char_2009.gif) :
:![[thin space (1/6-em)]](https://www.rsc.org/images/entities/char_2009.gif) 2 ordered structure of Ba(B′1/3B′′2/3)O3 perovskites along various zone axes using transmission electron microscopy, J. Mater. Chem. C, 2015, 3, 10755–10760 RSC
2 ordered structure of Ba(B′1/3B′′2/3)O3 perovskites along various zone axes using transmission electron microscopy, J. Mater. Chem. C, 2015, 3, 10755–10760 RSC  .
.
- C. H. Wang, X. P. Jing, L. Wang and J. Lu, XRD and Raman studies on the ordering/disordering of Ba(Mg1/3Ta2/3)O3, J. Am. Ceram. Soc., 2009, 92, 1547–1551 CrossRef CAS
 .
.
- C. H. Wang, G. H. Liu, X. P. Jing, G. S. Tian, X. Lu and J. Shao, First-Principle Calculation and Far Infrared Measurement for Infrared-Active Modes of Ba(Mg1/3Ta2/3)O3, J. Am. Ceram. Soc., 2010, 93, 3782–3787 CrossRef CAS
 .
.
- C. L. Diao, C. H. Wang, N. N. Luo, Z. M. Qi, T. Shao, Y. Y. Wang, J. Lu, Q. C. Wang, X. J. Kuang and L. Fang, First-principle calculation and assignment for vibrational spectra of Ba (Mg1/3Nb2/3)O3 microwave dielectric ceramic, J. Appl. Phys., 2014, 115, 114103–114112 CrossRef
 .
.
- C. L. Diao, C. H. Wang, N. N. Luo, Z. M. Qi, T. Shao, Y. Y. Wang, J. Lu, F. Shi and X. P. Jing, First-Principle Calculation and Assignment for Vibrational Spectra of Ba(Mg1/2W1/2)O3 Microwave Dielectric Ceramic, J. Am. Ceram. Soc., 2013, 96, 2898–2905 CrossRef CAS
 .
.
- V. Filip'ev, G. Shatalova and E. Fesenko, Determination of bond lengths in tungstates with Perovskite-type structure, Kristallografiya, 1974, 19, 386–387 Search PubMed
 .
.
- H. Yang, S. Zhang, Y. Li, H. Yang, Y. Yuan, T. Wen and E. Li, Investigations of dielectric properties of wolframite A0.5Zr0.5NbO4 ceramics by bond theory and far-infrared spectroscopy, Ceram. Int., 2020, 46, 3688–3694 CrossRef CAS
 .
.
- M. Xiao, P. Zhang, H. Sun, Z. Zhou and P. Zhang, Influence of Ni2+ Substitution for Zn2+ on Microwave Dielectric Properties of Zn1−xNixZrNb2O8 Ceramics, J. Electron. Mater., 2019, 48, 6553–6560 CrossRef CAS
 .
.
- M. Xiao, S. He, J. Lou and P. Zhang, Influence of Ge4+ substitution for Zr4+ on the microwave dielectric properties of Mg(Zr1−xGex)Nb2O8 (0 ≤x ≤ 0.4) ceramics, Ceram. Int., 2018, 44, 21585–21590 CrossRef CAS
 .
.
- P. Zhang, Y. Zhao and W. Haitao, Bond ionicity, lattice energy, bond energy and microwave dielectric properties of ZnZr(Nb1−xAx)2O8 (A=Ta, Sb) ceramics, Dalton Trans., 2015, 44, 16684–16693 RSC
 .
.
- H. L. Pan, Q. Q. Liu, Y. H. Zhang and H. T. Wu, Crystal structure and microwave dielectric characteristics of Co-substituted Zn1−xCoxZrNb2O8 (0 ≤ x ≤ 0.1) ceramics, RSC Adv., 2016, 6, 86889–86903 RSC
 .
.
- H. Wu and E. S. Kim, Characterization of crystal structure and microwave dielectric properties of AZrNb2O8 (A=Zn, Co, Mg, Mn) ceramics based on complex bond theory, Ceram. Int., 2016, 42, 5785–5791 CrossRef CAS
 .
.
- M. Xiao, J. Lou and P. Zhang, Characteristics and microwave dielectric properties of low loss MgZr0.85Sn0.15Nb2O8 ceramics, J. Mater. Sci.: Mater. Electron., 2018, 29, 18311–18319 CrossRef CAS
 .
.
- M. Xiao, J. Lou, Z. Zhou, Q. Gu, Y. Wei and P. Zhang, Crystal structure and microwave dielectric properties of Ta5+ substituted MgZrNb2O8 ceramics, Ceram. Int., 2017, 43, 15567–15572 CrossRef CAS
 .
.
- M. Xiao, S. He, J. Meng and P. Zhang, Dependence of microwave dielectric properties on the substitution of isovalent composite ion for Nb-site of MgZrNb2−x(Sn1/2W1/2)xO8 (0 ≤ x ≤ 0.15) ceramics, J. Mater. Sci.: Mater. Electron., 2019, 30, 18280–18286 CrossRef CAS
 .
.
- A. Baumgarte and R. Blachnik, Phase relations in the system titaniumdioxide-diniobium-zinc-hexoxide, Mater. Res. Bull., 1992, 27, 1287–1294 CrossRef CAS
 .
.
- E. S. Kim and H. K. Dong, Relationships between crystal structure and microwave dielectric properties of (Zn1/3B2/35+)x,Ti1−xO2 (B5+=Nb, Ta) ceramics, Ceram. Int., 2008, 34, 883–888 CrossRef CAS
 .
.
- H. Yang, S. Zhang, H. Yang, X. Zhang and E. Li, Structural Evolution and Microwave Dielectric Properties of x,Zn0.5Ti0.5NbO4-(1−x)Zn0.15Nb0.3Ti0.55O2 Ceramics, Inorg. Chem., 2018, 57, 8264–8275 CrossRef CAS
 .
.
- H. Yang, S. Zhang, H. Yang, Y. Yuan and E. Li, Intrinsic dielectric properties of columbite ZnNb2O6 ceramics studied by P–V–L bond theory and Infrared spectroscopy, J. Am. Ceram. Soc., 2019, 10, 5365–5374 CrossRef
 .
.
- Q. Liao, L. Li, X. Ding and X. Ren, A New Temperature Stable Microwave Dielectric Material Mg0.5Zn0.5TiNb2O8, J. Am. Ceram. Soc., 2012, 95, 1501–1503 CrossRef CAS
 .
.
- H. Yang, E. Li, S. Duan, H. He and S. Zhang, Structure, microwave properties and low temperature sintering of Ta2O5 and Co2O3 codoped Zn0.5Ti0.5NbO4 ceramics, Mater. Chem. Phys., 2017, 199, 43–53 CrossRef CAS
 .
.
- L. Li, H. Cai, X. Yu, Q. Liao and Z. Gao, Structure analysis and microwave dielectric properties of Cax,Zn1−xSn0.08Ti1.92Nb2O10 ceramics, J. Alloys Compd., 2014, 584, 315–321 CrossRef CAS
 .
.
- T. Chen, W. Ma, Q. Sun, C. Tang, Z. Huan and B. Niu, The microwave dielectric properties of (Ni, Zn)0.5Ti0.5NbO4 solid solution, Mater. Lett., 2013, 113, 111–113 CrossRef CAS
 .
.
- Q. Yang, E. Li, H. Yang, H. Yang, Q. Wen, Y. Yuan and S. Zhang, Influence of Zn0.5Ti0.5NbO4 on the structure and microwave dielectric properties of ZrTiO4 ceramics, Ceram. Int., 2020, 46, 4543–4549 CrossRef CAS
 .
.
- H. Yang, S. Zhang, H. Yang, Y. Chen, Y. Yuan and E. Li, Effects of ZrO2 substitution on crystal structure and microwave dielectric properties of Zn0.15Nb0.3(Ti1−xZrx)0.55O2 ceramics, Ceram. Int., 2018, 44, 22710–22717 CrossRef CAS
 .
.
- Y. Chen, S. Zhang, H. Yang, H. Yang, Y. Yuan and E. Li, Bond ionicity, lattice energy and structural evolution of Ta substituted 0.15ZnO-0.15Nb2O5-0.55TiO2 dielectric ceramics, Ceram. Int., 2019, 45, 8832–8839 CrossRef CAS
 .
.
- W. Luo, L. Li, S. Yu, J. Li, B. Zhang, J. Qiao and S. Chen, Bond theory, terahertz spectra, and dielectric studies in donor-acceptor (Nb-Al) substituted ZnTiNb2O8 system, J. Am. Ceram. Soc., 2019, 102, 4612–4620 CrossRef CAS
 .
.
- S. Wang and Y. Zhang, Structure, bond characteristics and microwave
dielectric properties of new A0.75Ti0.75Ta1.5O6 (A=Ni, Co, Zn and Mg) ceramics based on complex chemical bond theory, J. Eur. Ceram. Soc., 2020, 40, 1181–1185 CrossRef CAS
 .
.
- H. Yang, S. Zhang, Y. Chen, H. Yang, Y. Yuan and E. Li, Crystal Chemistry, Raman Spectra, and Bond Characteristics of Trirutile-Type Co0.5Ti0.5TaO4 Microwave Dielectric Ceramics, Inorg. Chem., 2019, 58, 968–976 CrossRef CAS
 .
.
Footnote |
| † Electronic supplementary information (ESI) available. See DOI: 10.1039/d0qi00907e |
|
| This journal is © the Partner Organisations 2020 |
Click here to see how this site uses Cookies. View our privacy policy here.  *b
*b
![[thin space (1/6-em)]](https://www.rsc.org/images/entities/char_2009.gif) δ, f is the resonant frequency) to reduce the insertion loss of the application, and a near zero τf value to ensure the carrier signal of the application does not drift with the working environment of the communication devices.3,4 Specifically, ceramics with various εr values show different application fields: e.g. εr < 20: Al2O3 (εr = 10, Q × f = 500
δ, f is the resonant frequency) to reduce the insertion loss of the application, and a near zero τf value to ensure the carrier signal of the application does not drift with the working environment of the communication devices.3,4 Specifically, ceramics with various εr values show different application fields: e.g. εr < 20: Al2O3 (εr = 10, Q × f = 500![[thin space (1/6-em)]](https://www.rsc.org/images/entities/char_2009.gif) 000 GHz)5 for electronic circuit packages and dielectric resonance antennae, Zn2SiO4 (εr = 6.6, Q × f = 219
000 GHz)5 for electronic circuit packages and dielectric resonance antennae, Zn2SiO4 (εr = 6.6, Q × f = 219![[thin space (1/6-em)]](https://www.rsc.org/images/entities/char_2009.gif) 000 GHz, τf = −61 ppm per °C)6 and (Mg1−xZnx)Al2O4 (εr = 7.9–8.5, Q × f = 82
000 GHz, τf = −61 ppm per °C)6 and (Mg1−xZnx)Al2O4 (εr = 7.9–8.5, Q × f = 82![[thin space (1/6-em)]](https://www.rsc.org/images/entities/char_2009.gif) 000–106
000–106![[thin space (1/6-em)]](https://www.rsc.org/images/entities/char_2009.gif) 000 GHz, τf = −73 ppm per °C)7 for microwave substrates; 20 < εr < 70: Ba(B1/3B′1/3)O3 (B = Zn/Mg/Co/Ni, B′ = Ta/Nb) series of complex perovskite structures1,8–11 (BaZn1/3Ta2/3O3: εr = 29, Q × f = 150
000 GHz, τf = −73 ppm per °C)7 for microwave substrates; 20 < εr < 70: Ba(B1/3B′1/3)O3 (B = Zn/Mg/Co/Ni, B′ = Ta/Nb) series of complex perovskite structures1,8–11 (BaZn1/3Ta2/3O3: εr = 29, Q × f = 150![[thin space (1/6-em)]](https://www.rsc.org/images/entities/char_2009.gif) 000 GHz, τf = 0 ppm per °C), BaTi4O9,12 Ba2Ti9O2013 and (Zr, Sn)TiO414,15 for microwave dielectric resonance devices; εr > 70: BaO–Ln2O3–TiO2 (Ln = Sm, Nd)16–18 and CaO–Li2O–Ln2O3–TiO219–21 systems. Up to now, several MWDC materials with εr values of 5–100 have been commercialized, possessing excellent high Q × f values and zero τf values:1e.g. BaB1/3Ta2/3O3 (B = Mg, Zn), Ba(Co,Zn)1/3Nb2/3O3, SrTiO3–LaAlO3, and ZrTiO4–ZnNb2O6. Driven by the rapid development of the internet of things (IoT) and 5th generation wireless systems (5G), much effort has been devoted to the exploration of novel MWDC materials with excellent dielectric performances.
000 GHz, τf = 0 ppm per °C), BaTi4O9,12 Ba2Ti9O2013 and (Zr, Sn)TiO414,15 for microwave dielectric resonance devices; εr > 70: BaO–Ln2O3–TiO2 (Ln = Sm, Nd)16–18 and CaO–Li2O–Ln2O3–TiO219–21 systems. Up to now, several MWDC materials with εr values of 5–100 have been commercialized, possessing excellent high Q × f values and zero τf values:1e.g. BaB1/3Ta2/3O3 (B = Mg, Zn), Ba(Co,Zn)1/3Nb2/3O3, SrTiO3–LaAlO3, and ZrTiO4–ZnNb2O6. Driven by the rapid development of the internet of things (IoT) and 5th generation wireless systems (5G), much effort has been devoted to the exploration of novel MWDC materials with excellent dielectric performances.


![[thin space (1/6-em)]](https://www.rsc.org/images/entities/char_2009.gif) δ (Q = 1/tan
δ (Q = 1/tan![[thin space (1/6-em)]](https://www.rsc.org/images/entities/char_2009.gif) δ, f is the resonant frequency), which is closely corelated with the Q × f value. As mentioned, there is no 100% ionic chemical bond in a crystal; therefore, the ionic part of a chemical bond's contribution to lattice energy Ubi and the covalent part of contribution Ubc should be considered. The lattice energy U is calculated as follows:68
δ, f is the resonant frequency), which is closely corelated with the Q × f value. As mentioned, there is no 100% ionic chemical bond in a crystal; therefore, the ionic part of a chemical bond's contribution to lattice energy Ubi and the covalent part of contribution Ubc should be considered. The lattice energy U is calculated as follows:68

![[thin space (1/6-em)]](https://www.rsc.org/images/entities/char_2009.gif) 000
000![[thin space (1/6-em)]](https://www.rsc.org/images/entities/char_2009.gif) 000
000![[thin space (1/6-em)]](https://www.rsc.org/images/entities/char_2009.gif) 400
400![[thin space (1/6-em)]](https://www.rsc.org/images/entities/char_2009.gif) 000
000![[thin space (1/6-em)]](https://www.rsc.org/images/entities/char_2009.gif) 000
000![[thin space (1/6-em)]](https://www.rsc.org/images/entities/char_2009.gif) 000
000![[thin space (1/6-em)]](https://www.rsc.org/images/entities/char_2009.gif) 000
000![[thin space (1/6-em)]](https://www.rsc.org/images/entities/char_2009.gif) 000
000![[thin space (1/6-em)]](https://www.rsc.org/images/entities/char_2009.gif) 000
000![[thin space (1/6-em)]](https://www.rsc.org/images/entities/char_2009.gif) 000
000![[thin space (1/6-em)]](https://www.rsc.org/images/entities/char_2009.gif) 000
000![[thin space (1/6-em)]](https://www.rsc.org/images/entities/char_2009.gif) 500
500![[thin space (1/6-em)]](https://www.rsc.org/images/entities/char_2009.gif) 000
000![[thin space (1/6-em)]](https://www.rsc.org/images/entities/char_2009.gif) 500
500![[thin space (1/6-em)]](https://www.rsc.org/images/entities/char_2009.gif) 470
470![[thin space (1/6-em)]](https://www.rsc.org/images/entities/char_2009.gif) 000
000![[thin space (1/6-em)]](https://www.rsc.org/images/entities/char_2009.gif) 500
500![[thin space (1/6-em)]](https://www.rsc.org/images/entities/char_2009.gif) 700
700![[thin space (1/6-em)]](https://www.rsc.org/images/entities/char_2009.gif) 240
240![[thin space (1/6-em)]](https://www.rsc.org/images/entities/char_2009.gif) 000
000![[thin space (1/6-em)]](https://www.rsc.org/images/entities/char_2009.gif) 000
000![[double bond, length as m-dash]](https://www.rsc.org/images/entities/char_e001.gif) Si, Ge) materials are crystallized as a monoclinic structure with a C2/c space group.96–98 Huber found out that the petedunnite CaZnSi2O6 phase stabilizes at P > 0.8 GPa; otherwise, it decomposes into Zn2SiO4, Ca2ZnSi2O7 and SiO2 if the pressure is low and temperature exceeds 650 °C.99 Distortions of the polyhedra were quantitatively analysed by Heuer in a CaBSi2O6 system (B = Fe, Zn).96 Recently, microwave dielectric properties of CaBSi2O6 (B = Co, Mg) were reported: εr = 6.04, Q × f = 12
Si, Ge) materials are crystallized as a monoclinic structure with a C2/c space group.96–98 Huber found out that the petedunnite CaZnSi2O6 phase stabilizes at P > 0.8 GPa; otherwise, it decomposes into Zn2SiO4, Ca2ZnSi2O7 and SiO2 if the pressure is low and temperature exceeds 650 °C.99 Distortions of the polyhedra were quantitatively analysed by Heuer in a CaBSi2O6 system (B = Fe, Zn).96 Recently, microwave dielectric properties of CaBSi2O6 (B = Co, Mg) were reported: εr = 6.04, Q × f = 12![[thin space (1/6-em)]](https://www.rsc.org/images/entities/char_2009.gif) 457 GHz, and τf = −18.91 ppm per °C for B = Co,100 sintered at 1175 °C; and εr = 7.46, Q × f = 59
457 GHz, and τf = −18.91 ppm per °C for B = Co,100 sintered at 1175 °C; and εr = 7.46, Q × f = 59![[thin space (1/6-em)]](https://www.rsc.org/images/entities/char_2009.gif) 638 GHz, and τf = −46 ppm per °C for B = Mg,101 sintered at 1290 °C. CaMgSi2O6 ceramics are suitable candidates for electronic circuit packaging and microwave substrates as a result of their low εr value and low dielectric loss. Therefore, a number of studies focus on improving its dielectric properties and reducing its sintering temperature to lower than 950 °C to make it applicable in low-temperature cofired ceramic (LTCC) technology: e.g. if Mn2+, Co2+, Zn2+, Cu2+, (Mn1/2Zn1/2)2+ cations are used to partially substitute for Mg sites,102–105 improvements in Q × f value could be achieved: an εr of 8.01, a Q × f of about 83
638 GHz, and τf = −46 ppm per °C for B = Mg,101 sintered at 1290 °C. CaMgSi2O6 ceramics are suitable candidates for electronic circuit packaging and microwave substrates as a result of their low εr value and low dielectric loss. Therefore, a number of studies focus on improving its dielectric properties and reducing its sintering temperature to lower than 950 °C to make it applicable in low-temperature cofired ceramic (LTCC) technology: e.g. if Mn2+, Co2+, Zn2+, Cu2+, (Mn1/2Zn1/2)2+ cations are used to partially substitute for Mg sites,102–105 improvements in Q × f value could be achieved: an εr of 8.01, a Q × f of about 83![[thin space (1/6-em)]](https://www.rsc.org/images/entities/char_2009.gif) 469 GHz, and a τf of ca. −45.27 ppm per °C for CaMg0.98Mn0.02Si2O6. In the CaMg0.96Cu0.04Si2O6 system: εr = 7.41, Q × f = 160
469 GHz, and a τf of ca. −45.27 ppm per °C for CaMg0.98Mn0.02Si2O6. In the CaMg0.96Cu0.04Si2O6 system: εr = 7.41, Q × f = 160![[thin space (1/6-em)]](https://www.rsc.org/images/entities/char_2009.gif) 100 GHz, and τf = −42 ppm per °C. Furthermore, sintering aids, such as Li2O–MgO–ZnO–B2O3–SiO2, LiF, and Li2CO3–V2O5, were used to decrease the sintering temperature of CaMgSi2O6 ceramics, where it was effectively reduced from 1300 °C to 900 °C using 15 wt% Li2O–MgO–ZnO–B2O3–SiO2 with great microwave dielectric performances: εr = 8.2, Q × f = 32
100 GHz, and τf = −42 ppm per °C. Furthermore, sintering aids, such as Li2O–MgO–ZnO–B2O3–SiO2, LiF, and Li2CO3–V2O5, were used to decrease the sintering temperature of CaMgSi2O6 ceramics, where it was effectively reduced from 1300 °C to 900 °C using 15 wt% Li2O–MgO–ZnO–B2O3–SiO2 with great microwave dielectric performances: εr = 8.2, Q × f = 32![[thin space (1/6-em)]](https://www.rsc.org/images/entities/char_2009.gif) 000 GHz, and τf = −48 ppm per °C.106
000 GHz, and τf = −48 ppm per °C.106

![[thin space (1/6-em)]](https://www.rsc.org/images/entities/char_2009.gif) 627 kJ mol−1), which is 6 times the total lattice energy of Ca–O and Mg–O bonds. Reported with same crystal structure, a CaCoSi2O6 ceramic with a Utotal value (19899 kJ mol−1) shows a Q × f value of about 12
627 kJ mol−1), which is 6 times the total lattice energy of Ca–O and Mg–O bonds. Reported with same crystal structure, a CaCoSi2O6 ceramic with a Utotal value (19899 kJ mol−1) shows a Q × f value of about 12![[thin space (1/6-em)]](https://www.rsc.org/images/entities/char_2009.gif) 457 GHz, which is smaller than that of CaMgSi2O6 (59
457 GHz, which is smaller than that of CaMgSi2O6 (59![[thin space (1/6-em)]](https://www.rsc.org/images/entities/char_2009.gif) 638 GHz) and also indicates the importance of structural stability to dielectric loss.100
638 GHz) and also indicates the importance of structural stability to dielectric loss.100![[thin space (1/6-em)]](https://www.rsc.org/images/entities/char_2009.gif) 469 GHz), also reflects the improvement in structural stability of Ca(Mg0.98Mn0.02)Si2O6.
469 GHz), also reflects the improvement in structural stability of Ca(Mg0.98Mn0.02)Si2O6.

![[4 with combining macron]](https://www.rsc.org/images/entities/char_0034_0304.gif) 21m(113) usually exists in A2BSi2O7 (A = Sr, Ca; B = Mg, Zn, Co, Mn) systems. It has attracted public attention for it broad application prospects, such as lighting, display, photoelectric conversion, optoelectronic information, and biomolecular identification. Moreover, its excellent dielectric properties109 (Sr2MgSi2O7: εr = 8.3, Q × f = 55
21m(113) usually exists in A2BSi2O7 (A = Sr, Ca; B = Mg, Zn, Co, Mn) systems. It has attracted public attention for it broad application prospects, such as lighting, display, photoelectric conversion, optoelectronic information, and biomolecular identification. Moreover, its excellent dielectric properties109 (Sr2MgSi2O7: εr = 8.3, Q × f = 55![[thin space (1/6-em)]](https://www.rsc.org/images/entities/char_2009.gif) 000 GHz, and τf = −47.5 ppm per °C; Sr2MnSi2O7: εr = 8.8, Q × f = 32
000 GHz, and τf = −47.5 ppm per °C; Sr2MnSi2O7: εr = 8.8, Q × f = 32![[thin space (1/6-em)]](https://www.rsc.org/images/entities/char_2009.gif) 000 GHz, and τf = −58.5 ppm per °C; Ca2ZnSi2O7: εr = 11.0, Q × f = 13
000 GHz, and τf = −58.5 ppm per °C; Ca2ZnSi2O7: εr = 11.0, Q × f = 13![[thin space (1/6-em)]](https://www.rsc.org/images/entities/char_2009.gif) 500 GHz, and τf = −64.3 ppm per °C) also indicate their huge potential in the microwave communication field. Recently, Xiao investigated the structural effects of a tetragonal Sr2MgSi2O7 microwave dielectric ceramic via P–V–L bond theory, providing an insight into the structural properties of tetragonal silicates.110 According to the tetragonal structure of Sr2MgSi2O7 reported by Endo (COD #4317123),111 as can be seen from Fig. 6, the Sr2+ cation is surrounded by eight O2− anions, and Mg/Zn2+ and Si4+ cations are four-fold coordinated. An [MgO4] tetrahedron connects with an [SiO4] tetrahedron sharing a vertex (O3), while the [SiO4] framework interconnects through shared vertices (O1). The structural detail is listed in Table 3. Therefore, the binary bonding formula is expressed as:
500 GHz, and τf = −64.3 ppm per °C) also indicate their huge potential in the microwave communication field. Recently, Xiao investigated the structural effects of a tetragonal Sr2MgSi2O7 microwave dielectric ceramic via P–V–L bond theory, providing an insight into the structural properties of tetragonal silicates.110 According to the tetragonal structure of Sr2MgSi2O7 reported by Endo (COD #4317123),111 as can be seen from Fig. 6, the Sr2+ cation is surrounded by eight O2− anions, and Mg/Zn2+ and Si4+ cations are four-fold coordinated. An [MgO4] tetrahedron connects with an [SiO4] tetrahedron sharing a vertex (O3), while the [SiO4] framework interconnects through shared vertices (O1). The structural detail is listed in Table 3. Therefore, the binary bonding formula is expressed as:![[4 with combining macron]](https://www.rsc.org/images/entities/char_0034_0304.gif) 21m, where the lattice parameters are: a = b = 8.011 Å, c = 5.164 Å, α = β = γ = 90° and Vcell = 331.355 Å3
21m, where the lattice parameters are: a = b = 8.011 Å, c = 5.164 Å, α = β = γ = 90° and Vcell = 331.355 Å3
![[thin space (1/6-em)]](https://www.rsc.org/images/entities/char_2009.gif) 891 to 34347.kJ mol−1 (the Utotal for all bonds still decreases), which illustrates that Sr2MgSi2O7 is intrinsically more stable than the Ca2ZnSi2O7 structure. Although the actual Q × f value is also affected by external loss, such as densification, grain growth, and sintering process. The higher lattice stability explains the lower intrinsic dielectric loss. The proportion of Si–O bond susceptibility shows an increasing trend from 47.26% to 51.72%, corresponding to the increase in εr value from 8.3 to 11.0, suggesting the importance of Si–O bonds in dielectric polarizability.
891 to 34347.kJ mol−1 (the Utotal for all bonds still decreases), which illustrates that Sr2MgSi2O7 is intrinsically more stable than the Ca2ZnSi2O7 structure. Although the actual Q × f value is also affected by external loss, such as densification, grain growth, and sintering process. The higher lattice stability explains the lower intrinsic dielectric loss. The proportion of Si–O bond susceptibility shows an increasing trend from 47.26% to 51.72%, corresponding to the increase in εr value from 8.3 to 11.0, suggesting the importance of Si–O bonds in dielectric polarizability.![[thin space (1/6-em)]](https://www.rsc.org/images/entities/char_2009.gif) 891
891![[thin space (1/6-em)]](https://www.rsc.org/images/entities/char_2009.gif) 859
859![[thin space (1/6-em)]](https://www.rsc.org/images/entities/char_2009.gif) 347
347![[thin space (1/6-em)]](https://www.rsc.org/images/entities/char_2009.gif) 000 GHz
000 GHz![[thin space (1/6-em)]](https://www.rsc.org/images/entities/char_2009.gif) 326
326![[thin space (1/6-em)]](https://www.rsc.org/images/entities/char_2009.gif) 000 GHz
000 GHz![[thin space (1/6-em)]](https://www.rsc.org/images/entities/char_2009.gif) 088
088![[thin space (1/6-em)]](https://www.rsc.org/images/entities/char_2009.gif) 000 GHz) value has been underway. Li2O–AO–BO2 based systems can be regarded as the substitution of the A site in AO (A = Mg, Zn, Ni) with Li2BO3 (B = Ti, Sn, Zr). For example, Li2TiO3 and MgO are subordinated to the same rock-salt-type structure, and the ionic radii of cations are close to each other (IRLi,Ti = 0.708 Å, IRMg = 0.72 Å),117 which is beneficial for forming a solid solution. Therefore, material systems with the chemical formula of Li2xA1−xBxO1+2x (A = Mg, Zn, Ni; B = Ti, Sn, Zr)118,119 show large diversities as x varies. For instance, x = 1/5: Li2Mg4TiO7,120x = 1/4: Li2Mg3TiO6,121x = 2/5: Li4Mg3Ti2O9122 and x = 1/2: Li2MgTiO4.123 In 2016, novel rock-salt ceramics with the chemical formula of Li2O–3MgO–TiO2 (B = Ti, Sn, Zr) ceramics possess excellent microwave dielectric performances: εr = 8.8–15.2, Q × f = 86
000 GHz) value has been underway. Li2O–AO–BO2 based systems can be regarded as the substitution of the A site in AO (A = Mg, Zn, Ni) with Li2BO3 (B = Ti, Sn, Zr). For example, Li2TiO3 and MgO are subordinated to the same rock-salt-type structure, and the ionic radii of cations are close to each other (IRLi,Ti = 0.708 Å, IRMg = 0.72 Å),117 which is beneficial for forming a solid solution. Therefore, material systems with the chemical formula of Li2xA1−xBxO1+2x (A = Mg, Zn, Ni; B = Ti, Sn, Zr)118,119 show large diversities as x varies. For instance, x = 1/5: Li2Mg4TiO7,120x = 1/4: Li2Mg3TiO6,121x = 2/5: Li4Mg3Ti2O9122 and x = 1/2: Li2MgTiO4.123 In 2016, novel rock-salt ceramics with the chemical formula of Li2O–3MgO–TiO2 (B = Ti, Sn, Zr) ceramics possess excellent microwave dielectric performances: εr = 8.8–15.2, Q × f = 86![[thin space (1/6-em)]](https://www.rsc.org/images/entities/char_2009.gif) 000–152
000–152![[thin space (1/6-em)]](https://www.rsc.org/images/entities/char_2009.gif) 000 GHz (f = 8.3–10.7 GHz).124 Besides, the raw materials are cheap and easy to obtain, attracting a lot of public attention. However, it is noticed that the sintering characteristics are not satisfactory. For instance, the secondary-phase Mg2SnO4 exists along with the formation of the Li2Mg3SnO6 phase,125 ZrO2 usually accompanies the existence of the Li2Mg3ZrO6 phase.124 Most importantly, a large number of micropores formed by the volatilization of lithium at high temperature lead to cracks or fractures in the microstructure, which is detrimental to the development of properties. Therefore, it is crucial to solve these fundamental and nonnegligible issues.
000 GHz (f = 8.3–10.7 GHz).124 Besides, the raw materials are cheap and easy to obtain, attracting a lot of public attention. However, it is noticed that the sintering characteristics are not satisfactory. For instance, the secondary-phase Mg2SnO4 exists along with the formation of the Li2Mg3SnO6 phase,125 ZrO2 usually accompanies the existence of the Li2Mg3ZrO6 phase.124 Most importantly, a large number of micropores formed by the volatilization of lithium at high temperature lead to cracks or fractures in the microstructure, which is detrimental to the development of properties. Therefore, it is crucial to solve these fundamental and nonnegligible issues.
![[thin space (1/6-em)]](https://www.rsc.org/images/entities/char_2009.gif) 711
711![[thin space (1/6-em)]](https://www.rsc.org/images/entities/char_2009.gif) 402
402![[thin space (1/6-em)]](https://www.rsc.org/images/entities/char_2009.gif) 710
710![[thin space (1/6-em)]](https://www.rsc.org/images/entities/char_2009.gif) 801
801![[thin space (1/6-em)]](https://www.rsc.org/images/entities/char_2009.gif) 467
467![[thin space (1/6-em)]](https://www.rsc.org/images/entities/char_2009.gif) δ of about 7.3 × 10⁻⁵, and τf of ca. −13 ppm per °C;129 for Li4Mg3Ti2O9 ceramic sintered at 1450 °C: εrp = 15.9, tan
δ of about 7.3 × 10⁻⁵, and τf of ca. −13 ppm per °C;129 for Li4Mg3Ti2O9 ceramic sintered at 1450 °C: εrp = 15.9, tan![[thin space (1/6-em)]](https://www.rsc.org/images/entities/char_2009.gif) δ = 6.0 × 10⁻⁵, and τf = −7 ppm per °C;122 for Li2MgTiO4 ceramic sintered at 1350 °C: εrp = 15.1, tan
δ = 6.0 × 10⁻⁵, and τf = −7 ppm per °C;122 for Li2MgTiO4 ceramic sintered at 1350 °C: εrp = 15.1, tan![[thin space (1/6-em)]](https://www.rsc.org/images/entities/char_2009.gif) δ = 8.4 × 10⁻⁵, and τf = −4 ppm per °C,123 it is shown that experimental results provide evidence for the calculations. It is notable that the Q × f value is not only affected by intrinsic structural effects, but is very sensitive to extrinsic parts, such as sintering temperature, which promotes the growth of grain and alters the amount of grain boundaries. Thus, another nonnegligible contribution to actual dielectric loss comes from extrinsic loss.
δ = 8.4 × 10⁻⁵, and τf = −4 ppm per °C,123 it is shown that experimental results provide evidence for the calculations. It is notable that the Q × f value is not only affected by intrinsic structural effects, but is very sensitive to extrinsic parts, such as sintering temperature, which promotes the growth of grain and alters the amount of grain boundaries. Thus, another nonnegligible contribution to actual dielectric loss comes from extrinsic loss.


![[thin space (1/6-em)]](https://www.rsc.org/images/entities/char_2009.gif) 000
000![[thin space (1/6-em)]](https://www.rsc.org/images/entities/char_2009.gif) 330
330![[thin space (1/6-em)]](https://www.rsc.org/images/entities/char_2009.gif) 000
000![[thin space (1/6-em)]](https://www.rsc.org/images/entities/char_2009.gif) 965 GHz, τf = 21.96 ppm per °C when sintered at 1225 °C for 4 h.140 It is crystallized as an orthorhombic structure with an Fddd space group. The XRD patterns of Li3Mg2NbO6 ceramics sintered at 1175–1300 °C are shown in Fig. 15.140 A diagrammatic sketch of a crystal structure is presented in Fig. 16, where in its structure, three types of Li and Mg atoms and two types of O atoms are shown, where Li1Mg1 and Li2Mg2 atoms occupy the 16 g Wyckoff position, while Li3Mg3 atoms are in the 8b site and Nb is in the 8a site. 16f and 32 h sites are distributed with O(1) and O(2) atoms. All the cations are six-fold coordinated, forming an oxygen octahedron. Detailed structural parameters can be traced in ref. 140. Recently, the relationships between bond characteristics and microwave dielectric properties were studied by several researchers based on the actual crystal structure, coordinate environments, and ionic occupancy. First and foremost, the binary bonding formula expression was considered by Wu:140
965 GHz, τf = 21.96 ppm per °C when sintered at 1225 °C for 4 h.140 It is crystallized as an orthorhombic structure with an Fddd space group. The XRD patterns of Li3Mg2NbO6 ceramics sintered at 1175–1300 °C are shown in Fig. 15.140 A diagrammatic sketch of a crystal structure is presented in Fig. 16, where in its structure, three types of Li and Mg atoms and two types of O atoms are shown, where Li1Mg1 and Li2Mg2 atoms occupy the 16 g Wyckoff position, while Li3Mg3 atoms are in the 8b site and Nb is in the 8a site. 16f and 32 h sites are distributed with O(1) and O(2) atoms. All the cations are six-fold coordinated, forming an oxygen octahedron. Detailed structural parameters can be traced in ref. 140. Recently, the relationships between bond characteristics and microwave dielectric properties were studied by several researchers based on the actual crystal structure, coordinate environments, and ionic occupancy. First and foremost, the binary bonding formula expression was considered by Wu:140

![[thin space (1/6-em)]](https://www.rsc.org/images/entities/char_2009.gif) 550 GHz, τf = −24.4 ppm per °C.131
550 GHz, τf = −24.4 ppm per °C.131


![[thin space (1/6-em)]](https://www.rsc.org/images/entities/char_2009.gif) 100 GHz, and τf of ca. −55 ppm per °C for M = Mg when sintered at 950 °C.169 For M = Ni sintered at 825 °C: εr = 7.18, Q × f = 27
100 GHz, and τf of ca. −55 ppm per °C for M = Mg when sintered at 950 °C.169 For M = Ni sintered at 825 °C: εr = 7.18, Q × f = 27![[thin space (1/6-em)]](https://www.rsc.org/images/entities/char_2009.gif) 754 GHz, τf = −67.7 ppm per °C.170 The chemical compatibility of LiMnPO4 with Ag presents excellent properties: εr = 8.1, Q × f = 44
754 GHz, τf = −67.7 ppm per °C.170 The chemical compatibility of LiMnPO4 with Ag presents excellent properties: εr = 8.1, Q × f = 44![[thin space (1/6-em)]](https://www.rsc.org/images/entities/char_2009.gif) 224 GHz, τf = −90 ppm per °C.171 Due to the excellent microwave properties of LiMPO4 ceramics at low temperatures, several efforts have been made to analyse the structure–property relationship.
224 GHz, τf = −90 ppm per °C.171 Due to the excellent microwave properties of LiMPO4 ceramics at low temperatures, several efforts have been made to analyse the structure–property relationship.


![[thin space (1/6-em)]](https://www.rsc.org/images/entities/char_2009.gif) 800 GHz, τf = −82 ppm per °C when sintered at 410 °C, Li2MoO4: εr = 5.5, Q × f = 46
800 GHz, τf = −82 ppm per °C when sintered at 410 °C, Li2MoO4: εr = 5.5, Q × f = 46![[thin space (1/6-em)]](https://www.rsc.org/images/entities/char_2009.gif) 000 GHz, τf = −160 ppm per °C when sintered at 540 °C, show prospects in LTCC usage. Recently, a series of molybdate-based trigonal structures with the chemical formulas of Ln2Zr3(MoO4)9 (Ln = La, Ce, Eu, Gd) have been reported with excellent properties when sintered at a low temperature (Ln = Gd: ST = 725 °C, εr = 11.2, Q × f = 57
000 GHz, τf = −160 ppm per °C when sintered at 540 °C, show prospects in LTCC usage. Recently, a series of molybdate-based trigonal structures with the chemical formulas of Ln2Zr3(MoO4)9 (Ln = La, Ce, Eu, Gd) have been reported with excellent properties when sintered at a low temperature (Ln = Gd: ST = 725 °C, εr = 11.2, Q × f = 57![[thin space (1/6-em)]](https://www.rsc.org/images/entities/char_2009.gif) 460 GHz, τf = −31.9 ppm per °C).178 By applying P–V–L bond theory, it is easier to understand the structure–property relationship.
460 GHz, τf = −31.9 ppm per °C).178 By applying P–V–L bond theory, it is easier to understand the structure–property relationship.
![[3 with combining macron]](https://www.rsc.org/images/entities/char_0033_0304.gif) c(167). Its crystal structure is sketched in Fig. 25 (Ln = Ce is a case in point),179 where two types of Zr (Zr(1) and Zr(2)) and Mo (Mo(1) and Mo(2)) atoms are presented, and six different O atoms exist. Ce and Zr2 atoms occupy 12c Wyckoff sites, and Zr1 is in a 6b site, while Mo1 and Mo2 atoms distribute in 36f and 18e sites, respectively. For O atoms, they all occupy 36f sites. The structure consists of five types of polyhedra because of different coordination environments of cations. For instance, the Ce3+ ion is surrounded by nine O2+ anion, where the bond types are classified as Ce–O1 × 3, Ce–O2 × 3 and Ce–O6 × 3. Both Zr(1)4+ and Zr(2)4+ ions are six-fold coordinated, while the Zr(1)4+ ion is only in the center of an O42+ anion, forming a [Zr(1)O6] octahedron, and O32− and O52− anions are around the Zr(2)4+ ion: Zr(2)–O3 × 3 and Zr(2)–O5 × 3. For the [MoO4] tetrahedron, Mo(1)–O1 × 1, Mo(1)–O2 × 1, Mo(1)–O3 × 1 and Mo(1)–O4 × 1 bonds are shown in [Mo(1)O4], while Mo(2)–O5 × 2 and Mo(2)–O5 × 2 bonds are presented in [Mo(2)O4].
c(167). Its crystal structure is sketched in Fig. 25 (Ln = Ce is a case in point),179 where two types of Zr (Zr(1) and Zr(2)) and Mo (Mo(1) and Mo(2)) atoms are presented, and six different O atoms exist. Ce and Zr2 atoms occupy 12c Wyckoff sites, and Zr1 is in a 6b site, while Mo1 and Mo2 atoms distribute in 36f and 18e sites, respectively. For O atoms, they all occupy 36f sites. The structure consists of five types of polyhedra because of different coordination environments of cations. For instance, the Ce3+ ion is surrounded by nine O2+ anion, where the bond types are classified as Ce–O1 × 3, Ce–O2 × 3 and Ce–O6 × 3. Both Zr(1)4+ and Zr(2)4+ ions are six-fold coordinated, while the Zr(1)4+ ion is only in the center of an O42+ anion, forming a [Zr(1)O6] octahedron, and O32− and O52− anions are around the Zr(2)4+ ion: Zr(2)–O3 × 3 and Zr(2)–O5 × 3. For the [MoO4] tetrahedron, Mo(1)–O1 × 1, Mo(1)–O2 × 1, Mo(1)–O3 × 1 and Mo(1)–O4 × 1 bonds are shown in [Mo(1)O4], while Mo(2)–O5 × 2 and Mo(2)–O5 × 2 bonds are presented in [Mo(2)O4].

![[thin space (1/6-em)]](https://www.rsc.org/images/entities/char_2009.gif) 752
752![[thin space (1/6-em)]](https://www.rsc.org/images/entities/char_2009.gif) 253
253![[thin space (1/6-em)]](https://www.rsc.org/images/entities/char_2009.gif) 555
555![[thin space (1/6-em)]](https://www.rsc.org/images/entities/char_2009.gif) 578
578![[thin space (1/6-em)]](https://www.rsc.org/images/entities/char_2009.gif) 933
933![[thin space (1/6-em)]](https://www.rsc.org/images/entities/char_2009.gif) 856
856![[thin space (1/6-em)]](https://www.rsc.org/images/entities/char_2009.gif) 358
358![[thin space (1/6-em)]](https://www.rsc.org/images/entities/char_2009.gif) 720
720![[thin space (1/6-em)]](https://www.rsc.org/images/entities/char_2009.gif) 835
835![[thin space (1/6-em)]](https://www.rsc.org/images/entities/char_2009.gif) 559
559![[thin space (1/6-em)]](https://www.rsc.org/images/entities/char_2009.gif) 241
241![[thin space (1/6-em)]](https://www.rsc.org/images/entities/char_2009.gif) 900
900![[thin space (1/6-em)]](https://www.rsc.org/images/entities/char_2009.gif) 988
988![[thin space (1/6-em)]](https://www.rsc.org/images/entities/char_2009.gif) 180
180![[thin space (1/6-em)]](https://www.rsc.org/images/entities/char_2009.gif) 144
144![[thin space (1/6-em)]](https://www.rsc.org/images/entities/char_2009.gif) 460
460![[thin space (1/6-em)]](https://www.rsc.org/images/entities/char_2009.gif) 900 GHz. This conclusion emphasizes the proportional relationship between structural stability and intrinsic dielectric loss in Ln2Zr3(MoO4)9 (Ln = La, Ce, Eu, Gd) systems. More importantly, by applying far-infrared reflectivity spectra, taking Ln = La as an example, as can be seen in Fig. 27,184 the intrinsic dielectric loss is fitted and sequenced as: Eu (1.3 × 10⁻⁴) < Gd (2.4 × 10⁻⁴) < La (2.9 × 10⁻⁴) < Ce (2.3 × 10⁻³). This finding is also solid evidence to support the relationship between structural stability and dielectric loss. However, due to different sinterabilities, for instance, the densified temperatures of Ln = La, Ce, Eu, Gd are 650 °C, 575 °C, 600 °C, and 725 °C, the actual growth of grains and amounts of grain boundaries are different, which also negatively affects the dielectric loss.
900 GHz. This conclusion emphasizes the proportional relationship between structural stability and intrinsic dielectric loss in Ln2Zr3(MoO4)9 (Ln = La, Ce, Eu, Gd) systems. More importantly, by applying far-infrared reflectivity spectra, taking Ln = La as an example, as can be seen in Fig. 27,184 the intrinsic dielectric loss is fitted and sequenced as: Eu (1.3 × 10⁻⁴) < Gd (2.4 × 10⁻⁴) < La (2.9 × 10⁻⁴) < Ce (2.3 × 10⁻³). This finding is also solid evidence to support the relationship between structural stability and dielectric loss. However, due to different sinterabilities, for instance, the densified temperatures of Ln = La, Ce, Eu, Gd are 650 °C, 575 °C, 600 °C, and 725 °C, the actual growth of grains and amounts of grain boundaries are different, which also negatively affects the dielectric loss.
![[thin space (1/6-em)]](https://www.rsc.org/images/entities/char_2009.gif) 570 GHz, and τf = −49.3 ppm per °C; MgTiO3: ST = 1400 °C, εr = 17.75, Q × f = 250
570 GHz, and τf = −49.3 ppm per °C; MgTiO3: ST = 1400 °C, εr = 17.75, Q × f = 250![[thin space (1/6-em)]](https://www.rsc.org/images/entities/char_2009.gif) 000 GHz, and τf = −42.5 ppm per °C).186,187
000 GHz, and τf = −42.5 ppm per °C).186,187


![[thin space (1/6-em)]](https://www.rsc.org/images/entities/char_2009.gif) 000 GHz and a τf of −24 ppm per °C are obtained for an NdNbO4 ceramic,82 and for an LaNbO4 ceramic sintered at 1275 °C: εr = 20.3, Q × f = 59
000 GHz and a τf of −24 ppm per °C are obtained for an NdNbO4 ceramic,82 and for an LaNbO4 ceramic sintered at 1275 °C: εr = 20.3, Q × f = 59![[thin space (1/6-em)]](https://www.rsc.org/images/entities/char_2009.gif) 740 GHz, τf = 7.44 ppm per °C,197 and a much lower dielectric loss is found in (La0.92Sm0.08)NbO4 ceramics with an εr value about 19.37, a Q × f value of 62
740 GHz, τf = 7.44 ppm per °C,197 and a much lower dielectric loss is found in (La0.92Sm0.08)NbO4 ceramics with an εr value about 19.37, a Q × f value of 62![[thin space (1/6-em)]](https://www.rsc.org/images/entities/char_2009.gif) 203 GHz and a τf of ca. 2.57 ppm per °C.198 Thus, much effort has been put into studying the structure–property relationship and improving the microwave dielectric properties.
203 GHz and a τf of ca. 2.57 ppm per °C.198 Thus, much effort has been put into studying the structure–property relationship and improving the microwave dielectric properties.

![[thin space (1/6-em)]](https://www.rsc.org/images/entities/char_2009.gif) 000
000![[thin space (1/6-em)]](https://www.rsc.org/images/entities/char_2009.gif) 530
530![[thin space (1/6-em)]](https://www.rsc.org/images/entities/char_2009.gif) 740
740![[thin space (1/6-em)]](https://www.rsc.org/images/entities/char_2009.gif) 553
553![[thin space (1/6-em)]](https://www.rsc.org/images/entities/char_2009.gif) 000 GHz to 66000 GHz.203
000 GHz to 66000 GHz.203![[thin space (1/6-em)]](https://www.rsc.org/images/entities/char_2009.gif) 466 GHz, which is higher than that of the undoped situation of 24
466 GHz, which is higher than that of the undoped situation of 24![[thin space (1/6-em)]](https://www.rsc.org/images/entities/char_2009.gif) 750 GHz.
750 GHz.
![[thin space (1/6-em)]](https://www.rsc.org/images/entities/char_2009.gif) 000 GHz and a near-zero τf value,1 and it is mostly used in resonators and has achieved widespread commercial value and thus continuously attracts public attention. Until now, much effort has been put into exploring the intrinsic structural impacts on dielectric performances: e.g. a 1
000 GHz and a near-zero τf value,1 and it is mostly used in resonators and has achieved widespread commercial value and thus continuously attracts public attention. Until now, much effort has been put into exploring the intrinsic structural impacts on dielectric performances: e.g. a 1![[thin space (1/6-em)]](https://www.rsc.org/images/entities/char_2009.gif) :
:![[thin space (1/6-em)]](https://www.rsc.org/images/entities/char_2009.gif) 2 ordered structure was clearly revealed using transmission electron microscopy in Ba((Co0.5Zn0.3Mg0.2)1/3Nb2/3)O3 ceramic along 〈110〉c, 〈111〉c and 〈112〉c projections, where the ordering of M and M′ cations was considered to be a crucial factor for microwave dielectric properties.207
2 ordered structure was clearly revealed using transmission electron microscopy in Ba((Co0.5Zn0.3Mg0.2)1/3Nb2/3)O3 ceramic along 〈110〉c, 〈111〉c and 〈112〉c projections, where the ordering of M and M′ cations was considered to be a crucial factor for microwave dielectric properties.207
![[3 with combining macron]](https://www.rsc.org/images/entities/char_0033_0304.gif) m1(164) space group, as shown in Fig. 35. Based on reported structural details (COD #4000400) of a = b = 5.77385 Å, c = 7.09376 Å, Vcell = 204.804 Å3 and P–V–L bond theory consideration, coordination environments for each cation are listed in Table 13. Also, the binary bonding formula is written as:
m1(164) space group, as shown in Fig. 35. Based on reported structural details (COD #4000400) of a = b = 5.77385 Å, c = 7.09376 Å, Vcell = 204.804 Å3 and P–V–L bond theory consideration, coordination environments for each cation are listed in Table 13. Also, the binary bonding formula is written as:![[thin space (1/6-em)]](https://www.rsc.org/images/entities/char_2009.gif) 016
016![[thin space (1/6-em)]](https://www.rsc.org/images/entities/char_2009.gif) δ, which are also close to the results from Table 14. Similarly, first principles calculation indicates that the Eu(1) mode at 149 cm−1 and the A2u(2) mode at 212 cm−1, where the vibrational behaviours closely related to [NbO6] octahedra, dominate the dielectric properties in the Ba(Mg1/3Nb2/3)O3 system.210
δ, which are also close to the results from Table 14. Similarly, first principles calculation indicates that the Eu(1) mode at 149 cm−1 and the A2u(2) mode at 212 cm−1, where the vibrational behaviours closely related to [NbO6] octahedra, dominate the dielectric properties in the Ba(Mg1/3Nb2/3)O3 system.210
 ) stand for the polarizing direction and the crosses (×) stand for no polarization (reprinted with permission from ref. 209. Copyright 2010 John Wiley and Sons).
![[thin space (1/6-em)]](https://www.rsc.org/images/entities/char_2009.gif) 000 GHz, τf = −33.6 ppm per °C). Based on reported first principles calculations, it is shown that the F1u(2) mode at 277 cm−1 makes about 47.5% and 80.5% contributions to εr and tan
000 GHz, τf = −33.6 ppm per °C). Based on reported first principles calculations, it is shown that the F1u(2) mode at 277 cm−1 makes about 47.5% and 80.5% contributions to εr and tan![[thin space (1/6-em)]](https://www.rsc.org/images/entities/char_2009.gif) δ, while the mode is regarded as the stretching behaviours of [MgO6] and [WO6] octahedra.211 Ba(Mg1/2W1/2)O3 is a cubic structure with a space group of Fm3m and lattice parameters of: a = b = c = 8.112 Å, and Vcell = 533.807 Å3 as reported by Filip'ev from COD #1537301.212 In the view of P–V–L bond theory, its coordination environment of cations is totally different from that in the Ba(Mg1/3Ta2/3)O3 system, where the binary bonding formula is much simpler with only one type of bond shown in the oxygen polyhedron:
δ, while the mode is regarded as the stretching behaviours of [MgO6] and [WO6] octahedra.211 Ba(Mg1/2W1/2)O3 is a cubic structure with a space group of Fm3m and lattice parameters of: a = b = c = 8.112 Å, and Vcell = 533.807 Å3 as reported by Filip'ev from COD #1537301.212 In the view of P–V–L bond theory, its coordination environment of cations is totally different from that in the Ba(Mg1/3Ta2/3)O3 system, where the binary bonding formula is much simpler with only one type of bond shown in the oxygen polyhedron:![[thin space (1/6-em)]](https://www.rsc.org/images/entities/char_2009.gif) 319
319![[thin space (1/6-em)]](https://www.rsc.org/images/entities/char_2009.gif) 632
632![[thin space (1/6-em)]](https://www.rsc.org/images/entities/char_2009.gif) 000
000![[thin space (1/6-em)]](https://www.rsc.org/images/entities/char_2009.gif) 702
702![[thin space (1/6-em)]](https://www.rsc.org/images/entities/char_2009.gif) 000
000![[thin space (1/6-em)]](https://www.rsc.org/images/entities/char_2009.gif) 460 GHz, and a negative τf value of ca. −77.21 ppm per °C. Improvements in the Q × f value have been reported with ionic modification on the cation site: e.g. small amounts of Ni2+ cation (0.08 mol) on the Zn site greatly improve the Q × f value to 73224 GHz.214 A Ti site replaced by a Ge4+ cation (0.2 mol) is beneficial for the development of the Q × f value to 80493 GHz.215 An Nb site partially substituted by Ta5+ and Sb5+ cations also testified to positive effects on the Q × f value (Sb = 0.08 mol, Q × f = 89
460 GHz, and a negative τf value of ca. −77.21 ppm per °C. Improvements in the Q × f value have been reported with ionic modification on the cation site: e.g. small amounts of Ni2+ cation (0.08 mol) on the Zn site greatly improve the Q × f value to 73224 GHz.214 A Ti site replaced by a Ge4+ cation (0.2 mol) is beneficial for the development of the Q × f value to 80493 GHz.215 An Nb site partially substituted by Ta5+ and Sb5+ cations also testified to positive effects on the Q × f value (Sb = 0.08 mol, Q × f = 89![[thin space (1/6-em)]](https://www.rsc.org/images/entities/char_2009.gif) 400 GHz).216 Therefore, structural impacts, especially the evolution of bond features in an AZrB2O8 monoclinic solid solution, may be crucial for discussing the structure–property relationship.
400 GHz).216 Therefore, structural impacts, especially the evolution of bond features in an AZrB2O8 monoclinic solid solution, may be crucial for discussing the structure–property relationship.


![[thin space (1/6-em)]](https://www.rsc.org/images/entities/char_2009.gif) 400
400![[thin space (1/6-em)]](https://www.rsc.org/images/entities/char_2009.gif) 673
673![[thin space (1/6-em)]](https://www.rsc.org/images/entities/char_2009.gif) 051
051![[thin space (1/6-em)]](https://www.rsc.org/images/entities/char_2009.gif) 000
000![[thin space (1/6-em)]](https://www.rsc.org/images/entities/char_2009.gif) 744
744![[thin space (1/6-em)]](https://www.rsc.org/images/entities/char_2009.gif) 320
320![[thin space (1/6-em)]](https://www.rsc.org/images/entities/char_2009.gif) 000
000![[thin space (1/6-em)]](https://www.rsc.org/images/entities/char_2009.gif) 824
824![[thin space (1/6-em)]](https://www.rsc.org/images/entities/char_2009.gif) 256
256![[thin space (1/6-em)]](https://www.rsc.org/images/entities/char_2009.gif) 100
100![[thin space (1/6-em)]](https://www.rsc.org/images/entities/char_2009.gif) 744
744![[thin space (1/6-em)]](https://www.rsc.org/images/entities/char_2009.gif) 320
320![[thin space (1/6-em)]](https://www.rsc.org/images/entities/char_2009.gif) 784 GHz to 80493 GHz.215 The Sn4+ cation (IR = 0.69 at CN = 6) replacing a Zr site in an MgZr0.85Sn0.15Nb2O8 ceramic also shows that lattice energy is advantageous to the Q × f value, where the largest Utotal corresponds to the highest Q × f value of 94014 GHz.219
784 GHz to 80493 GHz.215 The Sn4+ cation (IR = 0.69 at CN = 6) replacing a Zr site in an MgZr0.85Sn0.15Nb2O8 ceramic also shows that lattice energy is advantageous to the Q × f value, where the largest Utotal corresponds to the highest Q × f value of 94014 GHz.219![[thin space (1/6-em)]](https://www.rsc.org/images/entities/char_2009.gif) 100 GHz to 89
100 GHz to 89![[thin space (1/6-em)]](https://www.rsc.org/images/entities/char_2009.gif) 400 GHz). In an MgZrNb2O8 system, the Ta5+ cation is also proved to be an effective source to improve the lattice energy and Q × f value, and the average bond ionicity Afi value decreases similarly with the εr value.220 Complex (Sn1/2W1/2)5+ cation replacement for the Nb site in MgZrNb2O8 system (0–0.06 mol) is also confirmed by the similar variation tendency.221
400 GHz). In an MgZrNb2O8 system, the Ta5+ cation is also proved to be an effective source to improve the lattice energy and Q × f value, and the average bond ionicity Afi value decreases similarly with the εr value.220 Complex (Sn1/2W1/2)5+ cation replacement for the Nb site in MgZrNb2O8 system (0–0.06 mol) is also confirmed by the similar variation tendency.221![[thin space (1/6-em)]](https://www.rsc.org/images/entities/char_2009.gif) :
:![[thin space (1/6-em)]](https://www.rsc.org/images/entities/char_2009.gif) Nb remains unchanged at about 1
Nb remains unchanged at about 1![[thin space (1/6-em)]](https://www.rsc.org/images/entities/char_2009.gif) :
:![[thin space (1/6-em)]](https://www.rsc.org/images/entities/char_2009.gif) 2. Further in-depth study shows that the above materials can be understood as the coordinated substitution of Ti4+ in TiO2 by (Zn1/3Nb2/3)4+ ions: (Zn1/3Nb2/3)xTi1−xO2 (x = 0.45, 0.75, 1). Phase structures vary with the increase in x value, as indicated in the ternary phase diagram of Fig. 39.
2. Further in-depth study shows that the above materials can be understood as the coordinated substitution of Ti4+ in TiO2 by (Zn1/3Nb2/3)4+ ions: (Zn1/3Nb2/3)xTi1−xO2 (x = 0.45, 0.75, 1). Phase structures vary with the increase in x value, as indicated in the ternary phase diagram of Fig. 39.
![[thin space (1/6-em)]](https://www.rsc.org/images/entities/char_2009.gif) 700 GHz with a moderate εr value of about 25.89 Both ixiolite ZnTiNb2O8 and rutile Zn0.15Nb0.3Ti0.55O2 ceramics can be well-sintered at relatively low temperatures with various great dielectric performances (ixiolite: ST = 1100 °C, εr = 37.21, Q × f = 41
700 GHz with a moderate εr value of about 25.89 Both ixiolite ZnTiNb2O8 and rutile Zn0.15Nb0.3Ti0.55O2 ceramics can be well-sintered at relatively low temperatures with various great dielectric performances (ixiolite: ST = 1100 °C, εr = 37.21, Q × f = 41![[thin space (1/6-em)]](https://www.rsc.org/images/entities/char_2009.gif) 231 GHz; rutile: ST = 1050 °C, εr = 94.35, Q × f = 10
231 GHz; rutile: ST = 1050 °C, εr = 94.35, Q × f = 10![[thin space (1/6-em)]](https://www.rsc.org/images/entities/char_2009.gif) 889 GHz).224 Thus, many investigations have been undertaken to not only further improve the dielectric properties but also to decrease the sintering temperature, exploring applications in LTCC applications.
889 GHz).224 Thus, many investigations have been undertaken to not only further improve the dielectric properties but also to decrease the sintering temperature, exploring applications in LTCC applications.
![[thin space (1/6-em)]](https://www.rsc.org/images/entities/char_2009.gif) 532
532![[thin space (1/6-em)]](https://www.rsc.org/images/entities/char_2009.gif) 885
885![[thin space (1/6-em)]](https://www.rsc.org/images/entities/char_2009.gif) 145
145![[thin space (1/6-em)]](https://www.rsc.org/images/entities/char_2009.gif) 231
231![[thin space (1/6-em)]](https://www.rsc.org/images/entities/char_2009.gif) 872
872![[thin space (1/6-em)]](https://www.rsc.org/images/entities/char_2009.gif) 889
889![[thin space (1/6-em)]](https://www.rsc.org/images/entities/char_2009.gif) 807 GHz. Similarly, intrinsic dielectric properties for ixiolite ZnTiNb2O8 (εr = 32.16, Q × f = 40
807 GHz. Similarly, intrinsic dielectric properties for ixiolite ZnTiNb2O8 (εr = 32.16, Q × f = 40![[thin space (1/6-em)]](https://www.rsc.org/images/entities/char_2009.gif) 151 GHz) and rutile Zn0.15Nb0.3Ti0.55O2 (εr = 97.63, Q × f = 10
151 GHz) and rutile Zn0.15Nb0.3Ti0.55O2 (εr = 97.63, Q × f = 10![[thin space (1/6-em)]](https://www.rsc.org/images/entities/char_2009.gif) 443 GHz) are also close to experimental values, indicating that the intrinsic factor may have a dominant effect on microwave dielectric performance.224
443 GHz) are also close to experimental values, indicating that the intrinsic factor may have a dominant effect on microwave dielectric performance.224

![[thin space (1/6-em)]](https://www.rsc.org/images/entities/char_2009.gif) 889 to 13
889 to 13![[thin space (1/6-em)]](https://www.rsc.org/images/entities/char_2009.gif) 017 GHz in rutile and from 42
017 GHz in rutile and from 42![[thin space (1/6-em)]](https://www.rsc.org/images/entities/char_2009.gif) 181 to 47
181 to 47![[thin space (1/6-em)]](https://www.rsc.org/images/entities/char_2009.gif) 829 GHz in ixiolite).
829 GHz in ixiolite).

![[thin space (1/6-em)]](https://www.rsc.org/images/entities/char_2009.gif) 150 to 25200 kJ mol−1, accompanied by an increase in Q × f value from 24
150 to 25200 kJ mol−1, accompanied by an increase in Q × f value from 24![[thin space (1/6-em)]](https://www.rsc.org/images/entities/char_2009.gif) 000 to 30558 GHz.230
000 to 30558 GHz.230![[thin space (1/6-em)]](https://www.rsc.org/images/entities/char_2009.gif) 012 to 22
012 to 22![[thin space (1/6-em)]](https://www.rsc.org/images/entities/char_2009.gif) 050 GHz.
050 GHz.


![[thin space (1/6-em)]](https://www.rsc.org/images/entities/char_2009.gif) 051 GHz).
051 GHz)..
.
.
.
.
.
.
.
.
.
.
.
.
.
.
.
.
.
.
.
.
.
.
.
.
.
.
.
.
.
.
.
.
.
.
.
.
.
.
.
.
.
.
.
.
.
.
.
.
.
.
.
.
.
.
.
.
.
.
.
.
.
.
.
.
.
.
.
.
.
.
.
.
.
.
.
.
.
.
.
.
.
.
.
.
.
.
.
.
.
.
.
.
.
.
.
.
.
.
.
.
.
.
.
.
.
.
.
.
.
.
.
.
.
.
.
.
.
.
.
.
.
.
.
.
.
.
.
.
.
.
.
.
.
.
.
.
.
.
.
.
.
.
.
.
.
.
.
.
.
.
.
.
.
.
.
.
.
.
.
.
.
.
.
.
.
.
.
.
.
.
.
.
.
.
.
.
.
.
.
.
.
.
.
.
.
.
.
.
.
.
.
.
.
.
.
.
.
.
.
.
.
.
.
.
.
![[thin space (1/6-em)]](https://www.rsc.org/images/entities/char_2009.gif) :
:![[thin space (1/6-em)]](https://www.rsc.org/images/entities/char_2009.gif) 2 ordered structure of Ba(B′1/3B′′2/3)O3 perovskites along various zone axes using transmission electron microscopy, J. Mater. Chem. C, 2015, 3, 10755–10760 RSC
2 ordered structure of Ba(B′1/3B′′2/3)O3 perovskites along various zone axes using transmission electron microscopy, J. Mater. Chem. C, 2015, 3, 10755–10760 RSC .
.
.
.
.
.
.
.
.
.
.
.
.
.
.
.
.
.
.
.
.
.
.
.
.
.
.
.
.


