DOI:
10.1039/C9QI01197H
(Research Article)
Inorg. Chem. Front., 2020,
7, 128-133
Metal–organic ferroelectric complexes: enantiomer directional induction achieved above-room-temperature homochiral molecular ferroelectrics†
Received
17th September 2019
, Accepted 20th October 2019
First published on 21st October 2019
Abstract
Ferroelectrics as a class of technically important materials have been eagerly pursued, similarly to the gold rush. In particular, in recent years, molecular ferroelectrics have stood out because of their variable structures and excellent properties. However, the discovery of new ferroelectrics is often random rather than strategically designed. Homochirality provides an important bridging effect between structure and properties, in which homochiral crystals tend to crystallize in polar space groups, increasing the possibility of the integration of homochirality with ferroelectricity. In this study, the strategy of homochirality was utilized to realize ferroelectricity in enantiomorphic metal–organic complex crystals based on a nonferroelectric racemic mixture. Unlike the nonferroelectric racemic mixture, both Cu(1,10-phenanthroline)2SeO4·(R-1,2-propanediol) and Cu(1,10-phenanthroline)2SeO4·(S-1,2-propanediol) adopted the enantiomorphic-polar point group 1 (C1) at ambient temperature and display mirror images, as verified by the crystal structure analysis and vibrational circular dichroism (VCD) spectra. The enantiomers show 2F1-type ferroelectric phase transitions, including a similar phase transition temperature (Tc) and other ferroelectric properties. This finding reveals that the introduction of homochiral molecules provides significant structure-related physical properties crucial for the effective design of homochiral molecular ferroelectrics.
Introduction
Ferroelectrics, in which spontaneous electric polarization (Ps) can be reversibly switched under a proper external applied electric field, have been extensively investigated, showing promising applications in memory devices, capacitors, microactuators, etc.1–3 The first ferroelectric Rochelle salt ([KNaC4H4O6]3·4H2O) was discovered in 1920 and its structure contains a coordination metal network formed by the optically active molecule L(+)-tartaric acid, water molecules, and alkali metals, which is known as the first homochiral molecular ferroelectric metal–organic complex.4 However, nearly 100 years later, there has not been much progress in homochiral ferroelectrics compared with the vigorous development of other types of ferroelectrics.3,5–18 In addition, although the ferroelectric phase of ferroelectrics must crystallize in ten polar point groups (C1, C2, Cs, C2v, C4, C4v, C3, C3v, C6, and C6v), not much attention has been paid to the included five chiral point groups (C1, C2, C4, C3, and C6), which are necessary for homochiral ferroelectrics.19 In particular, the superiority of diverse structural models of molecular materials has partly hindered the design and applications of ferroelectrics. Therefore, discovering an efficient shortcut for the design of new molecular ferroelectrics is urgent, which can promote their further extensive applications.
Homochirality is one of the most important properties of organic molecules, and it plays an essential role in many living things. Considering molecular structural aspects, homochiral molecules are more inclined to construct polar structures. Chirality makes molecules demonstrate many specific physical performances, which not only result in optical activity for application in fluorescence detection and diagnosis, but also can generate interesting, valuable and unique physical effects, such as magneto-chiral dichroism (MChD), second harmonic generation (SHG) and chiral photonics.20–24 Significantly, the crystals of homochiral compounds tend to crystallize in five chiral point groups, which produces the great potential to incorporate homochirality in ferroelectricity.19 Moreover, there are exactly 22 chiral to chiral ferroelectric phase transitions among the 88 species of ferroelectric crystals according to the Aizu rule.25 However, because of the corresponding handedness in the enantiomer, racemates consisting of an equimolar mixture of each optically active enantiomer possibly adopt non-enantiomorphic or even centrosymmetric point groups.26 Thus, homochirality provides an important bridging effect between the structure and properties of ferroelectric molecules and develops a reasonable strategy for designing new homochiral molecular ferroelectrics. However, to date, the few homochiral ferroelectrics known are mainly organic salts, such as (R)-(−)-3-hydroxlyquinuclidinium halides, three-dimensional metal-free perovskites of (3-ammoniopyrrolidinium)NH4Br3, (3-ammonioquinuclidinium)NH4Br3 and bis(imidazolium) L-tartrate.27–30 The discovery of these homochiral ferroelectrics is more likely to occur by chance when encountering the corresponding homochiral molecules rather than being directionally designed. Recently, the first pair of single-component high-temperature homochiral ferroelectric enantiomers of R-3-quinuclidinol and S-3-quinuclidinol with chiral point group 6 (C6) was realized by our group by introducing homochiral molecules to design ferroelectrics, while their racemic mixture (rac)-3-quinuclidinol with a point group 2/m exhibited nonferroelectric high-temperature phase transition behavior.31 This successful case of designing homochiral organic ferroelectrics confirms the invaluable role that homochirality plays in the generation of ferroelectricity.
Herein, we demonstrate that optically active molecule induction can realize the transition from nonferroelectric to ferroelectric in the metal–organic complex of Cu(1,10-phenanthroline)2SeO4·(diol). Previously, this complex including rac-1,2-propanediol has been reported as a nonferroelectric dielectric relaxor, and the molecular structures during the phase transition remain ordered.32 When the homochiral enantiomer with R-1,2-propanediol or S-1,2-propanediol is imported, the crystal of Cu(1,10-phenanthroline)2SeO4·(R-1,2-propanediol) (R-configuration) or Cu(1,10-phenanthroline)2SeO4·(S-1,2-propanediol) (S-configuration) shows a typical 2F1-type ferroelectric phase transition. The introduction of a homochiral enantiomer leads to a lower space group, and the transition from triclinic to monoclinic is also a potential ferroelectric phase transition compared with that of the racemate. As a result, the homochiral strategy is a big step forward to achieving and enriching the molecular ferroelectric family. Moreover, this finding is the first report that a constructed metal–organic ferroelectric complex system exhibits potential application in molecular distinguishing between a racemic mixture and optically active enantiomer.
Experimental
Materials
1,10-Phenanthroline (Aladdin, 99%), copper(II) carbonate basic (Sigma-Aldrich, 54–57%, Cu basis, Green), selenic acid (Alfa Aesar, 40% aq. soln.), R-1,2-propanediol (Aladdin, 98%) and S-1,2-propanediol (Bidepharm, 98%) were used as received.
Synthesis
Selenic acid (40%, 5.0 mmol, 1.81 g) was slowly dropped into a 100 mL stand-up flask containing copper(II) carbonate basic (2.5 mmol, 0.55 g) with continuous stirring for 1 h at room temperature to synthesize copper selenic acid salt, with a lot of bubbles released. Next, cupric selenate was diluted with distilled water (5 mL), followed by the addition of 1,10-phenanthroline (10.0 mmol, 1.80 g), immediately producing a large amount of blue precipitates, i.e. the monomeric complex of Cu(1,10-phenanthroline)2SeO4. After stirring for 10 min at room temperature, excess R- or S-1,2-propanediol (200 mL) was added to the above suspension and the mixture was heated for 4 h at 393 K until it turned into a clear dark green solution. Subsequently, the deep-green crystals R- and S-configurations were grown at 343 K for 7 days. The purity of the bulk phase was confirmed by powder X-ray diffraction measurements (Fig. S1 and S2, ESI†).
Methods
PXRD measurements were performed on a Rigaku D/MAX 2000 PC X-ray diffraction instrument in the 2θ range of 5–50° with a step size of 0.02°. The DSC and dielectric P–E hysteresis loop measurements were described elsewhere.13,14 For the dielectric P–E hysteresis loop measurements, single-crystal plates were cut from the large crystals in the direction of the a-axis (100). Silver conduction paste deposited on the plate surface was used as the electrode. For PFM measurements, polarization imaging in the nanoscale and local switching were carried out using a resonant-enhanced piezoresponse force microscope (MFP-3D, Asylum Research) on the crystal sample along the a-axis.
Computational details
DFT calculations were employed to determine the rotation energy barrier of the R-configuration using the B3LYP-D3 method, with the Grimme's DFT-D dispersion correction term. The central Se, S, C, H, O, and N atoms were solved with the 6-311G** basis set and Cu atom was applied with the SDD (Stuttgart–Dresden–Bonn relativistic effective core) potential, while the 6-31G* basis set was performed on the neighboring atoms. The initial structures were obtained from the X-ray crystallographically determined geometries.
Results and discussion
Enantiomer characterization
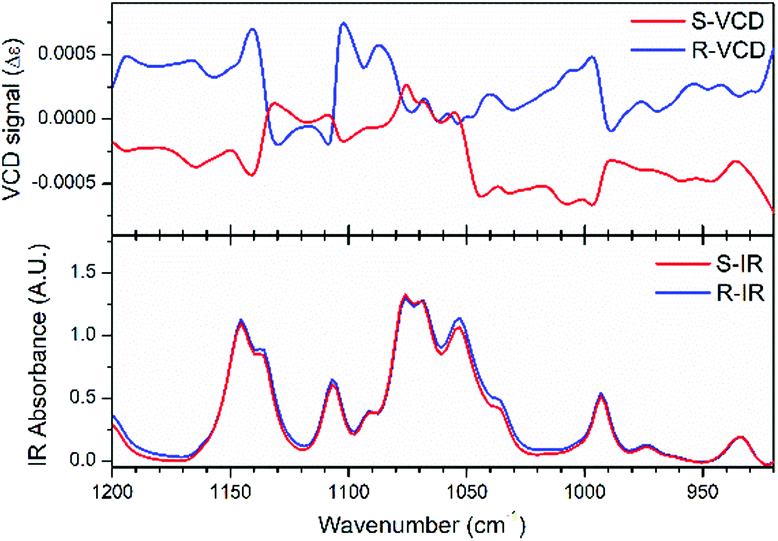
Vibrational circular dichroism (VCD) measurement, which is the enhanced version of CD, can detect the spectrum reflecting vibrational transitions in the infrared region and is a powerful tool to characterize and identify chiral molecules. Therefore, we firstly performed VCD measurements for the R- and S-configurations to confirm their enantiomorphic structures. As shown in Fig. 1, the almost identical infrared spectra and mirror variations in the VCD spectra reveal the enantiomorphic feature of the crystals with the R- and S-configurations. The strongest IR signal located at 1076 cm−1 is caused by the C*–O bond stretch vibration in the chiral diol, which refers to that at 1090 cm−1 in the density functional theory (DFT)-calculated VCD spectra, showing a slight peak shift (Fig. S3, ESI†). This inconsistency can result from the difference in molecular configuration between the experimental and DFT calculated spectra. After geometric optimization under the corresponding B3LYP-D3 level, the molecular configuration showed obvious changes due to its structural flexibility.
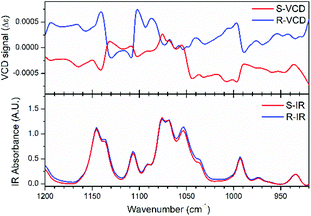 |
| | Fig. 1 Experimentally measured VCD and IR spectra for the R- and S-configurations. | |
Crystal structures
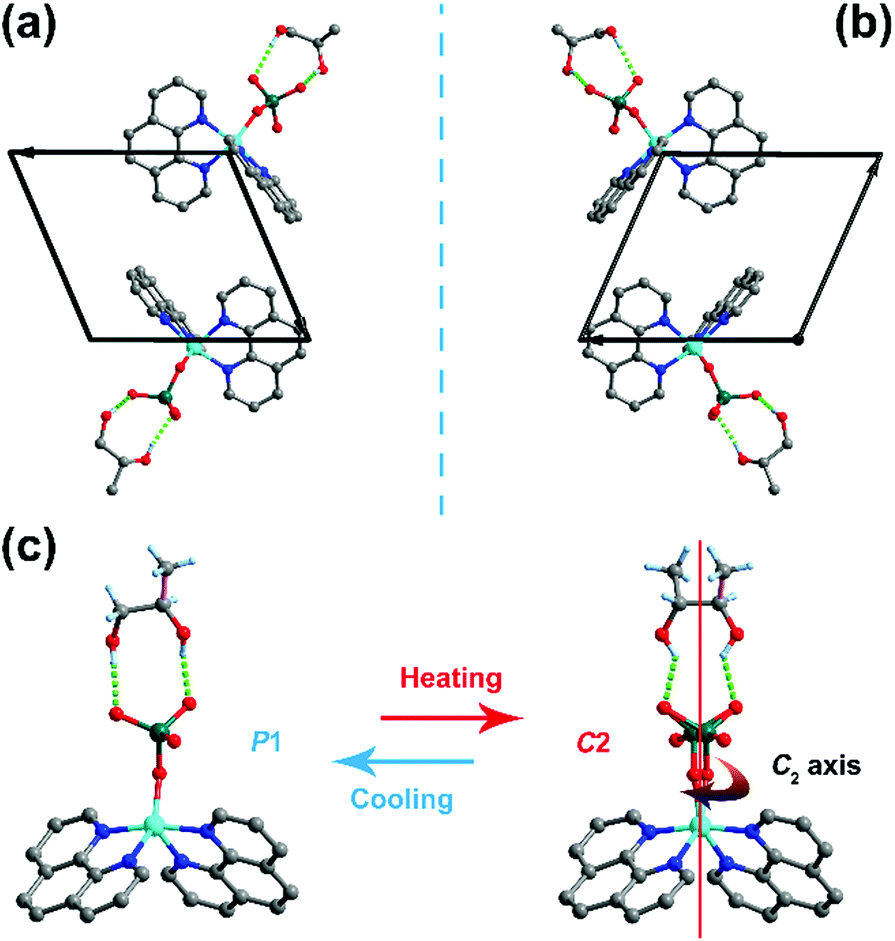
According to the previously reported racemic mixture, a distinct dielectric relaxation phase transition appears at around room temperature although there is no significant structural change, indicating that the included rac-1,2-propanediol and SeO42− are involved in an isomorphic phase transition.32 Therefore, it is believed that the homochiral enantiomer of the R- and S-configurations should also undergo temperature-dependent phase transition behavior. Thus, we carried out variable-temperature single-crystal X-ray diffraction measurements on the R- and S-configurations. Undoubtedly, the crystal structures of the R-configuration and S-configuration are similar to the racemic mixture assembled by the host part of the monomeric bis(1,10-phenanthroline-k2N,N′)(selenate-O)copper(II) and the guest R-1,2-propanediol and S-1,2-propanediol, respectively. The bonding mode in the host complexes presents a distorted square-pyramidal coordination centered on the copper ion chelating with four nitrogen atoms from two 1,10-phenanthroline molecules and one oxygen atom belonging to the selenate anion. The guest diol is bound to the host part by intramolecular O–H⋯O hydrogen bond interactions, constructing an R22(9) ring motif-type supramolecular architecture.
For the R-configuration, the structural determination reveals a triclinic chiral space group P1 at 293 K, belonging to an enantiomorphic-polar point group 1 (C1) (Table S1, ESI†). Under this temperature phase, the SeO42− anion and R-1,2-propanediol show an ordered state and the handedness of the crystal corresponds to the chirality of R-1,2-propanediol. The S-configuration adopts the same structural properties with that in the R-configuration. The difference is that the R-configuration and S-configuration have a mirror-image relationship because of the chiral asymmetry of the R-1,2-propanediol and S-1,2-propanediol enantiomer (Fig. 2a and b, respectively). At 373 K, the crystallographic system of the R-configuration changed from triclinic to monoclinic. Also, because of the presence of homochiral R-1,2-propanediol, the R-configuration must crystallize in the chiral point group 2 (C2). Therefore, the observed Bravais lattice with C-center leads to the most reasonable C2 space group. In this phase, the SeO42− anion and R-1,2-propanediol molecule appear to be in a disordered state over two orientations with equal populations, which is mainly due to the crystallographic two-fold rotation C2-axis along the b-axis involved in the diol and SeO42− anion. In terms of structural changes, the R-configuration undergoes a structural phase transition from the space group C2 to P1, which is due to the symmetry-breaking of the C2-axis (Fig. 2c). As an enantiomorphic counterpart of the R-configuration, the same structural change was observed in the S-configuration. According to the symmetry changes, the crystals of the R- and S-configurations belong to the Aizu notation of 2F1 in one of the 88 types of ferroelectrics, indicating a possible ferroelectric–paraelectric phase transition.4
 |
| | Fig. 2 Comparison of the crystal structures of the R- and S-configurations, showing a mirror-image relationship. Packing structures of (a) R-configuration and (b) S-configuration. (c) Structural variation of R-configuration from P1 to C2, showing distinct motions of diol and SeO42− related to the C2-axis. | |
Phase transition properties
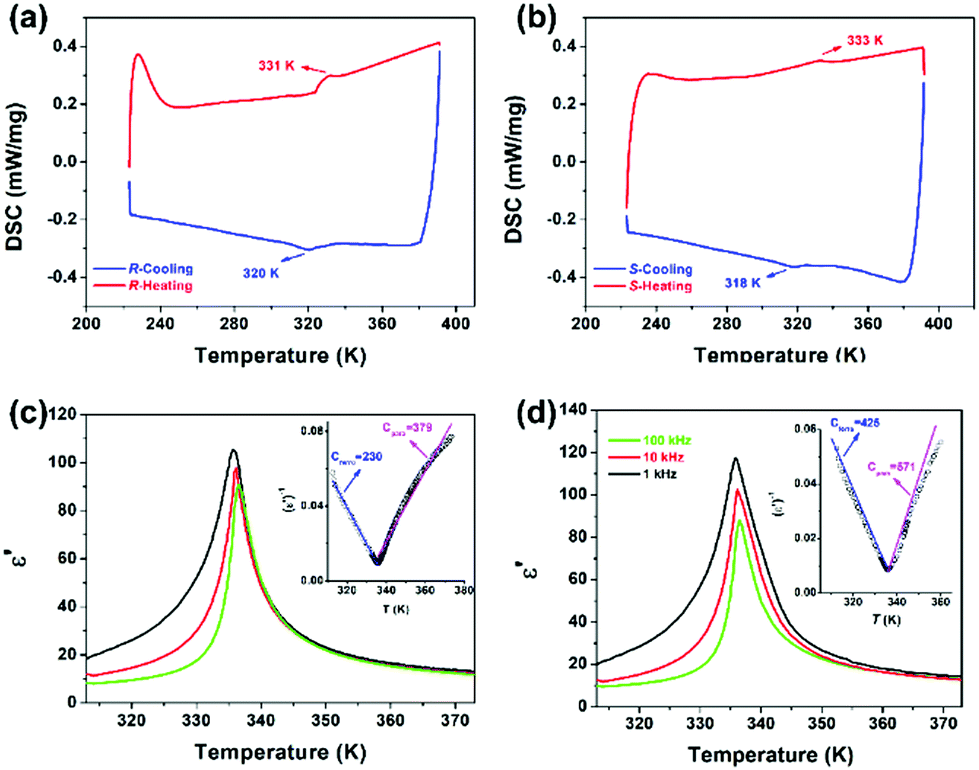
Differential scanning calorimetry (DSC) measurements were carefully performed to detect the thermal anomalies in the R- and S-configurations. As viewed in Fig. 3a and b, the apparently reversible endothermic and exothermic peaks of 331/320 K and 333/318 K reveal that the R- and S-configurations experienced reversible phase transitions at around 331 K (TRc) and 333 K (TSc), respectively, both of which are obviously larger than that at around 300 K in the racemic mixture. The Tc of the enantiomer is almost identical. Moreover, the entropy changes (ΔS) based on the small and weak thermal anomalies of the R- and S-configurations suggest a second-order feature.
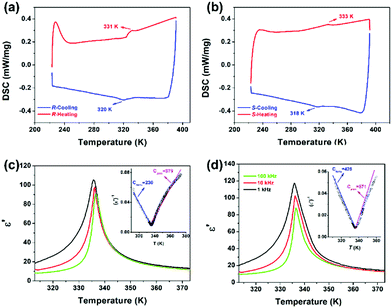 |
| | Fig. 3 Comparison of the phase transition of the R-configuration and S-configuration. (a and b) DSC curves in a heating and cooling cycle with a test rate of 20 K min−1. (c and d) Temperature-dependent dielectric real part ε′ under different frequencies in a heating process in terms of crystal samples with the same heating rate of 15 K min−1. Inset: 1/ε′ as a function of temperature. | |
In general, temperature-dependent structural changes in the phase transition determine that the physical properties also are sensitive to external temperature variations. Also, the dynamic motion of molecules is often accompanied by changes in molecular dipoles, leading to a distinct dielectric response. The above structural analyses reveal that both enantiomers experienced a marked change in symmetry. Additionally, the structural transition coupled with symmetry breaking tends to produce prominent dielectric anomalies around Tc, indicating a ferroelectric phase transition.19 Therefore, the temperature-triggered dielectric measurements obviously characterize the ferroelectric phase transitions. As depicted in Fig. S4 (ESI†), the ε′ of the enantiomer show significant broad λ-shape anomalous peaks at around 335 K in both the heating process and 330 K in the cooling circle, with a maximum peak value approximately 2.5 times larger than that of the peak valley under the applied frequency of 1 MHz. The evident dielectric peaks further indicate the possible ferroelectric phase transitions in the R- and S-configurations, which is consistent with the structural analysis and DSC results. Usually, the dielectric peaks generated along the polar axis are much larger than that in the other directions. Therefore, ε′ measurements were carried out on the crystal samples of the R- and S-configurations. As shown in Fig. 3c and d, the prominent peaks at around 335 K under the applied frequencies of 1 kHz, 10 kHz and 100 kHz with a 10 times increase in the direction of the a-axis are much stronger and narrower than that for the polycrystalline sample, revealing the ferroelectric feature of the transitions for the R- and S-configurations. Based on the Curie–Weiss law ε′ = Cpara/(T − T0) (T > Tc) or Cferro/(T′0 − T) (T < Tc), where Cpara and Cferro stand for Curie constants, T0 and T′0 refer to the Curie–Weiss temperatures for the paraelectric and ferroelectric phases, respectively,33 and the fitted value of Cpara = 379 K and Cferro = 230 K was obtained for the R-configuration according to the dielectric curve of 1 kHz. The ratio of Cpara to Cferro of 1.65 together with the λ-shape dielectric peaks directly reveals the second-order ferroelectric phase transition behavior, agreeing well with the DSC results. Similar results were observed for the S-configuration, in which the Cpara/Cferro ratio was estimated to be 1.34 at 1 kHz. It is worth comparing with the previously reported racemic mixture that two dielectric peaks anomalous at lower frequencies were recorded, showing obvious relaxation behavior. Although the racemic mixture crystallizes in a ferroelectric Cc space group, the mild peak shown at a higher temperature and weaker dielectric relaxation at a lower temperature makes it difficult for the racemic mixture to exhibit ferroelectricity.
P–E hysteresis loops
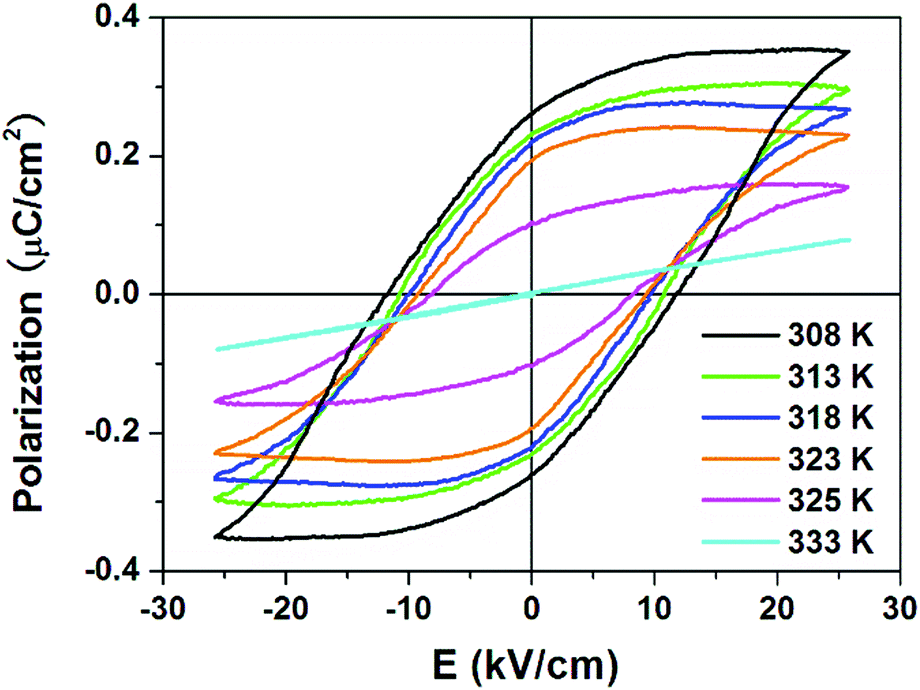
The ferroelectricity in the R- and S-configurations was further verified by observation of the polarization–electric field (P–E) hysteresis loops using the Sawyer–Tower circuit. For the racemic mixture, the linear dependence at 318 K indicates no switchable spontaneous polarization (ferroelectricity) (Fig. S5, ESI†). As shown in Fig. 4, linear responses were observed at 333 K above the Tc, as expected for the paraelectric phase of the R-configuration. As the temperature decreased below the Tc, a series of typical ferroelectric loops developed at various temperatures. At 308 K, we obtained Ps = 0.35 μC cm−2, Pr = 0.27 μC cm−2 and coercive field (the intercept of the loop with the field axis) Ec = 10.8 kV cm−1 for the R-configuration. For the S-configuration, the Ps of 0.32 μC cm−2, Pr = 0.23 μC cm−2 and Ec = 11.0 kV cm−1 were recorded at 318 K. Compared with that for other recently developed molecular ferroelectrics, the Ps of the enantiomers are mediocre.
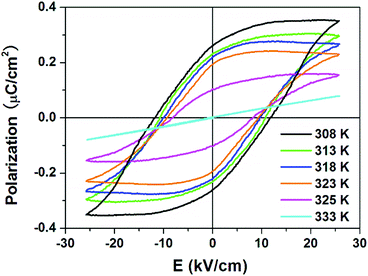 |
| | Fig. 4
P–E hysteresis loops for R-configuration measured at different temperatures along the a-axis by the Sawyer–Tower circuit method. | |
Piezoresponse force microscopy
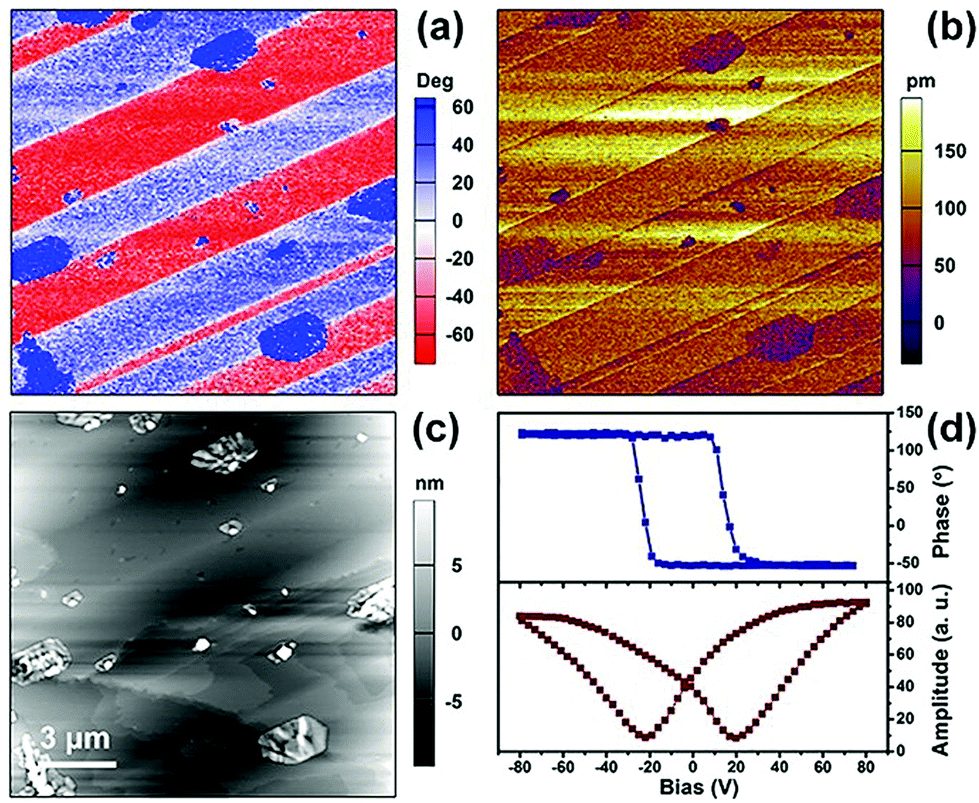
As a signature feature of ferroelectrics, their microscale domain structures can be visualized by piezoresponse force microscopy (PFM), which is effective to investigate the statics and dynamics of ferroelectric polarization.34 The results of the structural determinations, and thermal and dielectric detection reveal that the enantiomers possess similar physical properties. Therefore, the vertical PFM phase and amplitude images and the topographic images for the surface of a bulk crystal of the R-configuration as a representative are depicted in Fig. 5. As shown in Fig. 5a, the vertical phase exhibits a stripe-like domain structure and the striking 180° phase contrast in the two adjacent domains indicates bipolar domains with opposite orientations of antiparallel polarization directions. In Fig. 5b, the dark hatched regions in the amplitude image demonstrate the domain walls, which is consistent with that in the in-phase images (Fig. 5c). The inconsistency in the vertical phase and amplitude image with the topographic image provides evidence of the ferroelectric domain in the R-configuration. Similar stripe-like domains can be observed in the thin film of the R-configuration, where the size of the domains is much smaller (Fig. S6, ESI†). The local PFM-based piezoelectric hysteresis loop for the R-configuration was measured, in which the characteristic hysteresis loops and distinct butterfly curves were observed for both the crystal and film samples (Fig. 5d and Fig. S6d, ESI†), revealing switchable spontaneous polarization.
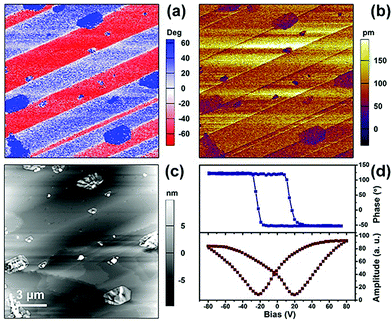 |
| | Fig. 5 Piezoresponse force microscopy of the R-configuration. (a) Vertical phase, (b) amplitude images, and (c) topographic images of the crystal. (d) Phase and amplitude signals as a function of the tip voltage for a selected point, showing local PFM hysteresis loops. | |
Rotation barrier calculations
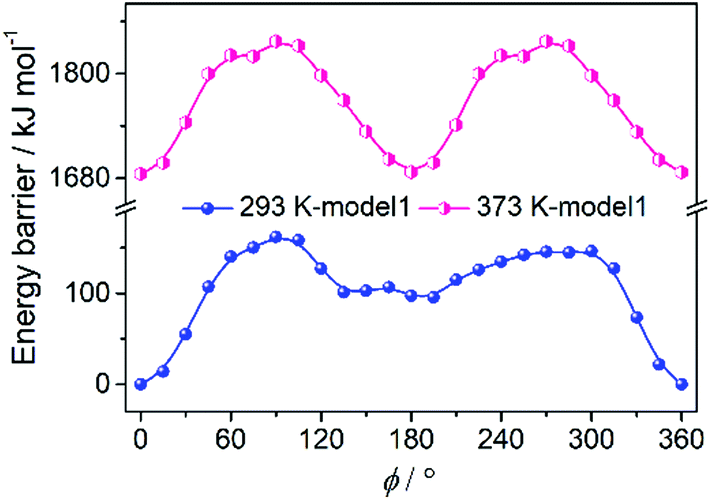
The molecular dipole moment is regarded to be from the Se of the SeO42− anion to the Cu atom.32 In the paraelectric phase, the SeO42− anion is disordered over two sites along the [0 1 0] direction related to the C2 axis. In the ferroelectric phase, there are two ordered SeO42− anions aligned in two orientations, which is different from that in the SeO42− anion with a single orientation in our previous paper due to the lower symmetry of P1 in comparison with the Cc space group. On account of the spontaneous polarization in 1 from the loss of the C2 symmetry, it is speculated that the polarization reversal is accomplished by the rotation of the two models including the rotation of SeO42− (model 1) or SeO4-diol (model 2) as a rigid fragment around the C2 axis.35 With regard to the previous comparison results of the two models that model 1 always has lower energy, we adopted model 1 to carry out the theoretical calculation to further understand the mechanism of ferroelectricity in the R- and S-configuration with the R-configuration as a representative. The energy barrier of the initial position was defined as zero for convenience. As shown in Fig. 6, there are two maximums found at 90° and 300° and two minimums found at 135° and 195° with the highest energy barrier of 162 kJ mol−1 according to the model 1 curve. Also, it is apparent that the energy barrier at 373 K is 1680 kJ mol−1 higher than that at 293 K, as expected. The disordered diol in the HTP is possibly caused by the symmetry operation and is static disorder. Considering the structure of the R-configuration at 293 K and 373 K, the ferroelectric transition involves the symmetry breaking of the C2 symmetry, which leads to the transition from the centrosymmetric HTP to the polar LTP, resulting in ferroelectric polarization reversal.
 |
| | Fig. 6 Rotation model 1 defined with the rotation of the only SeO42− of the R-configuration at two temperatures. | |
Conclusions
In summary, we successfully synthesized a pair of enantiomorphic metal–organic ferroelectric complexes, i.e. Cu(1,10-phenanthroline)2SeO4·(R-1,2-propanediol) and Cu(1,10-phenanthroline)2SeO4·(S-1,2-propanediol). Our results indicate that the transition from nonferroelectric to ferroelectric can be achieved by introducing optically active enantiomeric diol molecules. Both enantiomers possess the enantiomorphic-polar 1 (C1) at room temperature, undergoing an above-room-temperature 2F1-type ferroelectric phase transition. The two enantiomorphic ferroelectrics demonstrate almost the same ferroelectricity, including other ferroelectric-related performances. However, the racemate just exhibits a nonferroelectric room-temperature dielectric relaxation phase transition. Therefore, the introduction of homochirality in molecular systems is advisable to directly design molecular ferroelectrics. Especially, the chirality is extraordinarily rich, which can further lead to the discovery of new homochiral ferroelectrics with better performances. Moreover, the apparent difference in ferroelectric properties between the enantiomer and racemate may play an important role in ferroelectric identification or sensing in the future.
Conflicts of interest
There are conflicts to declare.
Acknowledgements
This work was supported by the National Natural Science Foundation of China (21831004, 21427801, and 91422301).
Notes and references
-
M. E. Lines and A. M. Glass, Principles and applications of ferroelectrics and related materials, Clarendon Press, Oxford Eng., 1977 Search PubMed.
- N. Setter, D. Damjanovic, L. Eng, G. Fox, S. Gevorgian, S. Hong, A. Kingon, H. Kohlstedt, N. Y. Park, G. B. Stephenson, I. Stolitchnov, A. K. Taganstev, D. V. Taylor, T. Yamada and S. Streiffer, J. Appl. Phys., 2006, 100, 051606 CrossRef.
- J. F. Scott, Science, 2007, 315, 954–959 CrossRef CAS.
- J. Valasek, Phys. Rev., 1921, 17, 475–481 CrossRef CAS.
- S. Horiuchi, F. Ishii, R. Kumai, Y. Okimoto, H. Tachibana, N. Nagaosa and Y. Tokura, Nat. Mater., 2005, 4, 163–166 CrossRef CAS.
- S. Horiuchi, Y. Tokunaga, G. Giovannetti, S. Picozzi, H. Itoh, R. Shimano, R. Kumai and Y. Tokura, Nature, 2010, 463, 789–792 CrossRef CAS.
- G. C. Xu, W. Zhang, X. M. Ma, Y. H. Chen, L. Zhang, H. L. Cai, Z. M. Wang, R. G. Xiong and S. Gao, J. Am. Chem. Soc., 2011, 133, 14948–14951 CrossRef CAS.
- D. W. Fu, H. L. Cai, S. H. Li, Q. Ye, L. Zhou, W. Zhang, Y. Zhang, F. Deng and R. G. Xiong, Phys. Rev. Lett., 2013, 110, 257601 CrossRef.
- W. Q. Liao, Y. Zhang, C. L. Hu, J. G. Mao, H. Y. Ye, P. F. Li, S. P. D. Huang and R. G. Xiong, Nat. Commun., 2015, 6, 7338 CrossRef.
- H. Y. Ye, J. Z. Ge, Y. Y. Tang, P. F. Li, Y. Zhang, Y. M. You and R. G. Xiong, J. Am. Chem. Soc., 2016, 138, 13175–13178 CrossRef CAS.
- L. C. Gomez-Aguirre, B. Pato-Doldan, J. Mira, S. Castro-Garcia, M. A. Senaris-Rodriguez, M. Sanchez-Andujar, J. Singleton and V. S. Zapf, J. Am. Chem. Soc., 2016, 138, 1122–1125 CrossRef CAS.
- X. Chen, X. Han and Q. D. Shen, Adv. Electron. Mater., 2017, 3, 1600460 CrossRef.
- P. F. Li, W. Q. Liao, Y. Y. Tang, H. Y. Ye, Y. Zhang and R. G. Xiong, J. Am. Chem. Soc., 2017, 139, 8752–8757 CrossRef CAS.
- Y. M. You, W. Q. Liao, D. W. Zhao, H. Y. Ye, Y. Zhang, Q. H. Zhou, X. H. Niu, J. L. Wang, P. F. Li, D. W. Fu, Z. M. Wang, S. Gao, K. L. Yang, J. M. Liu, J. Y. Li, Y. F. Yan and R. G. Xiong, Science, 2017, 357, 306–309 CrossRef CAS.
- W. Y. Zhang, Y. Y. Tang, P. F. Li, P. P. Shi, W. Q. Liao, D. W. Fu, H. Y. Ye, Y. Zhang and R. G. Xiong, J. Am. Chem. Soc., 2017, 139, 10897–10902 CrossRef CAS.
- J. Harada, Y. Kawamura, Y. Takahashi, Y. Uemura, T. Hasegawa, H. Taniguchi and K. Maruyama, J. Am. Chem. Soc., 2019, 141, 9349–9357 CrossRef.
- Z. X. Wang, Y. Zhang, Y. Y. Tang, P. F. Li and R. G. Xiong, J. Am. Chem. Soc., 2019, 141, 4372–4378 CrossRef CAS.
- H. Anetai, T. Takeda, N. Hoshino, H. Kobayashi, N. Saito, M. Shigeno, M. Yamaguchi and T. Akutagawa, J. Am. Chem. Soc., 2019, 141, 2391–2397 CrossRef CAS.
- P. P. Shi, Y. Y. Tang, P. F. Li, W. Q. Liao, Z. X. Wang, Q. Ye and R. G. Xiong, Chem. Soc. Rev., 2016, 45, 3811–3827 RSC.
- X. L. Li, C. L. Chen, Y. L. Gao, C. M. Liu, X. L. Feng, Y. H. Gui and S. M. Fang, Chem. – Eur. J., 2012, 18, 14632–14637 CrossRef CAS.
- Y. Wang, J. Xu, Y. W. Wang and H. Y. Chen, Chem. Soc. Rev., 2013, 42, 2930–2962 RSC.
- S. Ohkoshi, S. Takano, K. Imoto, M. Yoshikiyo, A. Namai and H. Tokoro, Nat. Photonics, 2014, 8, 65–71 CrossRef CAS.
- M. H. Liu, L. Zhang and T. Y. Wang, Chem. Rev., 2015, 115, 7304–7397 CrossRef CAS.
- S. C. Karunakaran, B. J. Cafferty, A. Weigert-Munoz, G. B. Schuster and N. V. Hud, Angew. Chem., 2019, 58, 1453–1457 CrossRef CAS.
- K. Aizu, J. Phys. Soc. Jpn., 1969, 27, 387–396 CrossRef CAS.
- C. K. Yang, W. N. Chen, Y. T. Ding, J. Wang, Y. Rao, W. Q. Liao, Y. Y. Tang, P. F. Li, Z. X. Wang and R. G. Xiong, Adv. Mater., 2019, 31, 1808088 CrossRef.
- H. Y. Ye, Y. Zhang, S. Noro, K. Kubo, M. Yoshitake, Z. Q. Liu, H. L. Cai, D. W. Fu, H. Yoshikawa, K. Awaga, R. G. Xiong and T. Nakamura, Sci. Rep., 2013, 3, 2249 CrossRef.
- P. F. Li, Y. Y. Tang, Z. X. Wang, H. Y. Ye, Y. M. You and R. G. Xiong, Nat. Commun., 2016, 7, 13635 CrossRef CAS.
- H. Y. Ye, Y. Y. Tang, P. F. Li, W. Q. Liao, J. X. Gao, X. N. Hua, H. Cai, P. P. Shi, Y. M. You and R. G. Xiong, Science, 2018, 361, 151–155 CrossRef CAS.
- Z. Sun, T. Chen, J. Luo and M. Hong, Angew. Chem., Int. Ed., 2012, 51, 3871–3876 CrossRef CAS.
- P. F. Li, W. Q. Liao, Y. Y. Tang, W. Qiao, D. Zhao, Y. Ai, Y. F. Yao and R. G. Xiong, Proc. Natl. Acad. Sci. U. S. A., 2019, 116, 5878–5885 CrossRef CAS.
- H. Y. Ye, W. Q. Liao, Q. H. Zhou, Y. Zhang, J. L. Wang, Y. M. You, J. Y. Wang, Z. N. Chen, P. F. Li, D. W. Fu, S. P. D. Huang and R. G. Xiong, Nat. Commun., 2017, 8, 14551 CrossRef CAS.
- T. Hang, W. Zhang, H. Y. Ye and R. G. Xiong, Chem. Soc. Rev., 2011, 40, 3577–3598 RSC.
- Y. Y. Tang, P. F. Li, W. Q. Liao, P. P. Shi, Y. M. You and R. G. Xiong, J. Am. Chem. Soc., 2018, 140, 8051–8059 CrossRef CAS.
- J.-X. Gao, Z.-X. Wang, Y.-Y. Tang, Y.-L. Liu, L. Zhou, X.-G. Chen, W.-Y. Zhang and R.-G. Xiong, J. Mater. Chem. C, 2019, 7, 11022–11028 RSC.
Footnotes |
| † Electronic supplementary information (ESI) available. CCDC 1950605–1950608. For ESI and crystallographic data in CIF or other electronic format see DOI: 10.1039/c9qi01197h |
| ‡ These authors contributed equally to this work. |
|
| This journal is © the Partner Organisations 2020 |
Click here to see how this site uses Cookies. View our privacy policy here. 
 ,
Zhong-Xia
Wang
,
Zhong-Xia
Wang