Polymorphs, phase transitions and stability in BaM2(PO4)2 M = Mn, Fe, Co systems†
Bastien
Leclercq
,
Houria
Kabbour
,
Angel
Arevalo-Lopez
 ,
Marielle
Huvé
,
Sylvie
Daviero-Minaud
,
Marielle
Huvé
,
Sylvie
Daviero-Minaud
 ,
Claire
Minaud
,
Ignacio
Blazquez Alcover
and
Olivier
Mentré
,
Claire
Minaud
,
Ignacio
Blazquez Alcover
and
Olivier
Mentré
 *
*
UCCS, UMR-CNRS 8181, Université Lille-ENSCL, Avenue Mendeleiev, 59655 Villeneuve d'Ascq, France. E-mail: olivier.mentre@ensc-lille.fr
First published on 11th October 2019
Abstract
BaM2(PO4)2 (M2+ transition metals) compounds display a variety of polymorphs; among those, the well-known rhombohedral γ-form stands at the origin of a series of (quasi)2D-magnetic behaviors intensively studied in the last few decades. We have prepared original α-variants for M = Fe2+ and Mn2+ and investigated their stabilities and sequence of phase transitions by analogy to the already reported M = Co2+ case. Heating the α-phases leads to a variety of structural rearrangements between α, α′ and β variants, according to unified 1st order reconstructive transitions. However, spontaneous long-time transformations under ambient conditions α → γ (Fe case) versus γ → α (Co case) denote a contrasted hierarchy of stable compounds verified by DFT calculations. Interestingly, in α-BaFe2(PO4)2 the quasi triangular Fe2+O3+2 coordination is rarely observed and relies on one very short Fe–O distance of ca. 1.78 Å, destabilizing the edifice in favor of the most stable FeO6 in the γ-type, as verified by Crystal Orbital Hamilton Population (COHP) analysis.
1. Introduction
We have recently investigated the BaCo2(PO4)2 (BCoPO) phase diagram which highlights the efficient role of large Ba2+ cations and phosphate groups as spacers, templating a number of bi-dimensional (2D) crystal structures.1 Among the phases present, the so-called γ-BCoPO belongs to the well-known series of layered honeycomb lattice compounds with quasi 2D-magnetic properties such as a quasi 2D-XY behavior with a competition between two magnetic structures below Tc1 = 7 K and Tc2 = 3.8 K with distinct spin arrangements between in-plane ferromagnetic chains.2 Other metastable α, β, β′, β′′ and ε-BCoPO polymorphs are obtained among various thermal treatments, through phase transitions. Generally speaking, most α, β, and ε phases are in competition and show a rearrangement between corner-sharing Co2+O5 inside labile layers. One intriguing feature concerns the spontaneous transformation of the metastable rhombohedral γ-BCoPO with its honeycomb lattice of octahedral Co2+O6 into its monoclinic stable α-variant with Co2+O5 trigonal bipyramids (TBP) under ambient conditions.3 This “puzzling phase diagram” motivated us to investigate and rationalize similar phase diagrams with various M2+ transition metals M = Mn, Fe, Co, Ni. For M = Ni2+, the situation is rather simple due to the stabilization of Ni2+ (d8, S = 1) cations in octahedral crystal fields, leading to stable γ-BaNi2(XO4)2 (X = P, V and As) only.3,4 In contrast, the Fe2+ case deserves special attention, dealing with γ-BaFe2(PO4)2 (BFePO), a unique case of a S = 2 2D-ising ferromagnet5 assorted with a magnetically driven re-entrant transition at low temperature.6 This compound was solely prepared under hydrothermal conditions which questions the existence of other polymorphs. Such compounds could pave the way to an “easy” solid state route to single phase BFePO but also to mixed Fe/M compounds (M = Ni, Co), so far fastidiously prepared under solvothermal conditions with a poor control on the Fe/M ratio.7–9 Finally, for M = Mn2+ only two stoichiometric compounds are reported in the BaO–MnO–P2O5 system, i.e. Ba2Mn(PO4)2 and BaMn(P2O7) with 3D lattices and disconnected MnO5+1 polyhedra.10 Here the large Mn2+ ionic radius (0.83 Å) plays against a honeycomb lattice compatible with the PO4 and Ba2+ interlayer. For instance, in triangular brucite-Mn(OH)2, the edge-sharing Mn2+–Mn2+ distance is 3.32 Å, poorly compatible with the M–M distance in γ-BMPO phases, e.g. Fe2+–Fe2+, Co2+–Co2+ = 2.81 Å and Ni2+–Ni2+ = 2.77 Å. Here we prepared high temperature BaM2(PO4)2 (M = Fe, Mn) polymorphs by a solid state route and investigated their thermal behaviors, phase transitions and preliminary high pressure transformations and DFT calculations leading to the establishment of antagonist phase stabilities in this complex family.2. Methods
2.1 Powder XRD data
Room-temperature powder X-ray diffraction (XRD) was carried out on a Bruker D8 Advance diffractometer with a Bragg–Brentano geometry using monochromatic CuKα radiation in the range 2θ = (5–80)° with 0.02° steps and 0.5 seconds per step. Sample purity was checked on the resulting scan using Diffrac.Eva software.Synchrotron measurements were performed at room temperature in the I11 beamline (λ = 0.824899 Å) at Diamond in the range 2θ = (2–92) ° with 0.004° steps on BaFe2P2O8 and BaMn2P2O8 powder placed into a 0.5 mm glass capillary. Structures were solved and refined from these data using the FULLPROF suite11 and JANA 2006 software.12
2.2 Magnetic measurements
Magnetic data and heat capacities were measured on a physical property measurement system (PPMS) Dynacool (9T) system from Quantum Design, using ground powder of BaFe2P2O8 and BaMn2P2O8. We performed typical measurements using zero field cooling (ZFC) and field cooling (FC) procedures under various fields (0.05 T, 0.1 T). Magnetization versus H was measured between −9 and 9T at various temperatures. Specific heat was measured without a magnetic field using BaMn2P2O8 and BaFe2P2O8 materials pressed into pellets.2.3 Thermal analysis
Thermogravimetric analysis (TGA) was carried out on a thermoanalyzer Setsys Evolution SETARAM device upon heating and cooling under an air or flowing argon atmosphere at a ramp rate of 5 K min−1 up to 1273 K on ground powder. XRD was performed on the resulting products. High temperature X-ray diffraction (HTXRD) was performed using a D8 Advance Bruker instrument equipped with an XRK900 chamber under flowing air or argon, on ground powder. Each powder pattern was recorded in the range of 10–80° (2θ) (step ΔT = 50 K, 30 min per scan) from room temperature up to 1273 K. Reversibility was checked for each experiment upon cooling.2.4 Density functional theory (DFT) calculations – computational methods
DFT calculations were carried out using the Vienna ab initio simulation package (VASP)13 by employing the projector augmented wave (PAW)14,15 method and the generalized gradient approximation of Perdew, Burke and Ernzerhof (PBE) for the exchange–correlation functionals.16 GGA+U calculations were employed with U = 4 in the case of BaCo2P2O8 and BaMn2P2O8 and U = 6 eV in the case of BaFe2P2O8 following the previous work.5 For the structural optimizations, a plane wave cutoff energy of 550 eV (400 eV for the total energy calculations) was used. For accurate total energies, the threshold of self-consistent-field energy convergence was set to 10−6 eV. See Table S11a† for details.2.5 IR and UV-visible spectroscopy
Infrared spectroscopy measurements were performed on a PerkinElmer Spectrum 2 device, equipped with a diamond attenuated total reflectance (ATR) accessory. Samples (ground powder) were measured between 4000 and 400 cm−1. No ATR corrections were applied on the spectrum. UV-visible measurement was performed on a PerkinElmer Precisely Lambda 650 Spectrometer device, using an STD Detector module and a HARRICK Praying Mantis Sampling Kit. The measurement was performed between 900 and 250 nm.2.6 SEM and TEM microscopy
Energy dispersive X-Ray spectrometry (EDS) analysis was performed on powder pressed onto a pellet placed on a carbon tape and introduced in a field-emission gun scanning electron microscope (SEM) HITACHI S4700 device equipped with an Energy-dispersive X-Ray detector, operating at 20 kV electron beam energy. The EDS analysis is given from the average of several different point acquisitions. An electron diffraction study was performed on an FEI Tecnai G2-20 twin Transmission Electron Microscope (TEM). The powder was crushed and dropped in the form of an alcohol suspension on carbon supported copper grids followed by evaporation under ambient conditions.2.7 Solid state synthesis
The original α-BFePO and α-BMnPO have been prepared by a solid state route under a controlled atmosphere, from mixtures of BaCO3, Fe, Fe2O3, NH4H2PO4 (3![[thin space (1/6-em)]](https://www.rsc.org/images/entities/char_2009.gif) :
:![[thin space (1/6-em)]](https://www.rsc.org/images/entities/char_2009.gif) 2
2![[thin space (1/6-em)]](https://www.rsc.org/images/entities/char_2009.gif) :
:![[thin space (1/6-em)]](https://www.rsc.org/images/entities/char_2009.gif) 2
2![[thin space (1/6-em)]](https://www.rsc.org/images/entities/char_2009.gif) :
:![[thin space (1/6-em)]](https://www.rsc.org/images/entities/char_2009.gif) 6 ratio, total mass = 7 g) and BaCO3, MnO and NH4H2PO4 (1
6 ratio, total mass = 7 g) and BaCO3, MnO and NH4H2PO4 (1![[thin space (1/6-em)]](https://www.rsc.org/images/entities/char_2009.gif) :
:![[thin space (1/6-em)]](https://www.rsc.org/images/entities/char_2009.gif) 1
1![[thin space (1/6-em)]](https://www.rsc.org/images/entities/char_2009.gif) :
:![[thin space (1/6-em)]](https://www.rsc.org/images/entities/char_2009.gif) 2 ratio, total mass = 7 g) at 1190 K either in an evacuated silica tube or under flowing argon for Fe2+ and under argon for Mn2+.
2 ratio, total mass = 7 g) at 1190 K either in an evacuated silica tube or under flowing argon for Fe2+ and under argon for Mn2+.
3. Results
3.1 Crystal structures of α-variants
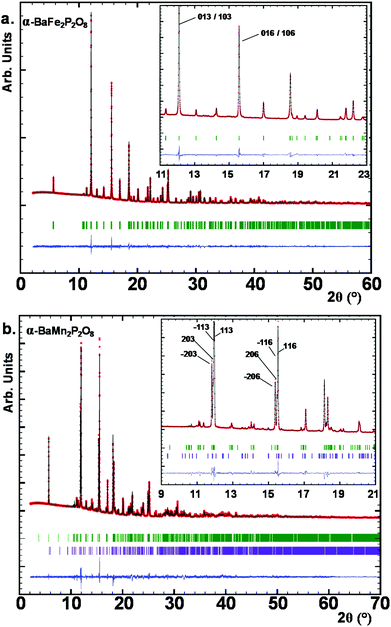
Here the so-called α-form refers to the high temperature route, by analogy to the BCoPO case,1 see Fig. 2. We also used the same analogy for β and γ labels of the Fe and Mn variants. α′ and β′ polytypes were identified in situ and verified by DTA, but have not been structurally characterized. Their crystal structures have been refined using room temperature synchrotron data collected at Diamond (see Fig. 1a), l11 beamline, λ = 0.824899 Å, see Tables S1 and S2† for refinement data for both structures (including atomic positions and equivalent thermal displacement).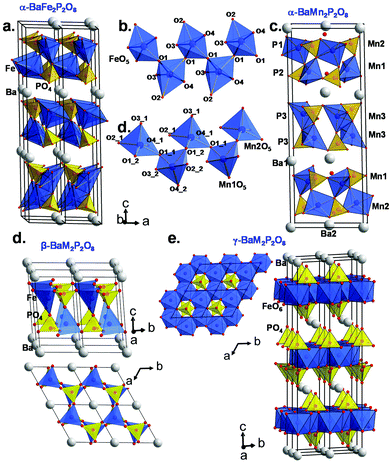 | ||
| Fig. 2 (a) α-BaFe2P2O8 crystal structure and (b) the infinite zigzag chains of TBP sharing corners. (c) α-BaMn2P2O8 crystal structure and (d) selected zigzag chains of MnO5 square pyramids. (e and f) show the β- and γ-BaM2P2O8 variants respectively based on the cobalt case (ref. 1). | ||
| Ba | Fe | P | |||
| Ba1–O2 | 2.421(5) | Fe1–O1 | 2.057(4) | P1–O1 | 1.530(4) |
| Ba1–O2 | 2.421(5) | Fe1–O1 | 2.524(6) | P1–O2 | 1.476(6) |
| Ba1–O3 | 2.972(4) | Fe1–O1 | 2.911(7) | P1–O3 | 1.559(5) |
| Ba1–O3 | 2.972(4) | Fe1–O2 | 2.589(6) | P1–O4 | 1.578(7) |
| Ba1–O4 | 2.633(5) | Fe1–O3 | 2.072(4) | ||
| Ba1–O4 | 2.633(5) | Fe1–O4 | 1.767(4) | ||
| BVS Ba1 | 2.48(2) | BVS Fe1 | 1.99(2) | BVS P1 | 4.84(3) |
| BVS O1 | 1.80(1) | BVS O2 | 2.21(2) | BVS O3 | 1.69(2) |
| BVS O4 | 2.38(2) | ||||
| Ba | Mn | P | |||
| Ba1–O2_2 | 2.994(6) | Mn1–O1_1 | 2.055(5) | P1–O1_1 | 1.544(5) |
| Ba1–O2_2 | 2.719(6) | Mn1–O1_2 | 2.301(8) | P1–O2_1 | 1.512(5) |
| Ba1–O3_2 | 2.996(7) | Mn1–O2_2 | 2.448(7) | P1–O3_1 | 1.539(6) |
| Ba1–O4_2 | 2.780(5) | Mn1–O3_2 | 2.032(5) | P1–O4_1 | 1.530(6) |
| Ba1–O2_3 | 3.057(8) | Mn1–O4_2 | 1.958(6) | ||
| Ba1–O2_3 | 2.766(7) | P2–O1_2 | 1.546(6) | ||
| Ba1–O3_3 | 2.732(7) | Mn2–O1_1 | 2.233(7) | P2–O2_2 | 1.528(7) |
| Ba1–O4_3 | 2.531(5) | Mn2–O2_1 | 2.229(8) | P2–O3_2 | 1.543(5) |
| Mn2–O3_1 | 2.217(9) | P2–O4_2 | 1.485(5) | ||
| Ba2–O2_1 | 2.692(7) | Mn2–O4_1 | 2.133(6) | ||
| Ba2–O2_1 | 2.692(7) | Mn2–O1_2 | 2.212(6) | P3–O1_3 | 1.523(5) |
| Ba2–O3_1 | 2.822(6) | P3–O2_3 | 1.524(6) | ||
| Ba2–O3_1 | 2.822(6) | Mn3–O1_3 | 2.463(8) | P3–O3_3 | 1.528(5) |
| Ba2–O4_1 | 2.518(7) | Mn3–O1_3 | 2.184(6) | P3–O4_3 | 1.546(6) |
| Ba2–O4_1 | 2.518(7) | Mn3–O2_3 | 2.422(7) | ||
| Mn3–O3_3 | 2.144(7) | ||||
| Mn3–O4_3 | 2.050(7) | ||||
| BVS Ba1 | 2.08(2) | BVS Ba2 | 2.20(2) | ||
| BVS Mn1 | 2.06(2) | BVS Mn2 | 1.64(2) | BVS Mn3 | 1.60(2) |
| BVS P1 | 5.04(4) | BVS P2 | 5.13(4) | BVS P3 | 5.06(4) |
| BVS O1_1 | 2.01(2) | BVS O1_2 | 1.78(2) | BVS O1_3 | 1.82(2) |
| BVS O2_1 | 1.97(2) | BVS O2_2 | 1.90(2) | BVS O2_3 | 1.86(2) |
| BVS O3_1 | 1.78(2) | BVS O3_2 | 1.89(2) | BVS O3_3 | 1.96(2) |
| BVS O4_1 | 2.19(2) | BVS O4_2 | 2.33(2) | BVS O4_3 | 2.22(2) |
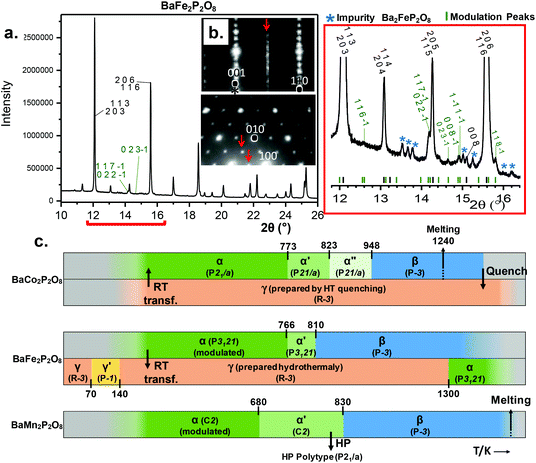
 (2a, b, 2c supercell, referred to the trigonal subcell) in both α-BFePO and α-BMnPO as observed by electron diffraction, see Fig. 3(b) for the α-BFePO case. In the Fe2+ case, the q vector is incompatible with the trigonal symmetry, which suggests for the two compounds the 4D-monoclinic C2(0, ½, ½)0 superspace group. However very weak supercell spots have been only identified in SXRD data (not in PND), see Fig. 3(a) which questions their real origin and correlation length. Our attempts to observe and refine any kind of modulated feature on all atoms using a super-space approach failed, leaving a constant electronic density along the fourth dimension, such that at this stage the refined average structure prevails. Indeed, one has to keep in mind that the “average structure” may be erroneous, due to local, medium- or long-range ordering. In particular, the DFT structural relaxation discussed below may lack the 2a, b, 2c supercell ordering, for a representative optimized structure.
3.2 Phase transitions
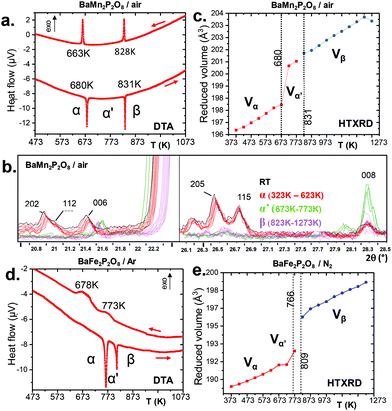
We have investigated the stabilities and phase transformations occurring in BMPO, keeping in mind the complex BCoPO behavior that motivated this work, see Fig. 3(c), and S8a† for more information about cell parameters.1At this stage, within the Fe2+ and Mn2+ series, taking into account our relaxed structures detailed below, we assume that the modulated features are lost in both the α′ and β variants.
3.3 Phase stability: – DFT calculation
We have performed electronic structure and total energy calculations by GGA and GGA+U for both the α and γ variants of BMPO compounds. Several results should be pointed out.(i) Constraining the experimental unit cells for α-BMnPO and α-BFePO yields models not fully compatible with our α experimental diffraction data. Indeed, after simulation of the XRD patterns corresponding to the DFT optimized structures, we found them very similar to those observed in situ at high temperature in the α′ domain, see S10.† For instance after relaxing α-BFePO under the conditions given in S11a† using GGA+U (U = 6 eV), with the Hubbard term U used at the relaxation level since it has been reported to allow more accurate geometry optimizations in several magnetic systems, the calculated XRD pattern clearly shows misestimated reflections (015, 112, 118, 11 10 …), see S9d† compared to our experimental data (α-form), see Fig. S9(a–c).† The intensities of these specific reflexions are significantly lowered at the α → α′ transition, such that surprisingly an α′ related model is obtained after convergence. Generally speaking, more regular MO5 polyhedra are obtained after relaxation but associated with strong BVS deviations compared to expected values for M2+, P5+, and O2− charges, see Table S11b.† One should deduce the primary importance of the 2a, b, 2c ordering in the real α-model. Finally, the total energy was calculated using the α refined average model at room temperature. Considering ΔG = ΔE + PΔV − TΔS for a transition, the PΔV term may be neglected considering solids and TΔS = 0 since our DFT calculations are at zero kelvin. Then, ΔG = ΔE and we use the DFT total energies to evaluate the relative stability within each title system.
(ii) Comparing the total energies of experimental α and γ models and neglecting minor ΔV and entropic effects shows that for BFePO/U = 6 eV: ΔGγ–α = −0.85 eV per FU and for BCoPO/U = 4 eV: ΔGα–γ = −1.07 eV per FU validating the observed transformations under ambient conditions, see S11a.† We note the very strong energy differences involved compared to phosphate systems, e.g. VOPO4.20
(iii) For the hypothetical γ-BMnPO, the full-structure relaxation at U = 4 eV gives an unrealistic model, with BVS (Mn) ∼3+, and BVS (P) ∼4.5+, see Table S11b.† The most stable α-form is verified by: ΔUα–γ = −1.01 eV per FU.
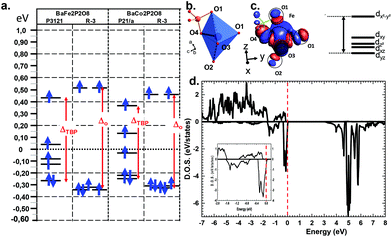
Deeper investigations have been performed combining extended Hückel tight binding calculations (EHTB) on the Fe2+ and Co2+ α and γ-polytypes. EHTB give a rough image of the crystal field and have been used in γ-BFePO compounds to explain the origin of the re-entrant transition.6 For the α-types, we have used an isolated MPO7 unit to take into account the M–P vicinity, see Fig. 5b. The d splitting deduced from molecular orbitals is shown in Fig. 5a. In α-BFePO, the role of the Fe–O4 bond is rather atypical due to the particularly short distance Fe–O4 = 1.776 Å. It leads to a σ* bond calculated ∼0.5 eV above the d6 barycenter. This simple vision is comforted by the Fe total 3d-DOS projection using (U = 6 eV) for which the majority spin (↑) contribution has the particularity of being disrupted below EF, see Fig. 5d.5 These projected DOS on 3d-Fe show also that the majority spins (↑) are fully occupied while the minority spins (↓) are partially empty in accordance with a high spin state and the expected oxidation state Fe2+. The highest d-based atomic orbital (EHTB) and the highest populated ↑d-states clearly correspond to a predominant dxy contribution in reference with the crystal axes. The three in-plane oxygen ligands along the x and y axes were assigned to this dx2−y2 setting, see Fig. 5c and S12† for details about orbital representation. This configuration is plausibly strongly destabilizing compared to the standard octahedral crystal field calculated for FeO6 in γ-BFePO. A rough calculation of the crystal field stabilization energy (CFSE) for d6 HS-Fe2+ shows similar results mostly in favor of octahedra against TBP (0.4ΔOvs. 0.38ΔTBP). The same calculation for d7 HS-Co2+ phases gave the same tendency (0.79ΔOvs. 0.76ΔTBP) and does not match the higher stability of α-BCoPO, which also takes into account the on-site electrostatic repulsion above all with mainly a 3D arrangement. At least, these calculations validate comparable d-manifold splitting, and the stability of the observed phases.
More insights into the bonding situation are given by the COHP (Crystal Orbital Hamilton Population) analysis carried out using the LOBSTER21–23 software and the results are shown for the shortest Fe–O4 bond and for a longer “standard” Fe–O1 bond for comparison. The majority spin (↑) COHP is bonding in the lower VB part while it is antibonding close to the Fermi level, with a much larger antibonding contribution at EF for Fe–O4. It highlights the instability suggested above compared to “standard” Fe–O bonds. The minority spin (↓) COHP however is mostly bonding in the all VB range for both Fe–O bonds stabilizing for the edifice. We note that very close to EF this contribution is nonbonding. This is also obvious from the Fe–O integral COHPs (ICOHP) (see Table S11c†) which are all of net bonding character with significantly higher values for the minority spin population. However, this is much more pronounced in the case of the short Fe–O bond with ICOHP (↑) = −1.044 eV and the stronger bonding character of ICOHP (↓) = −1.627 eV then giving a strong covalent bond with electronic instability to the Fermi level (Fig. 6).
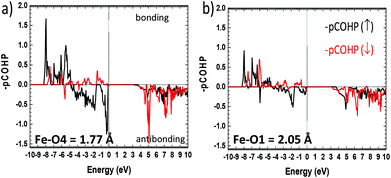 | ||
| Fig. 6 Fe–O projected COHP (pCOHP) for (a) the short Fe–O4 and (b) for next longer Fe–O1 distances Å. The bonding (antibonding) interactions are set positive (negative) by convention. | ||
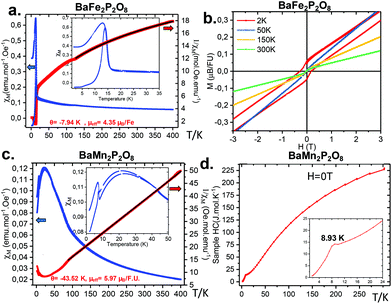
3.4 Magnetic characterisation
4. Conclusion
In conclusion, the BaM2(PO4)2 system phase diagram was investigated in this work, as well as the magnetic properties of the novel α form dealing with M = Mn2+ and Fe2+. They show particularly complex phase diagrams with α, β, and γ variants all based on layered architectures, and weak ferromagnetism. This specificity arises from the strong tendency of large Ba2+ to favor 2D-structures while associated with oxo-anions. The α → α′ → β transitions are order disorder ones, suggesting a diversity of related structural polymorphs already well characterized in the M = Co2+ case. They consist of MO5 polyhedra that vary from TBP to square-pyramids depending on M. The TBP Fe2+O5 in α-BFePO is not common, especially dealing with a particularly short Fe–O bond of 1.77 Å. Similarly we found rather short Mn–O distances in α-BMnPO which suggest stressed α-types likely for high temperature transitions, comforting the experimental lattice expansion across the α → α′ → β transitions. The internal constraints evidenced from interatomic distances and bond valence sums are probably relaxed locally by commensurate modulations, evidenced as k = (½, 0, ½) by electron microscopy, but possibly associated with short/medium correlation lengths. This feature is important since, in the absence of a “supercell-box”, our structural optimizations did not converge to the stable α models but rather to the α′ ones. For Co2+ and Fe2+, a strong competition exists between these variants and the so-called γ one characterized by isolated Honeycomb octahedral layers. Dealing with quasi-2D magnetic compounds, they are of strategical importance in the field of low-D magnets, but prepared under different conditions compared to the α-variants, i.e. solvothermal conditions for γ-BFePO and melting/quenching for γ-BCoPO. In fact, the relative stabilities of the α/γ tandem under ambient conditions are reversed between the Co2+ and Fe2+ cases such that after a long-time stay (>1 year) in the desiccator, α-BFePO partially transforms into the rhombohedral γ-BFePO (α → γ) while, an opposite γ → α long-time transformation occurs for BCoPO. These transformations verified the energies calculated for each compound. In the case of γ-BFePO we propose that the short Fe–O distance mentioned above destabilizes the α type for the γ one. Finally, one could consider these room temperature transformations as opportunities to prepare mixed γ-BaFe/MPO phases using a solid state route with a strict control of the Fe/M ratio. We recall that so far, these phases are prepared under hydrothermal conditions with a poor stoichiometric control.Conflicts of interest
The authors declare no competing financial interest.Acknowledgements
This work was carried out under the framework of the LOVE-ME project supported by the ANR (Grant ANR ANR-16-CE08-0023). The Fonds Européen de Développement Régional (FEDER), CNRS, Région Hauts-de-France and Ministère de l'Education Nationale, de l'Enseignement Supérieur et de la Recherche are acknowledged for funding the X-ray diffractometers and PPMS equipment. Chevreul Institute (FR 2638), Ministère de l'Education Nationale, de l'Enseignement Supérieur et de la Recherche, Région Hauts-de-France, FEDER are acknowledged for supporting this work. We thank Laurence Burylo, Nora Djelal and Claire Minaud at the UCCS for their technical help.References
- R. David, H. Kabbour, A. Pautrat and O. Mentré, Inorg. Chem., 2013, 52, 8732–8737 CrossRef CAS.
- Magnetic Properties of Layered Transition Metal Compounds, ed. L. J. de Jongh, 1990, vol. 9 Search PubMed.
- L. P. Regnault, J. Y. Henry, J. Rossat-Mignod and A. De Combarieu, J. Magn. Magn. Mater., 1980, 15–18, 1021–1022 CrossRef CAS.
- N. Rogado, Q. Huang, J. W. Lynn, A. P. Ramirez, D. Huse and R. J. Cava, Phys. Rev. B: Condens. Matter Mater. Phys., 2002, 65, 144443 CrossRef.
- H. Kabbour, R. David, A. Pautrat, H. Koo, M. Whangbo, G. André and O. Mentré, Angew. Chem., Int. Ed., 2012, 51, 11745–11749 CrossRef CAS PubMed.
- R. David, A. Pautrat, D. Filimonov, H. Kabbour, H. Vezin, M.-H. Whangbo and O. Mentré, J. Am. Chem. Soc., 2013, 135, 13023–13029 CrossRef CAS.
- I. Blazquez Alcover, S. Daviero-Minaud, R. David, D. Filimonov, M. Huvé, J. P. Attfield, H. Kabbour and O. Mentré, Inorg. Chem., 2015, 54, 8733–8743 CrossRef CAS.
- A. M. L. Lopes, G. N. P. Oliveira and S. Ferdov, Solid State Sci., 2013, 26, 59–64 CrossRef CAS.
- N. Faza, W. Treutmann and D. Babel, Z. Anorg. Allg. Chem., 2002, 627, 687–692 CrossRef.
- R. D. Adams, R. Layland and C. Payen, Polyhedron, 1996, 15, 1235–1239 CrossRef CAS.
- J. Rodríguez-Carvajal, Phys. B, 1993, 192, 55–69 CrossRef.
- V. Petříček, M. Dušek and L. Palatinus, Z. Kristallogr. – Cryst. Mater., 2014, 229(5), 345–352 Search PubMed.
- J. F. G. Kresse, Vienna Simulation Package (VASP), Inst. für Mater., Vienna, 2012.
- P. E. Blöchl, Phys. Rev. B: Condens. Matter Mater. Phys., 1994, 50, 17953–17979 CrossRef.
- G. Kresse and D. Joubert, Phys. Rev. B: Condens. Matter Mater. Phys., 1999, 59, 1758–1775 CrossRef CAS.
- J. P. Perdew, K. Burke and M. Ernzerhof, Phys. Rev. Lett., 1996, 77, 3865–3868 CrossRef CAS.
- C. Masquelier and L. Croguennec, Chem. Rev., 2013, 113, 6552–6591 CrossRef CAS.
- S. Eymond, C. Martin and A. Durif, Mater. Res. Bull., 1969, 4, 595–599 CrossRef CAS.
- J. Dojčilović, M. M. Napijalo, L. Novaković and M. L. Napijalo, Mater. Chem. Phys., 1990, 26, 339–345 CrossRef.
- W. Sun and J. Du, Comput. Mater. Sci., 2017, 126, 326–335 CrossRef CAS.
- S. Maintz, V. L. Deringer, A. L. Tchougréeff and R. Dronskowski, J. Comput. Chem., 2016, 37, 1030–1035 CrossRef CAS.
- V. L. Deringer, A. L. Tchougréeff and R. Dronskowski, J. Phys. Chem. A, 2011, 115, 5461–5466 CrossRef CAS.
- R. Dronskowski and P. E. Bloechl, J. Phys. Chem., 1993, 97, 8617–8624 CrossRef CAS.
Footnote |
| † Electronic supplementary information (ESI) available: More detailed crystallographic information (with powder refinement datas, atomic positions and equivalent anisotropic thermal displacement) EDS analysis, UV visible and IR spectroscopy, thermal analysis (HTXRD, and DTA/TGA), cell parameter evolution and phase transition upon heating, synchrotron refineùent, DFT calculations, density-of-states calculations, magnetic measurement and specific heat measurement; X-ray crystallographic data. CCDC 1942484 for α-BaFe2(PO4)2 and 1942500 for α-BaMn2(PO4)2. For ESI and crystallographic data in CIF or other electronic format see DOI: 10.1039/c9qi00934e |
| This journal is © the Partner Organisations 2020 |

