 Open Access Article
Creative Commons Attribution 3.0 Unported Licence
Synthesis of two-phase polymer particles in supercritical carbon dioxide†
Alice J.
Haddleton
 a,
Thomas M.
Bennett
 a,
Xinyong
Chen
b,
Rachel L.
Atkinson
 a,
Vincenzo
Taresco
 a and
Steven M.
Howdle
 *a
*a
aSchool of Chemistry, University of Nottingham, Nottingham, NG7 2RD, UK. E-mail: steve.howdle@nottingham.ac.uk
bSchool of Pharmacy, University of Nottingham, Nottingham, NG7 2RD, UK
First published on 8th July 2020
Abstract
The synthesis of particles with discrete phases using traditional emulsion polymerisation is a well-established process. Phase-separated particles have a wide range of applications, such as in coatings, drug delivery, impact modification and as supports in catalysis. However, as a dry powder is often desired for the end application, post-polymerisation, energy intensive drying steps are usually required for the removal of water. Alternatively, dispersion polymerisation utilising supercritical carbon dioxide (scCO2) as a reaction medium allows for the production of dry, free-flowing powders upon release of the CO2. Here, we present the innovative use of scCO2 to provide a novel and environmentally acceptable route for creating phase-separated particles. Particles containing a high Tg poly(methyl methacrylate) (PMMA) phase, combined with a low Tg polymer phase of either poly(benzyl acrylate) (PBzA) or poly(butyl acrylate) (PBA), were investigated. Both monomers were added to the reaction after the formation of PMMA seed particles. Benzyl acrylate (BzA) was chosen as a model low Tg monomer, with well-defined and detectable functionality when mixed with PMMA. Butyl acrylate (BA) was also used as an alternative, more industrially relevant monomer. The loading of the low Tg monomer was varied and full characterisation of the particles produced was performed to elucidate their internal morphologies and compositions.
Introduction
Supercritical carbon dioxide (scCO2) is a sustainable reaction medium for polymerisations and is a promising alternative to conventional solvents. This is because of its tuneable properties, high natural abundance and easily accessible critical point; Tc = 31.1 °C and pc = 73.8 bar.1,2 CO2 is also inexpensive, non-toxic, non-flammable and is readily available in high purity. These properties, coupled with the fact that scCO2 reverts to its gaseous state upon depressurisation, eliminating energy intensive drying steps, make it a desirable solvent for polymerisations.3 In 1992, DeSimone et al. published the first polymerisation utilising scCO2 as a reaction medium, reporting the synthesis of fluoropolymers.4 Since then, many different polymerisations including free radical chain growth, cationic chain growth, oxidative coupling, transition metal catalysis and melt phase condensation have been carried out employing scCO2 as the solvent, with vinyl monomers predominantly being used.3,5–10More specifically, scCO2 has been shown to be a versatile medium for dispersion polymerisation, facilitated by the use of amphiphilic surfactants including fluoro-polymers and polysiloxanes, which are soluble in scCO2.11 Recently, increasingly more sophisticated chemistries have been reported using scCO2 as a reaction medium. The three most widely used reversible-deactivation radical polymerisation (RDRP) techniques; nitroxide-mediated radical polymerisation (NMP), atom transfer radical polymerisation (ATRP) and reversible addition–fragmentation chain transfer polymerisation (RAFT), have all been used to synthesise well-defined particles with narrow size distributions.12–16 These techniques can give access to more complex structures including cross-linking,17 incorporation of metal nanoparticles,18 and more recently block copolymer particles with internal phase separation.19–21
Particles with phase-separated internal morphologies are usually synthesised via emulsion-based techniques, typically with size between 60–700 nm.22,23 Many different internal morphologies have been achieved using emulsion polymerisation, including core–shell. The changes in internal morphology observed occur by variation of several different parameters, such as manipulation of particle size, monomer ratio and tuning of the reaction medium.24,25 However, the products are obtained in the form of a latex and energy intensive steps (e.g. spray drying) are needed for the removal of water, to afford a dry powder.26 Dispersion polymerisation in scCO2 produces dry, free-flowing powders upon release of the CO2 post polymerisation. Employing dispersion polymerisation also allows for synthesis of particles between 0.5–5 μm, relatively large in comparison to those produced by emulsion polymerisation.27 Although there is an energy cost associated with the compression of the CO2 used in the supercritical reactions, this is an order of magnitude lower that the cost associated with the removal of water.28
There are several examples of copolymer particles, synthesised in scCO2, which exhibit micro-phase separation to give various internal particle morphologies.19–21,29 Cao et al. described the preparation of graft copolymer nanoparticles in scCO2 from a one-step polymerisation. Particles of thermo-responsive poly(N-isopropylacrylamide) (PNIPAM) were synthesised with the assistance of a synthetic, graft copolymer surfactant consisting of pH-sensitive, poly(dimethylsiloxane)-graft-polyacrylates (PDMS-g-PAA). The polymers obtained were fine, free-flowing powders with monodispersed nano-sized particles being formed. The structure was confirmed as a PNIPAM core coated in a PDMS-g-PAA shell by TEM.30
When using homopolymers rather than copolymers, a core–shell structure is typically achieved, in which one polymer phase is encased in another. Core–shell polymeric particles are desirable for a wide range of applications such as drug delivery,31 electrophoretic displays,32 and as impact modifiers.33
McAllister et al. reported the synthesis of core–shell particles consisting of poly(2-(dimethyl amino) ethyl methacrylate) (PDMAEMA) and PMMA via a multi-stage dispersion polymerisation.32 PMMA particles were modified in scCO2 to give a core–shell morphology with domains of PDMAEMA within PMMA. By contrast, particles synthesised in traditional solvents produced the inverse of this, with a core of PMMA surrounded by a shell of PDMAEMA. The observed difference in structure was attributed to the ability of scCO2 to plasticise the PMMA, allowing the DMAEMA monomer, and therefore the growing polymer, to penetrate the particles. This plasticisation does not readily occur in traditional solvents and hence, the PDMAEMA remains at the surface of the particles.
Here, we report the synthesis of particles containing both a polymer phase with a low glass transition temperature (Tg); either poly(butyl acrylate) (PBA) or poly(benzyl acrylate) (PBzA), combined with a high Tg poly(methyl methacrylate) (PMMA) phase. Both PBzA and PBA exhibit relatively low Tgs of 2 °C and −45 °C respectively, as measured by DMA, in comparison to PMMA (144 °C). This value is higher than the Tg of PMMA measured by DSC, often reported in literature as 105 °C.34,35 However, differences between the values obtained from the two analytical techniques do occur because of the intrinsic difference between the static DSC and the dynamic DMA measurement, resulting in the DSC observed Tgs being lower in absolute values.36 The particles were formed by incorporation of the low Tg monomers to preformed PMMA particles via a simple two-step free radical polymerisation. BzA was chosen as a model low Tg monomer, with well-defined and detectable functionality when mixed with PMMA. Notably, the PBzA phase can be selectively stained prior to TEM analysis due to the presence of the aromatic group. BA as an alternative low Tg monomer was also investigated, as it is more traditionally used in commercial polymers. In both systems, the low Tg monomer loading was varied and a series of analytical techniques were used to probe and confirm the morphologies and compositions of the particles produced. Particles that combine both low and high Tg polymer phases can be used as impact modifiers.37,38
Experimental
Materials
Methyl methacrylate (MMA, ProSciTech, 99%), 2,2′-Azobis(isobutryronitrile), benzyl acrylate (BzA, Alfa Aesar, 98%), butyl acrylate (BA, BASF), (AIBN, Sigma Aldrich, 98%), and methacrylate terminated polydimethylsiloxane (PDMS-MA, 150–200 cP, ABCR GmbH & Co.) were all used as received. All reactions were carried out in SCF grade 4.0 CO2 (≥99.99%, BOC special gases).Polymer synthesis in 60 mL autoclave
All reactions were performed in a 60 mL high-pressure autoclave built in-house, previously used for dispersion polymerisations.12,19,39 These experiments can also be performed at a larger scale (1 L).40PMMA/PBzA particles synthesis
MMA (Table 1) was deoxygenated by purging with argon for 30 minutes. A mixture of AIBN (1 wt% with respect to (wrt) total monomer, 0.0705 g, 0.43 mmol) and PDMS-MA (5 wt% wrt total monomer, 0.3525 g, 0.04 mmol) was separately flushed with argon for 30 minutes.| Entry | MMA (mL) | MMA (mmol) | BzA target loading (wt%) | BzA (mL) | BzA (mmol) |
|---|---|---|---|---|---|
| 1 | 9 | 84 | 9 | 0.79 | 5.16 |
| 2 | 8.1 | 75 | 27 | 1.58 | 10.34 |
| 3 | 7.2 | 67 | 36 | 3.16 | 20.65 |
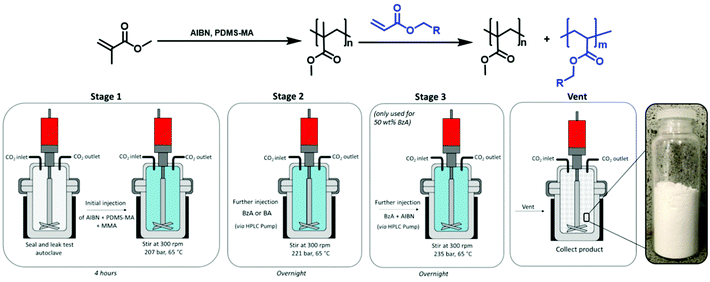
The autoclave was deoxygenated by purging with CO2 for 30 minutes at 1–2 bar. The MMA was combined with the AIBN/PDMS-MA and injected into the autoclave via a syringe under a positive pressure of CO2. The autoclave was sealed, pressurised at 48 bar, and heated to 65 °C before the addition of further CO2 to reach the desired reaction pressure (207 bar). The beginning of the reaction was recorded as the moment at which the temperature reached 65 °C, an appropriate temperature for the initiating species, after which the reaction was left stirring (300 rpm) for 4 hours. Subsequently, a charge of BzA (Table 1) was added via a high-performance liquid chromatography (HPLC) pump (0.2 mL min−1), inducing a small pressure increase. The reaction was left overnight (18 hours). After this time, the heating jacket was removed, and the autoclave was allowed to naturally cool to room temperature before being depressurised. The resulting products were typically collected from the base of the autoclave as free-flowing white powders (Fig. 1, stages 1, 2 & vent).
As the BzA feed was increased to deliver a loading of 50 wt%, the quality of the particles produced using a one-stage addition of BzA was reduced, with SEM analysis showing high levels of aggregation (ESI Fig. 1†). In an attempt to improve this, the BzA was added over two-stages, as this had previously been reported to reduce agglomeration.27 The initial stage of the reaction remained the same as described above. The total amount of monomer was increased to 12 mL to allow for sufficient amounts of MMA needed for nucleation in the primary loading (6.38 mL, 59.3 mmol).27 The PDMS-MA concentration was kept constant (5 wt% wrt total monomer, 0.6 g, 0.06 mmol), as was the AIBN concentration (1 wt% wrt total monomer, 0.12 g, 0.73 mmol). After 4 hours, the first charge of BzA (2.83 mL, 18.5 mmol) was added via an HPLC pump (0.2 mL min−1), which induced a small pressure increase. The reaction was left overnight (18 hours). Subsequently, a second charge of BzA (2.83 mL, 18.5 mmol) was added via an HPLC pump (0.2 mL min−1). The half-life for AIBN under these reaction conditions is 24 hours.41 As the reaction had been carried out for approximately 24 hours at this point, additional AIBN (0.059 g, 0.33 mmol) was included in the second charge of BzA. As before, the injection induced a small pressure increase. The reaction was left overnight (18 hours), before being cooled to room temperature and depressurised. The resulting products were typically collected from the base of the autoclave as free-flowing white powders (Fig. 1).
PMMA/PBA particles synthesis
MMA (Table 2) was deoxygenated under argon for 30 minutes. A mixture of AIBN (1 wt% wrt total monomer, 0.0705 g, 0.43 mmol) and PDMS-MA (5 wt% wrt total monomer, 0.3525 g, 0.04 mmol) was separately flushed with argon for 30 minutes. The same process as described for the PMMA/PBzA particles synthesis above was used, with the addition of BzA substituted for BA (Table 2). The resulting products were typically collected from the base of the autoclave as free-flowing white powders (Fig. 1, stages 1, 2 & vent).| Entry | MMA (mL) | MMA (mmol) | BA target loading (wt%) | BA (mL) | BA (mmol) |
|---|---|---|---|---|---|
| 1 | 9.0 | 84 | 9 | 0.94 | 6.53 |
| 2 | 7.2 | 67 | 27 | 2.82 | 19.58 |
Polymer characterisation
Details of the homopolymers synthesised for analytical comparison are given in the ESI.†Scanning electron microscopy
Scanning Electron Microscopy (SEM) was performed on a Phillips XL30 microscope. Particles were washed by centrifuging in dodecane three times (10 minutes, 4000 rpm) to remove residual stabiliser, before being dispersed in dodecane onto a glass slide and dried prior to coating in platinum. Particle size was calculated from SEM images as the average diameter of 100 particles.Size exclusion chromatography
Size exclusion chromatography (SEC) was performed in THF (HPLC grade, Fisher Scientific) as the eluent at room temperature, using two Agilent PL-gel mixed-D columns in series with a flow rate of 1 mL min−1. A multi-angle light scattering (MALS, Wyatt Optilab Dawn 8+) detector, along with a differential refractometer (DRI, Agilent 1260), were used for sample detection. The system was calibrated using PMMA standards (molecular weight range: 1000–400![[thin space (1/6-em)]](https://www.rsc.org/images/entities/char_2009.gif) 000 g mol−1).
000 g mol−1).
Dynamic mechanical analysis
Measurements were performed on a Triton Technologies (now Mettler Toledo DMA1) dynamic mechanical analyser (DMA) using the powder pocket accessory. The use of this attachment allowed for direct measurement of the synthesised powder with no further sample preparation required. The sample (40 ± 5 mg) was weighed into a powder pocket. Samples were measured at 1 and 10 Hz in single cantilever bending geometry between 25 to 250 °C or −100 to 250 °C depending on the region of interest. The Tg was recorded as the peak temperature of the tan![[thin space (1/6-em)]](https://www.rsc.org/images/entities/char_2009.gif) δ trace obtained at 1 Hz.
δ trace obtained at 1 Hz.
Transmission electron microscopy
Transmission electron microscopy (TEM) was used to analyse the internal morphology of the particles. The analysis was performed using a FEI Technai Bio Twin-12 electron microscope with an accelerating voltage of 2.2 kV. Prior to imaging, the samples were set in an epoxy resin. The resin consisted of Agar 100 resin, dodecenyl succinic anhydride (DDSA), methyl nadic anhydride (MNA) and benzyl dimethyl amine (BDMA) in the ratios 2.5![[thin space (1/6-em)]](https://www.rsc.org/images/entities/char_2009.gif) :
:![[thin space (1/6-em)]](https://www.rsc.org/images/entities/char_2009.gif) 4.5
4.5![[thin space (1/6-em)]](https://www.rsc.org/images/entities/char_2009.gif) :
:![[thin space (1/6-em)]](https://www.rsc.org/images/entities/char_2009.gif) 6.0
6.0![[thin space (1/6-em)]](https://www.rsc.org/images/entities/char_2009.gif) :
:![[thin space (1/6-em)]](https://www.rsc.org/images/entities/char_2009.gif) 0.6 by volume. The resin was sectioned using an RMC Powertome XL ultramicrotome and a diamond knife. The resulting sections (<100 nm thick) were placed on a copper TEM grid. The grids were stained for 4.5 hours with RuCl4, which was made in situ by combining 12.4 mg of RuCl3 with a solution of 4.2 mg NaIO4 in 1 mL H2O.
0.6 by volume. The resin was sectioned using an RMC Powertome XL ultramicrotome and a diamond knife. The resulting sections (<100 nm thick) were placed on a copper TEM grid. The grids were stained for 4.5 hours with RuCl4, which was made in situ by combining 12.4 mg of RuCl3 with a solution of 4.2 mg NaIO4 in 1 mL H2O.
Nuclear magnetic resonance
The conversion and polymer content of each reaction was determined using 1H nuclear magnetic resonance (1H NMR) spectroscopy. Samples were dissolved in CDCl3 and analysed using a Bruker DPX 400 MHz spectrometer. For reactions containing PBzA, analysis was performed in acetone-d6 and tetramethylsilane (TMS) was used as a reference.Atomic force microscopy
Atomic force microscopy (AFM) allowed for probing of the surface of the synthesised polymer particles. Particles were washed by centrifuging in dodecane three times (10 minutes, 4000 rpm) to remove residual stabiliser before being dispersed in dodecane onto a glass slide and dried prior to analysis. Measurements were conducted on a Dimension FastScan AFM (Bruker Corporation), working in PeakForce quantitative nanomechanical property (PF-QNM) mode in air with an RTESPA-150 silicon probe (spring constant = 2.44 N m−1).Results and discussion
In order to synthesise phase-separated particles containing both hard and soft domains in scCO2, the hard polymer must be synthesised first. It is known that the dispersion polymerisation of low Tg monomers in scCO2 does not readily produce particles. The main reason for this is the fact that the CO2 plasticises the polymer particles, lowering their Tg and causing agglomeration.42,43 For this reason, dispersion polymerisation of the higher Tg MMA was performed first, to create a stable seed particle. The second low Tg monomer was subsequently added using methodologies that have previously been reported in the literature.27,32,42,44,45 The initial focus of this research was the synthesis of particles containing a PBzA phase (Table 3), as a model system.| Entry | BzA target loading (wt%) | PBzA contenta (wt%) | BzA conversiona (%) | BzA loading by NMRa,c (wt%) | Particle sizeb (nm) |
|---|---|---|---|---|---|
| a Calculated from 1H NMR. b Measured from SEM images (including standard deviation). c Calculated post reaction from unreacted BzA and PBzA content. | |||||
| 1 | 0 | 0 | 0 | 0 | 1640 ± 220 |
| 2 | 9 | 8 | 100 | 10 | 1470 ± 245 |
| 3 | 27 | 29 | 97 | 29 | 1140 ± 230 |
| 4 | 36 | 35 | 97 | 36 | 1125 ± 220 |
| 5 | 50 | 46 | 99 | 46 | 960 ± 220 |
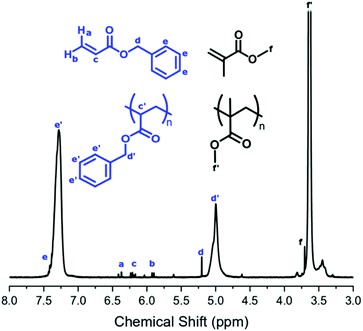
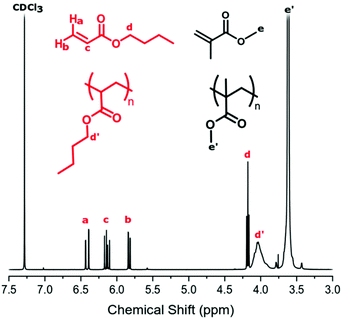
The conversion of BzA was calculated from the 1H NMR spectrum by comparing the integral of the unreacted vinyl peak in the monomer (Fig. 2, δ = 6.20 ppm, c) to the polymer peak (Fig. 2, δ = 5.00 ppm, d′). Unreacted BzA (Fig. 2, δ = a, b and c) could affect the Tg but, if necessary, could be removed by flushing with CO2 post reaction. This was not necessary here as very little monomer remained. The PBzA content was calculated from 1H NMR by comparing the integral of the PMMA peak (Fig. 2, δ = 3.63 ppm, f′) to the PBzA peak (Fig. 2, δ = 5.00 ppm, d′). The PBzA content of the particles was similar to the feed for all loadings of BzA. This was expected, because of the high conversion of BzA (>97%) (Table 3). The loading of BzA measured post reaction by 1H NMR (unreacted monomer + polymer) was similar to the target loading (Table 3).
Surprisingly the NMR spectrum also contained trace levels of unreacted MMA, even after the long reaction time (>40 hours). A possible explanation for this could be that the remaining MMA is trapped in a different phase (continuous phase or polymer phase) to the propagating radicals and hence is unable to polymerise.
It should be noted that the observed decrease in particle size, as the soft component increased, is a result of variations in the amount of PDMS-MA stabiliser used (Table 3). This is because the total amount of monomer in the reaction is constant, therefore as the loading of BzA is increased, the amount of MMA in the initial stage of the reaction is reduced. However, the amount of PDMS-MA remains the same (wrt total amount of monomer). Therefore, the ratio of PDMS-MA to MMA increases. It is well known that in dispersion polymerisation the ratio of surfactant (PDMS-MA) to monomer (MMA) dictates the size of the particles produced, with higher levels of surfactant producing smaller particles.46
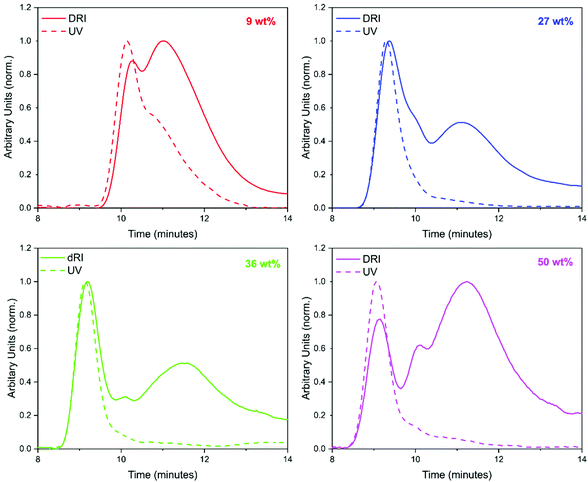
GPC analysis offered significant insight into the polymer species that were present (Fig. 3). At least two peaks were detected in the GPC chromatograms for all loadings of BzA. PBzA is UV active at 260 nm, whereas PMMA is not (ESI Fig. 2†). Overlays of the UV and DRI signals, from the GPC, for all loadings of BzA indicated the presence of a UV active species (Fig. 3), which in all cases is the high molecular weight species. At the point at which the second monomer is introduced, the concentration of AIBN is low and it is expected that any new polymer formed will be high molecular weight PBzA homopolymer. A further possible explanation for the higher molecular weight PBzA could be the presence of branching, that is sometimes observed with free radical polymerisation of acrylates.47 A GPC chromatogram of pure PMMA particles is shown in the ESI (Fig. 3†).
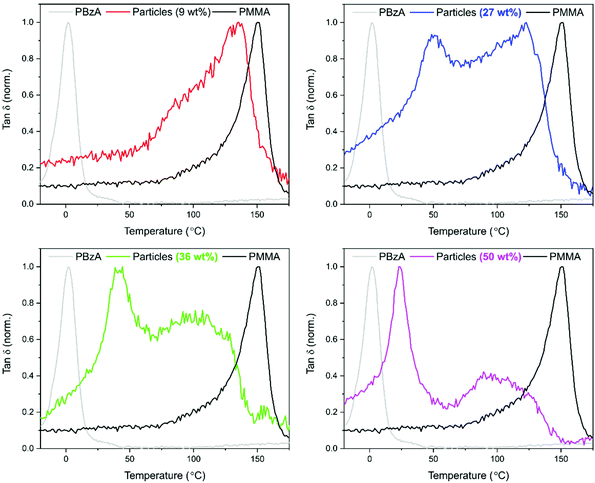
Dynamic mechanical analysis (DMA) was used to establish whether phase separation had occurred within the particles. Measurements were performed using the powder pocket accessory. The use of this attachment allowed for direct measurement of the synthesised powder with no further sample preparation required. It is well known that hard–soft, core–shell particles show two tan![[thin space (1/6-em)]](https://www.rsc.org/images/entities/char_2009.gif) δ peaks, with the lower temperature peak corresponding to the soft-rubbery phase and the higher temperature peak corresponding to the hard-glassy phase.48 For comparison, DMA data recorded for pure PMMA particles and for pure PBzA are shown in black and grey respectively (Fig. 4). The DMA trace for pure PMMA particles shows one clear peak, at 144 °C, corresponding to the DMA measured Tg of the PMMA phase (Fig. 4, black traces).
δ peaks, with the lower temperature peak corresponding to the soft-rubbery phase and the higher temperature peak corresponding to the hard-glassy phase.48 For comparison, DMA data recorded for pure PMMA particles and for pure PBzA are shown in black and grey respectively (Fig. 4). The DMA trace for pure PMMA particles shows one clear peak, at 144 °C, corresponding to the DMA measured Tg of the PMMA phase (Fig. 4, black traces).
For the particles produced using a 9 wt% loading of BzA, one transition was observed (Fig. 4, red trace, 133 °C), similar to the peak observed for pure PMMA (144 °C), suggesting phase separation had not occurred. The small reduction in Tg in comparison to PMMA suggests that some blending of the two polymers has occurred. By contrast, as the loading of BzA was increased, a second lower Tg peak becomes visible and is attributed to a PBzA rich phase, whereas the high Tg peak is attributed to a PMMA rich phase.
A shift in Tg from the pure polymers was observed, suggesting that the phases present are not 100% separated but partially blended. However, as the loading of the BzA increases, the low Tg peak moves closer to the pure PBzA transition (2 °C), indicating that the soft phase has become more PBzA rich and that there is less blending of the two phases. McAllister et al.32 observed similar trends in DMA data for the alternative two-monomer system (PMMA/PDMAEMA) that produced an internal core–shell like morphology.
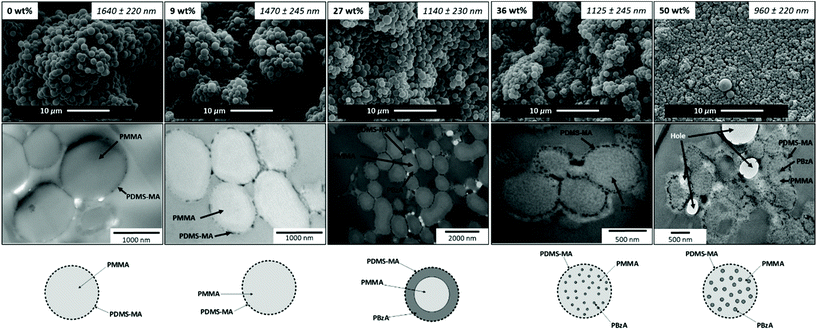
To probe the structure and internal morphology of the PMMA/PBzA particles further, scanning electron microscopy (SEM) and transmission electron microscopy (TEM) coupled with preferential staining were used. Preferential staining is a common technique used to distinguish the internal morphology of two component particles.49 SEM analysis showed that the particle structure was well maintained as the BzA loading increased, with uniform, monodisperse particles being formed (Fig. 5).
In TEM analysis, the presence of the phenyl ring in the PBzA allows for preferential staining of this phase with RuO4.50 Pure PMMA particles appeared homogeneous and no visible internal morphology was observed. A dark ring was observed on the surface of the particles, which is attributed to the PDMS-MA stabiliser (Fig. 5).32 DMA analysis also implies that only one of the phases is present. The particles obtained using a feed of 9 wt% BzA also appear homogeneous with no visible morphology observed in the TEM image (Fig. 5). This again agrees with GPC and DMA analysis. The presence of two distinct, separate phases was faintly visible in particles synthesised with a BzA loading of 27 wt% showing a PMMA core encased in a PBzA shell (Fig. 5).
As the BzA loading was increased further to 36 wt%, the internal morphology begins to change, showing smaller internal domains of PBzA surrounded by a continuous PMMA phase (Fig. 5). A possible explanation is that under the conditions used (207 bar and 65 °C), the PMMA seed particles will be plasticised,11 allowing for facile penetration of a second monomer/polymer.32 For the particles synthesised with a loading of 50 wt%, it also appears that the PBzA has apparently migrated into the PMMA particles. Phase separation in particles synthesised using emulsion polymerisation is a well-studied area and the internal morphology formed is influenced by a combination of thermodynamic and kinetic factors.24,25 Particles produced under thermodynamic control will lead to a morphology that is at equilibrium and is driven by a minimisation of the interfacial free energy. However, in most cases the internal morphology formed is controlled by kinetics. Three kinetic factors control the morphology; (1) radical penetration into the seed particles during the second stage of the polymerisation, (2) polymer phase-separation and (3) consolidation of the phase domains after phase separation.24,25,51 In our system, increasing the PBzA concentration certainly has an effect on the morphology and it could be that the higher concentration is enhancing these kinetic factors and aiding phase separation.
Another factor that could be influencing the observed morphologies is molecular weight. As the loading of BzA is increased, the molecular weight of the PBzA phase formed also increased (indicated by a shift to lower retention time in the GPC trace (Fig. 3)). This change in molecular weight could induce the formation of a different morphology, as has previously been reported for block copolymers.20,24,52 CO2-philicity of the monomer and its corresponding polymer could also be an influencing factor on the morphology produced.20,29,32 For example, a more CO2-phobic monomer/polymer would prefer to migrate inside the PMMA particle and thus limit its interaction with CO2. In addition, the variation in particle size of the seed PMMA could also be altering the morphology produced.24,53
Further work is ongoing to understand the driving force for the morphology formed. However, this may be a promising new method to synthesise particles with complex morphologies in scCO2, which does not require the use of controlled polymerisation techniques to produce block copolymers.
Particles containing phase-separated hard and soft domains have been successfully synthesised, to produce a core–shell structure as well as a micro-phase separated structure consisting of soft spheres in a hard matrix. Partial blending of the PMMA with the PBzA phase increased the Tg of the soft domains to above room temperature. Thus, a lower Tg soft block was also investigated to ensure the presence of a soft phase at room temperature.
Poly(butyl acrylate) (PBA) was chosen as an alternative, more industrially relevant soft polymer (Tg: −45 °C). PBA is traditionally used for a wide range of applications such as impact modification.54–58 The same two-stage method was used, in which PMMA seed particles were synthesised before the addition of BA. Various loadings of BA were tested (Table 4).
| Entry | BA target loading (wt%) | PBA contenta (wt%) | BA conversiona (%) | BA loading by NMRa,c (wt%) | Particle sizeb (nm) |
|---|---|---|---|---|---|
| a Calculated from 1H NMR. b Measured from SEM images (including standard deviation). c Calculated post reaction from unreacted BA and PBA content. | |||||
| 1 | 0 | 0 | 0 | 0 | 1640 ± 220 |
| 2 | 9 | 5 | 71 | 7 | 1700 ± 220 |
| 3 | 27 | 21 | 68 | 28 | 900 ± 150 |
BA conversion was calculated from 1H NMR by comparison of the unreacted monomer signal (Fig. 6, δ = 6.12 ppm, d) to polymer signal (Fig. 6, δ = 4.04 ppm, d′). Just like the BzA system, the presence of unreacted BA (Fig. 6, δ = a, b and c) could affect the Tg of the material. As the quantity of unreacted monomer was found to be relatively high, the samples were flushed with CO2 post polymerisation for 15 minutes at room temperature to ensure removal of BA monomer prior to DMA analysis.
PBA content was calculated by comparison of the PMMA signal (Fig. 6, δ = 3.60 ppm, e′) to the PBA signal (Fig. 6, δ = 4.04 ppm, d′). At both loadings, BA conversion reached <75% and increasing the reaction time did not lead to any further increase. The reasons for this lower conversion when compared to the BzA system are unclear and further investigation is needed. The PBA content of the particles was slightly lower than the feed for both loadings, which reflects the BA conversion of <75%. However, as the feed loading is increased, an increase in PBA content was observed. The loading of BA measured by 1H NMR post reaction (unreacted monomer + polymer) was similar to the target loading, indicating that the desired loading of BA was achieved (Table 4).
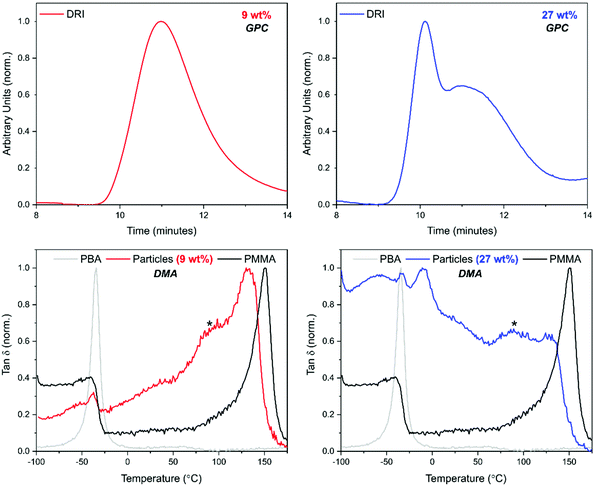
In GPC analysis, the DRI trace for a BA loading of 9 wt% showed a unimodal peak. By contrast, multimodal peaks were observed for the higher loading of 27 wt% (Fig. 7). The UV comparison carried out for PBzA containing particles could not be done here as PBA is not UV active.
The DMA trace for pure PMMA shows two clear peaks (Fig. 7, black traces) at 144 °C, corresponding to the Tg of the PMMA phase; and at −50 °C, corresponding to the melting transition (Tm) of the stabiliser used (PDMS-MA). A small amount of this PDMS-MA is known to be incorporated into the particles via the stabilisation mechanism of the dispersion polymerisation.44 Concentrating on the “PMMA type” peak, the addition of 9 wt% of BA caused a shift to a lower temperature suggesting that the phases present are not completely separated but partially blended (Fig. 7).59 The peak is also broad in comparison to the PMMA particles, with what could be considered as a small lower temperature shoulder peak. This suggests that there is a large variation in composition, with lower Tgs being measured for the material in the sample containing a higher amount of PBA. As the BA loading was increased to 27 wt%, the “PMMA type” peak becomes less well-defined. The peak also shifts to a lower temperature and broadens further, with the shoulder peak becoming slightly more defined.
Focusing on the low temperature region, three peaks are visible. As previously discussed, if a core–shell morphology was present, then a Tg peak for both the “soft” PBA phase and the “hard” PMMA phase of the particles would be observed. Although one of these peaks occurs in a similar position to PBA homopolymer, in this system, the crystal melt of the PDMS-MA stabiliser, occurs at −50 °C, which is very close to the expected Tg of PBA at −45 °C (Fig. 4 in the ESI†).
It is therefore very difficult to determine if a homogeneous PBA peak was present using thermal analysis. For the 27 wt% loading, a peak at −8 °C was observed suggesting the presence of a PBA rich phase (Fig. 7). This peak is at a higher temperature than the PBA homopolymer (–45 °C), which indicates that blending of PMMA with this phase may be occurring.
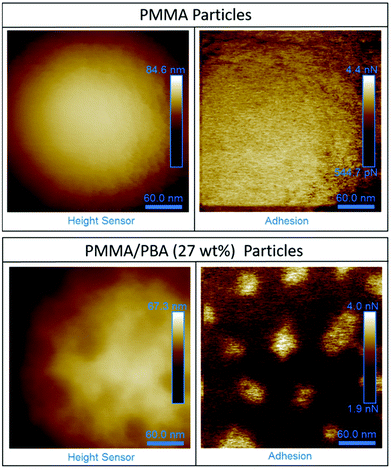
SEM analysis showed that particle structure was maintained as the BA loading was increased (ESI Fig. 5†). However, due to the similarities in functional groups between the two monomers used (MMA and BA), the use of TEM analysis coupled with preferential staining of one phase was not possible. In the absence of TEM analysis, atomic force microscopy (AFM) analysis can be used to gain an insight into the surface structure of particles.60,61 Measurements performed in PF-QNM mode can provide synchronized information about surface mechanical properties, including localised modulus and adhesion. Although, used in this way, this technique cannot give any information about the internal structure. AFM was used to probe to surface of the particles containing PBA (27 wt%) (Fig. 8).
Initial AFM images of the PMMA/PBA particles clearly show that a network-like structure is present on the surface (Fig. 8). By contrast, for the particles made up of just PMMA the surfaces of the particles are featureless. Further work must be performed to definitively show that full phase separation has occurred, and to determine which of the components in the PMMA/PBA (27 wt%) sample corresponds to each polymer.
Our observations suggest that the changes in the low temperature region of the DMA trace, notably the appearance of a peak at −8 °C, indicates the presence of a PBA rich phase which is also supported by the observation of extra peaks in the GPC chromatogram. From the AFM data coupled with the other analytical techniques, it was concluded that a PMMA and a PBA phase were likely to be present and it was possible that the system had formed a particle with a low Tg shell and high Tg core.
Conclusions
Successful addition of either BzA or BA (low Tg), at various loadings, to preformed PMMA particles was demonstrated. The two-stage reaction technique utilising scCO2 as the reaction medium was used to synthesise PMMA particles containing a feed of up to 36 wt% BzA. For a loading of 50 wt%, the addition of BzA was split over two charges in order to maintain particle quality. SEM analysis showed that particle structure did not deteriorate significantly as the loading of BzA was increased up to 50 wt%. DMA analysis indicated two separate Tgs, signifying the presence of two phases. This was complemented by GPC analysis, which also suggested the presence of two different species: PMMA and PBzA chains of different molecular weights, confirmed by UV analysis. Furthermore, TEM analysis showed the presence of internal morphology; at 27 wt% a PMMA core encased in a PBzA shell was formed and at both 36 and 50 wt%, small internal domains of PBzA surrounded by a continuous PMMA phase was observed. This suggests that the morphology formed is dependent on the concentration of PBzA but may be related to other factors such as particle size and molecular weight.Moving to a more industrially relevant system, an alternative soft polymer component of PBA was tested. Once again, the SEM analysis indicated that the structure of the particles did not deteriorate as the PBA content increased. At low loadings of BA, DMA suggested that the particles produced were homogeneous, containing one phase as opposed to the desired core–shell structure, containing two phases. Nevertheless, as the BA loading was increased, the DMA analysis suggested the presence of a PBA rich phase, but it is difficult to say for certain because the Tg of the PBA phase and the PDMS-MA occur at very similar temperatures. AFM analysis showed the formation of a network-like structure of on the surface of the particles.
The work presented is a simple and novel method to synthesis phase-separated particles in scCO2 that does not require any chemical control agents or post-polymerisation drying steps. Further work and adjustments are needed to enable full control and understanding of the internal morphology produced for each monomer at the various loadings.
Conflicts of interest
There are no conflicts of interest to declare.Acknowledgements
The authors thank M. C. Dellar, P. Fields, R. Wilson, M Guyler, D. Litchfield and J. Warren for their technical and engineering input. The authors also gratefully acknowledge the University of Nottingham Nanoscale and Microscale Research Centre (nmRC) for access to their instrumentation, in particular Denise Mclean and Nicola Weston for help with the TEM analysis.References
- M. d. A. Gamiero, A. R. Goddard, V. Taresco and S. M. Howdle, Green Chem., 2020, 1308–1318 Search PubMed.
- J. L. Kendall, D. A. Canelas, J. L. Young and J. M. DeSimone, Chem. Rev., 1999, 99, 543–564 CrossRef CAS PubMed.
- A. I. Cooper, J. Mater. Chem., 2000, 10, 207–234 RSC.
- J. M. DeSimone, Z. Guan and C. S. Elsbernd, Science, 1992, 257, 945–947 CrossRef CAS PubMed.
- D. A. Canelas and J. M. DeSimone, Metal Complex Catalysts Supercritical Fluid Polymerization Supramolecular Architecture, 1997, vol. 133, pp. 103–140 Search PubMed.
- M. R. Clark and J. M. DeSimone, Macromolecules, 1995, 28, 3002–3004 CrossRef CAS.
- M. R. Clark, J. L. Kendall and J. M. DeSimone, Macromolecules, 1997, 30, 6011–6014 CrossRef CAS.
- S. Curia and S. M. Howdle, Polym. Chem., 2016, 7, 2130–2142 RSC.
- D. D. Hile and M. V. Pishko, Macromol. Rapid Commun., 1999, 20, 511–514 CrossRef CAS.
- D. D. Hile and M. V. Pishko, J. Polym. Sci., Part A: Polym. Chem., 2001, 39, 562–570 CrossRef CAS.
- J. M. DeSimone, E. E. Maury, Y. Z. Menceloglu, J. B. McClain, T. J. Romack and J. R. Combes, Science, 1994, 265, 356–359 CrossRef CAS PubMed.
- A. M. Gregory, K. J. Thurecht and S. M. Howdle, Macromolecules, 2008, 41, 1215–1222 CrossRef CAS.
- G. Hawkins, P. B. Zetterlund and F. Aldabbagh, J. Polym. Sci., Part A: Polym. Chem., 2015, 2351–2356 CrossRef CAS.
- K. J. Thurecht and S. M. Howdle, Aust. J. Chem., 2009, 62, 786–789 CrossRef CAS.
- J. Xia, T. Johnson, S. G. Gaynor, K. Matyjaszewski and J. M. DeSimone, Macromolecules, 1999, 32, 4802–4805 CrossRef CAS.
- P. B. Zetterlund, F. Aldabbagh and M. Okubo, J. Polym. Sci., Part A: Polym. Chem., 2009, 47, 3711–3728 CrossRef CAS.
- A. I. Cooper, W. P. Hems and A. B. Holmes, Macromol. Rapid Commun., 1998, 19, 353–357 CrossRef CAS.
- T. Hasell, K. J. Thurecht, R. D. W. Jones, P. D. Brown and S. M. Howdle, Chem. Commun., 2007, 3933–3935 RSC.
- J. Jennings, M. Beija, J. T. Kennon, H. Willcock, R. K. O'Reilly, S. Rimmer and S. M. Howdle, Macromolecules, 2013, 46, 6843–6851 CrossRef CAS.
- J. Jennings, M. Beija, A. P. Richez, S. D. Cooper, P. E. Mignot, K. J. Thurecht, K. S. Jack and S. M. Howdle, J. Am. Chem. Soc., 2012, 134, 4772–4781 CrossRef CAS PubMed.
- J. Jennings, G. He, S. M. Howdle and P. B. Zetterlund, Chem. Soc. Rev., 2016, 45, 5055–5084 RSC.
- A. Aguiar, S. González-Villegas, M. Rabelero, E. Mendizábal, J. E. Puig, J. M. Dominguez and I. Katime, Macromolecules, 1999, 32, 6767–6771 CrossRef CAS.
- S. Kawaguchi and K. Ito, in Polymer Particles, Springer, 2005, pp. 299–328 Search PubMed.
- D. C. Sundberg and Y. G. Durant, Polym. React. Eng., 2003, 11, 379–432 CrossRef CAS.
- J. M. Stubbs and D. C. Sundberg, Prog. Org. Coat., 2008, 61, 156–165 CrossRef CAS.
- S. M. Thaker, P. A. Mahanwar, V. V. Patil and B. N. Thorat, Drying Technol., 2010, 28, 669–676 CrossRef CAS.
- T. D. McAllister, L. D. Farrand and S. M. Howdle, Macromol. Chem. Phys., 2016, 217, 2294–2301 CrossRef CAS.
- S. P. Bassett, A. D. Russell, P. McKeown, I. Robinson, T. R. Forder, V. Taresco, M. G. Davidson and S. M. Howdle, Green Chem., 2020, 2197–2202 RSC.
- J. Jennings, S. P. Bassett, D. Hermida-Merino, G. Portale, W. Bras, L. Knight, J. J. Titman, T. Higuchi, H. Jinnai and S. M. Howdle, Polym. Chem., 2016, 7, 905–916 RSC.
- L. Cao, L. Chen, X. Chen, L. Zuo and Z. Li, Polymer, 2006, 47, 4588–4595 CrossRef CAS.
- C. F. Lee, M. L. Hsu, C. H. Chu and T. Y. Wu, J. Polym. Sci., Part A: Polym. Chem., 2014, 52, 3441–3451 CrossRef CAS.
- T. D. McAllister, T. M. Bennett, C. Petrillo, C. Topping, L. Farrand, N. Smith and S. M. Howdle, J. Mater. Chem. C, 2019, 7, 12194–12203 RSC.
- J. Liu, X. Tian, J. Sun and Y. Yuan, J. Appl. Polym. Sci., 2016, 43843 Search PubMed.
- H. Teng, K. Koike, D. Zhou, Z. Satoh, Y. Koike and Y. Okamoto, J. Polym. Sci., Part A: Polym. Chem., 2009, 47, 315–317 CrossRef CAS.
- J. Brandrup, E. H. Immergut, E. A. Grulke, A. Abe and D. R. Bloch, Polymer handbook, Wiley, New York, 1999 Search PubMed.
- G. Heal, Principles of thermal analysis and calorimetry, 2002, vol. 52 Search PubMed.
- G. F. Wu, J. F. Zhao, H. T. Shi and H. X. Zhang, Eur. Polym. J., 2004, 40, 2451–2456 CrossRef CAS.
- Q. B. Si, C. Zhou, H. D. Yang and H. X. Zhang, Eur. Polym. J., 2007, 43, 3060–3067 CrossRef CAS.
- P. Christian, S. M. Howdle and D. J. Irvine, Macromolecules, 2000, 33, 237–239 CrossRef CAS.
- A. J. Haddleton, S. P. Bassett and S. M. Howdle, J. Supercrit. Fluids, 2020, 160, 104785 CrossRef CAS.
- Z. Guan, J. R. Combes, Y. Z. Menceloglu and J. M. DeSimone, Macromolecules, 1993, 26, 2663–2669 CrossRef CAS.
- M. R. Giles, J. N. Hay and S. M. Howdle, Macromol. Rapid Commun., 2000, 21, 1019–1023 CrossRef CAS.
- W. Wang, M. R. Giles, D. Bratton, D. J. Irvine, S. P. Armes, J. V. W. Weaver and S. M. Howdle, Polymer, 2003, 44, 3803–3809 CrossRef CAS.
- M. R. Giles, J. N. Hay, S. M. Howdle and R. J. Winder, Polymer, 2000, 41, 6715–6721 CrossRef CAS.
- T. M. Bennett, G. He, R. R. Larder, M. G. Fischer, G. A. Rance, M. W. Fay, A. K. Pearce, C. D. Parmenter, U. Steiner and S. M. Howdle, Nano Lett., 2018, 18, 7560–7569 CrossRef CAS PubMed.
- K. P. Lok and C. K. Ober, Can. J. Chem., 1985, 63, 209–216 CrossRef CAS.
- N. M. Ahmad, F. Heatley and P. A. Lovell, Macromolecules, 1998, 31, 2822–2827 CrossRef CAS.
- M. Chen, C. Zhou, Z. Liu, C. Cao, Z. Liu, H. Yang and H. Zhang, Polym. Int., 2010, 59, 980–985 CrossRef CAS.
- M. Gosecka and M. Gosecki, Colloid Polym. Sci., 2015, 293, 2719–2740 CrossRef CAS.
- J. S. Trent, J. I. Scheinbeim and P. R. Couchman, Macromolecules, 1983, 16, 589–598 CrossRef CAS.
- M. Okubo, J. Izumi, T. Hosotani and T. Yamashita, Colloid Polym. Sci., 1997, 275, 797–801 CrossRef CAS.
- B. Sarkar and P. Alexandridis, Prog. Polym. Sci., 2015, 40, 33–62 CrossRef CAS.
- S. Li, P. Chen, L. Zhang and H. Liang, Langmuir, 2011, 27, 5081–5089 CrossRef CAS PubMed.
- L. J. Borthakur, T. Jana and S. K. Dolui, J. Coat. Technol. Res., 2010, 7, 765–772 CrossRef CAS.
- A. K. Khan, B. C. Ray, J. Maiti and S. K. Dolui, Pigm. Resin Technol., 2009, 765–772 Search PubMed.
- W. Li, Y. Zhang, D. Wu, Z. Li, H. Zhang, L. Dong, S. Sun, Y. Deng and H. Zhang, Adv. Polym. Technol., 2015, 21632 Search PubMed.
- W.-G. Yao, L.-Q. Wang, D.-Y. He, S.-C. Jiang, L.-J. An and H.-X. Zhang, Chin. J. Polym. Sci., 2005, 23, 337–340 CrossRef CAS.
- W. Ye, M. F. Leung, J. Xin, T. L. Kwong, D. K. L. Lee and P. Li, Polymer, 2005, 46, 10538–10543 CrossRef CAS.
- A. I. Isayev, Encyclopedia of Polymer Blends, Volume 3: Structure, John Wiley & Sons, 2016 Search PubMed.
- S. H. Kim, W. K. Son, Y. J. Kim, E. G. Kang, D. W. Kim, C. W. Park, W. G. Kim and H. J. Kim, J. Appl. Polym. Sci., 2003, 88, 595–601 CrossRef CAS.
- F. Sommer, T. M. Duc, R. Pirri, G. Meunier and C. Quet, Langmuir, 1995, 11, 440–448 CrossRef CAS.
Footnote |
| † Electronic supplementary information (ESI) available. See DOI: 10.1039/d0py00729c |
| This journal is © The Royal Society of Chemistry 2020 |

