Influence of stomach mucosa tissue on the efficacy of intragastric antibacterial PDT
A.
Gnerucci†
,
P.
Faraoni†
 ,
S.
Calusi
,
F.
Fusi
* and
G.
Romano
,
S.
Calusi
,
F.
Fusi
* and
G.
Romano
Department of Experimental and Clinical Biomedical Sciences “Mario Serio”, University of Florence, viale Pieraccini 6, I-50139, Florence, Italy. E-mail: franco.fusi@unifi.it
First published on 22nd November 2019
Abstract
In the field of photodynamic therapy (PDT), optimization of the in vivo therapeutic efficacy needs a comprehensive study of the photo-killing action spectrum that depends on both the photosensitizer (PS) absorption and the tissue optical properties. This is especially true in the case of gastric infections by Helicobacter pylori: PS absorption has been largely investigated in vitro, while the contribution of tissue optical properties and illumination geometry has been poorly studied, despite being parameters that reflect the specific in vivo conditions. To investigate their influence, we focussed on the case of a point-like light source positioned in the antrum. This models a therapeutic device developed by our team which consists of a LED-based ingestible pill. By a simple 3D illumination model, our approach mediates light–tissue interaction over the illuminated stomach wall surface, then calculates its average transmittance T by means of a 1D model representative of the mean gastric mucosa structure. Finally, by merging T(λ) with the photosensitizers’ absorption we obtained the in vivo action spectrum. This shows two peaks at about 500 and 630 nm, indicating a noticeable influence of the tissue with respect to in vitro studies, where the action spectrum reflects PS absorption only. Our approach defines one average action spectrum for this specific therapeutic context, which reflects the need to choose one emission spectrum for the light source used. The proposed methodology could be applied to any other illumination geometry of cave organs, provided appropriate model modifications for the light source and tissue characteristics are made.
Introduction
In recent years, the rate of antibiotic resistance has increased worldwide, therefore, new anti-bacterial therapies are being considered, among which photodynamic therapy (PDT) is certainly a very attractive prospect.1 In this framework, innovative solutions for endoscopic illumination have been defined and studied in many applications, e.g. in the case of catheter infections, lung tumours, and Helicobacter pylori (H. pylori) gastric infections.2–7 To optimize PDT efficacy, the analysis of the light action spectrum for bacterial photo-killing is paramount. This corresponds to the measurement of the relative therapeutic efficacy of various illumination wavelengths, which in the in vivo case depends on multiple factors such as (i) the photosensitizer (PS) absorption spectrum and quantum yield for reactive oxygen species (ROS) production; (ii) the tissue optical properties (i.e. absorption and scattering).In this work we focus on the gastric infection by H. pylori, one of the most widespread worldwide.8 Since many years, H. pylori has been well known to accumulate endogenous photosensitizers (protoporphyrin IX – PPIX and coproporphyrin – CP), which paves the way for a PDT approach consisting of bacterium illumination only. This approach requires the development of suitable intragastric illumination devices. In the past, modified gastroscopes have been used to deliver light emitted by external sources coupled with an optical fiber.9,10 Here we focus in particular on innovative swallowable devices for intragastric illumination, such as a LED-based ingestible pill developed by our team,11 representing also a model for one of the simplest illumination solutions consisting of a point-like source.
In this context, our aim is to concentrate on the comprehension and analysis of what changes moving from an in vitro to an in vivo context, which is paramount for the development of possible new therapeutic approaches, including clinical studies.
With the aim of estimating the in vivo photokilling action spectrum for H. pylori, we have started by considering the interaction of the illumination light with the gastric mucosa tissue. This is a fundamental aspect in any phototherapy approach, either antimicrobial or antitumoral for organs like the stomach, intestine, bladder, mucosae of the head-neck region and the lungs. In any of these cases, the interaction of light with the healthy tissues subtracts luminous power and modifies the light spectrum, thus influencing the efficacy of the therapy itself. In the case of the stomach cavity, the bacterium hides at different depths between the mucosa rugae and plicae, which evidently creates a difference between the spectrum emitted by the light source and the one reaching the bacteria.
The action spectrum (i.e. the efficacy as a function of wavelength) of PDT against H. pylori in vitro is well known,9,12,13 but the presence of the stomach mucosa tissue modifies the relative therapeutic efficacy of the various wavelengths and this factor, fundamental in the transition between the in vitro and in vivo approach, is less investigated in the literature. This is why a modelling of light–tissue interaction is paramount for our purpose. Therefore, our approach can be summarised by the following steps.
First, we started with a geometric 3-dimensional modelling of the gastric wall illumination by a light source of a given spectrum, representing our ingestible pill, positioned in the antrum. The geometry of the stomach wall and the position of the source determine the local illumination conditions that in turn influence the penetration of light in the mucosa. Then, using literature data for the optical properties of the gastric mucosa, we performed a simulation of the light transmitted by a simple model of the gastric wall structure, mimicking the in vivo illumination conditions. To this aim, the 3D illumination model information feeds and robustly constrains a Monte Carlo light-transmission simulation that approaches the modelling problem with a 1-dimensional approximation taking into account the mucosa rugae and plicae structures.
Finally, we considered the type(s) of H. pylori endogenous PS and their absorption spectrum, besides their photo-physical properties in terms of quantum yield for ROS production. By merging the two datasets we obtained an estimate of the light action spectrum for the in vivo phototherapy of H. pylori in the visible range.
Experimental
Action spectrum calculation
The action spectrum K(λ) for in vivo H. pylori photokilling (i.e. the relative photo-killing efficacy as a function of the wavelength (λ)) has been defined as:| K(λ) = T(λ)e(λ)Φ(λ) | (1) |
The considered PS are the endogenous H. pylori PPIX and CP (protoporphyrin IX and coproporphyrin, respectively); values for e(λ) and Φ(λ) for both PPIX and CP were taken from the literature5,8,9 and averaged with weights representing their relative concentration.
Despite the presence of literature results about porphyrin detection in H. pylori (e.g. by fluorescence microscopy, like in Battisti et al.14,15), absolute concentration measurements are rare. In this work we mainly refer to the estimate reported in Hamblin et al.12 In that work, the amount of PS released by H. pylori in its culture supernatant is estimated to be 12–42 nM and 10–20 nM for PPIX and CP, respectively, and their concentration-ratio is between 1.2 and 2.7 (in our model we adopted the mean value of 1.95).
Regarding the amount of available molecular oxygen, this is directly related to ROS photoproduction. In our model, aimed at the study of the wavelength dependence of the photokilling efficacy, we neglected possible variations in the O2 concentration between e.g. superficial and more deeply hidden bacteria and therefore did not explicitly include O2 concentration in our calculations, as its constant value does not change our results in terms of the photokilling action spectrum.
Most of the studies, then, were concentrated on the semi-theoretical determination of T(λ), which needed a preliminary modelling of the stomach wall surface. First, we introduced the 3D illumination model of the stomach wall. Then we used it to constrain the 1D Monte Carlo simulation that allows calculating the effective stomach wall transmittance. Finally, we calculated the photo-killing action spectrum using eqn (1).
Geometrical modelling of the stomach illumination
H. pylori infections are associated with the presence of the bacterium principally in the stomach antrum and secondarily in the lower part of corpus (see for example ref. 16–18); for this reason we have concentrated on the antrum geometrical modelling (in the following we will refer to this region simply as “antrum”). The antrum was modelled by a triaxial ellipsoid with axes 5.5, 2.7 and 3.25 cm as shown in Fig. 1. This model surface was parameterized with its angular spherical coordinates θ and φ sketched in the right panel of Fig. 1. Thus, for example the pylorus position corresponds to the positive x axis direction and has angular coordinates (θ = 0, φ = 0). The light source is modelled as point-like and isotropic and is positioned at the bottom of the ellipsoid (i.e. the south pole or the negative z axis direction that corresponds to the angular coordinates (θ = 0, φ = −π/2). This choice was made to reproduce the supposedly most probable positioning of the pill once ingested, being it driven by gravity and free to move inside the empty stomach of an upright-positioned patient.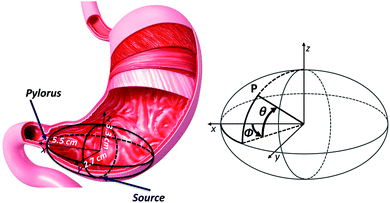 | ||
| Fig. 1 3D modelling of the smooth average surface of the gastric antrum wall. Right panel: a sketch of the spherical angular coordinate system of the modelled surface. | ||
This 3D antrum surface model describes the “averaged” smooth surface of the stomach, while finer structures will be taken into account in a subsequent step. It is important to remark that this model aims to reproduce only representative dimensions and shapes of the stomach, neglecting the variability due to its contraction/expansion and peristaltic movements. In fact, it is beyond the aims of this paper to introduce a complex modelling that considers also these factors, preferring instead to focus on the properties of the surface- (and time-) averaged stomach wall illumination. Therefore, we believe that our simple model can provide robust average information explaining the effect of stomach mucosa tissue on the spectral efficacy of in vivo PDT with respect to its in vitro counterpart.
The illumination irradiance E(θ,φ) (W cm−2) on the ellipsoid surface points was calculated as:
 | (2) |
In general, both absorption and diffusion change the light intensity and spectral distribution that the bacterium receives, depending on the penetrated mucosa structure and thickness. Direct light from the source illuminates the stomach mucosa with an incidence angle depending on (θ,φ). As shown in the left panel of Fig. 2, for a given incidence angle α(θ,φ) there is a maximum thickness dmax(θ,φ) beyond which no bacteria are present and that depends on the rugae typical dimension H:
| dmax(θ,φ) = H/cos(α(θ,φ)) | (3) |
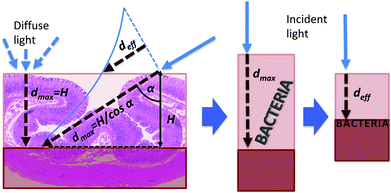 | ||
| Fig. 2 Model of the gastric wall structure constraint on the calculation of a mean local penetration of light in the mucosa before hitting a bacterium. | ||
Therefore, light can hit a bacterium after penetrating any mucosa thickness in the range 0–dmax(θ,φ). Our modelling approach consists of substituting this depth range with a unique “effective” (i.e. average) value deff(θ,φ) whose meaning is the following: bacteria actually located at any depth in the range 0–dmax(θ,φ) can be modelled to be all located behind a deff(θ,φ) thick mucosa layer (right panel of Fig. 2). The value of deff(θ,φ) takes into account the local illumination geometry (i.e. θ and φ) and the fact that light power decreases according to the Lambert–Beer law when travelling inside the mucosa, thus decreasing its capability to kill the bacterium. In the first instance, we can calculate deff(θ,φ) by means of a weighted mean of the depth inside the mucosa tissue (x in eqn (4)) in the range 0–dmax:
 | (4) |
Eqn (4), however, takes into account only the direct illumination component. The diffused component can be approximated as always normally incident and independent on (θ,φ). Therefore, in this case the weighted mean is performed in the range 0–H for all (θ,φ) values instead of 0–dmax(θ,φ), as shown in the left panel of Fig. 2. Eqn (4) has thus to be substituted with the following, where the two illumination components (direct and diffuse) are properly averaged with weights 1 − RD and RD, respectively, in accordance with eqn (2):
 | (5) |
The final step is to average deff(θ,φ) on the whole ellipsoid surface to obtain one average effective gastric wall thickness Deff by integrating over θ and φ:
 | (6) |
Monte Carlo simulation
The next step of our modelling approach is to simulate the effect on the spectral distribution of the light source due to the absorption and scattering of the stomach mucosa. By means of a Monte Carlo simulation with the constraints obtained in the 3D model described above, an average gastric wall transmittance spectrum T(λ) has been calculated as a function of the wavelength λ in the range 400–700 nm.To this aim, and in conformity with the definition of a unique Deff value, we reduced the gastric wall modelling to be 1-dimensional, with a thickness equal to Deff. Now, we can attribute to this model a specific structure, formed by a succession of gastric plicae to mimic the real tissue anatomy. Each plica has been represented as a series of plane-parallel homogeneous layers (Fig. 3), composed of mucosa tissue stroma (“mucosa”) and blood vessels, modelled by a water solution of 50% oxy- and 50% deoxy-haemoglobin (to account for the presence of both oxygenated and de-oxygenated blood). Finally, water layers mimic the natural gastric secretion and mucus surrounding each plica, represented as 100% water thus neglecting the ∼5% mucin contribution. In detail, the first water layer is 50 μm thick, followed by a Deff tissue thickness, modelled as a series of plicae (112 μm each) spaced out by 20 μm of water. Each plica is structured as 30 μm of mucosa, 6 μm of blood, 40 μm of mucosa, 6 μm of water and 30 μm of mucosa. These values have been chosen as the typical average dimensions of the stomach plicae as observed in histological samples. The first water layer represents a reasonable estimate of the stomach wall secretion even under empty stomach conditions. The Deff value is the one calculated in the previous section and its meaning will be further discussed in the following sections. All the geometrical features of this model (i.e. thicknesses and media optical properties) have to be intended as average values for the stomach antrum, taking into account variations among individuals and possible variation due to the specific physiological conditions. Moreover, our modelling approach PDT does not apply in the presence of biliary reflux, due to the presence of absorbing and possibly photosensitizing molecules.
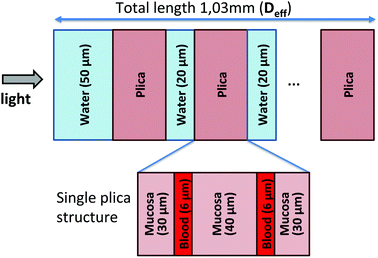 | ||
| Fig. 3 Scheme of the modelled layer structure for the Monte Carlo simulation (Deff = total thickness mucosa layer with its plicae structure). | ||
To perform the simulations, the free software MCML (Monte Carlo for multi-layered media: http://omlc.org/software/mc/) was used. This software models an infinitely narrow photon beam that enters the tissue orthogonally to the first surface (the first and last media being air). For numerical computation approximation purpose, all layers were more finely subdivided into sub-layers whose thickness was fixed at 1 μm. The optical parameters for each medium were taken from the literature2–7,19,20 and corresponded to μa, μs, g, and n (absorption and scattering coefficient, anisotropy factor and refractive index respectively). In the case of non-available data for a given wavelength range, interpolation was applied on experimental literature data.
Results and discussion
Fig. 4 shows a spherical angular coordinate map of the illumination irradiance E at the surface of the modelled ellipsoidal antrum, with the light source being positioned at the bottom (θ = 0,φ = π/2). It can be observed that E ranges from ∼0.4 to ∼1.8 mW cm−2.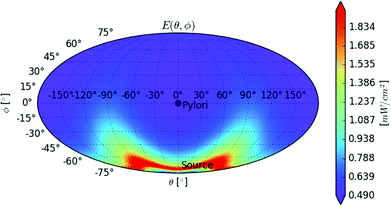 | ||
| Fig. 4 Illumination irradiance map for the antrum model (spherical angular coordinates, Mollweide projection). Pylorus is located at θ = 0, φ = 0: the positive x axis direction of Fig. 1. Light source is located at θ = 0, φ = −90°: the negative z axis direction of Fig. 1. | ||
In Fig. 5, a polar map of the local effective gastric wall thickness deff(θ,φ) is shown, indicating a value range from ∼0.9 to ∼1.1 mm; the average value over the ellipsoid surface is Deff = 1.03 mm.
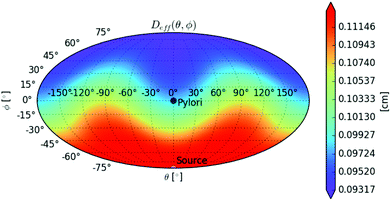 | ||
| Fig. 5 Map of the effective gastric wall thickness depth for the antrum model (spherical angular coordinates, Mollweide projection). Pylorus is located at θ = 0, φ = 0: the positive x axis direction of Fig. 1. Light source is located at θ = 0, φ = −90°: the negative z axis direction of Fig. 1. | ||
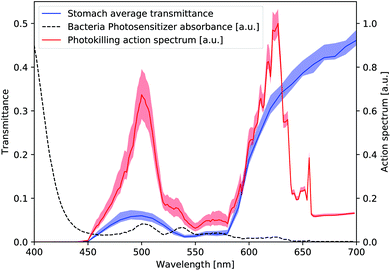
Fig. 6 shows the final simulated photo-killing action spectrum K(λ) (red line), together with the stomach wall average transmittance T(λ) (blue line) obtained by means of the Monte Carlo simulation, considering an effective gastric wall thickness Deff = 1.03 mm. Red and blue bands represent the effect of a variation of 5% on the value of Deff, respectively, considering a reasonably small error due to the Deff constrain to the Monte Carlo simulation.
The obtained T(λ) curve shows a peak at ∼500 nm, with a negligible transmittance under 450 nm and an expected increasing behaviour starting from the green/yellow region (∼550–580 nm) towards the red part of the spectrum. Resulting from merging both the contribution of the tissue transmittance (blue curve of Fig. 6, relative to an effective gastric wall thickness ∼1 mm) and the photosensitizer absorption (black dashed curve of Fig. 6, main peak at ∼405–410 nm), the action spectrum K(λ) interestingly shows two peaks: the main one is at ∼625 nm (red), followed by a secondary one at ∼500 nm (green) corresponding to a 75% efficacy with respect to the main one. Negligible values are found for λ > ∼650 nm and λ < 450 nm. Interestingly enough, this underlines the influence of the tissue transmittance, as the ∼400 nm peak of PPIX absorbance (literature data) disappears due to the mucosa absorption.
It is important to observe that the effect of mucosa absorption is to deplete the shorter wavelength components (that have lower penetration depth with respect to longer ones). This modifies the light that eventually hits a bacterium, whose spectrum becomes “red-rich” (i.e. “blue-poor”) with increasing mucosa thickness that light travels through. The photo-killing efficacy thus changes with the increasing depth inside mucosa; accordingly, some modelling approaches provide the action spectrum at various depths. Our approach consists instead of constraining this depth and providing a unique action spectrum representative of the average “behavior” of the gastric wall towards light-induced killing. This is paramount, thinking of further applications that inherently will have to decide the (unique) emission spectrum of the therapeutic illumination source.
This “effective” mucosa absorption is calculated by the 1D Monte Carlo simulation, given a total thickness Deff of the gastric mucosa that light passes through. The estimated value for Deff is then of crucial importance, and a robust handling of this parameter is fundamental to avoid biases in the estimate and thus interpretation of the obtained action spectrum.
Conclusions
In this work we aimed to stress the importance of proper consideration of the tissue optical properties (absorption, scattering) when passing from in vitro to in vivo for the calculation of the photo-killing action spectrum. In particular, we have presented a semi-theoretical method to obtain the in vivo action spectrum for antibacterial photo-killing, considering the exemplary case of stomach infection by H. pylori with a PDT approach based on an innovative ingestible light source with no use of external photosensitizers. As the bacterium hides inside and in between the rugae and plicae of the stomach mucosa, a proper modelling of light–tissue interaction is fundamental to robustly calculate the action spectrum in an in vivo therapeutic context. Thus, our approach is based on the development of a model for the gastric wall illumination geometry and tissue structure.The stomach antrum was modelled by a triaxial ellipsoid and a point-like isotropic source (the ingestible device) was positioned at the bottom. Then, the following was calculated: (i) the radiant flux at each point of the antrum surface and (ii) an effective value of the gastric wall thickness (Deff) at each point of the antrum surface. This parameter corresponds to an approach where the complex stomach wall structure is reduced to a mono-dimensional model, whose attributed thickness is Deff representing the mean mucosa thickness penetrated by light before being absorbed by a bacterium. The Deff average over the entire antrum surface was estimated as Deff = 1.03 mm. The specific geometrical modelling of the gastric wall illumination conditions has been developed and optimized also with the aim to obtain a robust value for Deff.
The average transmittance spectrum of the gastric wall was calculated on the above-described mono-dimensional model, by means of a Monte Carlo simulation performed on a Deff-thick gastric mucosa tissue model. Considering the bacteria PS absorption properties, the in vivo photo-killing action spectrum was finally calculated, obtaining an indication of the most effective wavelengths. The 625 nm peaked band is consistent with the low tissue absorption at red wavelengths; in this regard, the efficacy of PDT with tissue-penetrating red light is already known for example in dermatologic PDT (see for example ref. 21–23). Moreover, a second band at around 500 nm appears, with almost equal intensity (i.e. the “red” peak is ∼1.3 times higher than the “green” one). The 400 nm peaked band of the endogenous PS maximum absorption (corresponding to a well-known peak of the photo-killing efficacy in in vitro experiments) in our results has disappeared due to the above-mentioned “blue” filtering action of the gastric mucosa tissue.
In general, in a PDT approach light power loss due to tissue absorption can be compensated by increasing the total light power delivered, thus increasing the fraction that penetrates to the therapy target, but at some power level light becomes harmful for healthy tissues (see for example ref. 24). In this sense the knowledge of the presence of an efficient photokilling red band is very useful. Red light, in fact, is less absorbed by tissues with respect to blue light, penetrating more effectively the stomach mucosa to kill the bacteria and delivering less power to healthy tissues.
In our approach, estimation of the effective gastric wall thickness is fundamental to properly take into account the light absorption phenomenon that subtracts photons available for bacteria photo-killing and depletes the shorter wavelength content of the source spectrum.
We believe that the method and modelling presented in this work can be applied in many other cases regarding a photo-therapeutic approach in other organs (especially those presenting a cavity), such as the intestine, bladder, mucosae of the head-neck region and the lungs, provided appropriate changes are made according to the specific light source emission, tissue structure, therapy target (e.g. bacteria or cancer cells) and specific organ geometry. In fact, the presence, morphology and optical properties of the “surrounding healthy tissue”, as well as those of the pathological one, may strongly influence the illumination conditions at the target level. A proper modelling of all these aspects is fundamental for optimizing the therapeutic efficacy.
Conflicts of interest
F. F. and G. R. acknowledge being part of Probiomedica srl, Italy. There are no other conflicts to declare.Acknowledgements
We acknowledge the determinant contribution of the Tuscany Regional Board, through the project “Capsulight” (PAR FAS 2007-2013, action line 1.1 - 1.1.2) and of the Fondazione Cassa di Risparmio di Firenze, through the project “Realizzazione di un prototipo di capsula ingeribile per il trattamento fototerapico dell'infezione gastrica da Helicobacter pylori”. The authors thank Dr Barbara Orsini for fruitful discussion about H. pylori infection and gastric physiology.Notes and references
- M. Wainwright, T. Maisch, S. Nonell, K. Plaetzer, A. Almeida, G. P. Tegos and M. R. Hamblin, Lancet Infect. Dis., 2016, 17, 1–7 Search PubMed.
- A. N. Bashkatov, E. A. Genina, V. I. Kochubeya, A. A. Gavrilova, S. V. Kapralov, V. A. Grishaev and V. V. Tuchin, Med. Laser Appl., 2007, 22, 95–104 CrossRef.
- A. Marcelli, I. B. Badovinac, N. Orlic, P. R. Salvi and C. Gellini, Photochem. Photobiol. Sci., 2013, 12, 348–355 RSC.
- K. Arakane, A. Ryua, C. Hayashia, T. Masunaga, K. Shinmoto, S. Mashiko, T. Nagano and M. Hirobe, Biochem. Biophys. Res. Commun., 1996, 223, 578–582 CrossRef CAS.
- J. M. Fernandez, M. D. Bilgin and L. I. Grossweiner, J. Photochem. Photobiol., B, 1997, 37, 131–140 CrossRef CAS.
- L. Wang, S. L. Jacques and L. Zheng, Comput. Methods Programs Biomed., 1995, 47(2), 131–146 CrossRef CAS.
- A. Roggan, M. Friebel, K. Dorschel, A. Hahn and G. J. Mueller, J. Biomed. Opt., 1999, 4(1), 36–46 CrossRef CAS.
- M. M. Gerrits, A. H. M. van Vliet, E. J. Kuipers and J. G. Kusters, Lancet Infect. Dis., 2006, 6, 699–709 CrossRef CAS.
- R. A. Ganz, J. Viveiros, A. Ahmad, A. Ahmadi, A. Khalil, M. J. Tolkoff and N. S. Nishioka, Lasers Surg. Med., 2005, 36(4), 260–265 CrossRef.
- C. H. Wilder-Smith, P. Wilder-Smith, P. Grosjean, H. van den Bergh, A. Woodtli, P. Monnier, G. Dorta, F. Meister and G. Wagnières, Lasers Surg. Med., 2002, 31, 18–22 CrossRef.
- G. Tortora, B. Orsini, P. Pecile, A. Menciassi, F. Fusi and G. Romano, IEEE/ASME Trans. Mechatronics, 2016, 21(4), 1935–1942 Search PubMed.
- M. R. Hamblin, J. Viveiros, C. Yang, A. Ahmadi, R. A. Ganz and M. J. Tolkoff, Antimicrob. Agents Chemother., 2005, 49(7), 822–827 CrossRef PubMed.
- T. Dai, A. Gupta, C. K. Murray, M. S. Vrahas, G. P. Tegos and M. R. Hamblin, Drug Resist. Updates, 2012, 15, 223–236, DOI:10.1016/j.drup.2012.07.001.
- A. Battisti, P. Morici, P. Signore, F. Ghetti and A. Sgarbossa, Biophys. Chem., 2017, 229, 25–30 CrossRef CAS PubMed.
- A. Battisti, P. Morici, F. Ghetti and A. Sgarbossa, Biophys. Chem., 2017, 229, 19–24 CrossRef CAS PubMed.
- L. Sherwood, Fundamentals of Human Physiology, Cengage Learning, 1 gen, 2011, ch. 15, p. 456 Search PubMed.
- A. Mehmood, M. Akram, A. A. Shahab-uddin, K. Usmanghani, A. Hannan, E. Mohiuddin and M. Asif, Int. J. Appl. Biol. Pharm. Technol., 2010, 1(3), 1337–1351 Search PubMed , Available online at http://www.ijabpt.com.
- M. Guclu and A. F. Agan, Euroasian J. Hepatogastroenterol., 2017, 7(1), 11–16, DOI:10.5005/jp-journals-10018-1204.
- C. D. Mobley, Optical Properties of Water, in Handbook of Optics, ed. M. Bass, McGraw-Hill, Inc., 1994, 2nd edn, vol. 1994, pp. 60–144 Search PubMed.
- O. Zhernovaya, O. Sydoruk, V. V. Tuchin and A. Douplik, Phys. Med. Biol., 2011, 56, 4013–4021 CrossRef CAS.
- R. G. Calderhead, Light-Emitting Diode Phototherapy in Dermatological Practice, in Lasers in Dermatology and Medicine, ed. K. Nouri, Springer, London, 2011 Search PubMed.
- K. König, M. Teschke, B. Sigusch, E. Glockmann, S. Eick and W. Pfister, Cell. Mol. Biol. (Noisy-le-grand), 2000, 46(7), 1297–1303 Search PubMed.
- T. H. Wong, C. A. Morton, N. Collier, A. Haylett, S. Ibbotson, K. E. McKenna, R. Mallipeddi, H. Moseley, D. C. Seukeran, L. E. Rhodes, K. A. Ward, M. F. Mohd Mustapa and L. S. Exton, Br. J. Dermatol., 2019, 180(4), 730–739, DOI:10.1111/bjd.17309.
- P. Faraoni, A. Gnerucci, F. Ranaldi, B. Orsini, G. Romano and F. Fusi, J. Photochem. Photobiol., B, 2018, 186, 107–115 CrossRef CAS PubMed.
Footnote |
| † These authors contributed equally to this work. |
| This journal is © The Royal Society of Chemistry and Owner Societies 2020 |

