
 Open Access Article
 This Open Access Article is licensed under a
 Creative Commons Attribution 3.0 Unported Licence
Correction: Patience is a virtue: self-assembly and physico-chemical properties of cellulose nanocrystal allomorphs
Gwendoline
Delepierre
ab,
Samuel
Eyley
c,
Wim
Thielemans
c,
Christoph
Weder
a,
Emily D.
Cranston
*b and
Justin O.
Zoppe
*d
aAdolphe Merkle Institute, University of Fribourg, Chemin des Verdiers 4, 1700 Fribourg, Switzerland
bUniversity of British Columbia, 2424 Main Mall, Vancouver, BC V6 T 1Z4, Canada. E-mail: emily.cranston@ubc.ca
cSustainable Materials Lab, Chemical Engineering, KU Leuven Kulak Kortrijk Campus, E. Sabbelaan 53 box 7659, 8500 Kortrijk, Belgium
dOmya International AG, Baslerstrasse 42, 4665 Oftringen, Switzerland. E-mail: jozoppe@gmail.com
First published on 6th October 2020
Abstract
Correction for ‘Patience is a virtue: self-assembly and physico-chemical properties of cellulose nanocrystal allomorphs’ by Gwendoline Delepierre, et al., Nanoscale, 2020, 12, 17480–17493, DOI: 10.1039/d0nr04491a.
The authors regret that the Experimental section titled “Quartz crystal microbalance with dissipation (QCM-D)” in the original manuscript was incomplete, omitting details that explained the calculation of the results. No results or conclusions of the work are affected by the amendment of this section. The correct text for this section, including citations, is displayed below. Please note that citations 1, 2 and 3 in this notice correspond to references 61, 91 and 92 respectively in the original manuscript.
Quartz crystal microbalance with dissipation monitoring (QCM-D)
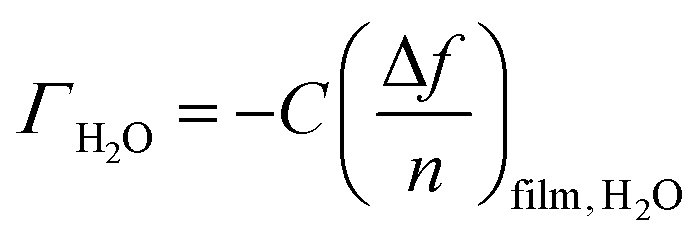
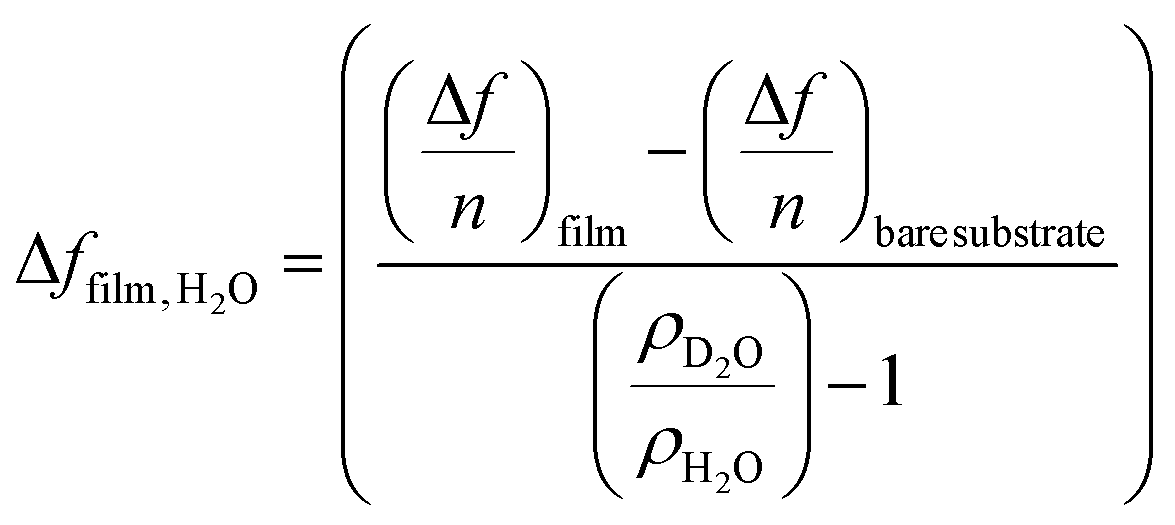
CNC films were prepared by spin-coating a 1 wt% CNC suspension onto silicon dioxide coated QCM-D (Biolin Scientific, Gothenburg, Sweden) sensors at 3000 rpm for 60 s. The sensors were first cleaned in a UV Ozone Cleaner – ProCleaner™ (BioForce Nanosciences) for 15 min. The CNCs were annealed to the sensor surface by placing the samples in an oven at 80 °C for 15 min. The sensors were placed in a flow cell (QSense Analyzer, Biolin Scientific, Gothenburg, Sweden) and equilibrated in purified water overnight with a constant flow rate of 10 μL min−1 at RT, in order to obtain a stable baseline. A purified water baseline was recorded for 25 min, after which the solvent was exchanged for D2O. The changes in resonance frequency (Δf) were recorded for 30 more min, before the solvent was changed to purified water again for an additional 30 min. The amount of bound surface water (ΓH2O) was calculated according to the Sauerbrey equation:1–3where C is the sensitivity constant of the sensor (0.177 mg m−2 Hz−1), n is the measurement harmonic (n = 1, 3, 5, 7…) (here we have analyzed the 3rd harmonic), and Δffilm, H2O is as follows:
where Δffilm is the change in resonance frequency of the CNC film as a result of the solvent exchange, Δfbare substrate is the change in resonance frequency of a QCM sensor (−54 Hz) as a result of the solvent exchange, ρD2O is the density of D2O (1.104 g cm−3 at 25 °C) and ρH2O is the density of water (0.977 g cm−3 at 25 °C). ΓH2O was normalized to the thickness of the cellulose film measured using a UV-Vis (350 nm–1800 nm) spectroscopic ellipsometer from J.A. Woollam, M2000, with an incident angle of 72°.1 Thicknesses were modelled using a classic Cauchy model of two separate layers consisting of an SiO2 layer (coating on the QCM sensor) and the CNC film.
The Royal Society of Chemistry apologises for these errors and any consequent inconvenience to authors and readers.
References
- J. D. Kittle, X. Du, F. Jiang, C. Qian, T. Heinze, M. Roman and A. R. Esker, Biomacromolecules, 2011, 12, 2881–2887 CrossRef CAS.
- E. Niinivaara, M. Faustini, T. Tammelin and E. Kontturi, Langmuir, 2015, 31, 12170–12176 CrossRef CAS.
- V. S. J. Craig and M. Plunkett, J. Colloid Interface Sci., 2003, 262, 126–129 CrossRef CAS.
| This journal is © The Royal Society of Chemistry 2020 |