 Open Access Article
Creative Commons Attribution 3.0 Unported Licence
Double resonant plasmonic lattices for Raman studies†
Khairul
Alam‡
 ,
Kabusure M.
Kabusure‡
 ,
Benjamin O.
Asamoah
 ,
Tarmo
Nuutinen
,
Marian
Baah
,
Tarmo
Nuutinen
,
Marian
Baah
 ,
Sughra
Mohamed
 ,
Antti
Matikainen
,
Janne
Heikkinen
,
Antti
Matikainen
,
Janne
Heikkinen
 ,
Heikki
Rekola
 ,
Matthieu
Roussey
,
Markku
Kuittinen
and
Tommi K.
Hakala
,
Matthieu
Roussey
,
Markku
Kuittinen
and
Tommi K.
Hakala
 *
*
Department of Physics and Mathematics, University of Eastern Finland, Yliopistokatu 2, P.O Box 111, FI-80101, Joensuu, Finland. E-mail: tommi.hakala@uef.fi
First published on 22nd October 2020
Abstract
We demonstrate radiation induced enhancement of both the in coupling of Raman excitation wavelength and Raman signal in plasmonic nanoparticle lattices. Rectangular nanoparticle lattices show two independently controllable lattice resonances, which we tune to be resonant with both the Raman excitation wavelength and the Raman transitions of rhodamine 6G molecules. We demonstrate that these narrow and intense resonances produced by the nanoparticle lattices allow for Raman transition specific enhancements. The system allows for independent tuning of both resonance conditions, enabling an efficient and versatile platform for Raman studies of various molecules.
1 Introduction
Raman scattering is a coherent nonlinear light–matter interaction process whereby photons couple with intramolecular vibrations.1–3 Due to Raman signal's sensitivity to individual bonds of the material, Raman spectroscopy has become one of the most prominent characterization methods in chemical analysis and biotechnology.4 Raman spectroscopy has also gained its popularity in the analysis of graphene5,6 and carbon nanotubes.7 DNA and other molecules8,9 have been successfully analyzed with Raman, and it has found applications in the fields of, for instance, forensic science,10 medical diagnostics,11 biological imaging,12 molecular detection13 and biosensing.14Raman scattering is a weak phenomenon with a cross-section of around 10–29 cm2 per molecule as compared to other optical processes such as fluorescence whose cross-section is around 10–19 cm2 per molecule.15 This weakness proved to be a drawback in applications with substantial background fluorescence. Raman signal intensity can be greatly increased by utilizing surface enhanced Raman scattering (SERS), in which analyte molecules are linked to the surface of metals.16 The origin of this enhancement was first associated with the roughness of the surface.17
However, Raman signal enhancement falls under two categories of enhancements (electromagnetic and chemical). The electromagnetic enhancement is usually the strongest and results from the coupling of both incident electromagnetic light and scattered light with local optical fields from the SERS substrate.18 Such a plasmonic effect can therefore benefit from the nano-patterning of the metal surface.
Localized surface plasmon resonances (LSPRs) are collective oscillations of conduction electrons in metallic nanoparticles. The resonance condition can be tuned by the choice of material, size, shape and the properties of the surrounding dielectric environment.19 The resonance is accompanied by enhanced near fields in the vicinity of the particle, which have been utilized in Raman spectrocopy.20,21 Metallic nanoparticle dimers have been employed to further enhance the fields at the gap of the dimer.22,23
The total electromagnetic enhancement in SERS24,25 is simply the product of the incident electric field intensity enhancement |E(λinc)|2 and the scattered field intensity enhancement |E(λsca)|2. This has led to the conclusion that, in a system supporting a single resonance, the maximum SERS enhancement is obtained when the fairly broad plasmonic resonance is spectrally located midway between the Raman excitation wavelength and the transitions of interest, therefore enhancing both the in coupling as well as the outcoupling efficiencies.26,27
In periodic nanoparticle arrays, when the interparticle separation is comparable to the wavelength of the incident light, the scattered fields interfere constructively with a localized surface plasmon resonance from an individual particle to create surface lattice resonances (SLRs).28–31 In this work, we propose a novel method of creating double resonance effects in silver nanoparticle arrays by using a periodic rectangular arrangement of silver nano-disks. We demonstrate the tunability of the incoupling of the Raman excitation wavelength by varying the periodicity in one dimension, i.e., px, and the tunability of the Raman enhancement of rhodamine 6G (R6G) by varying the periodicity of the lattice in the other direction, i.e., py. We experimentally demonstrate that a fine tuning of the strong and narrow resonances of the system enables an increase of the Raman signal intensities. Instead of the midway trade-off earlier proposed, we can here match the px with the excitation laser wavelength and simultaneously obtain a selective enhancement of each individual Raman transition of rhodamine 6G by scanning py.
2 Methods
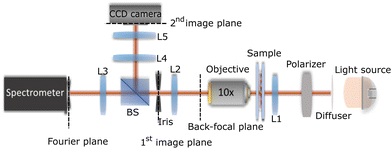
Our sample is a periodic arrangement of cylindrical silver nanoparticles with a periodicity px ranging from 500 nm to 540 nm (in steps of 10 nm) and a periodicity py ranging from 580 nm to 620 nm (in steps of 4 nm). The average measured diameter and height of the nanoparticles is 160 nm and 50 nm, respectively. In order to estimate the collective effect due to the periodicity of the device, we fabricated two arrays, where the nanoparticle positions are randomly distributed. Therefore the array does not provide the resonant enhancement originating from the constructive interference condition of ordered arrays. Particles in random array 1 are randomly distributed with no condition of the interparticle distance. To rule out randomly generated plasmonic hotspots, the particles in random array 2 have a minimum interparticle distance of 50 nm. Prior to measurements, a solution of rhodamine 6G was prepared by dissolving 5 mg of R6G in 4 ml of PMMA A3. Furthermore, a solution is spin coated on the Ag sample at 3000 rpm, 30 s without baking resulting in ≈120 nm thickness of R6G.Both the transmission and the SERS signals were measured, in two separate experiments. Fig. 1 illustrates the measurement setup for the transmission experiment. A halogen lamp is used as the light source, and a polarizer is placed before the sample to control the polarization of the incident light. An index matching oil (refractive index n ≃ 1.46) is employed together with a glass slide superstrate to provide a uniform optical environment for the sample. Real time images are observed via FLIR camera while taking measurements using an ANDOR S Kymera spectrometer. The sample is illuminated with a linearly polarized white light source. The light transmitted through the sample is collected with a 10× (NA = 0.3) microscope objective. The lenses, L2 and L3, form an image of the back focal plane of the objective on the input slit of the spectrometer, facilitating the angle-resolved transmission measurements. A beam splitter is used to divert 50% of the light to a camera for navigating on the sample, with the lenses L4 and L5 relaying the 10 × magnified real space image of the sample formed by the objective and lens L2. An iris is placed on the focal plane of L2 to select the area to be measured.
The Raman spectra of the structures were recorded with a commercial Renishaw Invia Reflex Raman microscope. We used a Raman excitation wavelength of λ = 785 nm to illuminate the sample. To reduce errors caused by sample imperfections, nine randomly located measurements are acquired for each array.
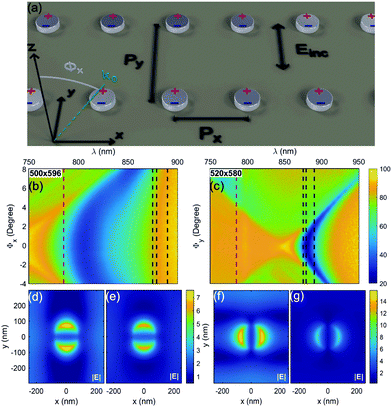
An intuitive understanding of SLRs can be obtained by considering a plasmonic lattice having a periodicity equal to the radiation wavelength in the medium with refractive index n, p = λ/n, see Fig. 2(a). Then, the radiation fields from all the particles interfere constructively at each particle location, creating a constant phase and increased dipole moment in each particle. This radiative coupling renders the originally localized plasmonic resonances into delocalized ones due to coherent coupling via radiation fields in each particle. Consider y-polarized electromagnetic radiation (Ey) incident on a rectangular plasmonic lattice. Such a field induces dipolar excitation in each particle, whose dipole moment is parallel with the Ey. This is shown by the near-field distribution in the xy-plane just above the silver nano-disks in Fig. 2(d)–(g). This result is obtained by finite difference time domain (FDTD) simulations. The radiation fields in this case are mainly propagating along the x-direction, rendering the system to be sensitive to the periodicity in the x-direction. However, in the case of the x-polarized incident field, the induced dipolar excitation mainly radiates along the y-direction, and therefore the resonant condition depends on the y-periodicity. Thus, the two resonances can be freely tuned independently from each other. In this study, we created double resonant structures, wherein the x-periodicity is tuned to be resonant with the Raman excitation wavelength λ = 785 nm, and the y-periodicity be resonant with the Raman transitions of rhodamine 6G molecules. Fig. 2(b) shows y-polarized resonances measured as a function of the wavelength and the out of plane radiation angle Φx. Fig. 2(c) shows the measurement results for the sample (px × py) with x-polarized light, therefore supporting resonances where radiative coupling takes place in the y-direction. These plots highlight the strongly dispersive, periodicity dependent character of SLRs. The transmission plots were also obtained by the numerical Fourier modal method (FMM), see the ESI.†
Fig. 2(d) shows the numerical finite difference time domain (FDTD) simulations for the field enhancement distribution under y polarized direct incidence light obtained for the (px = 500 nm, py = 596 nm) periodic array. The results demonstrate the strong near fields due to the plasmonic character of SLRs. Fig. 2(e) shows the corresponding data for a single particle, exhibiting slightly lower field enhancements as compared to the periodic arrangement. Fig. 2(f and g) show corresponding data for the (px = 520 nm, py = 580 nm) periodic array for x-polarized light. Notably, the array produces significantly higher field enhancements (f) as compared to the single particle (g).
3 Results
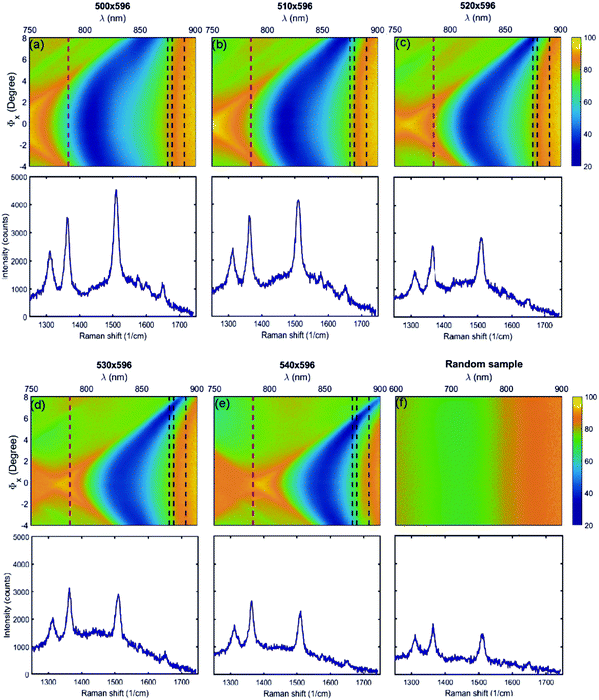
We present angle and wavelength resolved transmission measurements for different periodicities and identify their effect on the SERS signal. In x-periodicity induced effects, we consider a fixed period py = 596 nm and vary px from 500 nm to 540 nm. At px = 500 nm we observe that the Raman line is a bit blue-shifted from resonance. The Raman excitation wavelength is λ = 785 nm and is represented as a red dotted line in Fig. 3 and 4. At resonance the extinction is about 45%, which is nevertheless significantly more than what is expected from the geometrical cross section of the nanoparticles 4.58%.32We can identify three Raman peaks33 related to rhodamine 6G (R6G) molecules, namely at 1310 cm−1, 1365 cm−1, and 1510 cm−1. For px = 510 nm, we have further shifted the resonance away from the Raman excitation wavelength. At resonance the extinction is around 25%. In the Raman signal this shows a slight decrease of the intensity as compared to the px = 500 nm case. A further increase in periodicity to px = 520 nm reduces the Raman signal to about 65% less than that of the px = 510 nm case. Notably, the transmission has increased to about 80%. Finally, px = 530 nm and 540 nm do not significantly affect the Raman signal anymore, apart from the relative ratio. Namely, the two lowest wavelength Raman peaks have higher relative intensities as compared to previous cases. We believe this is due to increasing overlap of the x-periodicity related SLR with the Raman transitions of R6G. We further studied the periodicity related effects by comparing them to a random sample having the same size, shape and density of nanoparticles located randomly on the substrate. In particular, this distinguishes single particle effects from the lattice induced effects. In general we found that randomly distributed particles produce significantly lower Raman intensities as compared to the ones from the ordered arrays. Overall, we observed somewhat strong variation in the Raman signal between the different periodicities in the ordered arrays. The analysis of all the above samples reveals a clear correlation between the Raman peak intensities and extinction at Raman laser wavelength, which further confirms the central role of the SLRs for Raman enhancement, see ESI Fig. A2(a).†
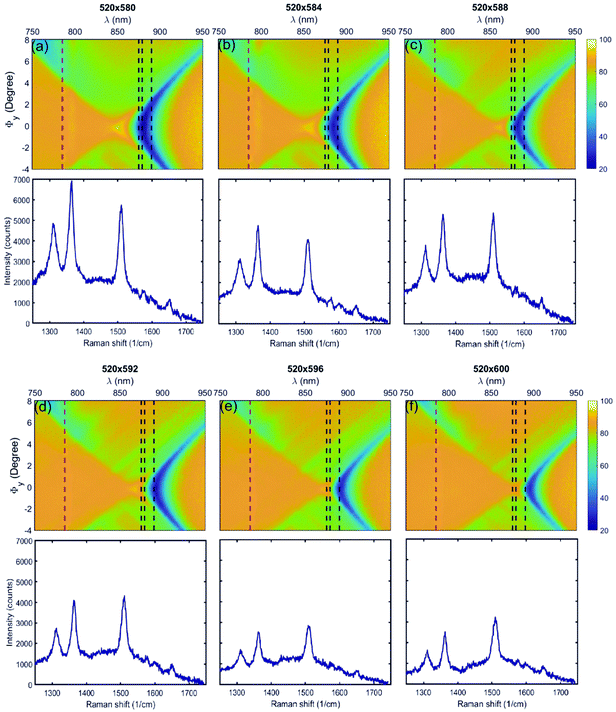
For y-periodicity induced effects, we varied py from 580 nm to 600 nm, keeping px = 520 nm fixed. At py = 580 nm we observed distinctive Raman peaks. The resonance notably overlaps with all three major Raman transition peaks of the R6G. We observed a somewhat strong decrease of intensities for py = 584 nm, even though all three Raman peaks are well coupled to the resonance. This might be caused by the sample imperfections. The period py = 588 nm shows a slight increase of intensities compared to py = 584 nm. However, the relative intensities have changed, i.e., the most red-shifted Raman peak is more pronounced, whereas in the py = 584 nm case the central peak was the most intense. This is associated with the slight red-shift of the resonance, demonstrating the possibly of a selective enhancement of the signal due to a particular targeted Raman transition. For py = 592 nm, the overall intensity of Raman peaks has decreased due to SLR resonance being red-shifted away from the three main Raman transitions. The same trend is observed in py = 596 nm and 600 nm samples, hence confirming the above assumption. Furthermore, the third highest wavelength peak increases in relative intensity as py is increased. This is in accordance with the py related SLR resonance becoming selectively resonant with the longest wavelength Raman transition.
In ESI Fig. A2(b)† we plot the Raman peak intensities and the corresponding extinction at each Raman peak wavelength for all the samples. We observe a strong correlation between the peak intensities and extinction, which confirms that py related resonances can induce Raman enhancement similar to px induced effects.
Thus, this measurement demonstrates a periodicity dependent resonant Raman enhancement, as well as selective Raman transition specific enhancement enabled by the narrow linewidths and strong resonances of the SLRs. It shows that one can tailor a plasmonic structure to selectively enhance particular Raman transitions. The two dimensional structure allows for independent tuning of the two SLR resonances, which was utilized here by matching one resonance with the Raman laser and the other with Raman transitions of interest. In an experiment where the metallic film over nanosphere (FON) was employed,26 it was found that maximum Raman enhancement occurs when the resonance is between the Raman excitation wavelength and the Raman transition peaks. We believe this statement is true when only one resonance is allowed by the plasmonic structure. In our case, two resonances exist, allowing us to dedicate one to the enhancement of the excitation and one to the signals independently. Importantly, the two resonances are orthogonally polarized which raises a natural question whether both of them can couple simultaneously to a single molecule.
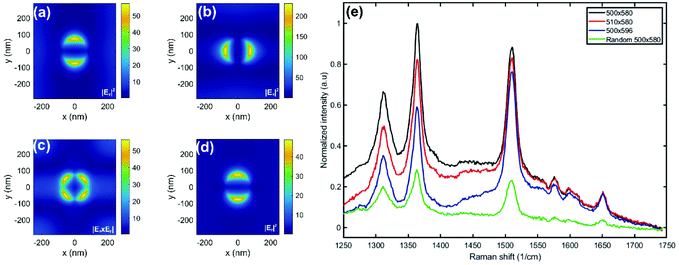
To answer this question, we simulated a case where both periodicities are resonant simultaneously, namely with periodicities px = 500 nm, py = 580 nm. Fig. 5(a) shows the field intensity at the y-polarized Raman excitation wavelength and (b) shows the x-polarized intensity at the wavelength corresponding to the middle (1365 cm−1) Raman transition. In (c), we plot the product of the field amplitudes of (a) and (b). Due to orthogonal polarizations of the Raman excitation wavelength and the Raman transitions, the resultant enhancement exhibits a four-fold pattern. In Fig. 5(c) we compare this result with a simulation for a single nanoparticle, where we multiply the field amplitude at the Raman excitation wavelength with the one corresponding to the middle Raman transition. Notably, the multiplication results in slightly higher enhancement in the periodic structure.
We also fabricated and measured arrays that were optimized in both directions, as well as “x-detuned” and “y-detuned” arrays, in which only one periodicity is resonant with the structure, see Fig. 5(e). For the optimized structure (black curve), we observed three pronounced peaks corresponding to the R6G Raman transitions of interest. By detuning the x-periodicity by 10 nm to px = 510 nm, the Raman intensity decreases by approximately 10 to 20% due to reduced incoupling of the Raman excitation wavelength (red curve). Similarly, we observed a strong decrease of the Raman signal (blue curve) by detuning only the y-periodicity from 580 nm to 596 nm. Note, however, only a very minor decrease of intensity at the 1510 cm−1 peak was observed, as it is still resonant with the y-periodicity related SLR (see also Fig. 5(e)). Finally, the random array (green curve) having the same particle density as the optimized structure shows significantly reduced intensity as compared to the optimized array. Thus our results demonstrate a simultaneous enhancement of both incoupling of the Raman excitation wavelength and the Raman transitions of interest.
We point out that this does not necessarily imply higher enhancement for the periodic arrays as compared to random arrays in all cases. Firstly, the diameter of the nanoparticle in our case is such that the single particle resonance is located at around 710 nm. In order to have a fair comparison, the particle diameter should be increased to bring the single particle resonance to midway between the Raman excitation wavelength and the Raman transitions of interest. This diameter, however, is not ideal for the arrays supporting SLRs: due to the Fano-type lineshape, bringing the single particle resonance to the red side of the diffracted order induces a destructive interference at the Raman laser wavelength therefore preventing the incoupling.
A conclusive experiment would therefore require scanning not only px and py, but also the particle size. Our simulation for the optimized “random array” with the diameter chosen such that the resonance is indeed midway between the Raman laser and transitions can be seen in ESI Fig. A2.† The overall enhancement is comparable to (d), and therefore we do not expect a significant enhancement for such a case as compared to (d).
Secondly, from the application perspective, a random array could be filled with more particles per unit area than the SLR array, therefore potentially resulting in a higher overall signal per unit area. For a conclusive experiment, also the particle density should then be varied. On the other hand, the delocalized nature of SLRs provides a highly directional beam that could allow for high collection efficiency, which could be beneficial in commonly occurring cases where the numerical aperture of the collection optics is limited.
Finally, one more reason why a direct comparison to random arrays is difficult is as follows: while the intensities in (c) and (d) are comparable, in order for the molecule to couple to both resonances, it should be oriented in such a way that the transition dipole moment is non-zero in both x- and y-directions. For instance, a transition dipole moment with 45° to the x-axis reduces both the Raman excitation wavelength coupling to the molecule, and the Raman signal by half. An interesting exception is presented by molecules having a high depolarization ratio, which exhibit strong Raman scattering with polarization perpendicular to the Raman laser polarization. Depolarization ratios for some molecules can be in excess of 0.75,34 making double resonant SLRs a potentially ideal platform for their studies, as more conventional single resonance structures are the most efficient for low depolarization ratios.
One appealing feature of ordered arrays relates to the optical losses. In a single resonant structure, the overall enhancement is governed by the overlap of that resonance with both Raman laser and transitions of interest. Thus, a very broad resonance is desirable for maximal coupling to both wavelength regions. However, a broad resonance is necessarily associated with significant optical losses. Thus, in conventional structures, a trade-off between maximal overlap and photon loss is inherently present. In SLR based structures, a narrow resonance can be tuned to overlap with any wavelength of interest, therefore circumventing the fundamental trade-off present in conventional single resonance based structures. Yet another interesting feature of ordered arrays is the delocalized nature of the resonances, which results in higher directionality of the signal as compared to the randomly oriented particles. This could greatly enhance the collection and pumping efficiency of the Raman signal, and could play a role in the present observations as well. Quantifying these effects, together with particle size effects, as well as studies for high depolarization ratio molecules will provide interesting future prospects for Raman studies in double resonant SLR modes.
4 Conclusions
To conclude, we have demonstrated double resonance effects in rectangular lattices of plasmonic nanoparticle arrays. The resonances are composed of two orthogonally polarized radiation fields, which enable their tuning independently. The Raman signal enhancement is shown to depend on the spectral overlap of the SLR resonance along the x-direction with the excitation laser, as well as from the spectral overlap of the y-direction resonance with the Raman transitions of R6G molecules. The electron beam lithography employed for the fabrication allows for tuning the resonance condition with nanometric precision. Random array was used as a reference, further confirming the crucial role of periodicity induced effects. Our results pave the way for versatile double resonant structures, capable of providing enhancement for a variety of Raman excitation wavelengths and molecules to be used. Future prospects include the optimization of such structures for maximal Raman enhancement, as well as angle and polarization resolved Raman studies of molecules belonging to different point symmetry groups.Conflicts of interest
There are no conflicts to declare.Acknowledgements
This work is part of the Academy of Finland Flagship Programme, Photonics Research and Innovation (PREIN), decision 321066. Support of Academy of Finland project numbers 322002, 322022 and 324353 is gratefully acknowledged.References
- C. V. Raman, Nature, 1928, 121(3051), 619 CrossRef CAS.
- M. Moskovits, Rev. Mod. Phys., 1985, 57, 783 CrossRef CAS.
- R. W. Boyd, Nonlinear optics, Academic press, 2019 Search PubMed.
- S. Schlücker, Angew. Chem., Int. Ed., 2014, 53, 4756–4795 CrossRef.
- Z. Tao, J. Du, Z. Qi, K. Ni, S. Jiang and Y. Zhu, Appl. Phys. Lett., 2020, 116, 133101 CrossRef CAS.
- D. L. Silva, J. L. E. Campos, T. F. Fernandes, J. N. Rocha, L. R. Machado, E. M. Soares, D. R. Miquita, H. Miranda, C. Rabelo and O. P. V. Neto, et al. , Carbon, 2020, 161, 181–189 CrossRef CAS.
- S. Li, X. Wei, L. Li, J. Cui, D. Yang, Y. Wang, W. Zhou, S. Xie, A. Hirano and T. Tanaka, et al. , Anal. Methods, 2020, 12, 2376–2384 RSC.
- V. V. Thacker, L. O. Herrmann, D. O. Sigle, T. Zhang, T. Liedl, J. J. Baumberg and U. F. Keyser, Nat. Commun., 2014, 5, 3448 CrossRef.
- B. S. Bhardwaj, T. Sugiyama, N. Namba, T. Umakoshi, T. Uemura, T. Sekitani and P. Verma, Sci. Rep., 2019, 9, 1–9 CrossRef CAS.
- E. L. Izake, Forensic Sci. Int., 2010, 202, 1–8 CrossRef CAS.
- K. Kong, C. Kendall, N. Stone and I. Notingher, Adv. Drug Delivery Rev., 2015, 89, 121–134 CrossRef CAS.
- T. Vo-Dinh, F. Yan and M. B. Wabuyele, J. Raman Spectrosc., 2005, 36, 640–647 CrossRef CAS.
- H. S. Gill, S. Thota, L. Li, H. Ren, R. Mosurkal and J. Kumar, Sens. Actuators, B, 2015, 220, 794–798 CrossRef CAS.
- A. M. Mohs, M. C. Mancini, S. Singhal, J. M. Provenzale, B. Leyland-Jones, M. D. Wang and S. Nie, Anal. Chem., 2010, 82, 9058–9065 CrossRef CAS.
- G. P. Kumar, J. Nanophotonics, 2012, 6, 064503 CrossRef.
- X. Wang, X. Bai, Z. Pang, J. Zhu, Y. Wu, H. Yang, Y. Qi and X. Wen, Opt. Mater. Express|, 2019, 9, 1872–1881 CrossRef CAS.
- D. L. Jeanmaire and R. P. Van Duyne, J. Electroanal. Chem. Interfacial Electrochem., 1977, 84, 1–20 CrossRef CAS.
- M. Fleischmann, P. J. Hendra and A. J. McQuillan, Chem. Phys. Lett., 1974, 26, 163–166 CrossRef CAS.
- K. L. Kelly, E. Coronado, L. L. Zhao and G. C. Schatz, The optical properties of metal nanoparticles: the influence of size, shape, and dielectric environment, 2003 Search PubMed.
- P. K. Jain and M. A. El-Sayed, Chem. Phys. Lett., 2010, 487, 153–164 CrossRef CAS.
- P. L. Stiles, J. A. Dieringer, N. C. Shah and R. P. Van Duyne, Annu. Rev. Anal. Chem., 2008, 1, 601–626 CrossRef CAS.
- E. Hao and G. C. Schatz, J. Chem. Phys., 2004, 120, 357–366 CrossRef CAS.
- K. L. Wustholz, A.-I. Henry, J. M. McMahon, R. G. Freeman, N. Valley, M. E. Piotti, M. J. Natan, G. C. Schatz and R. P. Van Duyne, J. Am. Chem. Soc., 2010, 132, 10903–10910 CrossRef CAS.
- K. B. Crozier, W. Zhu, D. Wang, S. Lin, M. D. Best and J. P. Camden, IEEE J. Sel. Top. Quantum Electron., 2013, 20, 152–162 Search PubMed.
- C. Lu, Z. Qi, X. Hu, Z. Ni and Y. Cui, Opt. Commun., 2019, 452, 494–498 CrossRef CAS.
- W. Li, X. Zhao, Z. Yi, A. M. Glushenkov and L. Kong, Anal. Chim. Acta, 2017, 984, 19–41 CrossRef CAS.
- K. A. Willets and R. P. Van Duyne, Annu. Rev. Phys. Chem., 2007, 58, 267–297 CrossRef CAS.
- R. J. Moerland, T. K. Hakala, J.-P. Martikainen, H. T. Rekola, A. I. Väkeväinen and P. Törmä, Quantum Plasmonics, Springer, 2017, pp. 121–150 Search PubMed.
- S. R. K. Rodriguez, A. Abass, B. Maes, O. T. Janssen, G. Vecchi and J. G. Rivas, Phys. Rev. X, 2011, 1, 021019 Search PubMed.
- V. Kravets, F. Schedin and A. Grigorenko, Phys. Rev. Lett., 2008, 101, 087403 CrossRef CAS.
- B. Auguié and W. L. Barnes, Phys. Rev. Lett., 2008, 101, 143902 CrossRef.
- S. D. Rezaei, J. Ho, R. J. H. Ng, S. Ramakrishna and J. K. Yang, Opt. Express, 2017, 25, 27652–27664 CrossRef CAS.
- J. Rahomäki, T. Nuutinen, L. Karvonen, S. Honkanen and P. Vahimaa, Opt. Express, 2013, 21, 9060–9068 CrossRef.
- G. W. Lucassen, W. P. De Boeij and J. Greve, Appl. Spectrosc., 1993, 47, 1975–1988 CrossRef CAS.
Footnotes |
| † Electronic supplementary information (ESI) available. See DOI: 10.1039/D0NR05255H |
| ‡ These authors contributed equally to this work. |
| This journal is © The Royal Society of Chemistry 2020 |

