
 Open Access Article
 This Open Access Article is licensed under a
 Creative Commons Attribution 3.0 Unported Licence
Engineered liquid crystal nano droplets: insights from multi-scale simulations†
Zeynep
Sumer
 a,
F. Anibal
Fernandez
b and
Alberto
Striolo
*a
a,
F. Anibal
Fernandez
b and
Alberto
Striolo
*a
aDepartment of Chemical Engineering, University College London, London WC1E 7JE, UK. E-mail: a.striolo@ucl.ac.uk
bDepartment of Electronic & Electrical Engineering, University College London, London WC1E 7JE, UK
First published on 29th September 2020
Abstract
Liquid crystal (LC) droplets have been investigated for a wide range of applications, from displays to sensors. Over the years, a need has arisen for complete understanding of the behaviour of LCs in droplets under different conditions for the development of advanced devices, for which accurate modelling is necessary. We show here, for the first time, both qualitative and quantitative agreement between coarse-grained molecular models and Q-tensor theory calculations for liquid crystal (LC) droplets. The approach is demonstrated for two types of droplet surfaces, which possess strong planar degenerate and strong homeotropic anchoring, respectively. Once its reliability has been proven, our approach was used to identify defects due to changes in anchoring in a small region on the LC droplet surface, which could be triggered, for example, by the adsorption of a nano-particle or a protein. Both coarse-grained simulations and Q-tensor analysis show the appearance of defects in well-determined locations within the LC droplet, albeit sometimes affected by degeneracy due to the symmetry of the systems being investigated. These results suggest the possibility of using LC droplets, in the future, as platforms for advanced sensing as well as for signal intensification.
1. Introduction
Liquid crystals (LC) attract vast technological interest because they yield different ordered/disordered structures at various temperature ranges. Changes in optical properties related to these structures are the foundations of high-resolution display screens or very sensitive chemical sensors, for example.1,2 Physical properties imposed by boundary conditions can cause defects, such as in confined geometries of LC droplets. The chemical, elastic and/or electric properties of mesogens determine types of defect structures alongside the confinement. Since the 19th century, there has been a tremendous effort to understand LC behaviour. In many cases, defects are essential for performance and enable the final applications.3,4 So far, LC technology is mostly guided by experimental results, leading to a gap in proper optimization processes. Although not equally mature as experiments, theoretical modelling and numerical calculations have been extremely helpful to understand the relevant phenomena.5 The hurdle is due, in part, to incommensurate observations between experiments, which probe length scales of several hundred micrometres, and molecular simulations, which probe events that occur at the nanometre scale.To further develop advanced applications, it is desirable to understand how defects propagate or emerge in LC structures as a function of the mesogens anchoring, which could be altered using surfactants, polymer encapsulation, or other techniques, as well as of the degree of confinement (e.g., size of the LC droplet). Confinement could potentially yield an additional tuning handle to complement changes in thermodynamics conditions.6,7 Devices have in fact been developed using encapsulated LC droplets, where the encapsulating shell is capable of changing the alignment in LC surface anchoring, e.g., responding to reactions with different substances.8–10 The cumulative effect due to system changes, such as the imposition of external electric fields or changes in temperature, is generally tractable using computational approaches. On the other hand, a reliable model able to describe the localized effect due to an external substance is currently missing, in part because LC confinement occurs at lengths scales that are smaller than those probed by continuum models, and larger than those typically probed by molecular and coarse-grained simulations. It would therefore be desirable to connect molecular and/or coarse-grained simulations, seamlessly, to Q-tensor results to develop accurate models across multiple length scales.
Among other theoretical approaches, the Landau-de Gennes continuum theory,11,12 which describes the behaviour of the LC through an order tensor and considers order variations, is often employed to study LC structures because it can deal with larger length scales than molecular simulations. Although the chemical features of the LC mesogens are sometimes overlooked in the continuum models, as they are only considered through the macroscopic material properties, the approach describes, for example, how the energy densities associated to different elastic distortions change with the anchoring conditions. Good agreement with macroscopic experiments is often reported.13–15 When the degree of confinement is high, for example in LC droplets of nano-meter scale diameter, it is however expected that the chemical features of the mesogens play an important role. To assess such features, a shift from continuum calculations to molecular simulations is necessary. Previous simulation studies were indeed useful to elucidate the mechanism of supramolecular ordering with respect to change in size or anchoring on the surface of LC droplets,7,16 or in bulk nematic phases.17–20 Other studies focused on the molecular orientation as a function of temperature and changes in the interaction with homogeneous shells surrounding the LC droplets.21,22 Despite these advancements, the length scale in between molecular simulations and continuum models remains little explored by available computational approaches, although future technologies are likely to require underpinning understanding at the meso-scale.
For example, detection by LC droplets is possible when changes in orientational order can be detected within the local environment. The LC ordered structure is strongly dependent on the molecular surroundings: how neighbouring molecules are aligned, or how the interfacial conditions change. The anchoring strength at interfaces is known to dominate the behaviour of LC molecules. In a LC droplet with, for example, homeotropic anchoring with respect to the surroundings, adsorption of an analyte that promotes planar degenerate anchoring could create a surface defect, which could propagate through the droplet. How pronounced are such defects? How far can they propagate? Could they be detected? How do they interact with other internal defects? To answer these questions, we propose here a meso-scale approach that combines the strengths of continuum theory and coarse-grained simulations. Coherence of these two approaches is of particular importance because both scale-up and scale-down are possible starting from our results.
2. Methods and algorithms
2.1. Dissipative particle dynamics (DPD) simulations
Our coarse-grained models are schematically shown in Fig. 1. All simulations in this work are conducted in a spherical shell, with different repulsive surfaces. Shells are composed of 20![[thin space (1/6-em)]](https://www.rsc.org/images/entities/char_2009.gif) 000 beads arranged in a hollow sphere formation. Inside these shells, there are 5000 inert beads, and 16000 rods. One rod occupies the volume equivalent to two 5CB molecules, approximately. Each rod is composed of 6 beads connected with springs. Such model was tested in our previous work, where an isotropic to nematic transition was observed with respect to temperature in bulk, as well as in droplets.23,24 The tips of these rod-like structures have a different affinity towards the surrounding shell than the core. A harmonic spring is defined between consecutive LC beads in a mesogen to ensure its molecular rigidity. Bond length Ebond = kbond × (r − r0)2 and bond bending potentials Eangle = kangle × (θ − θ0)2 are used, where r represents the distance between two beads, and θ represents the angle between two bonds that connect three consecutive beads. The harmonic spring length (r0) is set to 0.6 and angle between three beads (θ0) is set to 180°. Both kbond and kangle are equal to 100kBT/r2 for describing interactions between adjacent beads.
000 beads arranged in a hollow sphere formation. Inside these shells, there are 5000 inert beads, and 16000 rods. One rod occupies the volume equivalent to two 5CB molecules, approximately. Each rod is composed of 6 beads connected with springs. Such model was tested in our previous work, where an isotropic to nematic transition was observed with respect to temperature in bulk, as well as in droplets.23,24 The tips of these rod-like structures have a different affinity towards the surrounding shell than the core. A harmonic spring is defined between consecutive LC beads in a mesogen to ensure its molecular rigidity. Bond length Ebond = kbond × (r − r0)2 and bond bending potentials Eangle = kangle × (θ − θ0)2 are used, where r represents the distance between two beads, and θ represents the angle between two bonds that connect three consecutive beads. The harmonic spring length (r0) is set to 0.6 and angle between three beads (θ0) is set to 180°. Both kbond and kangle are equal to 100kBT/r2 for describing interactions between adjacent beads.
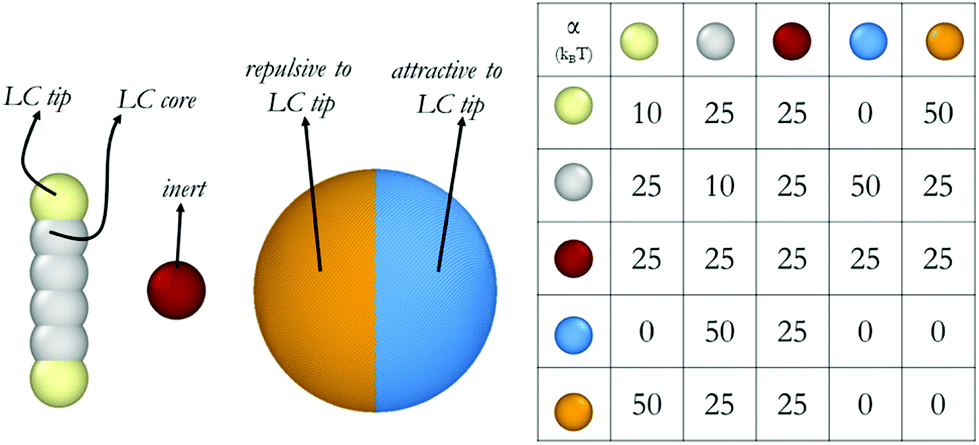 | ||
| Fig. 1 Molecular models and repulsion parameters implemented for the DPD calculations conducted in this study. | ||
The simulations were conducted using the Dissipative Particle Dynamics (DPD) algorithm,25 as implemented in the LAMMPS software package.26 Full details of the DPD simulation methodology can be found elsewhere.25,27,28 Simulations are performed in the NVE ensemble. In DPD, the balance between dissipative and random forces serves as a thermostat.25 To conduct DPD simulations via implementing the popular NVT or NPT ensembles, one would thermostat the system twice. Standard NVT type DPD simulations are conducted in LAMMPS by implementing the NVE ensemble.
In our representation, we build from our prior DPD simulations, in which one DPD water bead represented five water molecules. The DPD time scale was calculated by using simulated water self-diffusion coefficient Dsim = 0.0123r2/τ, as explained elsewhere.29 The inert beads used in the DPD simulations discussed here are of the same volume as the DPD water beads, and they have the same affinity towards all beads in the system. The friction coefficient and the random force, which are related by the equation σ2 = 2γkBT, were γ = 4.5 and σ = 3, respectively.25 The outcome of DPD simulations depend strongly on the parameterization, particularly self-repulsion parameters (αii) and inter-species repulsion coefficients. The parameters implemented here are provided in Fig. 1. As already mentioned, the parameters implemented to simulate the mesogens yield realistic disorder-to-order transitions as a function of temperature when conducted for bulk systems.24 The parameters chosen for the interactions between the mesogens and the spherical shell represent two extremes, yielding strong planar degenerate and strong homeotropic anchoring. It is likely that many realistic scenarios will fall in between these two extremes. All simulations are run for 6 × 10⁶ steps, with integration time Δt defined as 0.01 τ. Thus, our simulations were conducted for at least ∼0.9 μs, with the last 0.15 μs used for data analysis. To ensure reproducibility, each system was simulated three times, with different initial configurations. The systems were kept at 0.5kBT. A 50 × 50 × 50 r3 simulation box was used where the shell has the diameter of 40 r, corresponding to ∼30 nm. In our previous work, asphericity analysis revealed that 30 nm droplets with 16000 rods can easily be defined as droplets rather than aggregates.23 Because we showed that the droplets that are larger than ∼20 nm in diameter possess acceptable orientational order and asphericity to be considered for further analysis. In the present simulations, the shells were forced to remain in the middle of the simulation box throughout the run, therefore periodic boundary conditions were not necessary. Initial configurations were created by random distribution of LC and water molecules inside the shell. No mass transfer was allowed through the shell walls.
2.2. Orientational order calculations for DPD results
The orientational order of nematic liquid crystals is described by an order tensor which in the uniaxial form takes the shape:11,12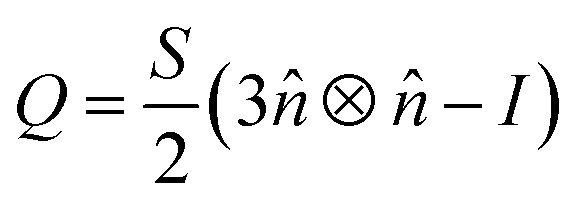 | (1) |
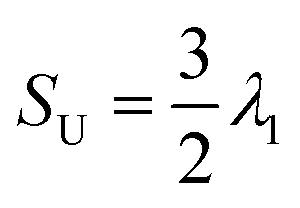
![[n with combining circumflex]](https://www.rsc.org/images/entities/i_char_006e_0302.gif) is the liquid crystal director. This is a symmetric, traceless tensor and its dominant eigenvalue is S, the scalar or uniaxial order parameter. Adapted to DPD calculations that yield an ensemble of molecular positions and orientations, a global counterpart can be written as:22
is the liquid crystal director. This is a symmetric, traceless tensor and its dominant eigenvalue is S, the scalar or uniaxial order parameter. Adapted to DPD calculations that yield an ensemble of molecular positions and orientations, a global counterpart can be written as:22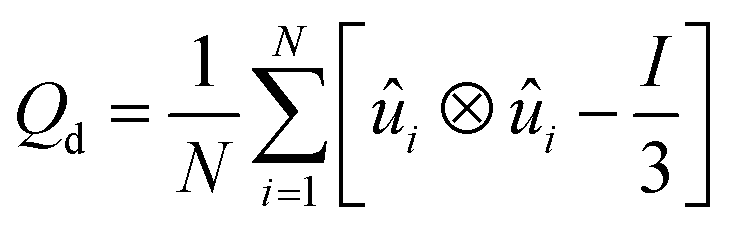 | (2) |
 | (3) |
Previously, de Pablo and co-workers discussed a global order parameter SR, the radial order parameter to quantify the degree of satisfaction of a perfect radial order inside an LC droplet:22
 | (4) |
2.3. Q-tensor simulations
The Q-tensor simulations were conducted using the model and computer programs developed by Fernandez and co-workers30–32 based on the Landau-de Gennes theory. The reference work describes the Q-tensor statistics and algorithm of the software in detail.30,32 The method consists of finding the Q-tensor distribution over the complete volume, that minimizes the total free energy of the system, which is composed by the thermotropic energy (FB), the elastic distortion energy (FD), and the surface energy (FS).11,12,32 Difference from DPD lays in the fact that individual molecular behaviour is not considered, as LCs are described with a continuous order tensor representation. The Q-tensor methodology can investigate LC systems that are in 102 μm range, without being too computationally demanding.For FB and FD calculations, the chosen parameters correspond to 5CB.33 For FS calculations, we defined two surfaces that impose strong planar degenerate or strong homeotropic anchoring.31 Strong anchoring conditions are defined as boundary conditions and do not contribute directly to the free energy. Weak anchoring of any type is defined by their direction and strength and lead to a calculation of a surface anchoring energy as part of the total free energy. All parameters used in this study can be found in Table 1. When the interest is limited to the characterisation of the general behaviour, the thermotropic parameter A in Table 1 would normally be taken to be zero, which would correspond to a case equivalent to T = T*, i.e., the temperature is assumed to be equal to transition temperature (T*).34,35 In our case, we use A < 0, corresponding to a temperature < T*; the results from additional calculations with A = 0 are discussed in ESI.†
| Calculation | Parameter | Units | Value |
|---|---|---|---|
| F B | A | N/m2 | −1.27 × 10⁶ |
| B | −2.26 × 10⁶ | ||
| C | 1.73 × 10⁶ | ||
| F D | K11 | pN | 6.2 |
| K22 | 3.9 | ||
| K33 | 8.2 | ||
| F s | Homeotropic | — | Strong |
| Planar degenerate | Strong |
We built a mesh structure composed of tetrahedral elements for a spherical droplet of the 0.1 μm size. The code performs adaptive meshing, namely meshes can be reformed and are eventually concentrated around the disclinations as the calculations evolve. Such property enables the user to obtain a clear defect structure. In this work, we iterated the calculations until the largest change in Q-tensor value was below five significant digits. After identifiying the final results, simulations were repeated and mesh reforming occurred every 20 steps for elements within which the Q-tensor change exceeds 0.3. For example, the number of nodes was increased from approximately 2500 to 9000 or more, from the initial to the final mesh, respectively, to refine the analysis of the defect regions.32
3. Results and discussion
We investigated LC droplets confined in spherical shells using both continuum and molecular approaches. At the continuum level, using the finite-element method,30,32,33 we obtained a clear map of the defects within the droplet as a function of surface anchoring conditions. For these calculations the droplets are 0.1 μm in diameter and the LC mesogens are described by a Q-tensor field, therefore losing, in part, their chemical identity. Towards the molecular level, coarse-grained Dissipative Particle Dynamics (DPD) simulations25 provided detailed information regarding the local surroundings. DPD is a coarse-grained simulation technique that maintains some degrees of chemical specificity in the simulated fluids. Our DPD calculations were conducted for droplets of diameter 30 nm. Note that these sizes approach the lower and upper limit for Q-tensor field and DPD simulations, respectively. Our aim is to bridge across the scope and capabilities of these two methods. To the best of our knowledge, this is the first time that finite element and molecular models, albeit coarse-grained, yield consistent results for LC applications within a nano-cavity of spherical geometry, which we believe will be beneficial for device miniaturization and optimization.Validation of the proposed computational approach was achieved on three systems, as shown in Fig. 2. The results in this figure are organised column by column. The first column represents the results obtained for a LC droplet on which fully homeotropic surface anchoring was imposed. The second column shows a LC droplet on which fully planar degenerate anchoring was imposed. The results show that the former droplet assumed a radial order, while the latter assumed a bipolar order. Throughout this manuscript, the terms planar degenerate and homeotropic anchoring will be used to represent surfaces that (by itself) impose bipolar and radial configurations within the droplets, respectively, consistent with reports from the literature, in particular the pioneering work of Volovik and Lavrentovich.36–39 We used the ratio of imposed planar degenerate anchoring surfaces on the droplets to name their configurations. For example, 0% planar degenerate anchoring represents a droplet on which radial anchoring was imposed on the entirety of its surface, whereas 50% planar degenerate anchoring represents a droplet on which radial anchoring was imposed on half of its surface (the rest being planar degenerate anchoring). The third column summarises the results obtained for a LC droplet in which the two anchoring conditions are both present, yet divided into two equal hemispheres. In the continuum approach, we represented the surface of the LC droplet as two different surfaces. These surfaces show strong anchoring to yield planar degenerate or homeotropic anchoring (see Methods and algorithms for details). In our DPD simulations, we built a shell around the LC droplets, which interact with the LC mesogens via different repulsion parameters optimised to yield anchoring consistent with the continuum model. For consistency, we refer to planar degenerate and homeotropic anchoring conditions also when discussing the DPD results.
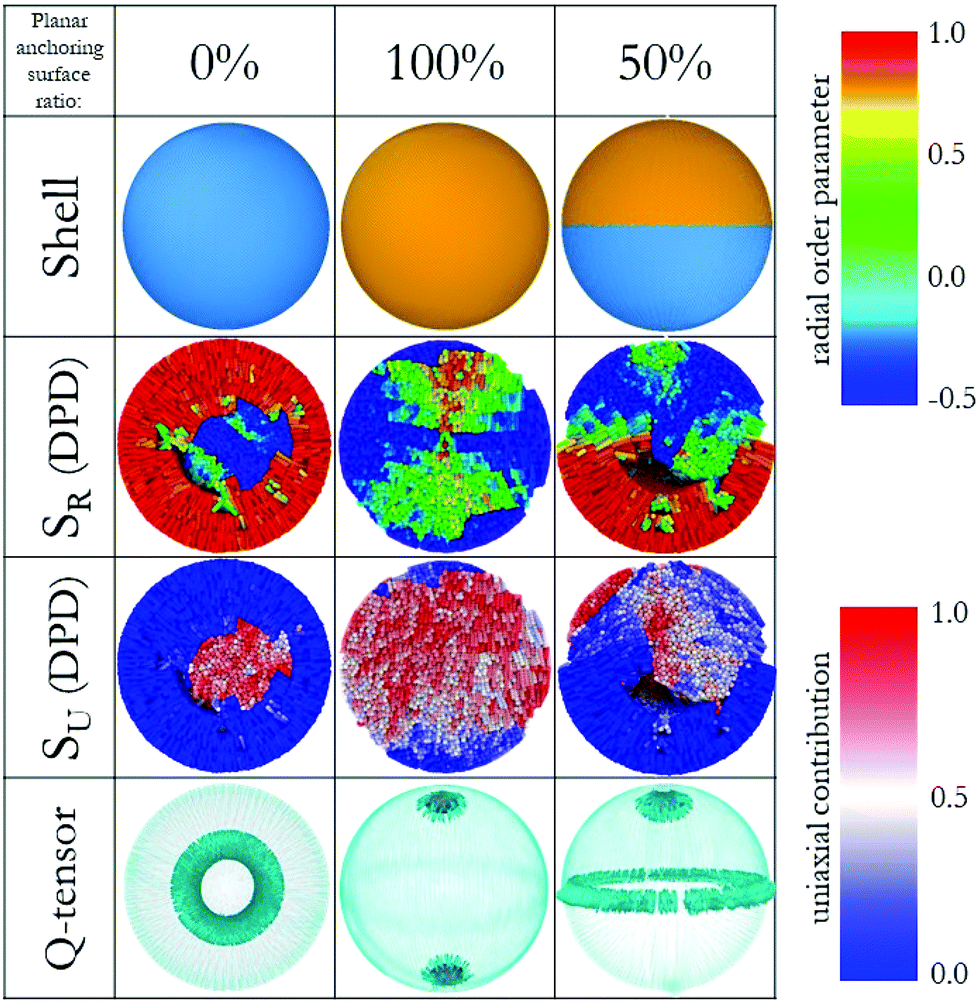 | ||
| Fig. 2 (Top) Three droplet shells with different anchoring surfaces, homeotropic (blue) and planar degenerate (orange). (Middle) Color-coded LC molecules with respect to SR (up) and SU (down). (Bottom) Snapshots of simulations performed by the finite-element method with emphasis on defect structures, the images show surfaces of constant order for a low value of S (see Methods and algorithms for details). For clarity, director maps are not included here, but they can be found in Fig. 4. | ||
In Fig. 2, the various shells that yield fully homeotropic anchoring (blue), fully planar degenerate anchoring (orange) and half-homeotropic and half-planar degenerate anchoring (blue and orange) are shown. For the three columns in Fig. 2, we calculated global orientational order parameters from the DPD simulations via the protocol suggested by de Pablo and co-workers.22 We differentiate radial (SR) and uniaxial order (SU), respectively, as the corresponding parameters approach unity if the system is in perfect radial or a linear arrangement, respectively. In a confined system like a droplet with planar degenerate surface anchoring, we expect a bipolar orientation. By the nature of these calculations, color-coding each LC coarse-grained molecule according to its order parameter is possible for SR, but not for SU.
To visualise the latter results, we plot in Fig. 2 the contribution of each molecule to the linear orientation. The DPD simulations yield for the fully homeotropic shell an overall SU value of 0.09 ± 0.01 and an overall SR value of 0.80 ± 0.003. These results indicate that the mesogens in the LC droplet conform with a radial distribution, as expected. The color-coded map of LC molecules for SR results shows that the only possible defect for this system appears near the core of the droplet. The color-coded SU map helps understand why the correspondent order parameter was very low: the LC mesogens oriented horizontally within the droplet antagonize those oriented vertically (in the frame of Fig. 2), decreasing the cumulative order. The continuum calculations help visualise the shape of the defect structure, a ring defect, expected to emerge clearly as the droplet size increases. This defect structure could be a hedgehog, depending on the molecular features and thermodynamic properties.40,41 Note that the elastic energy and thermotropic energy parameters used in this study for finite-element method were representative of 5CB.33
For the LC droplet with fully planar degenerate anchoring, both models show evidence of a bipolar alignment among the LC molecules, as expected. Consistent with expectations, the DPD simulations yield cumulative order parameters SU ∼ 1.05 ± 0.02 and SR ∼ −0.18 ± 0.01, while the continuum model provides evidence for two +1 splay-type boojums. We recognise that, by definition, SU ≤ 1; our results show, in some cases, a larger value, which is a numerical error caused by the discrete form of the scalar order parameter described in previous section.
For the LC droplet with half homeotropic and half planar degenerate anchoring, the DPD simulations yield SU ∼ 0.31 ± 0.02 and SR ∼ 0.37 ± 0.01. Visualisation of the DPD results in Fig. 2 reveals that each of the two halves of the droplet possesses an ordered structure of its own, dictated by the surface conditions. The SR map reveals that, for the conditions of strong anchoring considered in our calculations, the defects accumulate at the interface between the two halves, and that in the middle-bottom region of the droplet a possible boojum appears. The continuum method again reveals a well-defined structure of these defects, which appear in the form of a + ½ ring defect at the interface between the two droplet halves, and a + 1 splay-type boojum within the half of the droplet characterised by planar degenerate anchoring, the latter being consistent with a bipolar director configuration within the droplet.42
The analysis of the results shown in Fig. 2 demonstrates that DPD simulations yield an accurate prediction of the alignment of coarse-grained LC molecules, with the possibility of identifying possible defect regions within the LC droplet. However, the details concerning the defect are not as easily extracted from DPD results as in the continuum model. Mapping the DPD simulation results, obtained for droplets of 30 nm diameters, on Q-tensor calculations conducted for droplets of 0.1 μm diameters is a significant step forward in modelling LC structures, because droplets in the nm scale are difficult to probe experimentally. Because numerous studies have shown that Q-tensor calculations match experimental results,43–45 the approach described here suggests that the positive relationship between experiments and finite-element calculations can be transferred to molecular-scale simulations. This multi-scale approach will enable the community to reliably sample LC systems, therefore underpinning future technological applications.
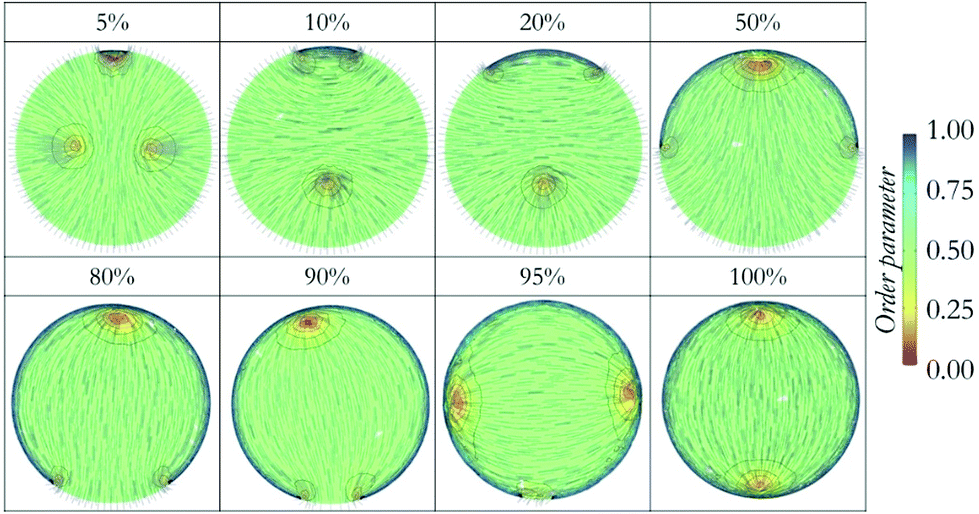
To demonstrate the validity of the proposed approach, we considered six additional systems, in which LC droplets with small local changes in their anchoring were considered systematically. The results are shown in Fig. 3. In our representation, for clarity and consistency, the portion of the droplet surface on which homeotropic anchoring is imposed is placed at the bottom of the schematics. The local changes in surface anchoring are analogous to the response of an external stimulus, for example due to the adsorption of a nano-particle or a protein. They could also be triggered by a futuristic engineered capsule with peculiar features on a certain spot of its internal surface.
 | ||
| Fig. 3 (Top) Six droplet shells with different anchoring surfaces. (Middle) Color-coded LC molecules with respect to SR (up) and SU (down), order parameters are added to the bottom of each image. (Bottom) Snapshots of simulations by finite-element method with emphasis on defect structures, the images show surfaces of constant order for a low value of S. The colour code is the same as in Fig. 2. For clarity, director maps are not included here, but they can be found in Fig. 4. | ||
For the droplets in the first three columns in Fig. 3, planar degenerate anchoring was imposed within a local surface region representing 5%, 10% and 20% of the droplet surface area. Both DPD and continuum calculations show that radial order is maintained within most of the droplet, with a defect in the form of a ring occurring near the droplet centre (consistent with results in Fig. 2, column 1). In addition, a + ½ ring defect emerges at the interface where the surface anchoring is modified.46 Several test calculations revealed that the defects at the core and on the surface interact. Specifically, while the droplet with 5% planar anchoring surface maintains the ring defect in the middle, those with 10% and 20% planar anchoring surfaces merge the two defects with each other, yielding one +½ ring and another +½ ring attached to it. For the droplets in the last three columns in Fig. 3, with 80%, 90% and 95% of the surface exposed to planar degenerate anchoring, analysis of the local structure reveals that changes in LC anchoring trigger two local defects in regions near the droplet surface. As surface defect increases in size, point defects emerge within the droplets, in some cases disappearing due to the coalescence of two defects.
Unlike experimental studies, we did not impose a director field in any of our simulations. Instead, the director fields emerge as result of the imposed surface anchoring conditions. In DPD simulations, connected beads yield ordered structures in response to intermolecular interactions throughout the droplet. In Q-tensor calculations, the final structure is obtained as several iterations minimize the total free energy, starting from an initial state. In some cases, (e.g. 95%) the final expected symmetric result is not reached. Sometimes the surface perturbations (on anchoring) are small and their effect in the final equilibrium distribution is slow to be observed. That could explain the lack of symmetry in some of the results – the changes in system energy during consecutive iterations may fall within the tolerance imposed on the calculations. However, because of the correspondence between the different approaches implemented, we conclude that the results presented here are representative of the equilibrated structure. To illustrate the features of the LC droplets, director plots as obtained from the Q-tensor calculations are provided in Fig. 4.
 | ||
| Fig. 4 Defect structures observed in the simulated liquid crystal droplets with different shell properties in Q-tensor calculations. The background of each droplet is color-coded with respect to order parameters. | ||
We further investigated the defects within the droplets in detail. The first droplet we considered had fully homeotropic anchoring at the surface, where +½ ring defect occurred in the centre of the droplet. In Fig. 4, we plot all other defects observed in the simulated droplets. Shells that promoted homeotropic anchoring with 5, 10, and 20% planar degenerate anchoring region preserved the ring defect in the core, although this defect is affected by the surface defect formed at the intersection of two different surfaces. Surface defects are +½ type ring defects, whereas +½ ring in the middle coalesce with these. In the droplet with half-planar degenerate and half-homeotropic anchoring, (50%), the ring disappears and we observe a + 1 point defect on the planar side, whereas the intersection of two surfaces preserve the +½ ring defect without any physical connection with point defect. It should be emphasized that these defect formations are consistent with the results from the DPD simulations, which highlights the agreement among the two computing techniques employed here. Because this good agreement was obtained for systems that are rather complex (confined LC droplets), it is likely that similarly good aggreement would also be obtained also for other LC structures.
In our prior simulations, we proved that the positional preference of defects created by particles attached on LC droplets can be due to particle size, shape and chemical functionality.47 Note however that, because of the symmetry of the systems investigated, such ‘positional preference’ will be affected by degeneracy. The results presented here show that the defects within a LC droplet interact with each other, in particular determining each other's position within the droplet. Droplets promptly react to a larger surface alteration yielding a preferential position of the defects, as minimum energy configuration requires less disordered alignment. Although mesogens alignment on the LC droplet surface responds to external stimuli when as little as 5% of the surface is affected, the droplet core starts to react after 10% of the surface is altered. Such details would be very difficult to be identified by experimental approaches alone, demonstrating the importance of accurate modelling.
In Fig. 5, we compare the quantitative results obtained for the 9 LC droplets considered in this study. In Fig. 5(a), we report all the orientational order parameters. As expected, SU increases gradually as the ratio of the LC surface characterised by planar degenerate anchoring increases; correspondingly, SR decreases. While the SR trajectory is monotonic and gradual, the SU one shows fast changes in cumulative order near the two extremes of the curve. This is due to the numerical approach followed to calculate the two parameters, as discussed in the Methods and algorithms.
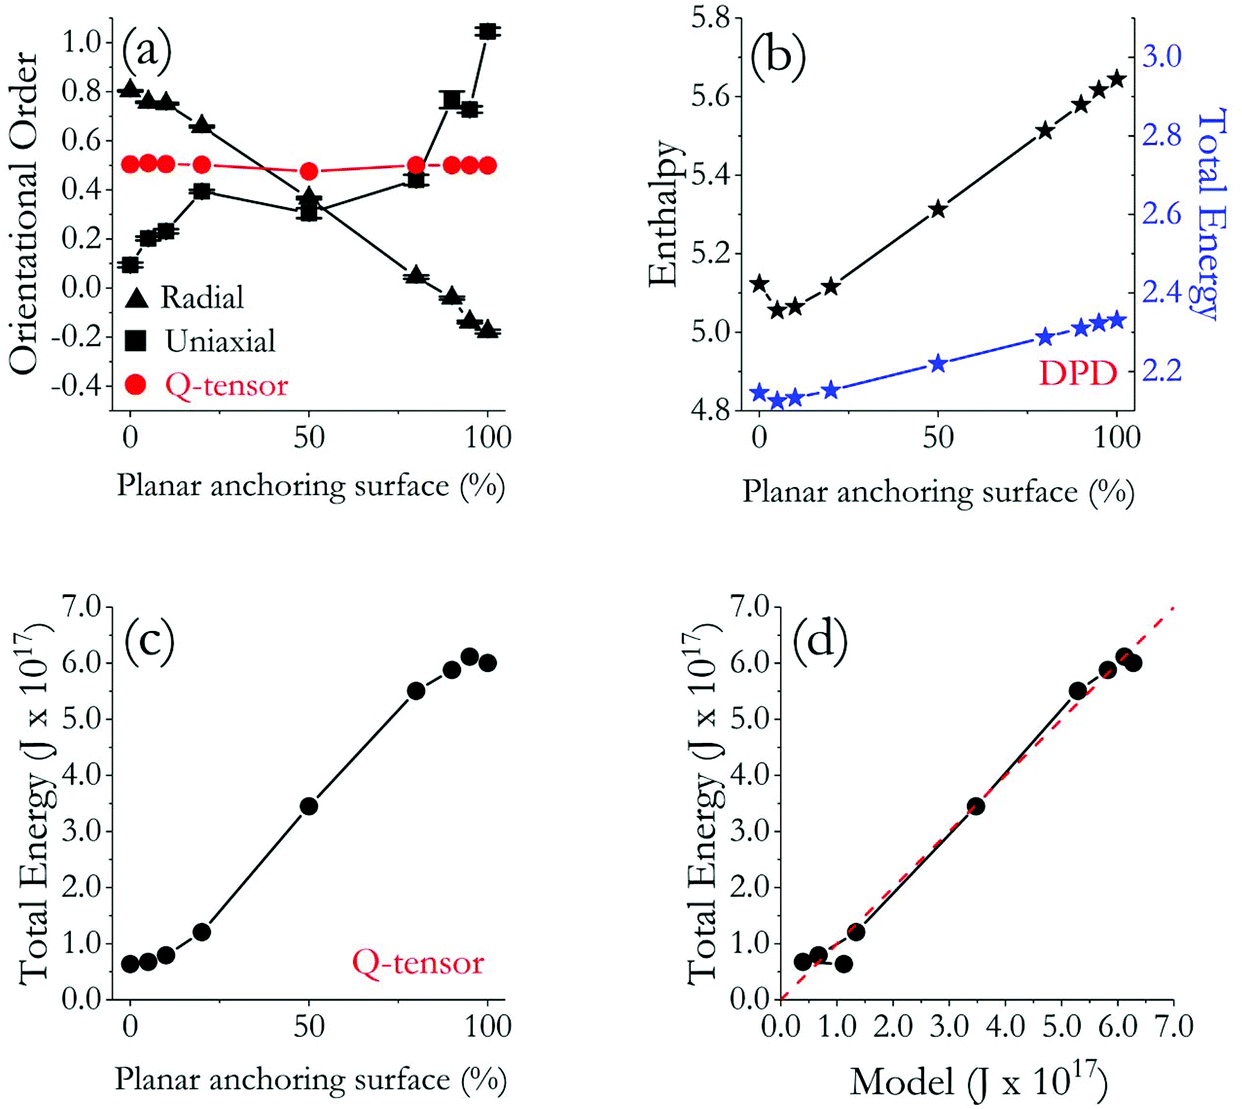 | ||
| Fig. 5 (a) Orientational order parameters (S) for all droplets simulated. (b) A-dimensional enthalpy (black) and energy (blue) of the droplets with respect to their repulsive shell surface area (planar degenerate anchoring ratio, written as planar in short) as obtained from DPD simulations. (c) Energy values of nine droplets with respect to their repulsive shell surface area as obtained from Q-tensor simulations. (d) Relation between the proposed empirical model (eqn (5)) and Q-tensor simulation results. The dashed red line indicates parity. | ||
Extracting the order parameter from Q-tensor calculations showed that all the droplets considered have order parameter of ∼0.50 (see Fig. 5(a)), which is similar to DPD results for SU, but not for SR, as expected due to the implemented algorithms (see Methods and algorithms). It is perhaps interesting to note that, although DPD SU results and Q-tensor order parameters were similar in the interval of 20–80% planar degenerate anchoring, the respective values diverged approaching the two ends of the distribution, particularly when fully homeotropic and fully planar degenerate anchoring are considered. Two reasons are likely responsible for these observations: (i) DPD simulations show defect regions, rather than the defects themselves, which inherently increases the number of molecules misaligned with respect to a directional vector within a droplet of 30 nm diameter. (ii) The mesh adaptation in Q-tensor calculations causes the volumetric ratio of defects to be insignificant with respect to the whole droplet, in part because the droplets simulated with the Q-tensor approach are nine times larger in volume than those modelled with the DPD formalism. As a result, orientational order parameter derived from Q-tensor calculations do not deviate much from the nematic range for the systems considered in this work. This comparison highlights the meso-scale complementarity between DPD and Q-tensor investigations.
To complement the structural analysis, we investigated the energy profile for both molecular simulations and Q-tensor theory calculations. The results from DPD, in normalized DPD units, are shown in Fig. 5(b), where we show that both enthalpy and total energy increase as the fraction of the surface characterised by planar degenerate anchoring increases. This is a consequence of the fact that planar degenerate anchoring is maintained via repulsive interactions between LC molecules and the surrounding shell – more repulsions lead to higher energy. Since the enthalpy trajectory has a greater slope than that of the total energy, we conclude that the system pressure also increases as the percent of the surface that is repulsive increases. Because the DPD simulations were conducted in the microcanonical ensemble (NVE), any change in molecular interactions reflects on the pressure as the DPD thermostat balances Brownian motion.27
In Fig. 5(c), we provide the total energy of the systems as obtained from the Q-tensor calculations. We considered elastic (splay, twist, bend) and thermotropic energy (dielectric constant is zero). For droplets of diameter 0.1 μm, the total energy lays between 0.5–7 × 10⁻¹⁷ J and it increases as the anchoring strength increases. In other words, the system energy increases when the droplets yield planar degenerate anchoring, which is consistent with the DPD simulations results. It is encouraging that the energy trends obtained from continuum calculations are consistent with those obtained from DPD simulations, which further reinforces the semi-quantitative agreement between the two approaches, already suggested by the agreement in structural observations. To fully appreciate the results in Fig. 5, one should recall that because DPD simulations are conducted at reduced units,48 mapping DPD results onto Q-tensor energy would be misleading, although Fig. 5(b and c) shows a quantitative relation between the units of Q-tensor simulations and the dimensionless values of DPD simulations. Instead of directly comparing the energy data, an empirical equation could be derived using the data from the nine droplets considered here, which will allow energy predictions at different length scales by using results from only one type of approach in future calculations. Although more data will be needed to obtain a perfect fit, a tentative relation can be expressed as:
| y = −3.527 × 10⁻¹⁶ (x2) + 1.857 × 10⁻¹⁵ (x) − 2.350 × 10⁻¹⁵ | (5) |
The quantitative correspondence between coarse-grained simulations and continuum calculations presented here could open up several opportunities for future research, with the potential development of advanced technologies. For example, DPD results could directly be linked to experimental data, with proper scaling achieved without requiring any further computationally expensive approach. While spherical droplets are considered here, the approach could be extended to address, for example, the morphology of the encapsulation, the anchoring strength, and possibly systems of concatenated LC droplets. Moreover, the approach could be extended to investigate twisted structures within LC droplets, in the presence of either chiral and achiral molecules, which is an area of intense interest.49,50 While additional calculations will provide more robust relationships than that shown in eqn (5), having established a quantitative meso-scale correspondence across scales and models will hopefully lead to improved understanding of the behaviour of LC assemblies, which is needed to further advanced applications.
The conditions chosen for this study represent high degrees of confinement under strong anchoring conditions. Because realistic scenarios will likely yield conditions of weak anchoring, quantifying how anchoring conditions perturb the LC structure within the nanodroplets is both interesting and useful. It is expected that the results presented here illustrate the limiting cases, as our preliminary Q-tensor calculations have shown that even in less confined geometries, allowing for ‘imperfect’ anchoring can strongly affect the manifestation of defects. Because nano-droplets represent high levels of confinement, relaxing the anchoring conditions could lead to strong variations in the ordered structure observed. Coarse-grained simulations should permit the exploration of these scenarios via changing the appropriate interaction parameters out of those in Fig. 1. This shall be the topic of future studies.
4. Conclusions
In this paper, we modelled 5CB liquid crystal droplets by coarse-grained DPD simulations and continuum approach via Landau-de Gennes theory. Both quantitative and qualitative agreement were observed. DPD simulations provided a map for defect locations, whereas continuum approach gave a clear structure of those defects. For the nine different conditions of surface anchoring in this study, it is observed that as the strong planar degenerate anchoring surface area increased, enthalpy increased. The total energy of the droplets in both approaches are correlated with each other, suggesting that LC droplets of size within the range of several nanometres to hundred micrometres could be investigated with one methodology. If the number of calculations for such correlations were increased, ultimately an empirical equation could be derived that is computationally less demanding. Here, we investigated the conditions of both strong planar degenerate and strong homeotropic surface anchoring for a small group of droplets. We believe this paper proposes a way forward to connect two different scales, to answer to many questions coming from both computational and experimental studies and to underpin the development of future applications.Conflicts of interest
The authors declare no competing financial interest.Acknowledgements
Funding for this research was provided, in part, by the Department of Chemical Engineering at UCL. The DPD simulations presented were conducted at the University College London Research Computing Platforms Support (Grace, Myriad). A. S. wishes to thank the EPSRC, which is supporting part of his research, via grant number EP/T004282/1. Z. S. thanks Dezhi Shen and Dian Fan for fruitful discussions.References
- R. J. Carlton, J. T. Hunter, D. S. Miller, R. Abbasi, P. C. Mushenheim, L. N. Tan and N. Abbott, Liq. Cryst. Rev., 2013, 1, 29–51 CrossRef CAS.
- D.-K. Yang and S.-T. Wu, Fundamentals of liquid crystal devices, John Wiley & Sons, 2014 Search PubMed.
- G. Crawford and S. Zumer, in Liquid Crystals in Complex Geometries, Taylor & Francis, 1996, pp. 1–19 Search PubMed.
- M. Urbanski, C. G. Reyes, J. Noh, A. Sharma, Y. Geng, V. S. R. Jampani and J. P. Lagerwall, J. Phys.: Condens. Matter, 2017, 29, 133003 CrossRef.
- O. D. Lavrentovich, P. Pasini, C. Zannoni and S. Zumer, Defects in liquid crystals: Computer simulations, theory and experiments, Springer Science & Business Media, 2012 Search PubMed.
- J. K. Gupta, S. Sivakumar, F. Caruso and N. L. Abbott, Angew. Chem., Int. Ed., 2009, 48, 1652–1655 CrossRef CAS.
- J. K. Gupta, J. S. Zimmerman, J. J. de Pablo, F. Caruso and N. L. Abbott, Langmuir, 2009, 25, 9016–9024 CrossRef CAS.
- C. P. Chen, D. S. Kim and C. G. Jhun, Crystals, 2019, 9, 364 CrossRef CAS.
- E. Kemiklioglu and L.-C. Chien, Liq. Cryst., 2017, 44, 722–728 CrossRef CAS.
- C. G. Reyes and J. P. Lagerwall, Int. Soc. Opt. Photonics, 2018, 105550O Search PubMed.
- P.-G. De Gennes and J. Prost, The physics of liquid crystals, Oxford university press, 1993 Search PubMed.
- E. G. Virga, Variational theories for liquid crystals, CRC Press, 1995 Search PubMed.
- U. Mur, S. Čopar, M. Ravnik, M. Čančula and S. Žumer, Int. Soc. Opt. Photonics, 2016, 99400V Search PubMed.
- A. D. Rey, Soft Matter, 2010, 6, 3402–3429 RSC.
- D. K. Sahu, T. G. Anjali, M. G. Basavaraj, J. Aplinc, S. Čopar and S. Dhara, Sci. Rep., 2019, 9, 1–10 CrossRef.
- J. Moreno-Razo, E. Sambriski, N. Abbott, J. Hernández-Ortiz and J. De Pablo, Nature, 2012, 485, 86–89 CrossRef CAS.
- O. Guzmán, E. Kim, S. Grollau, N. Abbott and J. de Pablo, Phys. Rev. Lett., 2003, 91, 235507 CrossRef.
- A. AlSunaidi, W. K. den Otter and J. Clarke, Philos. Trans. R. Soc., A, 2004, 362, 1773–1781 CrossRef CAS.
- Y. K. Levine, A. E. Gomes, A. F. Martins and A. Polimeno, J. Chem. Phys., 2005, 122, 144902 CrossRef.
- A. AlSunaidi, W. K. den Otter and J. Clarke, J. Chem. Phys., 2009, 130, 124910 CrossRef CAS.
- T. Inokuchi and N. Arai, Mol. Simul., 2017, 43, 1218–1226 CrossRef CAS.
- S. Hernández, J. Moreno-Razo, A. Ramírez-Hernández, E. Díaz-Herrera, J. Hernández-Ortiz and J. J. de Pablo, Soft Matter, 2012, 8, 1443–1450 RSC.
- Z. Sumer and A. Striolo, Soft Matter, 2019, 15, 3914–3922 RSC.
- Z. Sumer and A. Striolo, Phys. Chem. Chem. Phys., 2018, 20, 30514–30524 RSC.
- R. D. Groot and P. B. Warren, J. Chem. Phys., 1997, 107, 4423–4435 CrossRef CAS.
- S. Plimpton, J. Comput. Phys., 1995, 117, 1–19 CrossRef CAS.
- P. Espanol and P. B. Warren, J. Chem. Phys., 2017, 146, 150901 CrossRef.
- R. D. Groot and K. Rabone, Biophys. J., 2001, 81, 725–736 CrossRef CAS.
- H. Fan and A. Striolo, Phys. Rev. E: Stat., Nonlinear, Soft Matter Phys., 2012, 86, 051610 CrossRef.
- R. James, E. Willman, F. Fernandez and S. E. Day, IEEE Trans. Electron Devices, 2006, 53, 1575–1582 CAS.
- E. Willman, F. A. Fernández, R. James and S. E. Day, IEEE Trans. Electron Devices, 2007, 54, 2630–2637 Search PubMed.
- E. J. Willman, Three Dimensional Finite Element Modelling of Liquid Crystal Electro-Hydrodynamics, PhD Thesis, University CollegeLondon, 2009 Search PubMed.
- E. Willman, L. Seddon, M. Osman, A. Bulak, R. James, S. Day and F. Fernandez, Phys. Rev. E: Stat., Nonlinear, Soft Matter Phys., 2014, 89, 052501 CrossRef CAS.
- P. Toledano and J.-C. Toledano, Landau Theory Of Phase Transitions, The: Application To Structural, Incommensurate, Magnetic And Liquid Crystal Systems, World Scientific Publishing Company, 1987 Search PubMed.
- P. G. de Gennes, Solid State Commun., 1972, 10, 753–756 CrossRef.
- P. Rofouie, D. Pasini and A. D. Rey, Soft Matter, 2017, 13, 5366–5380 RSC.
- D. Wang, S.-Y. Park and I.-K. Kang, J. Mater. Chem. C, 2015, 3, 9038–9047 RSC.
- M. Rahimi, T. F. Roberts, J. C. Armas-Pérez, X. Wang, E. Bukusoglu, N. L. Abbott and J. J. de Pablo, Proc. Natl. Acad. Sci. U. S. A., 2015, 112, 5297–5302 CrossRef CAS.
- G. Volovik and O. Lavrentovich, Zh. Eksp. Teor. Fiz., 1983, 85, 1997–2010 CAS.
- N. Schopohl and T. Sluckin, J. Phys., 1988, 49, 1097–1101 CrossRef.
- E. Gartland Jr. and S. Mkaddem, Phys. Rev. E: Stat. Phys., Plasmas, Fluids, Relat. Interdiscip. Top., 1999, 59, 563 CrossRef.
- T. Lopez-Leon and A. Fernandez-Nieves, Colloid Polym. Sci., 2011, 289, 345–359 CrossRef CAS.
- O. Guzman, N. L. Abbott and J. J. de Pablo, J. Chem. Phys., 2005, 122, 184711 CrossRef CAS.
- G.-D. Lee, P. J. Bos, S. H. Ahn and K. H. Kim, Phys. Rev. E: Stat., Nonlinear, Soft Matter Phys., 2003, 67, 041715 CrossRef.
- B. M. Wincure and A. D. Rey, Nano Lett., 2007, 7, 1474–1479 CrossRef CAS.
- M. Kléman, Rep. Prog. Phys., 1989, 52, 555 CrossRef.
- Z. Sumer and A. Striolo, Molecular Systems Design & Engineering, 2020 Search PubMed.
- T. Taddese, R. L. Anderson, D. J. Bray and P. B. Warren, Current Opinion in Colloid Interface Science, 2020 Search PubMed.
- J.-S. B. Tai and I. Smalyukh, Phys. Rev. E, 2020, 101, 042702 CrossRef CAS.
- O. Lavrentovich and V. Sergan, Il Nuovo Cimento D, 1990, 12, 1219–1222 CrossRef.
Footnote |
| † Electronic supplementary information (ESI) available. See DOI: 10.1039/d0nr04989a |
| This journal is © The Royal Society of Chemistry 2020 |