
 Open Access Article
 This Open Access Article is licensed under a
 Creative Commons Attribution 3.0 Unported Licence
Electronic conductance and thermopower of single-molecule junctions of oligo(phenyleneethynylene) derivatives†
Hervé
Dekkiche
a,
Andrea
Gemma
b,
Fatemeh
Tabatabaei
c,
Andrei S.
Batsanov
 a,
Thomas
Niehaus
*c,
Bernd
Gotsmann
*b and
Martin R.
Bryce
*a
a,
Thomas
Niehaus
*c,
Bernd
Gotsmann
*b and
Martin R.
Bryce
*a
aDepartment of Chemistry, Durham University, Durham, DH1 3LE, UK. E-mail: m.r.bryce@durham.ac.uk
bIBM Research−Zurich, Rueschlikon 8803, Switzerland. E-mail: bgo@zurich.ibm.com
cUniversité Claude Bernard Lyon 1, CNRS, Institut Lumière Matière, F-69622, Villeurbanne, France. E-mail: thomas.niehaus@univ-lyon1.fr
First published on 9th September 2020
Abstract
We report the synthesis and the single-molecule transport properties of three new oligo(phenyleneethynylene) (OPE3) derivatives possessing terminal dihydrobenzo[b]thiophene (DHBT) anchoring groups and various core substituents (phenylene, 2,5-dimethoxyphenylene and 9,10-anthracenyl). Their electronic conductance and their Seebeck coefficient have been determined using scanning tunneling microscopy-based break junction (STM-BJ) experiments between gold electrodes. The transport properties of the molecular junctions have been modelled using DFT-based computational methods which reveal a specific binding of the sulfur atom of the DHBT anchor to the electrodes. The experimentally determined Seebeck coefficient varies between −7.9 and −11.4 μV K−1 in the series and the negative sign is consistent with charge transport through the LUMO levels of the molecules.
Introduction
Over the last decade molecular-scale electronics has progressed rapidly with increased understanding of the structure–function relationships of devices that comprise a single molecule or assemblies of molecules bridging two metallic electrodes.1–3 The interplay of electrical, thermal and thermo-electric transport in molecular junctions is a key aspect in the design and operation of energy conversion devices in the quest for new energy-saving technologies.4–7 The continuous downsizing of the components used in everyday electronic devices such as computers, smartphones and other screen-based apparatus, is accompanied by an increase of the heating/power ratio. Being able to manage that extra heat would then enable reduced electricity consumption and increased efficiency of the whole system. Therefore, there is keen interest in the thermoelectric properties of conductive materials.8 However, the thermal characterisation of molecular junctions is a challenging topic.9,10The energy conversion efficiency of a specific thermoelectric material is determined by the figure of merit ZT given by the ratio S2σelectric/σthermal, where S is the Seebeck coefficient (or thermopower), σelelectric is the electrical conductance, and σthermal is the thermal conductance. For energy harvesting, a value of ZT ≥ 1 is required to be technologically interesting. For cooling applications, a large power factor, S2σelectric, is needed. To date the best intrinsic efficiency has been obtained for bulk materials, typically metallic (nano)composites.11,12 However the drawback of these materials is that they are usually quite expensive and/or necessitate complicated manufacturing processes and therefore cannot easily be employed in small-scale junctions. Recently, the idea of using single molecules in thermoelectric junctions, and more specifically organic molecular wires, has emerged.13 These molecules possess an appropriately conductive delocalised π-electronic system, they can be produced on a large scale and their properties and dimensions can be finely tuned by chemical synthesis. Importantly, high Seebeck coefficient values have been predicted for some of them, such as −56 μV K−1 for a fullerene pair14 or the impressive range of −280 μV K−1 to 230 μV K−1 for selected metalloporphyrins.15 Therefore, organic molecules are perfect candidates for applications in thermoelectric devices.16
The electrical conductance of single molecules is now well understood and can be measured by using various techniques such as Scanning Tunneling Microscopy (STM) based or mechanically controlled (MC) break-junction (BJ) experiments.17 On the other hand, the experimental18 and theoretical characterisation19 of thermal conductivity in those systems is still in its infancy and only recently thermal conductance of single molecules has been measured experimentally.6,7 The measurement of the Seebeck coefficient involves performing BJ experiments at variable temperature bias between the two metal electrodes.4,18
The main issue of thermoelectric materials for the use in thermoelectric converters is the low energy conversion efficiency. The requirements for high efficiency, i.e. a high value of ZT, need careful tuning of the material to optimize the mutually related properties: electrical, S and thermal. In addition, there is a need for stable molecular films with high integrity. A prerequisite is the availability of a stable and versatile molecular platform. Such a platform would have favourable anchor groups and the ability to host side-groups. Ideally, these groups would not interfere with the electrical transport and therefore allow reduction of phonon transport.20 As a first step in this direction, there is need to demonstrate that thermoelectric transport through a promising molecular backbone can be maintained despite chemical modification through anchor points for side-group chemistry.
The present work explores the single-molecule conductance and thermoelectric properties of new oligo(phenyleneethynylene) (OPE3) derivatives (3 denotes the number of phenylene rings in the backbone) using STM-BJ experiments. Extensive computational calculations using DFT and DFTB were then performed to support the results obtained. OPE3 derivatives were chosen as they are synthetically-versatile, highly-conjugated, robust molecules and they have been widely studied in molecular electronics.21,22 OPE3 systems, in particular, can be conveniently assembled and measured in metal–molecule–metal junctions.23–25 The wide agreement between conductance data obtained for OPE3 junctions in different research groups, makes this an excellent candidate for a systematic study on the influence of side and end-groups. We chose the very stable dihydrobenzo[b]thiophene (DHBT) anchor as this group is known to bind efficiently to metal electrodes, with high junction formation probability,26–28 and without the problems associated with thiol anchors, such as oxidation and formation of metal-thiolate clusters.29 We demonstrate that these molecules possess the highly versatile structural features that are required for thermal conductance studies.
Experimental
Synthesis and characterisation of the molecules
Reagents were purchased commercially and used as received unless otherwise stated. THF was dried using an Innovative Technology solvent purification system and stored in ampoules under argon. Thin-layer chromatography (TLC) analysis was carried out using Merck silica gel 60 F254TLC plates and spots were visualised using a UV lamp emitting at 365 or 254 nm. Column chromatography was performed using silica gel 60A (40–63 μm) purchased from Fluorochem. 1H and 13C NMR spectroscopy was carried out on a Bruker AV400 NMR spectrometer. For 1H NMR spectra, chemical shifts are reported relative to the residual solvent peak (7.26 ppm for CHCl3) and for 13C NMR spectra, chemical shifts are reported relative to the solvent peak (77.16 ppm for CDCl3). All NMR spectra were processed using MestReNova V12. ASAP mass spectrometry was carried out using an LCT Premier XE mass spectrometer (Waters Ltd, UK) using TOF detection. X-ray single crystal data were collected on a Bruker 3-circle D8 Venture diffractometer with a Photon100 CMOS detector, using Mo-Kα radiation (λ = 0.71073 Å) from a I μS-microsource with focusing mirrors. The crystals were cooled with a Cryostream (Oxford Cryosystems) open-flow N2 cryostat. UV-Vis absorption spectra were obtained using a Thermo Scientific Evolution 220 spectrophotometer. 4-Acetynyl-dihydrobenzo[b]thiophene was prepared according to the procedure described previously.26 2,5-dimethoxy-1,4-diiodobenzene and 9,10-diiodoanthracene were obtained starting from p-methoxyanisole and anthracene using known methods.30,31 Detailed experimental procedures for the preparation of the compounds and their characterisation data are provided in the ESI.†STM-BJ experiments
Gold tips were prepared by electrochemical etching of gold wires with a diameter of 0.25 mm with 99.99+% purity (GoodFellow) in CaCl2, using the procedure reported by Boyle et al.32 A typical tip radius obtained with this etching procedure is 50–100 nm. The counter-electrode consists of a 5 × 5 × 1 mm chip of silicon, whose top surface has been fully covered with pure sputtered gold. After fabrication, to eventually remove contaminants and recover a fresh gold surface, prior to use, every chip is cleaned either via flame-annealing or with a combination of Oxygen Plasma+ Ion Milling. After cleaning the gold substrate, it was then immersed in the solution of the target molecules. Three different solutions were prepared with a concentration c = 0.25 mM to 0.3 mM in a mixture of dichloromethane (DCM) and ethanol (EtOH), 1![[thin space (1/6-em)]](https://www.rsc.org/images/entities/char_2009.gif) :1 v/v ratio. Samples were immersed for 5 min and then rinsed for 1 min in a fresh mixture of DCM and ethanol. Immediately after rinsing, samples were carefully dried under N2 flow in a chemical fume hood.
:1 v/v ratio. Samples were immersed for 5 min and then rinsed for 1 min in a fresh mixture of DCM and ethanol. Immediately after rinsing, samples were carefully dried under N2 flow in a chemical fume hood.
To combine electrical and thermoelectrical measurements the tip of the STM was equipped with two platinum resistors, one acting as heating element and the other acting as a thermometer. The temperature of the system was maintained at the desired value using a temperature controller (Meerstetter TEC 10–91) with an accuracy and stability better than 0.01 °C. All the measurements were performed in vacuum (≃10−7 mbar) and at room temperature (22 °C) with a custom-built STM, located in a low-noise laboratory.33
Theoretical calculations
Binding energies of OPE3-Ph on Au(111) were computed using Density Functional Theory (DFT) as implemented in the plane wave code Quantum ESPRESSO.34,35 We used the Perdew–Burke–Ernzerhof (PBE) exchange–correlation functional36 and PAW pseudopotentials from the pslibrary 1.0.0.37 Energy cutoffs of 70 Ry and 280 Ry were used for the plane wave expansion of wave functions and electron density, respectively. A 4-layer slab model of the (5 × 6) surface supercell of Au(111) was relaxed at the Γ point with a convergence criterion of 0.001 a.u. for the forces. The two topmost layers were allowed to move and a vacuum thickness of about 20 Å was applied in the dimension orthogonal to the surface to avoid artificial interactions. The same settings were applied to model the adsorption of OPE3-Ph on the surface. Binding energies Eads were finally computed as Eads = Ecmp − Emol − EAu(111), where Ecmp denotes the total energy of the OPE3-Ph-Au(111) complex, Emol the total energy of OPE3-Ph relaxed in the gas phase (modelled in the same simulation cell as the complex), and EAu(111) the total energy of the relaxed surface.Electronic transport properties of the OPE3 derivatives were computed using Non-Equilibrium Green's Function Theory based on the Density Functional Based Tight-Binding Method (DFTB)38–40 as implemented in DFTB+ version 19.1.41 DFTB is an approximate DFT method with an appealing cost/accuracy ratio and has been successfully used in a variety of applications in the field of molecular electronics.42–44 Here we employed the auorg-0-1 Slater–Koster set45,46 with orbital dependent Hubbard parameters and used a periodic setup, where the device is replicated perpendicular to the transport direction along the surface. This entails a solution of the Poisson equation under periodic boundary conditions to obtain the charge density in the device region. The actual device model was created in several steps. We first optimised the target molecule attached to two Au20 clusters in the gas phase using the atomic orbital NWCHEM code.47 The calculations were performed with the PBE functional and a 6-31G* basis set for C, H, S and a lanl2dz_ecp basis set and corresponding core potentials for Au. The defaults for energy and force convergence were kept. With the help of the simulation environment ASE,48 the Au20–molecule–Au20 complex was then embedded between two identical Au(111) surfaces, each containing three atomic layers with 30 atoms per layer, to form a full device as shown later in the manuscript in the theory section. Note that in this process the Au–S–C binding angles (found in the gas-phase relaxations) were conserved, such that the molecular tilting with respect to the surface was correctly captured. This device was then coupled to gold electrodes, consisting of three additional gold layers that were periodically replicated in the transport direction.
Results and discussion
The new OPE3 molecules bearing the DHBT anchoring group were synthesised by reacting a corresponding diiodo-aryl derivative with a small excess of 4-acetynyl-benzo[b]thiophene in a two-fold Sonogashira cross-coupling reaction conditions (Fig. 1). Starting from 1,4-diiodobenzene, 2,5-dimethoxy-1,4-iodobenzene and 9,10-diiodoanthracene, OPE3-Ph, OPE3-Ph(OMe)2 and OPE3-An were respectively obtained in about 50% yield. After purification by column chromatography, the compounds were fully characterised by 1H and 13C NMR spectroscopy and high-resolution mass spectrometry (HRMS) (as shown in the ESI†). The presence of the DHBT anchoring group in the molecules was notably confirmed by the observation of symmetrical signals in the 7.59–7.18 ppm and 3.44–3.27 ppm windows in the 1H NMR spectra, corresponding to the aromatic and CH2 protons, respectively.26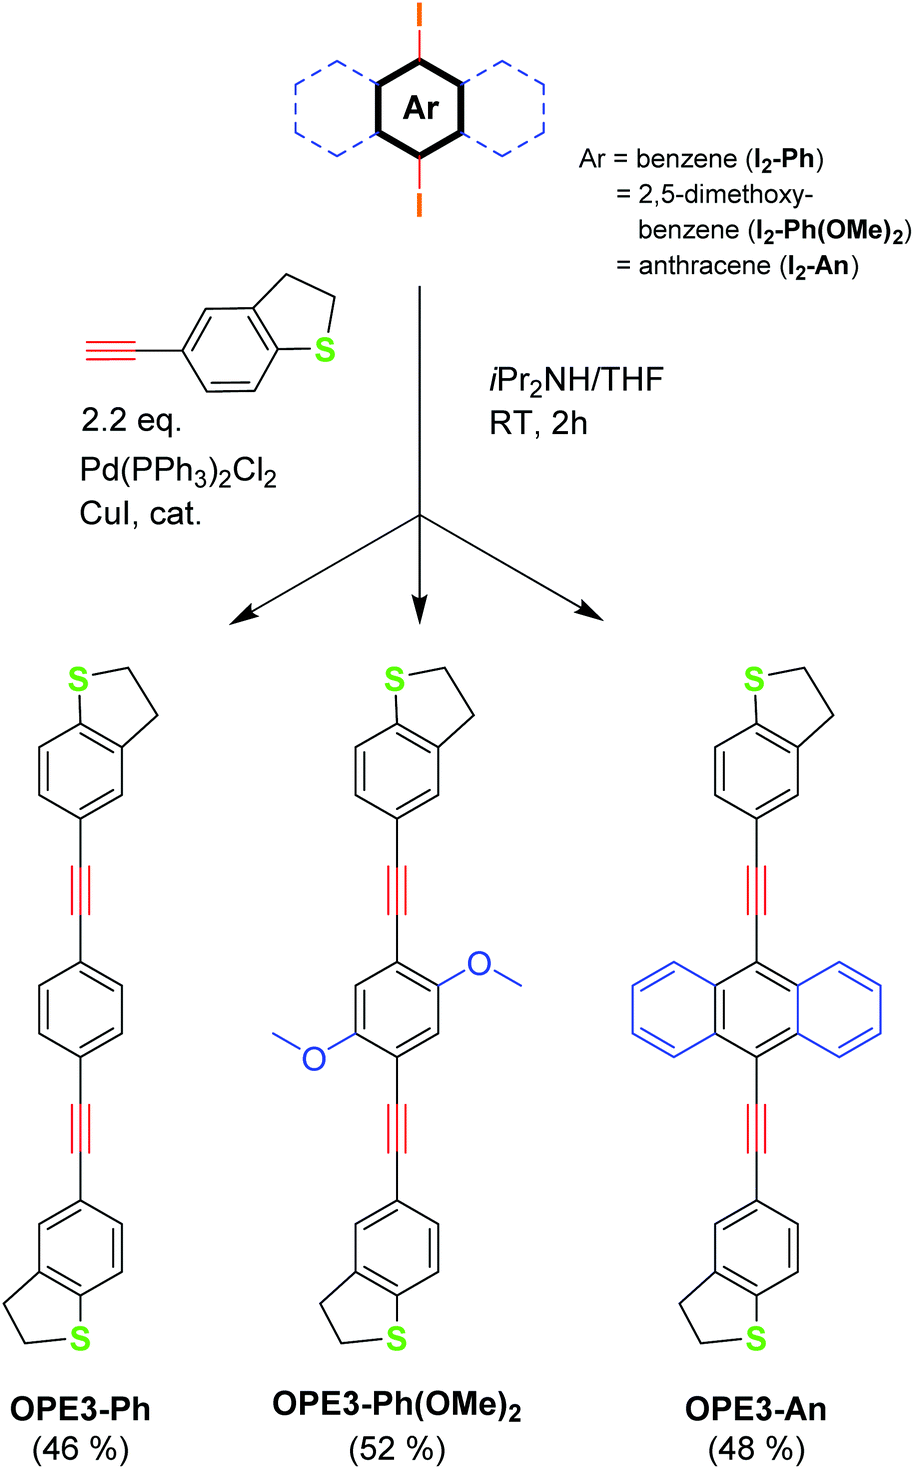 | ||
| Fig. 1 Synthesis of the OPE3 derivatives. | ||
Single crystals suitable for X-ray diffraction analysis were obtained for OPE3-Ph and OPE3-An by slow exchange of methanol and hexane vapours respectively into a CH2Cl2 solution of the compounds. OPE3-Ph lies at a crystallographic inversion centre. Thus, arene ring A and its axis X are parallel to their equivalents (A′ and X′), while inclined to the central ring (Ph) by 18.7° and 10.7° respectively (Fig. 2a). OPE3-An has no crystallographic symmetry. Rings A1 and A2 are inclined to the planar anthracene moiety (An) by 26.9° and 38.4°, respectively, their axes X1 and X2 by 3.3° and 19.5°. The A1/A2 dihedral angle is 21.7°, the X1/X2 angle 22.9° (Fig. 2b). In both molecules, the heterocycles adopt envelope conformations, with the CH2 group adjacent to the S atom, tilting out of this (and the fused arene) ring plane. In OPE3-An, both heterocycles are disordered between two envelope conformations with opposite tilt, in 4:1 and 10:1 ratios. Overall, the OPE3 backbone is essentially planar in each case, suggesting a good π-electron delocalisation in these molecules. Moreover, a highly organised extended network was observed in the case of OPE3-Ph. The molecules stack together and arrange in a 2D fashion, resembling what could be expected for a self-assembled monolayer (SAM) on a surface. In contrast, a dimeric arrangement, rather than continuous stacks, was observed for OPE3-An (see ESI† for figures).
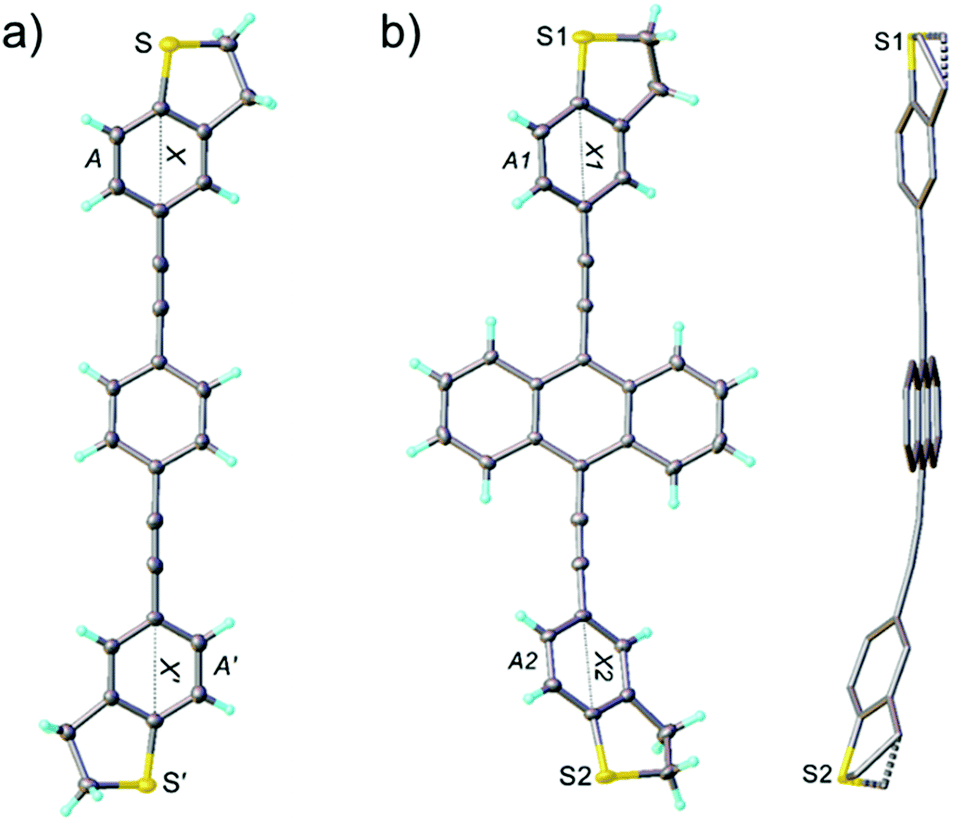 | ||
| Fig. 2 X-ray molecular structures. (a) Projection on the central phenylene plane (Ph) of OPE3-Ph, inversion-related entities are primed, thermal ellipsoids are drawn at 50% probability level and (b) major conformer of OPE3-An, projection on the anthracene (An) plane, and side-view showing the disorder (H atoms omitted). | ||
The electrical conductance and Seebeck coefficient for the three synthesised molecules have been measured via STM Break Junction techniques. The experimental setup is represented schematically in Fig. 3a. The chips were coated with the material following the procedure described in the Experimental section. Applying the two cleaning methods (flame annealing or oxygen plasma + ion milling) resulted in comparable, high-quality histograms without obvious signs of contamination, such as seen sometimes at intermediate conductance.
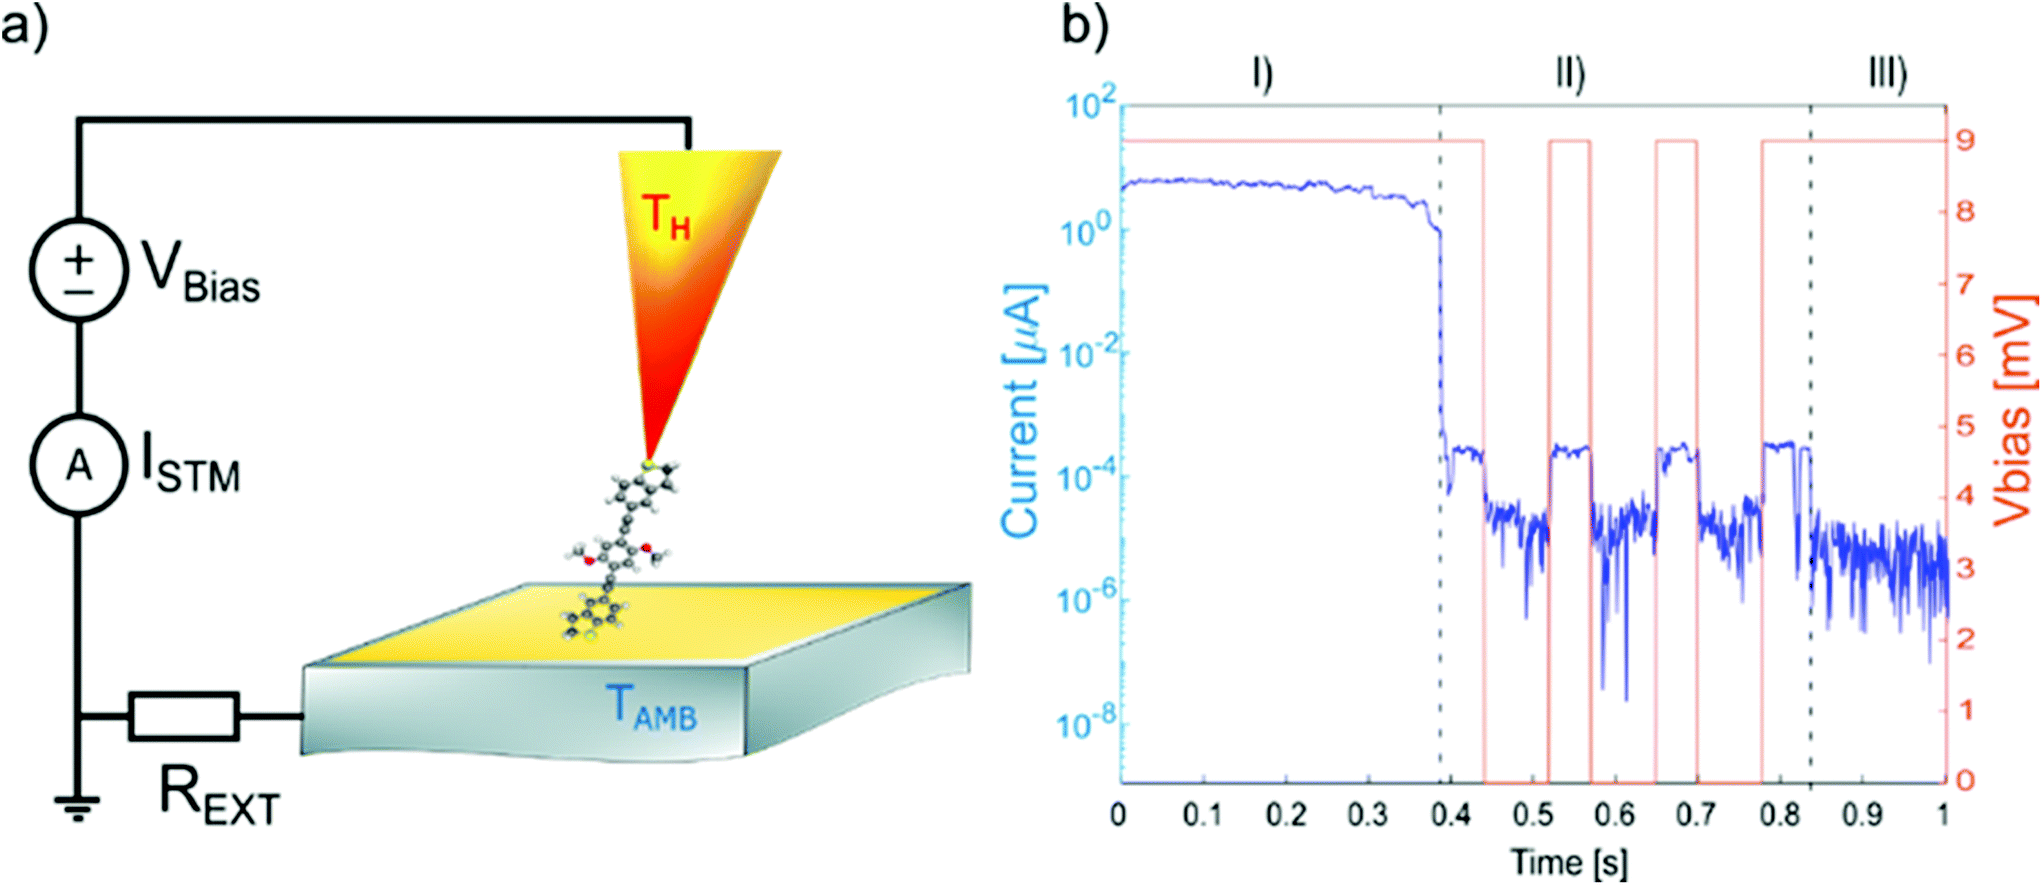 | ||
| Fig. 3 (a) STM break junction setup for the electric and thermoelectric characterization of single molecules; (b) typical example of opening trace: I(t) and Vbias(t) for a single-molecule junction. | ||
The experiment is based on a modified version of the STM – Break Junction technique, where the current between the two electrodes is recorded as a function of the separation distance, at different temperature difference between the electrodes. A typical experiment runs as follows. First, the temperature bias between the two electrodes is set using the resistive elements present in the tip holder. The substrate is maintained at room temperature, while the overall temperature difference, ΔT, ranges from room temperature up to 60 K. The temperatures in the setup are then allowed to settle to a steady state for more than 1 h at each temperature, before starting a new measurement. After the thermal equilibrium has been reached, the tip is moved closer to the gold substrate where molecules have been deposited (closing trace) with a speed of 5 nm s−1. Then, after a good electrical contact has been established (>5 G0, where G0 denotes the electrical conductance quantum), the two electrodes are slowly moved apart (opening trace), at speeds of 3 nm s−1. For the sake of simplicity, we will consider only the closing traces, since statistically they show a larger number of molecules trapped in the junction. During the trace the current is measured at constant bias of ΔV = 9 mV. This is a value over the junction plus a series resistance, that is added in front of the current-to-voltage converter to prevent it from saturation. In fact, the resistance of the junction usually varies from few ohms ∼Ω, when the two electrodes are in contact, to ∼GΩ, when the electrodes are separated by a single molecule.
A typical trace is shown in Fig. 3b. Three different regions can be distinguished: (I) At low resistance (1 to 10 G0), the conductance is dominated through a metal junction between the gold electrodes (Au–Au). During the thinning down of the Au–Au junction (I), the electrical conductance and consequently the current decreases in a step-like fashion, because of the quantized availability of electron channels in 1D systems. In this framework, the last few channels correspond to the last atoms bridging the contact, down to a single atom, immediately before the rupture.49 (II) After breaking the metal junction, some opening traces also show a second regime (II), where the electrical current exhibits a plateau with a constant value of current (and therefore a constant value of conductance), implying the formation of a molecular junction (Au–molecule–Au). Since for the OPE3 derivatives, the molecular plateau has been theoretically predicted to have a conductance around 10−4G0, as confirmed by the conductance histograms, we define a molecular region as the interval of conductance between 10−3G0 and 10−5G0. In this region the speed of the piezo-scanner is lowered to 1 nm s−1. (III) After the molecular junction is broken, a much smaller tunnelling current is measured (Au–tunnelling–Au) and the current signal falls into the noise level of the setup.
To measure the Seebeck coefficient, we proceeded as follows. When a molecular plateau is found within the molecular region, the following steps were performed while continuing to retract the tip.
(i) The conductance Gbefore of the first 50 points of the plateau is analysed. If the conductance value stays between set thresholds (10−3G0–10−5G0), then it is assumed a molecular junction is still present;
(ii) Then, the bias is turned off for a window of 80 datapoints, and the thermoelectrical current ISeeb is measured;
(iii) Subsequently, the bias is restored and the conductance Gafter of the following 50 datapoints is compared to the value before the switching. If both values of conductance, before and after the bias switching, are found to be within the bounds of the molecular region and Gafter = Gbefore ± 20%, the switching is repeated until the conditions of Gbefore, Gafter are not fulfilled anymore.
This technique enables the determination of the electrical conductance and thermoelectric current within one single measurement, and therefore for the simultaneous determination of Gel and S for each molecule.
Fig. 4 shows the results for the series of three OPE3 derivatives. The first column shows the 2-dimensional histograms for the electrical conductance at room temperature for the different molecules. The colour bar gives the number of counts in a logarithmic scale. The second column compares the 1-dimensional conductance histograms, obtained during the Seebeck measurements, for four different temperature gradients applied to the junction. Here the maximum of each distribution represents the most probable value of the electrical conductance, during the bias switching, at each given ΔT. In the third column the Seebeck voltage is plotted for different value of ΔT. The thermovoltage is calculated from the measured thermocurrent using the following equation:
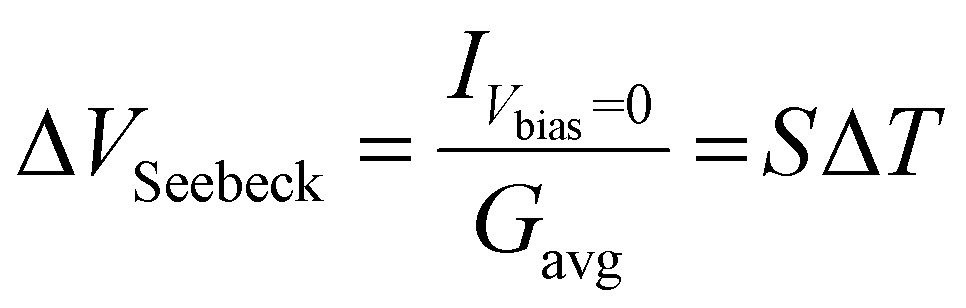 | (1) |
 | ||
| Fig. 4 Break-junction conductance histograms (a, d, and g) with a logarithmic color bar (log(counts)), 1D single-molecule conductance traces obtained as a function of the temperature (b, e and h) and Seebeck voltage vs. dT graphs (c, f and i) respectively, obtained for OPE3-Ph, OPE3-Ph(OMe)2 and OPE3-An. | ||
All the molecules show a negative Seebeck coefficient, indicating LUMO-dominated conductance. Also, the introduction of the side-groups in OPE3-Ph(OMe)2 and OPE3-An slightly decreased the absolute value of the Seebeck coefficient compared to OPE3-Ph, while the overall electrical properties were not greatly affected. As a side-remark, for OPE3-An a higher thermal stability is observed, that allowed a doubling of the temperature difference range compared to the other molecules (Fig. 4h and i). The mechanical arrangement of a molecular junction can be thermally unstable, which is visible at higher temperatures through a reduced yield of measuring a molecular plateau in individual opening traces. Such thermal instability of the junction will leave the molecule intact and is different from thermal decomposition of the molecules, which is found to be higher than 250 °C in measurements of the molecular crystals.
To support the experimental results, first principles calculations were performed as detailed in the method section. The metal–molecule binding configuration is not directly accessible in the measurements and will also strongly depend on the electrode distance. We therefore investigated the binding of OPE3-Ph to ideal gold surfaces without adatoms and defects. This allows us to get a first impression of the relevant binding motifs that should also be of relevance for the rough surfaces in break junctions. Geometry relaxations have been performed for OPE-Ph attached to the Au(111) surface using periodic plane wave DFT calculations. The sulfur atom of the DHBT anchoring group was positioned at the top, bridge, fcc and hcp positions of the surface. Configurations that differ by rotations of the molecular backbone around the surface normal have not been considered. This task remains for a later and more complete study.
The size of the periodic unit cell was chosen such that the distance between molecular images is around 9 Å, so that a low surface coverage is effectively simulated. As shown in Fig. 5 the most stable binding configuration is the top position with an Au–S bond length of 2.55 Å. The bonding angles indicate a pyramidalisation of sulfur, consistent with a dative bond where one of the S lone pairs interacts with Au d-orbitals. We also found stable conformations in which the OPE3 backbone is oriented perpendicular to the surface (see ESI†). These are 1.1–1.4 eV higher in energy than the tilted conformers and will not be discussed in detail. The adsorption energy of Eads = −0.51 eV for the most stable conformer shows that the DHBT group provides an effective anchor. Moreno-García and co-workers26 investigated the binding energy of several aurophilic functional groups. Specifically, they looked at cyano (CN), amino (NH2), thiol (SH), 4-pyridyl (PY) and the present DHBT and found the energetical ordering NH2 < DHBT ≈ CN ≈ PY < SH, where NH2 denotes the least stable anchor group. Although the OPE3 molecular wire was coupled to an Au pyramid in the Moreno-García study, the reported binding energy of Eads = −0.41 eV is close to our result for the top position. Considering the other configurations in Fig. 5, we find that binding at hollow sites of the Au(111) surface is not likely: the hcp starting structure relaxes into a top configuration (and is therefore not shown), while the fcc structure shows a low adsorption energy of Eads = −0.16 eV and a very long Au–S distance of 3.45 Å. Optimisation of the bridge configuration leads to a structure where the DHBT sulfur is nearly at a top position.
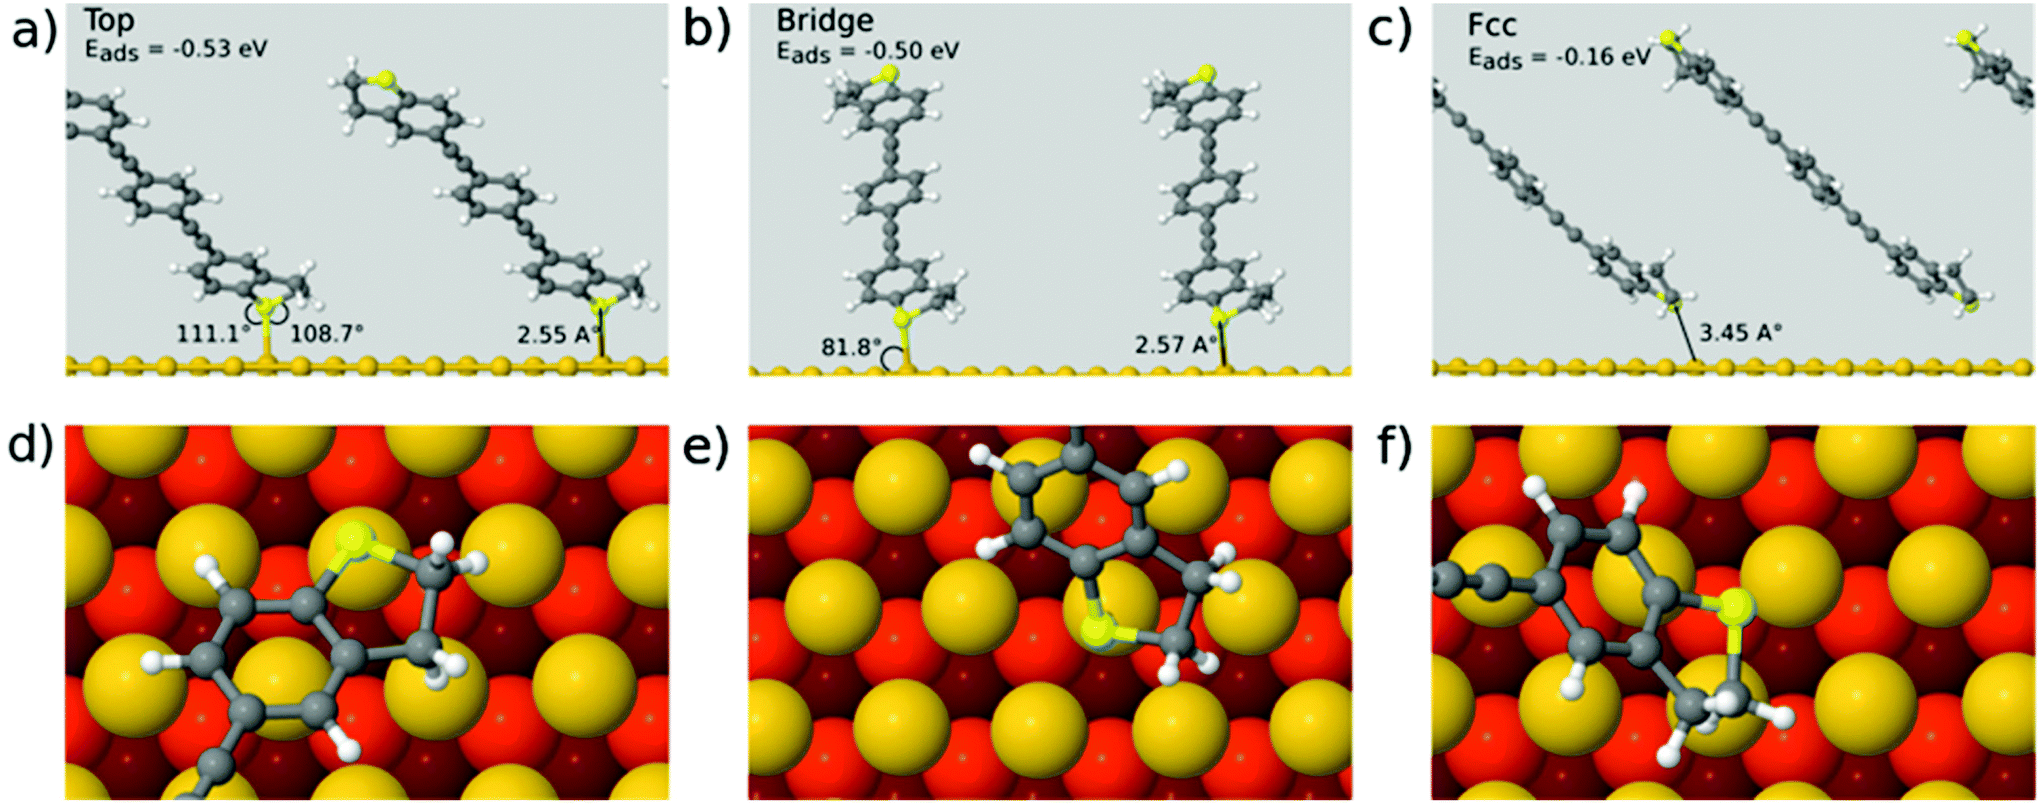 | ||
| Fig. 5 Optimal binding configurations of OPE3-Ph on Au(111) from periodic DFT simulations. (a)–(c) Side views for top, bridge and fcc initial structures, (d)–(f) same structures viewed from the top (darker colour of Au atoms indicates larger distance to the surface). Bond angles are shown for covalently bonded configurations. | ||
In summary, we find very little conformational flexibility. In contrast to the more common thiol anchor groups, DHBT features a sulfur lone pair with fixed orientation with respect to the molecular plane, and this reduces the available conformational space. As also proposed in other studies,3,50 this feature might explain the rather narrow conductance histograms seen above.
Next, we investigated the transport properties of the various OPE3 derivatives by means of Non-Equilibrium Green's Function theory. Molecular Green's function, molecule-surface coupling and surface Green's function are all evaluated at the DFTB level, which is an approximate and numerically efficient DFT method. Similar to previous studies,26 the electrodes are modelled as multiple layers of the Au(111) surface connected to Au20 clusters that are finally attached to the anchor groups (Fig. 6). As detailed in the ESI,† binding to the surface leaves the OPE3 backbone largely unchanged with respect to the experimentally determined X-ray crystal structure. The calculations provide the energy dependent transmission function t(E), which is directly related to the electrical conductance G: G = t(EF) G0, where EF denotes the Fermi energy of the junction and G0 is the quantum of conductance.2 As Fig. 7 shows, the side groups at the central OPE3 ring have an important effect on the HOMO energy. The electron-donating OMe groups in OPE3-Ph(OMe)2 lead to an upward shift of approximately 0.15 eV, while the extension of the π system in OPE3-An has an even stronger effect with a shift of 0.75 eV with respect to OPE3-Ph. The LUMO energies exhibit a much weaker variation. Since conduction at low bias occurs through the tails of the frontier orbital that is situated closer to EF, the small differences in conductance found for both experiment and theory (see Table 1) become understandable. While the LUMO transmission for OPE3-An reaches the maximal value of 1.0 (indicating perfect transmission), both OPE3-Ph(OMe)2 and OPE3-Ph show reduced values below 0.04. This could be related to an asymmetric coupling to the left and right contacts, but since our models are symmetric, we attribute this fact to partial destructive interference of transmission paths through energetically close lying molecular orbitals. Similarly, the dip in transmission just below EF could be of similar nature.
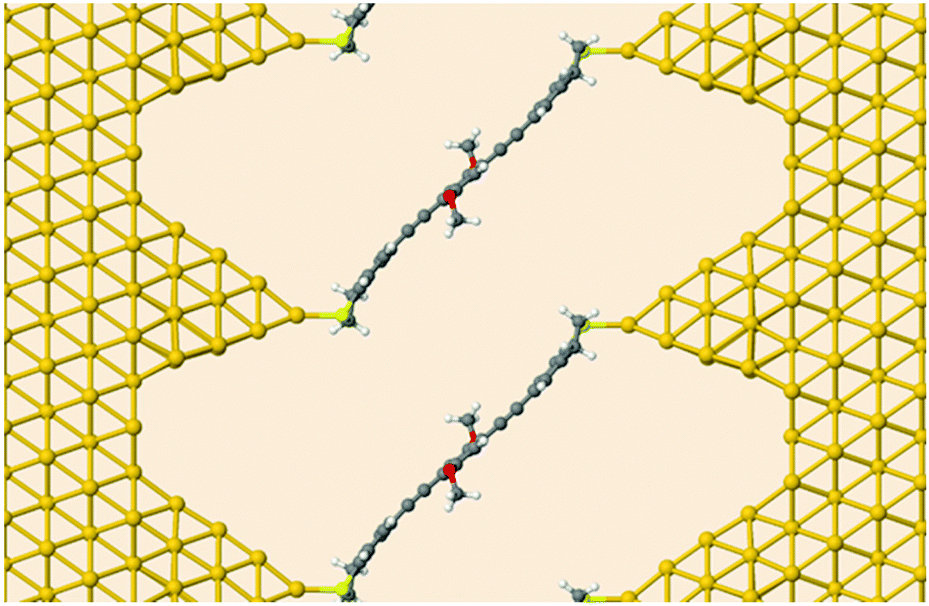 | ||
| Fig. 6 Device geometry for DFTB transport simulations. Shown is OPE3-Ph(OMe)2 connected to semi-infinite gold leads. | ||
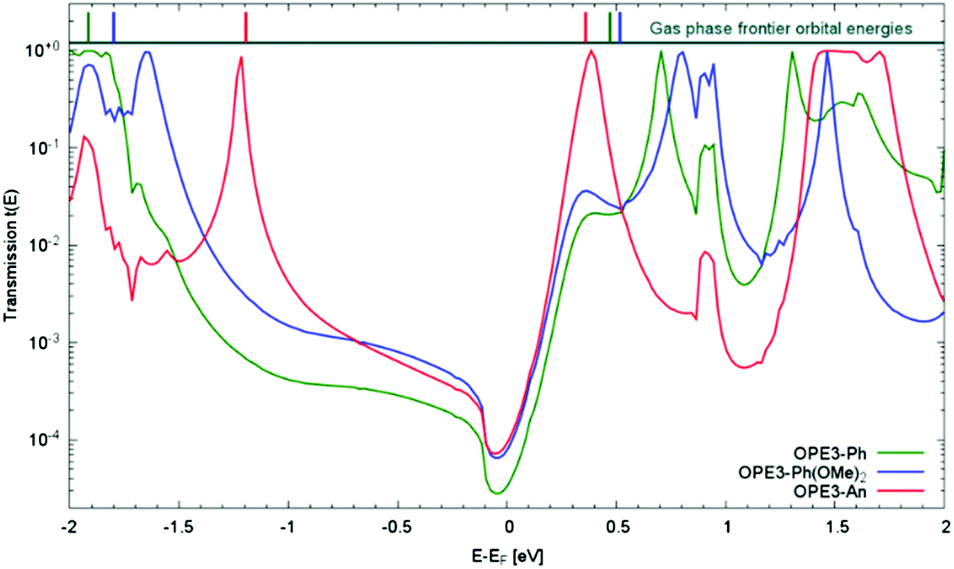 | ||
| Fig. 7 DFTB transmission function t(E) for three OPE3 derivatives. For illustrative purposes the HOMO and LUMO energies of the isolated molecules in the gas phase are given at the top of the figure. To account for the Fermi level alignment upon contact formation, the gas phase energies have been shifted by Δ = Md–Mg, where Md and Mg denote the HOMO/LUMO mid gap energies for the device and gas phase, respectively. We obtain ΔOPE3-Ph = −1.45 eV, ΔOPE3-Ph(OMe)2 = −1.44 eV and ΔOPE3-An = −1.00 eV. The sign of these shifts is consistent with a charge transfer of electrons from the molecule to the electrode through formation of dative bonds. | ||
| G exp [10−4G0] | G theo [10−4G0] | S exp [μV K−1] | S theo [μV K−1] | |
|---|---|---|---|---|
| OPE3-Ph | 0.92 | 0.34 | −11.4 ± 0.5 | −57.4 |
| OPE3-Ph(OMe)2 | 2.03 | 0.93 | −7.9 ± 1.3 | −66.2 |
| OPE3-An | 1.82 | 0.79 | −8.7 ± 1.6 | −61.4 |
The computed transmission can also be used to estimate the temperature dependent Seebeck coefficients S(T) for the OPE3 derivatives,2
 | (2) |
The theoretical values obtained are reported in Table 1 and compared to the measured values. As mentioned above, the experimentally measured negative values for S indicate a LUMO based transport mechanism, which is in agreement with the theoretical findings. Additional exploratory calculations for different plausible metal–molecule binding scenarios indicate that the Fermi level positioning is influenced by sulfur pyramidalisation and the bonding to undercoordinated Au atoms (see ESI†), both factors favouring a negative Seebeck coefficient.
In general, rather small variations for the different OPE3 derivatives are observed. Experimentally, OPE3-Ph has the largest conductance and the largest (in absolute value) Seebeck coefficient. Since the transmission derivative is usually dominating over the transmission in the denominator of eqn (2), this is consistent with a LUMO position of OPE3-Ph that is slightly closer to EF than for OPE3-Ph(OMe)2 or OPE3-An. The theoretical simulations do not reproduce these subtle differences for the investigated junction models and generally overestimate the Seebeck coefficients. To a certain extent this might be related to known difficulties of DFT and DFTB to accurately predict the transport gap and level alignment.51–53 In addition, it would be desirable to sample a larger space of metal–molecule geometries to approach the experimental conditions, but already at this stage, the theoretical simulations confirm the main transport mechanism and small variability in the thermopower. In this context, we mention a recent review that highlights challenges in theory and experiment as well as the currently achievable agreement between the two.54
Conclusion
Understanding and mastering the interplay of charge and heat transport in single-molecule junctions is of crucial importance for the development of modern molecular electronics technologies. From this perspective we have synthesised three new OPE3 derivatives possessing DHBT anchoring groups and different core units, and measured their single-molecule conductance and Seebeck coefficient by STM-BJ experiments using a custom-built temperature sensitive set-up. The lateral substituents on the central ring have a negligible effect on the transport properties. The Seebeck coefficient was found to vary between −7.9 and −11.4 μV K−1 and the negative sign is consistent with charge transport through the LUMO levels of the molecules. Thermoelectric transport through OPE3-backbone can be maintained despite the introduction of anchor points for side-group chemistry, and shows values in good consensus with the ones reported in literature for different anchoring groups.10,55 The results obtained from detailed simulations based on density functional theory were in good agreement with the experimental data. Both experimental and theoretical results suggest that the sulfur atom of the DHBT anchoring group coordinates to the electrode gold atoms in a very particular fashion. We conclude that the sharp break-junction histograms obtained in STM-BJ experiments and the very specific transmission function calculated for these molecules originate from that binding specificity. The molecules presented here are ideal candidates for nanoscale thermal conductivity studies. In the future, new lateral substituents on the OPE3 backbone will be implemented to influence the electrical conductance, the Seebeck coefficient and/or the thermal conductivity, and to enhance the overall thermoelectric efficiency in molecular junctions. On the theoretical side, future improvements are expected by enhanced conformational sampling as well as a more accurate determination of the transport gap at the DFTB level.51,56Conflicts of interest
There are no conflicts to declare.Acknowledgements
We acknowledge funding by the European Commission H2020-FETOPEN projects ‘EFINED’ Grant Agreement no. 766853, and ‘QuIET’, Grant Agreement no. 767187. We would also like to thank EPSRC (U.K.) for funding project ‘QSAMs’ grant number EP/P027520/1; the Laboratoire d'Excellence iMUST for financial support and GENCI for computational resources under project DARI A0050810637 and A0070810637.Notes and references
- D. Xiang, Chem. Rev., 2016, 116, 4318–4440 CrossRef CAS.
- E. Scheer and J. C. Cuevas, Molecular electronics: An Introduction to Theory and Experiment, World Scientific, Singapore, 2nd edn, 2017 Search PubMed.
- T. A. Su, M. Neupane, M. L. Steigerwald, L. Venkataraman and C. Nuckolls, Chem. Mater., 2014, 26, 7229–7235 CrossRef.
- L. Rincón-García, C. Evangeli, G. Rubio-Bollinger and N. Agraït, Chem. Soc. Rev., 2016, 45, 4285–4306 RSC.
- W. B. Chang, C.-K. Mai, M. Kotigua, J. B. Neaton, G. C. Bazan and R. A. Segalman, Chem. Mater., 2014, 26, 7229–7235 CrossRef CAS.
- N. Mosso, H. Sadeghi, A. Gemma, S. Sangtarash, U. Drechsler, C. Lambert and B. Gotsmann, Nano Lett., 2019, 19, 7614–7622 CrossRef CAS.
- L. Cui, W. Jeong, V. Fernandez-Hurtado, J. Feist, F. J. García-Vidal, J. C. Cuevas, E. Meyhofer and P. Reddy, Nat. Commun., 2017, 8, 14479 CrossRef CAS.
- V. Tayari, B. Senkovskiy, D. Rybkovskiy, N. Ehlen, A. Federov, C. Y. Chen, J. Avila, M. Asensio, A. Perucchi and P. di Pietro, Phys. Rev. B, 2018, 97, 045424 CrossRef CAS.
- Y. Dubi and M. Di Ventra, Rev. Mod. Phys., 2011, 83, 131 CrossRef CAS.
- W. Lee, K. Kim, W. Jeong, L. A. Zotti, F. Pauly, J. C. Cuevas and P. Reddy, Nature, 2013, 498, 209 CrossRef CAS.
- M. Zebarjadi, K. Esfarjanii, M. S. Dresselhaus, Z. F. Ren and G. Chen, Energy Environ. Sci., 2012, 5, 5147 RSC.
- W. Liu, X. Yan, G. Chen and Z. Ren, Nano Energy, 2012, 5, 42–56 CrossRef.
- A. Harzheim, Mater. Sci. Technol., 2018, 34, 1275–1286 CrossRef CAS.
- N. Almutaq, Q. Al-Galiby, S. Bailey and C. J. Lambert, Nanoscale, 2016, 8, 13597–13602 RSC.
- Q. H. Al-Galiby, H. Sadeghi, L. A. Algharagholy, I. Grace and C. Lambert, Nanoscale, 2016, 8, 2428–2433 RSC.
- M. Tsutsui, T. Morikawa, Y. H. He, A. Arima and M. Taniguchi, Sci. Rep., 2015, 58, 11519 CrossRef.
- F. Chen, J. Hihath, Z. Huang, X. Li and N. J. Tao, Annu. Rev. Phys. Chem., 2007, 58, 535–564 CrossRef CAS.
- S. Park, H. Kang and H. J. Yoon, J. Mater. Chem. A, 2019, 7, 14419 RSC.
- C. J. Lambert, Chem. Soc. Rev., 2015, 44, 875 RSC.
- M. Famili, I. Grace, H. Sadeghi and C. J. Lambert, ChemPhysChem, 2017, 18, 1234–1241 CrossRef CAS.
- U. H. F. Bunz, Chem. Rev., 2000, 100, 1605–1644 CrossRef CAS.
- N. M. Jenny, M. Mayor and T. R. Eaton, Eur. J. Org. Chem., 2011, 4965–4983 CrossRef CAS.
- J. M. Tour, A. M. Rawlett, M. Kozaki, Y. Yao, R. C. Jagessar, S. M. Dirk, D. W. Price, M. A. Reed, C.-W. Zhou, J. Chen, W. Wang and I. Campbell, Chem. – Eur. J., 2011, 7, 5118–5134 CrossRef.
- R. Huber, M. T. Gonzalez, S. Wu, M. Langer, S. Grunder, V. Horhoiu, M. Mayor, M. R. Bryce, C. S. Wang, R. Jitchati, C. Schonenberger and M. Calame, J. Am. Chem. Soc., 2008, 130, 1080–1084 CrossRef CAS.
- V. Kaliginedi, P. Moreno-García, H. Valkeiner, W. Hong, M. García-Suárez, P. Buiter, J. L. H. Otten, J. C. Hummelen, C. J. Lambert and T. Wandlowski, J. Am. Chem. Soc., 2012, 134, 5262–5275 CrossRef CAS.
- P. Moreno-García, M. Gulcur, D. Z. Manriques, T. Pope, W. Hong, V. Kaliginedi, C. Huand, A. Batsanov, M. R. Bryce, C. J. Lambert and T. Wandlowski, J. Am. Chem. Soc., 2013, 135, 12228–12240 CrossRef.
- B. Huang, X. Liu, Y. Yuan, Z.-W. Hong, J.-F. Zheng, L.-Q. Pei, Y. Shao, J.-F. Li, X.-S. Zhou, J.-Z. Chen, S. Jin and B.-W. Mao, J. Am. Chem. Soc., 2018, 140, 17685–17690 CrossRef CAS.
- H. Ozawa, M. Baghernejad, O. A. Al-Owaedi, V. Kaliginedi, T. Nagashima, J. Ferrer, T. Wandlowski, V. M. García-Suárez, P. Broekmann, C. J. Lambert and M. Haga, Chem. – Eur. J., 2016, 22, 12732–12740 CrossRef CAS.
- E. Leary, L. A. Zotti, D. Miguel, I. R. Márquez, L. Palomino-Ruiz, J. M. Cuerva, G. Rubio-Bollinger, M. T. González and N. Agrait, J. Phys. Chem. C, 2018, 122, 3211–3218 CrossRef CAS.
- E. W. C. Chan, P. Baek, D. Barker and J. Travas-Sejdic, Polym. Chem., 2015, 6, 7618–7629 RSC.
- V. S. Pavlovich, D. T. Kozhich and T. A. Pavich, J. Appl. Spectrosc., 1999, 66, 208–211 CrossRef CAS.
- M. G. Boyle, L. Feng and P. Dawson, Ultramicroscopy, 2008, 108, 558–566 CrossRef CAS.
- E. Lörschter, D. Widmer and B. Gotsmann, Nanoscale, 2013, 5, 10542–10549 RSC.
- P. Giannozzi, S. Baroni, N. Bonini, M. Calandra, R. Car, C. Cavazzoni, D. Ceresoli, G. L. Chiarotti, M. Cococcioni, I. Dabo, A. D. Corso, S. de Gironcoli, S. Fabris, G. Fratesi, R. Gebauer, U. Gerstmann, C. Gougoussis, A. Kokalj, M. Lazzeri, L. Martin-Samos, N. Marzari, F. Mauri, R. Mazzarello, S. Paolini, A. Pasquarello, L. Paulatto, C. Sbraccia, S. Scandolo, G. Sclauzero, A. P. Seitsonen, A. Smogunov, P. Umari and R. M. Wentzcovitch, J. Phys.: Condens. Matter, 2009, 21, 395502 CrossRef.
- P. Giannozzi, O. Andreussi, T. Brumme, O. Bunau, M. B. Nardelli, M. Calandra, R. Car, C. Cavazzoni, D. Ceresoli, M. Cococcioni, N. Colonna, I. Carnimeo, A. D. Corso, S. de Gironcoli, P. Delugas, R. A. DiStasio Jr., A. Ferretti, A. Floris, G. Fratesi, G. Fugallo, R. Gebauer, U. Gerstmann, F. Giustino, T. Gorni, J. Jia, M. Kawamura, H.-Y. Ko, A. Kokalj, E. Küçükbenli, M. Lazzeri, M. Marsili, N. Marzari, F. Mauri, N. L. Nguyen, H.-V. Nguyen, A. Otero-de-la-Roza, L. Paulatto, S. Poncé, D. Rocca, R. Sabatini, B. Santra, M. Schlipf, A. P. Seitsonen, A. Smogunov, I. Timrov, T. Thonhauser, P. Umari, N. Vast, X. Wu and S. Baroni, J. Phys.: Condens. Matter, 2017, 29, 465901 CrossRef CAS.
- J. P. Perdew, K. Burke and M. Ernzerhof, Phys. Rev. Lett., 1996, 77, 3865–3868 CrossRef CAS.
- A. Dal Corso, Comput. Mater. Sci., 2014, 95, 337–350 CrossRef CAS.
- A. Pecchia, G. Penazzi, L. Salvucci and A. Di Carlo, New J. Phys., 2008, 10, 065022 CrossRef.
- M. Elstner, D. Porezag, G. Jungnickel, J. Elsner, M. Haugk, T. Frauenheim, S. Suhai and G. Seifert, Phys. Rev. B: Condens. Matter Mater. Phys., 1998, 58, 7260–7268 CrossRef CAS.
- T. Frauenheim, G. Seifert, M. Elstner, T. Niehaus, C. Köhler, M. Amkreutz, M. Sternberg, Z. Hajnal, A. Di Carlo and S. Suhai, J. Phys.: Condens. Matter, 2002, 14, 3015–3048 CrossRef CAS.
- B. Hourahine, B. Aradi, V. Blum, F. Bonafé, A. Buccheri, C. Camacho, C. Cevallos, M. Y. Deshaye, T. Dumitrică, A. Dominguez, S. Ehlert, M. Elstner, T. van der Heide, J. Hermann, S. Irle, J. J. Kranz, C. Köhler, T. Kowalczyk, T. Kubař, I. S. Lee, V. Lutsker, R. J. Maurer, S. K. Min, I. Mitchell, C. Negre, T. A. Niehaus, A. M. N. Niklasson, A. J. Page, A. Pecchia, G. Penazzi, M. P. Persson, J. Řezáč, C. G. Sánchez, M. Sternberg, M. Stöhr, F. Stuckenberg, A. Tkatchenko, V. W.-Z. Yu and T. Frauenheim, J. Chem. Phys., 2020, 152, 124101 CrossRef CAS.
- A. Gagliardi, G. Romano, A. Pecchia, A. Di Carlo, T. Frauenheim and T. A. Niehaus, New J. Phys., 2008, 10, 065020 CrossRef.
- D. M. Gutierrez, A. Di Pierro, A. Pecchia, L. M. Sandonas, R. Gutierrez, M. Bernal, B. Mortazavi, G. Cuniberti, G. Saracco and A. Fina, Nano Res., 2019, 12, 791–799 CrossRef.
- G. Schulze, K. J. Franke, A. Gagliardi, G. Romano, C. Lin, A. Da Rosa, T. A. Niehaus, T. Frauenheim, A. Di Carlo, A. Pecchia and J. I. Pascual, Phys. Rev. Lett., 2008, 100, 136801 CrossRef CAS.
- T. A. Niehaus, M. Elstner, T. Frauenheim and S. Suhai, J. Mol. Struct.: THEOCHEM, 2001, 541, 185–194 CrossRef CAS.
- A. Fihey, C. Hettich, J. Touzeau, F. Maurel, A. Perrier, C. Köhler, B. Aradi and T. Frauenheim, J. Comput. Chem., 2015, 36, 2075–2087 CrossRef CAS.
- M. Valiev, E. J. Bylaska, N. Govind, K. Kowalski, T. P. Straatsma, H. J. J. Van Dam, D. Wang, J. Nieplocha, E. Apra, T. L. Windus and W. A. de Jong, Comput. Phys. Commun., 2010, 181, 1477–1489 CrossRef CAS.
- A. H. Larsen, J. J. Mortensen, J. Blomqvist, I. E. Castelli, R. Christensen, M. Du\lak, J. Friis, M. N. Groves, B. Hammer, C. Hargus, E. D. Hermes, P. C. Jennings, P. B. Jensen, J. Kermode, J. R. Kitchin, E. L. Kolsbjerg, J. Kubal, K. Kaasbjerg, S. Lysgaard, J. B. Maronsson, T. Maxson, T. Olsen, L. Pastewka, A. Peterson, C. Rostgaard, J. Schiøtz, O. Schütt, M. Strange, K. S. Thygesen, T. Vegge, L. Vilhelmsen, M. Walter, Z. Zeng and K. W. Jacobsen, J. Phys.: Condens. Matter, 2017, 29, 273002 CrossRef.
- N. Mosso, U. Dreschler, F. Menges, P. Nirmalraj, S. Karg, H. Riel and B. Gotsmann, Nat. Nanotechnol., 2017, 12, 430–433 CrossRef CAS.
- A. Batra, P. Darancet, Q. Chen, J. S. Meisner, J. R. Widawsky, J. B. Neaton, C. Nuckolls and L. Venkataraman, Nano Lett., 2013, 13, 6233–6237 CrossRef CAS.
- A. Gagliardi, A. Pecchia, T. A. Niehaus, T. Frauenheim and A. Di Carlo, J. Comput. Electron., 2007, 6, 345–348 CrossRef CAS.
- J. B. Neaton, M. S. Hybertsen and S. G. Louie, Phys. Rev. Lett., 2006, 97, 216405 CrossRef CAS.
- M. Strange, C. Rostgaard, H. Häkkinen and K. S. Thysgesen, Phys. Rev. B: Condens. Matter Mater. Phys., 2011, 83, 115108 CrossRef.
- F. Evers, R. Korytár, S. Tewari and J. M. van Ruitenbeek, Rev. Mod. Phys., 2020, 92, 035001 CrossRef.
- X. Wang, T. L. R. Bennett, A. Ismael, L. A. Wilkinson, J. Hamill, A. J. P. White, I. M. Grace, O. V. Kolosov, T. Albrecht, B. J. Robinson, N. J. Long, L. F. Cohen and C. J. Lambert, J. Am. Chem. Soc., 2020, 142, 8555–8560 CrossRef CAS.
- V. Lutsker, B. Aradi and T. A. Niehaus, J. Chem. Phys., 2015, 143, 184107 CrossRef CAS.
Footnote |
| † Electronic supplementary information (ESI) available: Synthesis and characterisation of the OPE3 derivatives; X-ray crystallographic data. CCDC 1996615 and 1996616. For ESI and crystallographic data in CIF or other electronic format see DOI: 10.1039/d0nr04413j |
| This journal is © The Royal Society of Chemistry 2020 |