
 Open Access Article
 This Open Access Article is licensed under a
 Creative Commons Attribution 3.0 Unported Licence
Programming properties of transient hydrogels by an enzymatic reaction†
Santanu
Panja‡
 ,
Kamila
Boháčová‡
,
Bart
Dietrich
and
Dave J.
Adams
*
,
Kamila
Boháčová‡
,
Bart
Dietrich
and
Dave J.
Adams
*
School of Chemistry, University of Glasgow, Glasgow, G12 8QQ, UK. E-mail: dave.adams@glasgow.ac.uk
First published on 3rd June 2020
Abstract
Supramolecular gels are usually stable in time as they are formed under thermodynamic equilibrium or at least in a deep well of a kinetically trapped state. However, artificial construction of kinetically controlled transient supramolecular gels is an interesting challenge. In these systems, usually a kinetically trapped transient aggregate is formed by active building blocks that leads to gelation; the gel then typically returns to the solution state. In this work, we show that such transient aggregation can occur by successive formation of two distinctly different kinetically controlled metastable states. Control over the first metastable state allows us to achieve significant control over the stability and properties of the second metastable state.
Introduction
Self-assembly can be used to build up complex structures from individual molecules using different non-covalent interactions. Supramolecular gels are formed when monomeric building blocks self-assemble into long fibrous structures that entrap solvent molecules.1–7 Generally, man-made self-assembly is an energetically down-hill process and so self-assembled gels can be formed under thermodynamic equilibrium.8–11 However, depending on the preparative pathway, self-assembled gels may exist as kinetically trapped structures where the assembly structures reside in the local thermodynamic minimum in the free energy landscape.8–14 This kinetically-trapped structure may be in a sufficiently deep energy well such that the gel state is stable for long periods of time. As a consequence, supramolecular gels are stable, and their mechanical properties do not generally change over their useful lifetime.In comparison, natural self-assembled structures and processes such as microtubule formation, cell division, replication, formation of actin filaments, and signal transduction are energetically up-hill processes and so require a continuous source of energy input to maintain the assembled structures.10,15–20 Such assemblies are kinetically controlled and are classified as out-of-equilibrium assemblies where the functional efficiency of the assembly state is governed by the assembly pathway. Such out-of-equilibrium kinetics create supramolecular assemblies of finite lifetimes which are referred to as transient self-assembled systems.
Inspired by nature, there is significant current interest in preparing transient gels under out-of-equilibrium conditions. Various strategies like pH cycles, co-operative catalysis, chemical reaction networks, redox reactions, enzymatic reactions have been documented to construct transient assemblies.21–38 In these cases, systems operating under out-of-equilibrium usually exhibit one kinetically-controlled transient aggregation formed by the active building blocks during functioning. In this work, we show that such transient aggregation can occur by successive formation of two distinctly different kinetically controlled metastable states, where control over the first metastable state allows us to achieve significant control over the stability and properties of the second metastable state (Fig. 1). Accessing of metastable assembly states is an interesting domain of materials chemistry research.11,13,39–45 Recently, Wang et al. reported a dynamic system where an initially formed metastable transient aggregation is programmed into a thermodynamically more stable hydrogel by aging.45 In our system, a dynamic covalent bond formation leads to either a thermodynamically stable yellow gel at high pH or a kinetically controlled metastable orange gel at low pH (Fig. 1). By adjusting the initial pH, an intermediate metastable yellow gel can be accessed that evolves into the transient orange gel over time. As the different energy states are pH dependent, we pre-programme its change by introducing the autocatalytic reaction between urea and urease that allows us to achieve a self-regulated gel-to-gel transition. As such, the lifetime and stability of the final orange gel can be significantly extended.
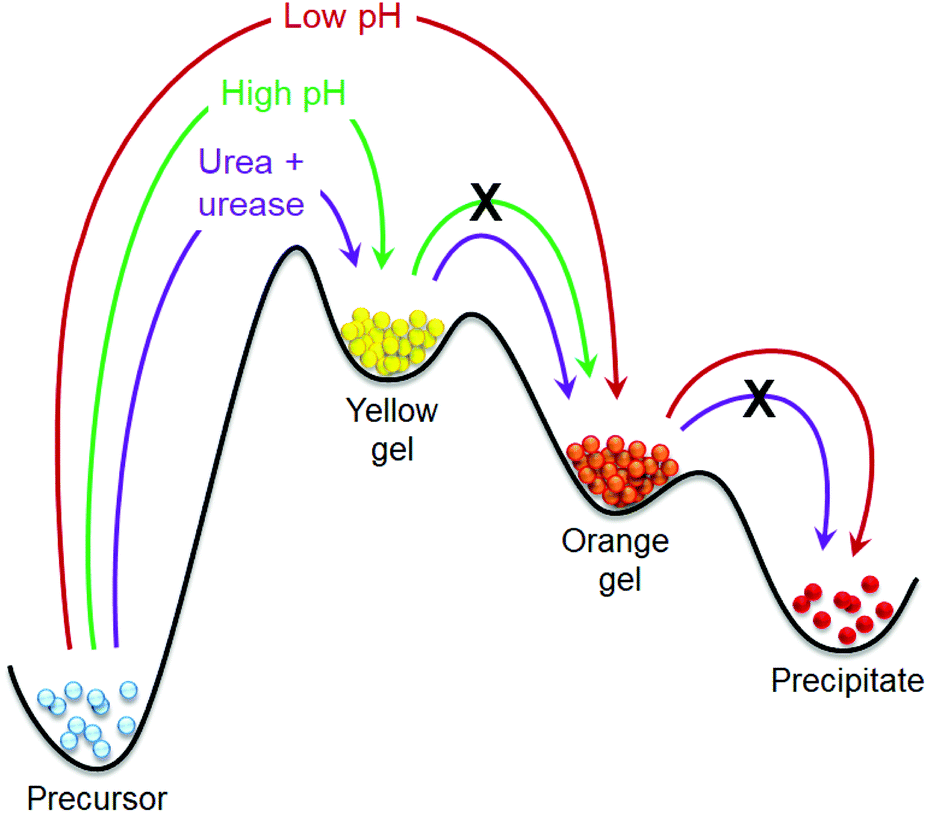 | ||
| Fig. 1 Cartoon representing the phase transformations of our self-assembled system under different conditions. | ||
Results and discussion
Dynamic imine bonds are formed and broken reversibly under mild reaction conditions.46,47 Here, we utilize this concept to synthesize the gelator molecules from the reaction between 4-(dimethylamino)benzaldehyde (1) and hydrazine monohydrochloride (2) in DMSO/H2O (20/80, v/v) (Fig. 2). When an aqueous solution of 2 was added to the DMSO solution of 1 (molar ratio of 1 and 2 is 2![[thin space (1/6-em)]](https://www.rsc.org/images/entities/char_2009.gif) :1), an orange, self-supporting gel was formed after 5 minutes. The resulting gel was transient and after 5 hours collapsed to give an orange precipitate (Fig. 2b). Interestingly, when the same reaction was performed in presence of base (an equimolar amount of NaOH with respect to 2), instead of an orange coloured gel, a white-colored viscous solution initially appeared at the beginning that slowly evolved to a yellow coloured viscous solution (Fig. 2c) and then a self-supporting gel. The appearance of the gel was significantly delayed by presence of base, however, unlike the orange gel, the yellow gel formed at high pH was stable over time and did not collapse even after several days.
:1), an orange, self-supporting gel was formed after 5 minutes. The resulting gel was transient and after 5 hours collapsed to give an orange precipitate (Fig. 2b). Interestingly, when the same reaction was performed in presence of base (an equimolar amount of NaOH with respect to 2), instead of an orange coloured gel, a white-colored viscous solution initially appeared at the beginning that slowly evolved to a yellow coloured viscous solution (Fig. 2c) and then a self-supporting gel. The appearance of the gel was significantly delayed by presence of base, however, unlike the orange gel, the yellow gel formed at high pH was stable over time and did not collapse even after several days.
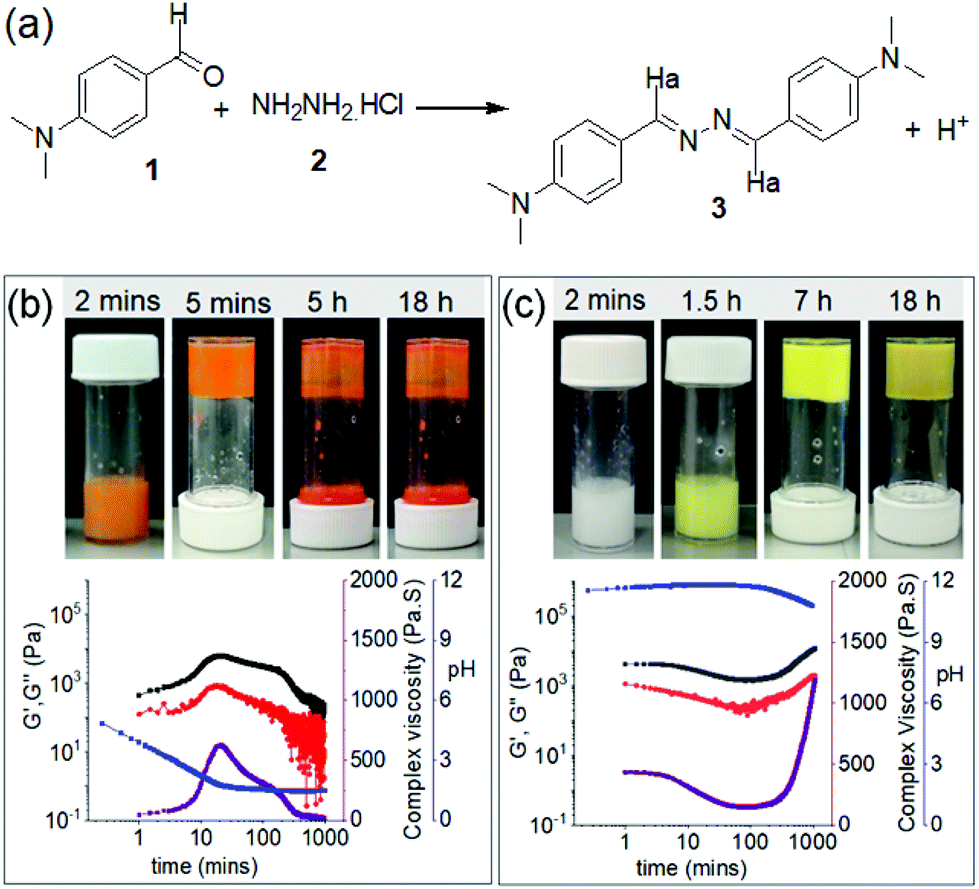 | ||
| Fig. 2 (a) Chemical reaction between 1 and 2 resulting in a formation of the azine 3. (b) and (c) represent variation of G′ (black), G′′ (red), complex viscosity (purple) and pH (blue) with time for the mixture of 1 and 2 in absence (b) and presence (c) of NaOH. For (b) and (c), the photographs represent phase changes of the mixture of 1 and 2 with time under different conditions. For (b) and (c), initial concentration of 1 is 20 mg mL−1, [2] = 0.5 equivalent. Molar ratio of 2 and NaOH is 1:1. Solvent is DMSO/H2O (20/80, v/v). | ||
To characterize the chemical component responsible for gelation in both cases (whether transient or stable, i.e. in the absence and presence of base), 1H NMR spectroscopy of the mixture of 1 and 2 obtained under different conditions was carried out (Fig. S1†). By 1H NMR spectroscopy, the signal for aldehyde proton of 1 at 9.67 ppm almost completely disappeared. The appearance of a new peak at 8.50 ppm clearly demonstrates the imine bond formation between 1 and 2 in both cases. Integration of the 1H NMR spectra shows around a 92% conversion to the imine 348,49 after 18 hours in both cases, and thereby eliminated any scope of hydrolysis of imine 3 at acidic pH. These data also show that once the compound 3 was formed, irrespective of pH of the medium, it remained stable and did not undergo hydrolysis to regenerate the starting aldehyde and amine. The imine bond formation was further confirmed by high resolution mass spectrometry, which shows the expected mass for compound 3 (Fig. S2†). Interestingly, when the gelation experiment was conducted with pre-synthesized 3 in DMSO/H2O, no gel formation was observed (Fig. S3†). Rather, yellow and orange coloured precipitation occurred under basic and acidic pH respectively. These observations show that in situ formation of 3 from the mixture of 1 and 2 is essential for gel formation. The higher solubility of 1 and 2 (as compared to 3) leads to supersaturation effects as 3 is formed which results in gelation of the mixture. Without supersaturation of the solution, a simple solvation of the compound 3 does not yield a gel. Differences in the aggregation and alignment of the molecules in the assembled structure may also play an important role in self-assembly.45,50
To better understand the development of the gels in absence and presence of NaOH, time sweep rheology was conducted (Fig. 2b and c). In both cases, at the beginning of the experiment, the storage modulus (G′) was considerably higher than the loss modulus (G′′) indicating that self-assembly begins at the early stages (i.e. on mixing 1 and 2 before it is possible to begin the experiment). In absence of a base, both G′ and G′′ started to increase rapidly after 3 minutes and reached their maxima after around 20 minutes. With further time, both G′ and G′′ slowly decreased indicating gel-to-sol transformation. Complex viscosity data recorded over time follows a similar trend as that of rheology and exhibits a bell-shaped curve, showing a maximum viscosity after 20 minutes followed by a gradual decrease with time. The changes in the rheological moduli as well as viscosity over time correlate with the visual observations (Fig. 2b). In the presence of NaOH, mixing 1 and 2 leads to a different kinetic profile. In presence of a base, although the increase of G′ and G′′ was delayed compared to without base, the final values of the absolute stiffness (G′) and complex viscosity were significantly higher and did not decrease, agreeing with the visual observation that the final product is a stable gel (Fig. 2c).
The different trends in the rheological studies can be attributed to the changes in pH of the respective solutions with time. pH measurements showed a good correlation with the rheology data (Fig. 2b and c). The aqueous solution of 2 exhibits a pH of around pH 4.7. When this solution was added to 1, the pH of the mixture decreased rapidly and reached a plateau at pH 1.6–1.7 after 25 minutes. The gel starts to collapse when the pH reaches the minimal value (Fig. 2b). For the high pH gel, when NaOH was added to 2, the pH of the solution increased to pH 11.3. The initial pH of the mixture of 1 and 2 was above 11 and stayed relatively constant for several hours. Eventually, the pH began to decrease which was mirrored by the increase in rheological values and followed by gelation (Fig. 2c). The pKa of compound 3 is 7.45 in ethanol as reported by Derinkuyu et al.49 However, because of poor solubility in DMSO–water, we were unable to determine the pKa of 3 in our case from pH-metric titration at high concentration.49 At a concentration of 1 × 10⁻⁵ M, compound 3 exhibits apparent pKa of 6.0 in DMSO–water (20/80, v/v) (Fig. S4†). Correlation of these observations suggests that, when the pH of the medium is acidic (bellow the pKa), the imine nitrogen of 3 gets protonated.49 This protonated form of 3 is more prone to self-assembly through intermolecular hydrogen bonding, as shown in Fig. S4,† than compound 3.51 Because of this, gelation occurs rapidly at low pH as compared to that at high pH. These observations are quite similar to the polymer system reported by Wang group, where the formation of acylhydrazone bonds was efficient at a low initial pH of 4 and further activation of the acylhydrazone bonds through protonation not only led to rapid hydrogelation but also allowed good healing capability under acidic condition.51 However, when the pH is sufficiently low, all the molecules of 3 become protonated and we assume destroy the hydrogen bonded network through electrostatic repulsion. The increased polarity of the compound then aids the dissolution of the gel. As a result, the gel state exhibits a finite lifetime.
To confirm this, time variable UV-vis and emission spectra of the mixture of 1 and 2 were recorded (Fig. 3). From UV-vis spectroscopy, the weak shoulder at 430 nm indicates formation of the azine bond.52 The red-shifted appearance of this band to 500 nm corresponding to the protonated form of 3 backs up our proposition (Fig. 3a and Fig. S5†).49 Such a band at 500 nm was absent in the absorption spectra of the same mixture in presence of NaOH (Fig. 3c and Fig. S5†).49 From fluorescence spectroscopy, in absence of base, the emission of 1 at 455 nm progressively decreases because of consumption of 1 through chemical reaction and after 30 minutes has almost levelled off (Fig. 3b and Fig. S5†). Alongside this, the intensity of the peak at 555 nm which corresponds to the protonated form of 3 slowly decreases and red-shifts to 600 nm over time.49 This decrease in emission intensity at 555 nm is due to aggregation-induced quenching.53,54 After 30 minutes, no further significant change in emission at 600 nm was noted. The final peak intensity at 600 nm therefore indicates the presence of the protonated form of 3 (Fig. 3b and Fig. S5†).49 In the presence of NaOH, the emission of 1 at 455 nm slowly red-shifted to 500 nm. Consequently, the final peak intensity at 500 nm suggests that the unprotonated form of 3 is present (Fig. 3d and Fig. S5†).49 The plot of emission intensity at 455 nm with time exhibits that the consumption of 1 occurred at a faster rate in acidic solution than in base which in turn suggests the formation of azine 3 was facile under acidic condition (Fig. S5†). Comparison of these results indicates that the different colouration of the gels arises from the presence of either the protonated or unprotonated forms of 3 in solution. On protonation, the conjugate acid of 3 was stabilized by resonance of the dimethylamino group and induced orange coloration.49 This protonated form of 3 can nucleate the self-assembly in a kinetically controlled pathway (Fig. S4†), leading to an orange coloured transient hydrogel.51 In presence of base, no such seeding-induced self-assembly occurs. Rather, the system spontaneously drives to a thermodynamically stable yet kinetically trapped yellow coloured hydrogel over time.
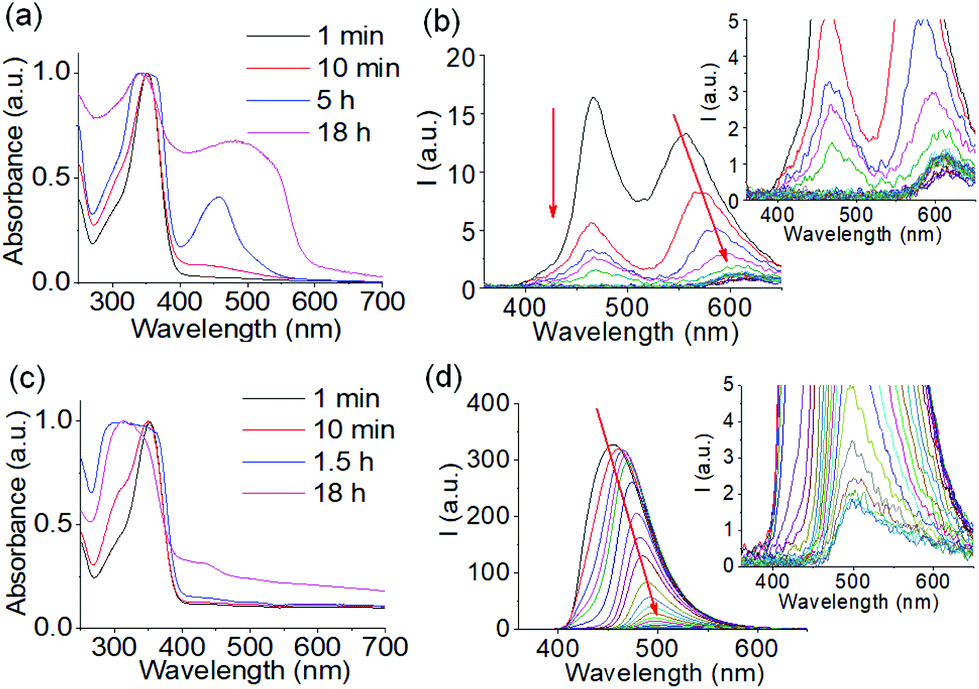 | ||
| Fig. 3 Time variable UV-vis (a and c) and emission (b and d) spectra of the mixture of 1 and 2 obtained in absence (a and b) and presence (c and d) of NaOH. For (b) and (d), inset represents the expanded section of the corresponding graph and shows the final peaks. The red arrow shows how the spectrum changes with time. In all cases, initial concentration of 1 is 20 mg mL−1, [2] = 0.5 equivalent. Molar ratio of 2 and NaOH is 1:1. Solvent is DMSO/H2O (20/80, v/v). | ||
We next set out to investigate the energy landscape of the system and the different potential pathways in order to access and control transitions between possible metastable and kinetically trapped states. A change in pH can alter the degree of protonation of the gelator, thus modifying its solubility or availability to hydrogen bonding. This in turn leads to lowering of the energy barrier and easier transitions from one energy state to another. To induce a pH change, the autocatalytic reaction between urea and urease was developed by Taylor et al.55–57 and also used by Walther et al.58,59 and other research groups.16,60–63 Under aqueous conditions, urea reacts with urease to produce ammonia, which is responsible for the increase of the pH of the medium.64–68 The reaction itself is highly dependent on the initial reaction conditions such as pH and the reagent concentrations,57,64,65 which enables us to exercise precise control over the rate of pH change and subsequent transitions between the energy states.
As the outcome of the chemical reaction between 1 and 2 is pH dependent, the behaviour of the system in the absence of urea but with the enzyme present at different initial pH had to be established. For these experiments, instead of 2, aqueous mixture of 2 and urease having different initial pH were used. In all cases, we maintained the urease concentration at 0.05 mg mL−1. An aqueous mixture of 2 and urease exhibits a pH 4.9. We adjusted the initial pH of the solutions to pH 6.9, 7.2, 7.5, 7.6, or 7.8 using NaOH. We then compared the rates of pH change of these solutions in presence of 1 (Fig. S6†). When no base was added, the initial pH dropped from pH 4.9 to pH 4.2 at the beginning of the reaction and decreased to ∼pH 1.7 after 20 minutes where it became constant. As the initial pH was progressively increased, there was an increase in the lifetime of the high pH state (Fig. S6†).
The physical behaviour of the systems varied depending on the initial pH of the solutions (Fig. 4). In case of the solutions of initial pH 4.9 and 6.9, the systems exhibit formation of orange coloured transient hydrogels, whilst the solution having an initial pH of 7.2 exhibits a yellow coloured viscous material at the beginning followed by orange coloured gel-to-sol transition with time. The solutions with an initial pH of 7.5, 7.6 and 7.75 produced yellow coloured gels at the early stages which slowly evolved to orange gels through orange-yellow intermediates. With further time all the orange gels disintegrate into orange sols (Fig. 4). This was further confirmed by time dependent absorption and emission experiments. For the solutions having high initial pH, the appearance of the redshifted band at 500 nm corresponding to the protonated form of 3 responsible for orange colouration was significantly delayed (no presence after 1 hour) compared to the solutions having low initial pH where we see the band appearing after 10–60 minutes (Fig. S7†). Similarly, from fluorescence spectroscopy, as the initial pH of the solution increases, the decrease in emission at 500 nm followed by the appearance of the band at 600 nm which corresponds to the protonation of 3 was considerably delayed (Fig. S8 and S9†). These times correspond to gel formation in each case. Fig. S8† shows the final peak intensity at 600 nm in all cases. Notably, after 18 hours, the absorption and emission spectra of all the orange sols appeared almost same indicating formation of a similar type of material at the end (Fig. S7 and S8†). Furthermore, correlation of the results from Fig. 4 with Fig. 2b suggests that, although in presence of urease, the systems followed different kinetics at the early stages, the evolution of the orange gels over time followed a common pathway as in the case when urease was absent and finally produced thermodynamically stable orange sols.
 | ||
| Fig. 4 (a–f) Variation of G′ (black), G′′ (red), complex viscosity (purple) and pH (blue) with time for mixture of 1 and 2 in the presence of urease involving initial pH 4.9, 6.9, 7.2, 7.5, 7.6 and 7.75 respectively. Photographs showing the phase changes of the mixture of 1 and 2 with time under respective conditions. In all cases, initial concentration of 1 is 20 mg mL−1, [2] = 0.5 equivalent, [urease] = 0.05 mg mL−1. Solvent is DMSO/H2O (20/80, v/v). | ||
The delay in gelation agrees with the pH profile; gels formed at the lower initial pH (pH 4.9 and 6.9) show their highest viscosity as well as rheological moduli after 10 minutes while for high pH gels the highest values appeared after around 2 hours (Fig. S10†). Comparison of the complex viscosity data shows that in each case there was a sudden increase in the viscosity values just around when the pH began to decrease (Fig. 4). These results again endorse the nucleation of self-assembly by the protonated form of 3 as described in Fig. S4.† This further confirms that the evolution of yellow gel to orange sol (at high initial pH) through an orange gel as intermediate involves two kinetically controlled metastable steps where control over the lifetime and properties of the yellow coloured first metastable state can allow to achieve control over the properties of the orange coloured second metastable gel.
Once the influence of initial pH on transitions between two different kinetically controlled states had been established, we moved to investigate the effect of urea and urease reaction on these transitions. Initially, we incorporated 40 μL of urea (concentration is 2 M) into the system and performed the same experiments in the presence of urease. Again, the initial pH of the mixture of 2 and urease (pH of the mixture is pH 4.9) was adjusted to pH 6.9, 7.2, 7.5, 7.6 and 7.75 by NaOH, before addition to the mixture of 1 and urea. The rate of pH change of the mixture of 1 and 2 in presence of the urea-urease reaction under different conditions was measured (Fig. S11–S13†). In absence of any base (pH 4.9), the pH-time profile follows similar trends as in the case when urea was absent (Fig. S13†). In this case, the initial pH decreased from pH 4.9 to ∼pH 1.7 within 20 minutes where it became constant. As the urea-urease reaction is highly pH dependent, and below pH 4 urease loses its activity;57,64,65 consequently, in this case, no prominent effect of the enzymatic reaction on the system was observed. Only a slight reduction in the rate of pH decrease was noticed at the early stages which resulted in a small delay in the appearance of the orange coloured gel which was further confirmed by rheological studies (Fig. 4a and Fig. S12, S13†). This transient gel exhibits a lower value of absolute stiffness and viscosity in comparison to the transient gel formed in absence of urea. The lower value of complex viscosity was probably due to slower pH decrease which eventually delayed the hydrogen bond mediated acceleration of self-assembly by the protonated form of 3 (as shown in Fig. S4†). Consequently, we believe that the system did not have enough time to produce stiffer gel before it started to disintegrate as compared to when urea was absent. Time variable absorption spectra also support the visual observations. Using UV-vis spectroscopy, the intensity of the red-shifted band at 450 nm corresponding to the protonated form of 3 appears significantly lower after 10 minutes (Fig. S7 and S14a†). As a consequence, nucleated aggregation was delayed resulting in a slower appearance of the gel.
As the initial pH was increased by the addition of NaOH (pH 6.9, 7.2, 7.5, 7.6 and 7.75), a significant change in pH time profile as well as in the visual appearance of the gels was noticed in presence of urea (Fig. S11 and S12†). In these cases, the pH-time profiles follow similar trends in the early stages as compared to when urea was absent (Fig. S6 and S11†). However, after a certain time, the sudden decrease in pH is retarded due to the formation of NH3 through the urea and urease reaction. In all cases, the final pH of the medium was in the region of 7–8. Interestingly, no orange colouration was noticed. Indeed, a yellow coloured gel appeared after 40 minutes in all cases, which remained stable with time (Fig. S12†). Time sweep rheology also shows the evolution of the systems to stable gels with time (Fig. S12†). No significant change in stiffness (G′) of the final gels formed from high initial pH was noticed (pH 7.75, 7.6, 7.5) (Fig. S15 and S16†). Gels obtained from lower initial pHs (pH 7.2, 6.9) are less stiff (i.e. a lower G′). In comparison to the gel formed in presence of NaOH, these gels showed lower stiffness (G′) but ∼2–4 times increase in strength (critical strain) (Fig. S15 and S16†).
Correlation of the rheological data further indicates that in these cases, the appearance of the gels was significantly delayed in presence of the urease-urea reaction compared to the solution of initial pH 4.9 (Fig. S12†). These observations again emphasize the absence of nucleated acceleration of aggregation at high pH. Time dependent UV-vis and emission spectroscopy further confirm our proposition. The red-shifted absorption in the 450–500 nm region corresponding to the protonated (orange coloured) form of 3 is absolutely absent in all other cases with higher initial pH (Fig. S14†). Similarly, by fluorescence spectroscopy, the only appearance of the band at 600 nm which corresponds to the protonated form of 3 is seen in the case of initial pH 4.9 (Fig. S17†). All other systems showed a similar decrease in emission at 455 nm during the experiments which was significantly delayed at high pH (Fig. S17 and S18†). As expected, all the yellow gels that appeared at high pH showed emission at 500 nm. Hence from the experimental evidence, it is clear that the system formed from low initial pH (pH 4.9) evolves through a common kinetically controlled metastable state just like the systems where urea was absent (for all the solutions having initial pH 4.9–7.75), while the systems formed from high initial pHs (pH 6.9–7.75) directly lead to thermodynamically stable gels in presence of the enzymatic reaction.
Following these findings, we decided to investigate the processes at a lower initial concentration of urea (20 μL). As there was no significant change in behaviour of the systems prepared from solutions of pH 4.9 in absence and presence of 40 μL of urea, we omitted this solution for further experiments. As before, we adjusted the pH of the mixture of 2 and urease to pH 6.9, 7.2, 7.5, 7.6 and 7.75 using NaOH before addition to the mixture of 1 and urea (20 μL). From the recorded pH data, we could see a mixture of trends among solutions starting at different initial pH (Fig. 5 and Fig. S19, S20†). For the lower initial pH solutions (pH 6.9 and 7.2), the pH-time profiles show analogous trend to when urea was absent, however, the lifetime of the high pH state is significantly increased (Fig. S6 and S19†). A similar curve was observed for solutions of higher pH (pH 7.5 and 7.6) but with a slower rate of pH change, once the values start to decrease. There was also little increase in the final pH of the systems (∼pH 2.5). On the other hand, in the case of the solution of initial pH 7.75, the enzymatic reaction produced enough base to restrict the decrease in pH altogether and keep the values above pH 6.5 (Fig. S19†). Comparison of the pH-time profiles obtained in presence of 0 μL, 20 μL and 40 μL of urea reveals that at the early stages, there was no significant change in the variation of pH for the systems obtained from the same initial pH. However, in all cases, the final pH of the systems proportionally increases with an increase in initial urea concentration (Fig. S20†).
 | ||
| Fig. 5 (a–e) Variation of G′ (black), G′′ (red), complex viscosity (purple) and pH (blue) with time for the mixture of 1 and 2 involving urea (20 μL of 2 M) and urease reaction starting at different initial pH: 6.9, 7.2, 7.5, 7.6 and 7.75 respectively. Photographs showing the phase changes of the mixture of 1 and 2 with time under respective conditions. In all cases, initial concentration of 1 is 20 mg mL−1, [2] = 0.5 equivalent, [urease] = 0.05 mg mL−1. Solvent is DMSO/H2O (20/80, v/v). | ||
The differences seen in the pH profiles correspond to different physical behaviours among these systems (Fig. 5). Initially, all systems produced yellow coloured gels within 50 minutes. The yellow gels formed from an initial pH of 6.9 and 7.2 then proceeded to evolve to an orange gel overnight, although no gel-to-sol transition was observed in the course of the experiment. With higher initial pH (pH 7.5 and 7.6), the transition into an orange gel was postponed but instead, an orange-yellow intermediate gel appeared as the pH dropped below ∼pH 2.5. Finally, the system of initial pH 7.75 never showed any appearance of orange colouration. Instead, the yellow gel remained stable in time as the pH decrease was prevented by base production due to the urea and urease reaction (Fig. 5). Furthermore, as the initial pH was progressively raised the rheology data also show an analogous increase in the final G′ and G′′ values of the final gels (Fig. 5 and Fig. S21, S22†). Notably, for the systems of initial pH 6.9 and 7.2, although the final pH is the same, the gel formed from pH 7.2 showed higher stiffness (2105 Pa) as compared to the gel formed from pH 6.9 (1720 Pa) (Fig. S19 and S21†). The same is also true for the gels formed from initial pHs 7.5 and 7.6 (6540 Pa and 30730 Pa, respectively) (Fig. S19 and S21†). These observations suggest that final pH of the medium is not the only determining factor of the material properties. The stiffness of the final material is actually governed by the pH change of the medium and thereby the properties of the initially formed kinetically controlled yellow gel states.
Time dependent UV-vis spectroscopy and emission data further support our findings. The final absorption at 500 nm indicating the protonated form of 3 which results in orange colouration concomitantly decreases with an increase in initial pH of the solutions from pH 6.9 to pH 7.5 and is almost absent in the case of solutions with initial pH 7.6 and 7.75 (Fig. S23†). Similarly, we can see from the fluorescence spectra that the decrease of emission intensity at 500 nm was deferred as subject to increased initial pH which corresponds to the delay in gelation of these solutions (Fig. S24 and S25†). Moreover, the final emission band for the low pH solutions (from pH 6.9 to pH 7.5) appears at 600 nm indicating protonation of 3 (Fig. S24†). On the other hand, systems with high initial pH (pH 7.6 and 7.75) show final emission at 500 nm which correlates with the presence of the yellow gel at the end (Fig. S24†).
These results indicate that the systems obtained from initial pH of 6.9–7.6 evolve through two kinetically controlled states, where the yellow coloured first metastable state actually determines the properties of the orange or orange-yellow coloured second state. In this context, SEM images of the gels and sols obtained under different conditions were recorded (Fig. S26†). SEM images show that irrespective of initial reaction conditions, all the orange sols (obtained at low final pHs) exhibit rectangular disks while yellow gels (obtained at high final pHs) exhibit closely spaced flake like aggregates. Interestingly, the orange-yellow gels exhibit morphology where the concentrations of flake-like aggregates was significantly reduced while globular aggregates appeared.
Conclusions
We have successfully created a dynamic gel system that allows programming of a metastable assembly state which eventually drives the system to a new material exhibiting a gel-to-gel transition. In our study, we devised a system by employing dynamic imine chemistry through to which a thermodynamically controlled yellow gel is formed at high pH while a kinetically controlled transient orange gel appears at low pH. Adjustment of the initial pH of the solutions leads to a situation where another kinetically controlled yellow gel appears before the appearance of the transient orange gel. Experimental evidence suggest that the evolution of the yellow gel to orange sol through an orange gel as intermediate involves two kinetically controlled metastable states where control over the lifetime and properties of the yellow coloured first metastable state allow us to achieve control over the properties of the orange coloured second metastable state. Furthermore, exploitation of the urea-urease reaction on our system does not allow conversion of the orange gel (low pH) to the yellow gel (high pH). Instead, it offers a controlled transition from a yellow gel to an orange gel. Indeed, temporal control over the evolution of the system between these two gel states can be achieved by adjusting either the initial pH of the solutions or the initial concentration of the urea. Depending on the initial reaction conditions, we are able to programme the transition between different coloured gels of various mechanical strengths whilst we can control the lifetime of the orange gel by controlling the properties of the initially formed metastable yellow gel.Conflicts of interest
There are no conflicts to declare.Acknowledgements
SP thanks the University of Glasgow for funding. DJA thanks the EPSRC for a Fellowship (EP/L021978/1), which also funded BD.References
- P. Terech and R. G. Weiss, Chem. Rev., 1997, 97, 3133–3160 CrossRef CAS PubMed.
- D. B. Amabilino, D. K. Smith and J. W. Steed, Chem. Soc. Rev., 2017, 46, 2404–2420 RSC.
- E. R. Draper and D. J. Adams, Chem, 2017, 3, 390–410 CAS.
- P. Dastidar, Gels, 2019, 5, 15 CrossRef CAS PubMed.
- M. Liu, G. Ouyang, D. Niu and Y. Sang, Org. Chem. Front., 2018, 5, 2885–2900 RSC.
- Y. Li, D. J. Young and X. J. Loh, Mater. Chem. Front., 2019, 3, 1489–1502 RSC.
- J. Li, W.-Y. Wong and X.-m. Tao, Nanoscale, 2020, 12, 1281–1306 RSC.
- J. Raeburn, A. Z. Cardoso and D. J. Adams, Chem. Soc. Rev., 2013, 42, 5143–5156 RSC.
- J. Wang, K. Liu, R. Xing and X. Yan, Chem. Soc. Rev., 2016, 45, 5589–5604 RSC.
- F. Tantakitti, J. Boekhoven, X. Wang, R. V. Kazantsev, T. Yu, J. Li, E. Zhuang, R. Zandi, J. H. Ortony, C. J. Newcomb, L. C. Palmer, G. S. Shekhawat, M. O. de la Cruz, G. C. Schatz and S. I. Stupp, Nat. Mater., 2016, 15, 469–476 CrossRef CAS PubMed.
- Y. Li and Y. Cao, Chin. J. Polym. Sci., 2018, 36, 366–378 CrossRef CAS.
- Y. Yan, J. Huang and B. Z. Tang, Chem. Commun., 2016, 52, 11870–11884 RSC.
- N. A. Dudukovic, B. C. Hudson, A. K. Paravastu and C. F. Zukoski, Nanoscale, 2018, 10, 1508–1516 RSC.
- J. S. Foster, J. M. Żurek, N. M. S. Almeida, W. E. Hendriksen, V. A. A. le Sage, V. Lakshminarayanan, A. L. Thompson, R. Banerjee, R. Eelkema, H. Mulvana, M. J. Paterson, J. H. van Esch and G. O. Lloyd, J. Am. Chem. Soc., 2015, 137, 14236–14239 CrossRef CAS PubMed.
- G. Ragazzon and L. J. Prins, Nat. Nanotechnol., 2018, 13, 882–889 CrossRef CAS PubMed.
- P. Dowari, S. Das, B. Pramanik and D. Das, Chem. Commun., 2019, 55, 14119–14122 RSC.
- S. Panettieri and R. V. Ulijn, Curr. Opin. Struct. Biol., 2018, 51, 9–18 CrossRef CAS PubMed.
- E. Mattia and S. Otto, Nat. Nanotechnol., 2015, 10, 111–119 CrossRef CAS PubMed.
- J. H. van Esch, R. Klajn and S. Otto, Chem. Soc. Rev., 2017, 46, 5474–5475 RSC.
- M. J. Monteiro, Nat. Nanotechnol., 2018, 13, 771–772 CrossRef CAS PubMed.
- S. De and R. Klajn, Adv. Mater., 2018, 30, 1706750 CrossRef PubMed.
- S. M. Morrow, I. Colomer and S. P. Fletcher, Nat. Commun., 2019, 10, 1011 CrossRef PubMed.
- S. Panja, C. Patterson and D. J. Adams, Macromol. Rapid Commun., 2019, 40, 1900251 CrossRef PubMed.
- B. Rieß, R. K. Grötsch and J. Boekhoven, Chem, 2020, 6, 552–578 Search PubMed.
- J. P. Wojciechowski, A. D. Martin and P. Thordarson, J. Am. Chem. Soc., 2018, 140, 2869–2874 CrossRef CAS PubMed.
- B. A. Grzybowski, K. Fitzner, J. Paczesny and S. Granick, Chem. Soc. Rev., 2017, 46, 5647–5678 RSC.
- N. Singh, B. Lainer, G. J. M. Formon, S. De Piccoli and T. M. Hermans, J. Am. Chem. Soc., 2020, 142, 4083–4087 CrossRef CAS PubMed.
- S. Debnath, S. Roy and R. V. Ulijn, J. Am. Chem. Soc., 2013, 135, 16789–16792 CrossRef CAS PubMed.
- N. Singh, G. J. M. Formon, S. De Piccoli and T. M. Hermans, Adv. Mater., 2020, 32, 1906834 CrossRef CAS PubMed.
- G. Wang and S. Liu, ChemSystemsChem, 2020, 2, e1900046 CrossRef.
- M. Tena-Solsona and J. Boekhoven, Isr. J. Chem., 2019, 59, 898–905 CrossRef CAS.
- S. Dhiman, A. Sarkar and S. J. George, RSC Adv., 2018, 8, 18913–18925 RSC.
- W. A. Ogden and Z. Guan, ChemSystemsChem, 2019, 1, e1900030 Search PubMed.
- J. Boekhoven, A. M. Brizard, K. N. K. Kowlgi, G. J. M. Koper, R. Eelkema and J. H. van Esch, Angew. Chem., Int. Ed., 2010, 49, 4825–4828 CrossRef CAS PubMed.
- S. Dhiman, K. Jalani and S. J. George, ACS Appl. Mater. Interfaces, 2020, 12, 5259–5264 CrossRef CAS PubMed.
- Z. Yin, G. Song, Y. Jiao, P. Zheng, J.-F. Xu and X. Zhang, CCS Chem., 2019, 1, 335–342 CrossRef.
- D. Spitzer, L. L. Rodrigues, D. Straßburger, M. Mezger and P. Besenius, Angew. Chem., Int. Ed., 2017, 56, 15461–15465 CrossRef CAS PubMed.
- M. Cheng, C. Qian, Y. Ding, Y. Chen, T. Xiao, X. Lu, J. Jiang and L. Wang, ACS Mater. Lett., 2020, 2, 425–429 CrossRef CAS.
- J. R. Moffat and D. K. Smith, Chem. Commun., 2008, 2248–2250, 10.1039/B801913D.
- M. Legros, P. Cardinael, V. Dulong, L. Picton and D. Le Cerf, Polym. J., 2008, 40, 233–240 CrossRef CAS.
- B. Roy, P. Bairi and A. K. Nandi, Soft Matter, 2012, 8, 2366–2369 RSC.
- M. P. Conte, N. Singh, I. R. Sasselli, B. Escuder and R. V. Ulijn, Chem. Commun., 2016, 52, 13889–13892 RSC.
- W. Weng and F. A. Ferrone, Biophys. Chem., 2011, 154, 99–101 CrossRef CAS PubMed.
- Y. Wang, R. M. de Kruijff, M. Lovrak, X. Guo, R. Eelkema and J. H. van Esch, Angew. Chem., Int. Ed., 2019, 58, 3800–3803 CrossRef CAS PubMed.
- Y. Wang, T. K. Piskorz, M. Lovrak, E. Mendes, X. Guo, R. Eelkema and J. H. van Esch, Adv. Sci., 2019, 1902487, DOI:10.1002/advs.201902487.
- M. E. Belowich and J. F. Stoddart, Chem. Soc. Rev., 2012, 41, 2003–2024 RSC.
- T. Jiao, G. Wu, Y. Zhang, L. Shen, Y. Lei, C.-Y. Wang, A. C. Fahrenbach and H. Li, Angew. Chem., Int. Ed., 2020, 59, 2–20 CrossRef.
- T. Curtius and A. Bertho, J. Prakt. Chem., 1930, 125, 23–39 CrossRef CAS.
- S. Derinkuyu, K. Ertekin, O. Oter and Y. Ergun, Spectrosc. Lett., 2010, 43, 500–512 CrossRef CAS.
- S. Panja and D. J. Adams, Chem. – Eur. J., 2020, 26, 6130–6135 CrossRef CAS PubMed.
- Y. Zhong, P. Li, J. Hao and X. Wang, ACS Appl. Mater. Interfaces, 2020, 12, 6471–6478 CrossRef CAS PubMed.
- J. Wang, S. Yang and K. Zhang, J. Pharm. Biomed. Anal., 2016, 126, 141–147 CrossRef CAS PubMed.
- Y. Wang, G. Zhang, M. Gao, Y. Cai, C. Zhan, Z. Zhao, D. Zhang and B. Z. Tang, Faraday Discuss., 2017, 196, 9–30 RSC.
- X. Ma, R. Sun, J. Cheng, J. Liu, F. Gou, H. Xiang and X. Zhou, J. Chem. Educ., 2016, 93, 345–350 CrossRef CAS.
- G. Hu, J. A. Pojman, S. K. Scott, M. M. Wrobel and A. F. Taylor, J. Phys. Chem. B, 2010, 114, 14059–14063 CrossRef CAS PubMed.
- T. Bánsági and A. F. Taylor, J. Phys. Chem. B, 2014, 118, 6092–6097 CrossRef PubMed.
- I. N. Bubanja, T. Bánsági and A. F. Taylor, React. Kinet., Mech. Catal., 2018, 123, 177–185 CrossRef CAS.
- T. Heuser, E. Weyandt and A. Walther, Angew. Chem., Int. Ed., 2015, 54, 13258–13262 CrossRef CAS PubMed.
- L. Heinen, T. Heuser, A. Steinschulte and A. Walther, Nano Lett., 2017, 17, 4989–4995 CrossRef CAS PubMed.
- H. Che, B. C. Buddingh’ and J. C. M. van Hest, Angew. Chem., Int. Ed., 2017, 56, 12581–12585 CrossRef CAS PubMed.
- H. Che, S. Cao and J. C. M. van Hest, J. Am. Chem. Soc., 2018, 140, 5356–5359 CrossRef CAS PubMed.
- O. R. Maguire, A. S. Y. Wong, M. G. Baltussen, P. van Duppen, A. A. Pogodaev and W. T. S. Huck, Chem. – Eur. J., 2020, 26, 1676–1682 CrossRef CAS PubMed.
- X. Hao, K. Yang, H. Wang, F. Peng and H. Yang, Angew. Chem., Int. Ed., 2020, 59, 4314–4319 CrossRef CAS PubMed.
- S. Panja and D. J. Adams, Chem. Commun., 2019, 55, 47–50 RSC.
- E. Jee, T. Bánsági Jr., A. F. Taylor and J. A. Pojman, Angew. Chem., Int. Ed., 2016, 55, 2127–2131 CrossRef CAS PubMed.
- H. E. Cingil, N. C. H. Meertens and I. K. Voets, Small, 2018, 14, 1870210 CrossRef.
- C.-M. Chang, G. R. D. Prabhu, C.-M. Tseng and P. L. Urban, Anal. Chem., 2019, 91, 8814–8819 CrossRef CAS PubMed.
- S. Panja and D. J. Adams, Chem. Commun., 2019, 55, 10154–10157 RSC.
Footnotes |
| † Electronic supplementary information (ESI) available. See DOI: 10.1039/d0nr03012k |
| ‡ These authors share equal authorship. |
| This journal is © The Royal Society of Chemistry 2020 |