 Open Access Article
Tip dependence of three-dimensional scanning force microscopy images of calcite–water interfaces investigated by simulation and experiments†
Keisuke
Miyazawa
 ab,
John
Tracey
c,
Bernhard
Reischl
 de,
Peter
Spijker
 c,
Adam S.
Foster
 bc,
Andrew L.
Rohl
 f and
Takeshi
Fukuma
 *ab
*ab
aFaculty of Frontier Engineering, Kanazawa University, Kakuma-machi, Kanazawa 920-1192, Japan. E-mail: fukuma@staff.kanazawa-u.ac.jp
bNano Life Science Institute (WPI-NanoLSI), Kanazawa University, Kakuma-machi, Kanazawa 920-1192, Japan
cDepartment of Applied Physics, Aalto University, Helsinki FI-00076, Finland. E-mail: adam.foster@aalto.fi
dInstitute for Atmospheric and Earth System Research/Physics, Faculty of Science, University of Helsinki, PO Box 64, FI-00014, Finland
eCurtin Institute for Computation, Curtin University, P.O. Box U1987, Perth, Western Australia 6845, Australia
fCurtin Institute for Computation and School of Electrical Engineering, Computing and Mathematical Sciences, Curtin University, P.O. Box U1987, Perth, Western Australia 6845, Australia
First published on 10th June 2020
Abstract
In this study, we have investigated the influence of the tip on the three-dimensional scanning force microscopy (3D-SFM) images of calcite–water interfaces by experiments and simulations. We calculated 3D force images by simulations with the solvent tip approximation (STA), Ca, CO3 and OH tip models. For all the 3D images, the z profiles at the surface Ca and CO3 sites alternately show oscillatory peaks corresponding to the hydration layers. However, the peak heights and spacings become larger when the mechanical stability of the tip becomes higher. For analyzing the xy slices of the 3D force images, we developed the extended STA (E-STA) model which allowed us to reveal the strong correlation between the hydration structure just under the tip and the atomic-scale force contrasts. Based on these understandings on the image features showing the strong tip dependence, we developed a method for objectively estimating the similarity between 3D force images. With this method, we compared the simulated images with the three experimentally obtained ones. Among them, two images showed a relatively high similarity with the image obtained by the simulation with the Ca or the CO3 tip model. Based on these agreements, we characterized the hydration structure and mechanical stability of the experimentally used tips. The understanding and methodology presented here should help us to derive accurate information on the tip and the interfacial structure from experimentally obtained 3D-SFM images.
1. Introduction
Hydration plays important roles in various solid–liquid interfacial phenomena, including crystal growth,1 electrochemical reactions2 and biomoleculer interactions.3–5 Thus, there have been strong demands for techniques to analyze local water density distributions, ρ (i.e. hydration structures). The major techniques used for such analyses include X-ray6 or neutron7 beam spectroscopy, and force spectroscopy using surface force apparatus (SFA)8 or colloidal probe atomic force microscopy (AFM).9 Although these methods have a subnanometer-scale vertical resolution, their lateral resolution is over a few tens of nanometers. This resolution is often insufficient for analyzing the three-dimensional (3D) hydration structures having subnanometer-scale inhomogeneity both in the vertical and lateral directions.Recently, an AFM-based technique was proposed to solve this problem.10,11 In the method, an AFM tip is scanned in the lateral and vertical directions at a solid–liquid interface, and the force applied to the tip, F, is recorded to produce a 3D F image with subnanometer resolution. Among the 3D scanning methods proposed so far, the one using a sine wave for modulating the vertical tip position is referred to as 3D scanning force microscopy (3D-SFM) and widely used for various applications due to its simple implementation and fast scanning speed.10,12,13 Previous studies revealed that the 3D F images obtained at the interfaces between an inorganic crystal (e.g., mica, calcite and fluorite) and water show similar contrasts to those of the simulated ρ image.13–17 Based on such agreements, applications of the 3D-SFM to studies on the hydration structures are now intensively explored.
One of the most serious problems in such applications is the tip dependence. In general, atomic-scale contrasts in AFM images depend on the tip apex structures and properties, making it difficult to quantitatively or reliably understand the true inter-facial structures. One of the possible solutions to this problem is to compare the AFM images obtained by experiments and simulations with different tips. Based on the image similarity, we can determine the most plausible tip–sample model and understand the imaging mechanisms as well as the true interfacial structures. However, such studies have not been reported for the 3D-SFM measurements in liquid.
So far, methods to simulate a 3D F image have been established by several research groups and used for reproducing the experimentally obtained 3D-SFM images.18,19 For example, Fukuma et al. compared the 3D F images of the calcite–water interface obtained by experiments and molecular dynamics (MD) simulation and found that the alternating force peaks on the Ca2+ and CO32− sites are commonly observed.14 Based on this agreement, they discussed the imaging mechanism to produce such subnanometer-scale force contrasts. Martin-Jimenez et al. compared the 3D F images of the mica–water interface obtained by experiments and density functional theory (DFT) calculation and showed that unexpectedly thick interfacial structures are commonly observed.13 Based on this agreement, they discussed the possible mechanism to form ion-water complexes in a relatively dense ionic solution. In these previous studies, the comparison between experiments and simulation was focused on the major contrast features that are commonly observed in the multiple experiments. However, the experimentally observed force images generally show variations due to the difference in the tip apex structures. So far, such variations and their mechanisms have not been investigated in detail by comparing the results obtained by experiments and simulation.
The (10![[1 with combining macron]](https://www.rsc.org/images/entities/char_0031_0304.gif) 4) surface of calcite (CaCO3) has been widely used as a model for investigating the imaging mechanism of atomic-scale AFM measurements in aqueous environments. This is because an atomically clean and flat calcite (10
4) surface of calcite (CaCO3) has been widely used as a model for investigating the imaging mechanism of atomic-scale AFM measurements in aqueous environments. This is because an atomically clean and flat calcite (10![[1 with combining macron]](https://www.rsc.org/images/entities/char_0031_0304.gif) 4) surface can be easily prepared by cleavage. In addition, calcite is sparingly soluble in water and hence the surface is periodically renewed by the dissolution, which automatically keeps the surface in an atomically clean condition. Furthermore, the crystal growth and dissolution of calcite in water have been intensively studied due to their importance in environmental science, optics and biomineralization.20–22
4) surface can be easily prepared by cleavage. In addition, calcite is sparingly soluble in water and hence the surface is periodically renewed by the dissolution, which automatically keeps the surface in an atomically clean condition. Furthermore, the crystal growth and dissolution of calcite in water have been intensively studied due to their importance in environmental science, optics and biomineralization.20–22
Previous studies revealed that the two-dimensional AFM (2D-AFM) images of calcite in water show various atomic-scale contrast patterns, including the zig-zag and rectangular ones.23,24 In most cases, they are tentatively ascribed to the variations in the tip apex structure. In the meanwhile, Tracey et al. classified the many experimentally observed contrast patterns into eight categories and showed that such variations can be partly explained by the dependence on the frequency shift (Δf) set point.25 In these previous studies, the 2D-AFM images obtained by the experiments and simulations were compared. However, the 2D-AFM images are influenced by both the tip apex structure and the Δf set point and hence independent discussions on these two mechanisms were difficult. In contrast, the 3D-SFM images are free from the influence of the Δf set point. Thus, the detailed comparison between the 3D-SFM images obtained by experiments and simulations can be an effective solution to the aforementioned problem.
In this study, we obtain 3D F images of the calcite–water interfaces by simulation and experiments, and compare them to understand the influence of the tip on the 3D F images. In the simulation, we calculate 3D F images by simulations with different tip models, including the Ca-terminated calcite tip (Ca tip), CO3-terminated calcite tip (CO3 tip) and OH-terminated silica tip (OH tip). In addition, we calculate 3D F image by the solvent tip approximation (STA) model, where the tip is approximated by a single water molecule.15,26 We analyze the z profiles and xy slices of the simulated 3D F images and discuss their dependence on the hydration structure and mechanical stability of the tip. In the experiments, we obtain 3D F images showing different atomic-scale contrast patterns at the calcite–water interfaces. The xy slices of these images are compared with those obtained by the simulations. For this purpose, we propose a systematic way of estimating the similarity between 3D F images. Based on the estimated similarities, we identify the most plausible tip model that reproduces the individual AFM experiments. From the tip model, we also discuss the possibility to characterize the structure and properties of the experimentally used tip.
2. Methods
2.1. Experimental
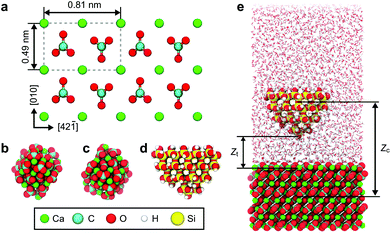
The calcite (10![[1 with combining macron]](https://www.rsc.org/images/entities/char_0031_0304.gif) 4) surface consists of Ca2+ and CO32− ions as shown in Fig. 1a. The lattice constants of this surface are 0.49 nm and 0.81 nm in the [010] and [42
4) surface consists of Ca2+ and CO32− ions as shown in Fig. 1a. The lattice constants of this surface are 0.49 nm and 0.81 nm in the [010] and [42![[1 with combining macron]](https://www.rsc.org/images/entities/char_0031_0304.gif) ] directions, respectively. In the experiments, we used a commercially available calcite crystal (Crystal base, Japan). We fixed a piece of the calcite crystal with a size of 5 × 5 × 2 mm3 on a sample holder by epoxy glue. We cleaved the crystal to present the clean (10
] directions, respectively. In the experiments, we used a commercially available calcite crystal (Crystal base, Japan). We fixed a piece of the calcite crystal with a size of 5 × 5 × 2 mm3 on a sample holder by epoxy glue. We cleaved the crystal to present the clean (10![[1 with combining macron]](https://www.rsc.org/images/entities/char_0031_0304.gif) 4) surface just before the AFM experiments. Immediately after the cleavage, we dropped 50 μL of water onto the sample for the AFM measurements in water.
4) surface just before the AFM experiments. Immediately after the cleavage, we dropped 50 μL of water onto the sample for the AFM measurements in water.
We used a home-built frequency modulation AFM (FM-AFM) with an ultra-low noise cantilever deflection sensor27,28 and a high stability photo-thermal excitation system.29,30 A commercially available phase-locked loop circuit (OC4, SPECS) was used for oscillating a cantilever at its resonance frequency (f0) with a constant amplitude (A) and for detecting Δf induced by the force applied to the tip. The AFM head was controlled with a commercially available AFM controller (ARC2, Asylum Research).
To obtain the 3D F images at the calcite–water interfaces, we used 3D-SFM. In 3D-SFM, the tip is vertically scanned with a fast sinusoidal wave while the tip is slowly scanned in the lateral direction. During the tip scan, Δf was recorded at each tip position to produce a 3D Δf image. The physical and pixel sizes of the original 3D Δf images were 3 × 3 × 1.5 nm3 and 64 × 64 × 256 pix3, respectively. The frequency and amplitude of the z modulation with a sinusoidal wave were 195.3 Hz and 1.5 nmp–p, respectively. The lateral scan speed during the 3D-SFM imaging was 9.16 nm s−1. The individual 3D Δf images were obtained in 53 s. For more details on the principle of 3D-SFM and the processing methods for the obtained data, see Fig. S1 in ESI.†
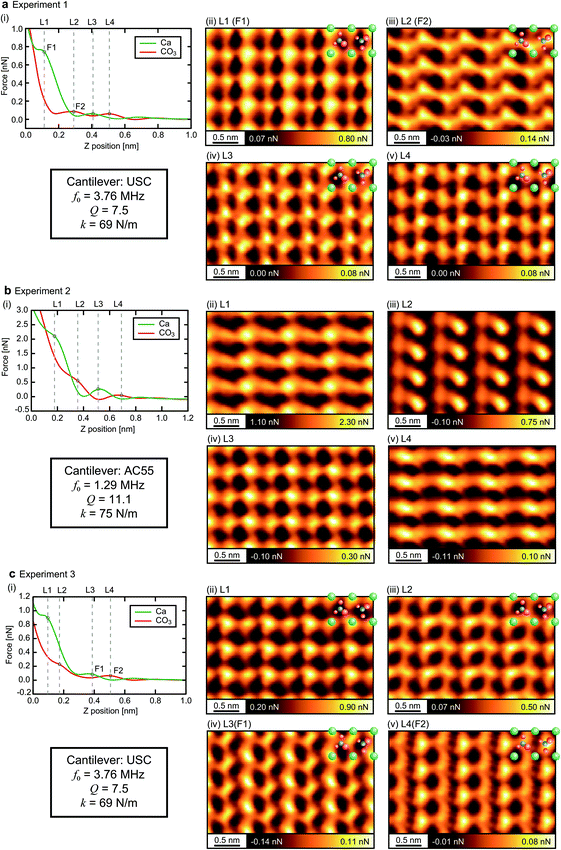
We used commercially available small cantilevers, AC55 (Olympus) and USC-F5-k30 (Nanoworld), with some modifications. For the USC cantilevers, we removed the original tip using a micro-manipulator (Axis Pro 2, Micro Support), attached a silica bead with a diameter of 2 μm at the end of the cantilever by epoxy glue (353ND, Epoxy Technologies), and fabricated an electron beam deposited (EBD) carbon tip with a length of 500 nm on the bead by field emission scanning electron microscopy (FE-SEM) (ERA-8000FE, ELIONIX). In this way, we can make sure that the EBD tip has sufficient mechanical stability required for atomic-resolution imaging.31 In addition, we coated the tip with Si with a thickness of 15 nm using a dc sputter coater (K575XD, Emitech) for both AC55 and USC cantilevers. This coating improves the reproducibility and stability of the atomic-scale AFM measurements in liquid.32 We immersed the cantilever in water deposited on the sample within 30 min after Si coating and performed the AFM measurements.
We applied mechanical drift corrections and a correlation averaging filter to the measured Δf images15 and converted them to 3D F images using Sader's method.33 The cantilever parameters, f0, Q and k were estimated by fitting the equation for a simple harmonic oscillator model to the thermal vibration spectrum of the cantilever measured after the AFM measurements. These cantilever parameters for each experiment are described in Fig. 6.
2.2. Simulation
Fig. 1e shows an example of the simulation models used for calculating the 3D F images measured with various tip models.14,34 The system consists of a slab of calcite, measuring 5 × 8 (10![[1 with combining macron]](https://www.rsc.org/images/entities/char_0031_0304.gif) 4) surface unit cells along x and y directions (approximately 4.0 × 4.0 nm2) and approximately 2.1 nm thickness in the z direction. The mineral slab is fully solvated by water molecules in a rectangular simulation box with 3D periodic boundaries and a box height of approximately 10 nm along z, to accommodate models of the AFM tip apex and to ensure a bulk-like region of water between periodic images of the system. Atomistic interactions between calcite surface, tip models and SPC/Fw water35 are described by the force fields developed by Raiteri et al.1,34,36
4) surface unit cells along x and y directions (approximately 4.0 × 4.0 nm2) and approximately 2.1 nm thickness in the z direction. The mineral slab is fully solvated by water molecules in a rectangular simulation box with 3D periodic boundaries and a box height of approximately 10 nm along z, to accommodate models of the AFM tip apex and to ensure a bulk-like region of water between periodic images of the system. Atomistic interactions between calcite surface, tip models and SPC/Fw water35 are described by the force fields developed by Raiteri et al.1,34,36
In the MD simulation of ρ and the STA calculation, we calculate the 3D ρ distribution at the calcite(10![[1 with combining macron]](https://www.rsc.org/images/entities/char_0031_0304.gif) 4)–water interface, in the absence of an AFM tip. We applied a correlation averaging filter to the ρ distributions, and obtained averaged 3D ρ distributions on the calcite surface unit cell. The averaged 3D ρ image was laterally expanded to 4 × 4 unit cells, a 2D Gaussian filter was applied to each xy slice of the 3D ρ image, and the 3D ρ image was then converted into a 3D F image using the STA model.
4)–water interface, in the absence of an AFM tip. We applied a correlation averaging filter to the ρ distributions, and obtained averaged 3D ρ distributions on the calcite surface unit cell. The averaged 3D ρ image was laterally expanded to 4 × 4 unit cells, a 2D Gaussian filter was applied to each xy slice of the 3D ρ image, and the 3D ρ image was then converted into a 3D F image using the STA model.
In the MD simulation of the 3D F images, we used umbrella sampling to obtain free energy profiles as a function of the tip–surface distance at different xy positions.19 We considered different nanocluster tip models, including a Ca2+ or CO32− terminated calcite tip and a silica tip terminated in a single silanol group, in the following referred to as Ca, CO3 and OH tips, respectively (Fig. 1b–d). Free energy profiles were calculated as a function of the z tip position (zt) over 8 × 4 equally spaced grid points over the calcite (10![[1 with combining macron]](https://www.rsc.org/images/entities/char_0031_0304.gif) 4) surface unit cell as described in ref. 14 and 37. We calculated the 3D F image for each tip model by differentiating the free energy profiles in the z direction at each xy position and expanded the resulting image to 4 × 4 unit cells.
4) surface unit cell as described in ref. 14 and 37. We calculated the 3D F image for each tip model by differentiating the free energy profiles in the z direction at each xy position and expanded the resulting image to 4 × 4 unit cells.
3. Results and discussion
3.1. Tip dependence of force curves
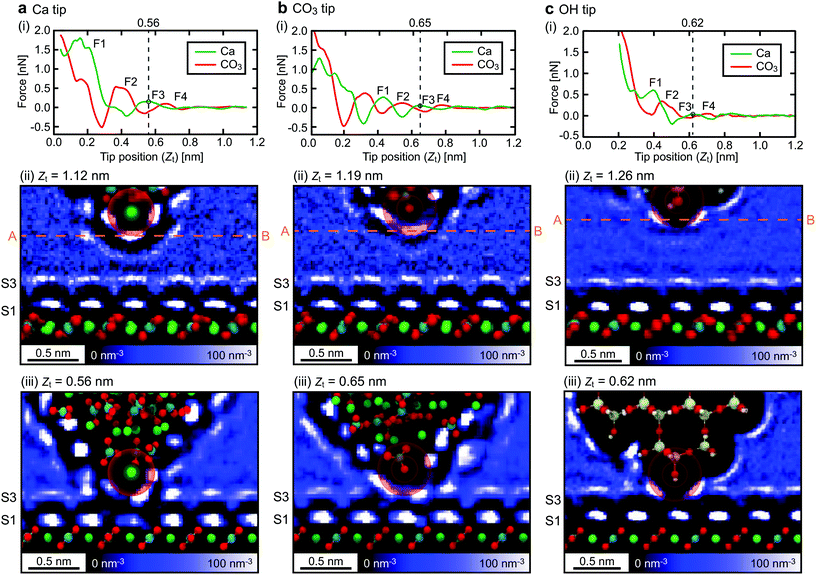
Fig. 2(i) shows the z force profiles extracted from the simulated 3D F images. For all the tip models, the force profiles at the surface Ca and CO3 sites alternately show peaks. This is consistent with our previous report, where we discussed the imaging mechanism of such alternating peaks.14 During the tip approach to the surface, the tip apex interacts with individual hydration layers, which induces repulsive peaks in the force curves. Here, we define these force peaks corresponding to S1–S4 as F1–F4.
Ideally, we could assume the force peak closest to the sample surface as F1. However, this is not always true as similar force peaks can appear if the atomic-scale structure of the tip or the sample surface changes during the tip approach. Thus, the identification of the F1–F4 positions in a force curve is not trivial even for the simulation data. For accurate determination of the F1–F4 positions, we carefully investigated the correlation between zt and the ρ distribution around the tip.
Fig. 2(ii) and (iii) show z slices of the 3D ρ images simulated with the z tip positions far from the sample surface and just before the penetration of S3, respectively. These z slices were obtained along the row of the surface Ca sites in the [42![[1 with combining macron]](https://www.rsc.org/images/entities/char_0031_0304.gif) ] direction (see Fig. 1a), and averaged over 0.2 nm in the [010] direction. In these figures, the smaller circles overlaid on the tip apex atom indicate the ionic radius of the tip apex atom while the larger circles indicate the sum of the ionic radii of the tip apex ion and water oxygen. The latter represents the direct interaction range between the tip apex atom and the surrounding water molecules. For example, in Fig. 2a(iii), the larger circle directly overlaps with S3, which indicates that the tip is about to penetrate S3 at zt = 0.56 nm. In fact, in Fig. 2a(i), a force peak is observed at the same zt and hence we can identify this peak as F3. Once the F3 position is determined, the F2–F4 positions can be easily determined. In this way, we determined the F1–F4 positions as shown in Fig. 2(i).
] direction (see Fig. 1a), and averaged over 0.2 nm in the [010] direction. In these figures, the smaller circles overlaid on the tip apex atom indicate the ionic radius of the tip apex atom while the larger circles indicate the sum of the ionic radii of the tip apex ion and water oxygen. The latter represents the direct interaction range between the tip apex atom and the surrounding water molecules. For example, in Fig. 2a(iii), the larger circle directly overlaps with S3, which indicates that the tip is about to penetrate S3 at zt = 0.56 nm. In fact, in Fig. 2a(i), a force peak is observed at the same zt and hence we can identify this peak as F3. Once the F3 position is determined, the F2–F4 positions can be easily determined. In this way, we determined the F1–F4 positions as shown in Fig. 2(i).
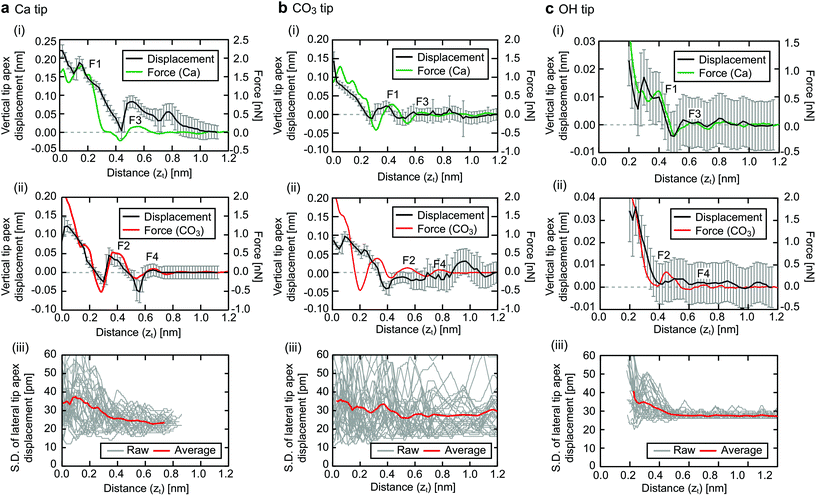
The Ca tip shows larger force peaks and Δz than the other tips. This result suggests that the Ca tip is less flexible in the lateral direction so that it is not laterally displaced until the vertical force reaches a relatively large value. Accordingly, the spacing between F1 and F3 for the Ca tip (∼0.3 nm) is larger than that for the other tip models (∼0.2 nm). On the contrary, the CO3 tip is more flexible in the lateral direction and hence it is laterally displaced before the vertical force reaches a large value. Furthermore, the OH tip shows even smaller force peaks and Δz than the CO3 tip. This is because the OH group has a very high lateral flexibility. Indeed, it exhibits rotational fluctuation in the xy plane without any tip–sample interaction.
To confirm the validity of the above arguments, we plotted the lateral fluctuation  of the tip apex as shown in Fig. 3(iii). Here, Δx and Δy denote the standard deviations of the tip x and y positions, respectively. The gray curves show raw data obtained at each xy position within a unit cell while the red curve shows their average. In the zt range far from the surface (zt > 0.4 nm), Dxy and the variations of the gray curves show significant dependence on the tip model. In this zt range, the Ca tip shows a smaller Dxy than the other two tips. This result confirms our expectation that the Ca tip is less flexible in the lateral direction than the others.
From the variations of the gray curves, we can estimate the uniformity of the lateral fluctuations. The CO3 tip shows a relatively large variation, which highlights the stochastic nature of the lateral fluctuations of the CO3 ion. On the contrary, the OH tip presents a relatively small variation, which reflects the well-defined nature of the rotational fluctuation of the OH group. In the zt range near the surface (zt < 0.4 nm), the tip dependence becomes less evident. This is because the strong tip–sample interaction near the sample surface typically induces a tip deformation and the lateral stability of the tip after such a deformation becomes less dependent on the initial tip structure.
Overall, the results obtained by the analyses of the vertical displacement and the lateral fluctuation consistently suggest that the tip-dependent variation of the force profiles can be largely explained by the difference in the mechanical properties of the tip apex. Namely, the Ca tip shows larger force peaks and vertical displacements during the tip approach due to the higher lateral stability than the CO3 and OH tips.
3.2. Tip dependence of xy slices
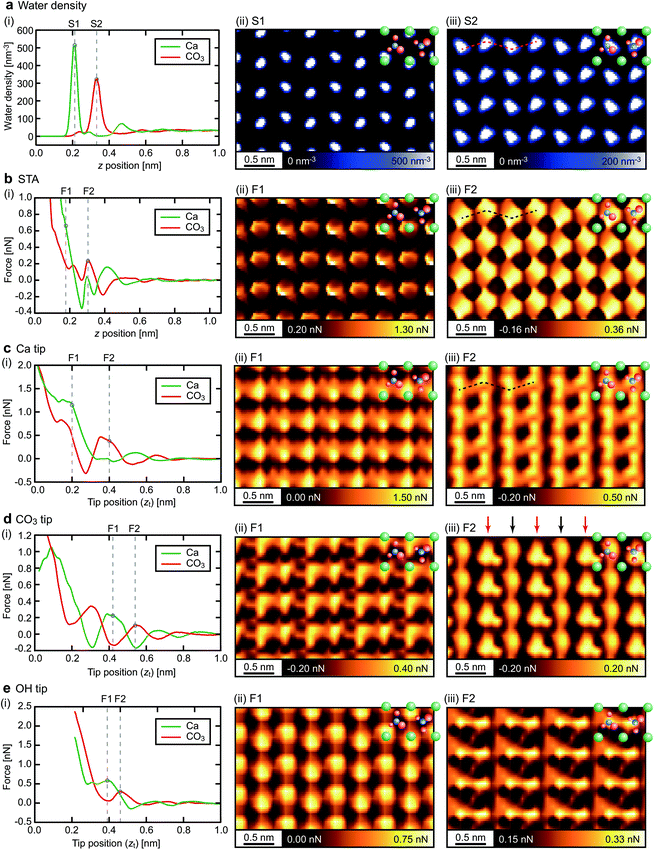
To understand the influence of the tip on the lateral contrast patterns, here we analyze the xy slices derived from the 3D ρ and F images obtained by the simulation. Fig. 4(i) shows averaged z profiles of ρ and F on the Ca and CO3 sites. These profiles were obtained by averaging the z profiles within a 0.1 nm × 0.1 nm square area at the center of the two non-equivalent Ca or CO3 sites. In these figures, we indicated the zt positions corresponding to S1 and S2 or F1 and F2 by the dotted lines. At these positions, we derived the xy slices as shown in Fig. 4(ii) and (iii).For all the simulation results, the bright spots observed in the S1 and F1 slices are located on the Ca site while those in the S2 and F2 slices are located on the CO3 sites. This is the common feature for all the tip models and consistent with the alternating force peaks observed in the z profiles. However, the contrast patterns of the F images show strong dependence on the tip especially for the F2 slices.
Previous studies suggest that the atomic-scale features in a force curve are largely determined by the interactions between the hydration shells formed on the tip and the sample.15 Based on this idea, we have investigated the correlation between the hydration structures under the tip and the F2 slices. Fig. 5(i) shows the xy slices of the hydration structures under the tip taken at the z positions indicated by the dotted lines in Fig. 2(ii) (electronic data is available online as ESI†). Fig. 5(ii) shows the ρ profiles taken along the dotted lines in Fig. 5(i). These results reveal the strong dependence of the hydration structures on the tip models.
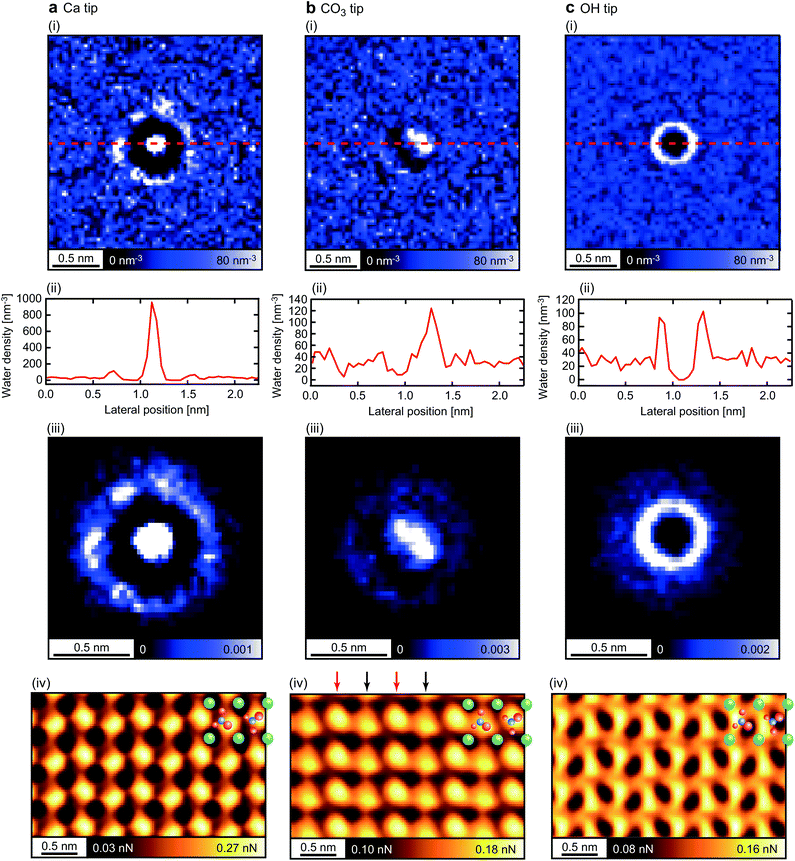 | ||
| Fig. 5 Analysis of hydration structures just under the tip for the (a) Ca, (b) CO3 and (c) OH tips. (i) xy slices of the ρ distribution taken at the z position indicated by the dotted line A–B in Fig. 2(ii). (ii) ρ profiles taken along the dotted lines shown in (i). (iii) Filter masks used for the force conversion by the E-STA model. These masks were obtained by extracting the central 1.4 nm × 1.4 nm area of the ρ images shown in (i), and dividing the ρ values of the images by their integral over the extracted area. (iv) F2 slices of the 3D F images obtained by the E-STA model with the filter masks shown in (iii). | ||
To investigate the influence of such variations in the hydration structure on the F contrasts, here we introduce the extended STA (E-STA) model for the ρ-to-F conversion. In the force conversion by the standard STA model, a ρ image calculated by the MD simulation is converted to an F image after a Gaussian filtering with a standard deviation corresponding to the size of a water molecule. This process assumes that the tip has a perfectly symmetrical hydration peak under the tip with a size of a single water molecule. In contrast, in the E-STA model, the ρ image is filtered by the mask generated by the normalized xy slice of the hydration structure under the tip (Fig. 5(iii)) before the conversion to an F image. In this way, we can take into account the influence of the tip in the force conversion process.
Fig. 5(iv) shows the F2 images obtained by the E-STA model. The F2 image obtained by the Ca tip is similar to the one obtained by the standard STA model (Fig. 4b(iii)) and the hydration structure (Fig. 4a(iii)). This is reasonable because the Ca tip has a single hydration peak with an almost perfect symmetry as assumed in the standard STA model. Although the agreement with the MD simulation image (Fig. 4c(iii)) is not perfect, at least the zigzag arrangement of the bright spots over the surface CO3 sites are commonly observed as indicated by the dotted lines.
In the F2 image obtained by the CO3 tip, adjacent molecular rows alternately show different contrasts as indicated by the arrows. This difference comes from the different interactions of the asymmetric tip with the two non-equivalent surface CO3 ions having opposite orientations. This characteristic feature is also confirmed in the F2 image obtained by the MD simulation (Fig. 4d(iii)). These results demonstrate that the influence of the asymmetric hydration structure of the tip is well taken into account in the E-STA model.
The F2 image obtained by the OH tip shows a mesh-like structure, which is significantly different from the MD simulation image. The analysis of the MD simulation model shows that the OH group rotates in the xy plane to present ring-shaped hydration structure (Fig. 5c(i)). This rotation is gradually quenched as the tip approaches the surface. In the E-STA model, the tip hydration structure at the z position far from the surface is used for the force conversion. Thus, it is not applicable for a tip model that exhibits significant changes during the tip approach. For such a tip terminated with a mobile OH group, it may be better to consider the tip apex OH group as a part of the tip hydration structure. In that case, we should calculate the filter mask in the E-STA model from the density distribution of water and hydroxyl oxygen atoms in the plane of the apex OH group oxygen atom. As discussed here, we may explore different ways to calculate the filter mask to improve the applicability of the E-STA model.
In the above discussion, we derived the F image from the hydration structures of the tip and the sample surfaces by the E-STA model. By extending this idea, one may think that the tip hydration structure may be derived from an experimentally obtained F image and a simulated sample hydration structure. This could be a powerful technique to characterize the tip apex property using a calcite surface as a template. However, this conversion is practically very difficult to perform by extending the STA model.
This is because the F-to-ρ conversion by the STA model is much more inaccurate than the ρ-to-F conversion. To derive a tip hydration structure from a 3D-SFM image, we should convert a Δf image to an F image by an integration with respect to z. In addition, we should further integrate the obtained F image and then take an exponential function of it to obtain a ρ image. Thus, even a small Δf offset in a measurement can result in a huge error in the ρ image. Furthermore, we should derive the tip hydration structure from the obtained ρ image by deconvolution. This is much more difficult than implementing the influence of the tip hydration structure in a convolution filter as we did in the E-STA model. Therefore, it would be more reasonable to use either a more sophisticated tip approximation model or a machine learning approach than extending the STA model.
3.3. Comparison between simulation and experiments
We have experimentally obtained many 3D F images of the calcite–water interface. These images show various atomic-scale contrast patterns due to the tip variations. Among them, we selected three distinctively different ones (Exp. 1–3). Fig. 6 shows the z profiles and xy slices derived from these three images.For the experimentally obtained images, it is not straightforward to determine the xy positions of the Ca and CO3 sites, and the z positions of the individual hydration layers. In this study, we have determined them by the following procedure.
The xy slices of the 3D F images show clear atomic-scale contrasts at several descrete z positions. At these positions, the xy slices show periodically arranged bright spots at two different sets of the xy positions. These two sets of the positions should correspond to the surface Ca and CO3 sites. At the center of the two different sites, we derived z profiles with an averaging area of 0.1 nm × 0.1 nm (Fig. 6(i)). The z profiles taken at the two different sites alternately show peaks or shoulders. At these z positions, we derived the xy slices L1–L4 (Fig. 6(ii)–(v)).
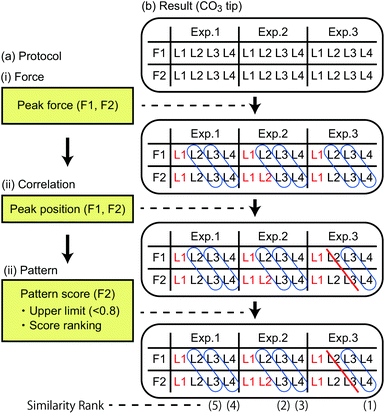
The F1 and F2 layers are likely to be one of the L1–L4 layers, yet this assignment is not trivial. To make this assignment, we compare the results obtained by the experiments and simulations in respect to the following features: the force magnitude, correlation with the adjacent layer, and contrast pattern. Fig. 7 illustrates an example of the assignment process for the case of the CO3 tip. Hereafter, we explain each step of the process based on this example.
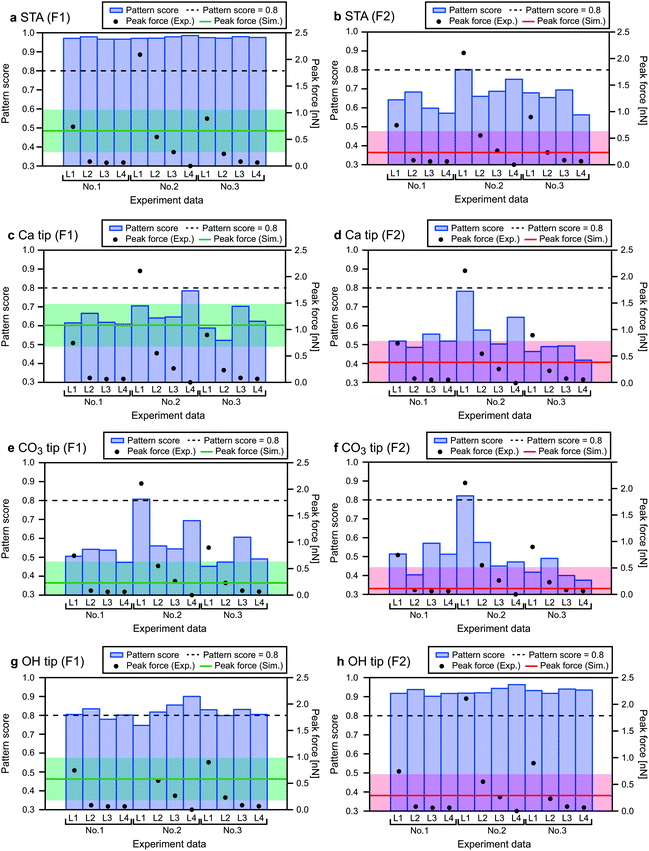
In the first step, we eliminate the 3D images whose F1 or F2 value is out of the range of ±0.4 nN from the simulated value. This threshold value was empirically determined for this particular measurement system. In Fig. 8, we indicated the F1 and F2 values obtained by the simulations (solid lines) and experiments (black dots), and the aforementioned acceptable range (semitransparent color) for all the tip models and the experimental data sets. For the CO3 tip model, the seven layers indicated by the red text in Fig. 7b are eliminated. Thus, there remain six pairs of the xy slices as indicated by the blue circles in Fig. 7b.
In the second step, we eliminate the pairs that do not satisfy the following condition: force peaks in the two xy slices are located at the alternate xy positions corresponding to the surface Ca and CO3 sites. For the CO3 tip model, Exp3[L2–3] (L2 and L3 for Exp. 3) is eliminated as indicated by the red line in Fig. 7b.
In the final step, we use the Fourier Transform (FT) method that we previously proposed for quantitative estimation of the similarity between two 2D images.25 The detailed explanation of this method is described in ESI.†
Fig. 8 shows the estimated similarity scores for each combination of the xy slices obtained by the simulations and experiments. These scores, ranging from 0 to 1, show a lower value for a better similarity. Based on these scores, we can determine the similarity rank without influence from any personal preferences. At this stage, we excluded the images with a similarity score higher than 0.8 to take into account the possibility that some of the simulated images may not be realistic and cannot find a similar experimentally obtained image. This threshold value, which is indicated by the dotted lines in Fig. 8, was determined such that we can reasonably eliminate the images that are too dissimilar to the simulated ones. For Fig. 8, the scores shown in Fig. 8a and h are much worse than the others. As a threshold value to separate these two groups, we found that 0.8 is reasonable. Furthermore, we also calculated pattern scores for the simulated F1 and F2 slices and confirmed that this threshold value can reasonably separate the two groups having different score ranges (Fig. S4 in ESI†). Note that we used only the F2 slices as they show much more distinctive differences among the simulated images than the F1 slices. For the CO3 tip model, the similarity ranks from the first to the fifth were determined as shown in Fig. 7b.
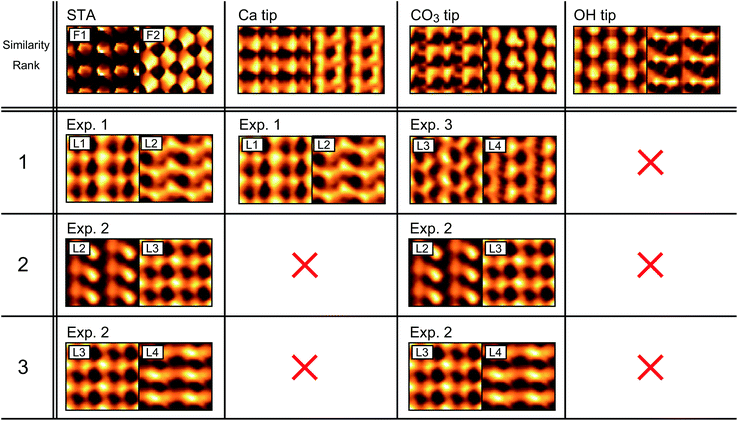
In the same way, we determined the similarity ranks for all the tip models and listed the top three image pairs in Fig. 9. For the STA model, the first step (force check) leaves Exp1[L1–2], Exp2[L2–3], Exp2[L3–4] and Exp3[L1–2]. Among them, Exp3[L1–2] was eliminated by the second step (correlation check). In the final step (pattern check), the top three pairs were determined as listed in Fig. 9. Note that the similarity scores for the F1 slice are exceptionally high (>0.95) for all the experimentally obtained images (Fig. 8a). This is not surprising because the STA model is valid only at the z tip position above the first hydration layer, and hence the contrasts in the F1 slice may not be accurate. For the Ca tip model, the first step leaves Exp1[L1–2] and Exp3[L1–2], and the second step eliminates Exp3[L1–2]. Thus, only Exp1[L1–2] remains as a candidate. For the OH tip model, the F2 pattern scores are all above 0.8 and hence no candidate is left.
3.4. Characterization of experimentally used tip
As summarized in Fig. 9, we have identified the most plausible tip models that can reproduce the force contrasts observed in Exp. 1 and 3. From this result, we can obtain insights into the properties of the experimentally used tips.For both the STA and Ca tip models, Exp1[L1–2] shows the best similarity. The L1 and L2 images show the rectangular and zigzag contrast patterns, respectively. These features are also seen in the simulated F1 and F2 images. This result suggests that the tip used in Exp. 1 should have similar properties to those of the Ca tip. Namely, it should have a relatively symmetric hydration structure (Fig. 5a(i)) and high mechanical stability (Fig. 3a). This is also consistent with the properties expected for the ideal water tip assumed in the STA model.
For the CO3 tip, Exp3[L3–4] shows the best similarity. The L3 and L4 images show different contrasts for non-equivalent Ca and CO3 sites, respectively. This can be explained by the asymmetric hydration structure under the CO3 tip (Fig. 5b(i)). These results suggest that the tip used in Exp. 3 has a relatively asymmetric hydration structure and low mechanical stability (Fig. 3b).
For the OH tip, we were not able to find any experimentally obtained image pairs showing a high similarity. This result suggests that such a tip may not often appear in an actual experiment. However, the number of images used for this comparison was very limited and hence more experimental data should be required for making a convincing argument on this point.
For Exp. 2, we were not able to find any corresponding tip models. However, from the discussions on the Ca and CO3 tip models, we can make a reasonable guess. The L1–4 show different contrasts for the non-equivalent Ca and CO3 sites, which suggests that the tip should have an asymmetric hydration structure. In addition, the z profiles show relatively large force peaks, which suggests that the tip should have relatively high mechanical stability. Indeed, in this study, we did not use such a tip model, which may explain why we were not able to find the corresponding tip model for Exp. 2.
4. Conclusions
In this study, we have performed detailed comparison between the several 3D F images obtained by the experiments and simulations with different tip models. By detailed analysis of the simulated 3D F images, we obtained important findings on the relationship between the tip properties and the force contrasts. In addition, we discussed possible applications of these findings to the tip characterization based on the experimentally obtained 3D images.We obtained 3D F images by the simulations with the STA, Ca, CO3 and OH tip models. From the images, we extracted the z profiles at the surface Ca and CO3 sites and investigated their tip dependence. The results show that the tip with a high mechanical stability provides a high force peak and a large vertical tip deformation. In this case, the identification of the F1 peak position is relatively straightforward yet the peak spacings become wider than expected from the hydration structure. In contrast, a tip with a low mechanical stability provides peak spacings similar to those expected from the hydration structure. In this case, the identification of the F1 peak position is practically difficult because a few additional peaks appear even below that (Fig. 4d).
We also investigated the tip dependence of the xy slices extracted from the simulated 3D F images. For this analysis, we developed the E-STA model, where the tip hydration structure is taken into account for the ρ-to-F conversion. This analysis reveals the strong correlation between the hydration structure just under the tip and the force contrast patterns. In particular, the non-equivalent Ca and CO3 sites are imaged with different contrasts when the tip has an asymmetric hydration structure.
We selected the three experimentally obtained 3D F images showing distinctively different contrasts and compared them with the four simulated images. For this comparison, we proposed a method for objectively estimating the similarity between two 3D F images (Fig. 7), where we analyze the peak force magnitude, correlation with the adjacent hydration layers, and the lateral contrast patterns. By this comparison, we identified the most plausible tip models for the two experimentally obtained images. Such agreements suggest that the tips used in these experiments should have similar properties to the tip models used in the simulation. As discussed above, the force contrasts obtained in liquid are largely determined by the hydration structure just under the tip and the mechanical stability of the tip. Thus, the properties that we can understand by such a comparison are not the structure or the chemical species of the tip itself, but its hydration structure and mechanical stability. This is clearly different from the discussions for the AFM measurements in vacuum, where the image contrasts are largely determined by direct interactions between the tip and sample atoms.
In spite of the limited number of the tip models used for the simulations, we were able to find reasonable agreements with the two experimentally obtained images, which gave us insights into the structure and properties of the experimentally used tip. Therefore, if we can make a large-scale database including more 3D F images simulated with various tip models, we may be able to use the calcite–water interface as a template for characterizing the experimentally used tip. Furthermore, by combining such a database with the E-STA model and a deep learning approach, we may be able to derive the intrinsic hydration structure of an unknown interface from the experimentally obtained 3D F image obtained with the characterized tip. The findings obtained in this study should greatly contribute to the future development of such advanced analysis methods for in-liquid AFM.
Conflicts of interest
There are no conflicts to declare.Acknowledgements
This work was supported by World Premier International Research Center Initiative (WPI), MEXT, Japan; JSPS KAKENHI grant number 16H02111; and JST Mirai-Project (No. 18077272). ASF was supported by the Academy of Finland (project no. 314862). BR was supported by ERC project no. 692891-DAMOCLES and the Australian Research Council Discovery Project DP140101776. Supercomputing resources were provided by the Aalto Science-IT project, the CSC-IT Center for Science, Ltd, Finland, and by the Australian Government and the Government of Western Australia through the Pawsey Supercomputing Centre under the National Computational Merit Allocation Scheme.References
- P. Raiteri and J. D. Gale, J. Am. Chem. Soc., 2010, 132, 17623–17634 CrossRef CAS PubMed.
- G. Dong, P. Teo, Z. K. Wickens and R. H. Grubbs, Science, 2011, 333, 1609–1612 CrossRef CAS PubMed.
- J. Ostmeyer, S. Chakrapani, A. C. Pan, E. Perozo and B. Roux, Nature, 2013, 501, 121–124 CrossRef CAS PubMed.
- D. Krepkiy, M. Mihailescu, J. A. Freites, E. V. Schow, D. L. Worcester, K. Gawrisch, D. J. Tobias, S. H. White and K. J. Swartz, Nature, 2009, 462, 473–479 CrossRef CAS PubMed.
- M. S. Cheung, A. E. García and J. N. Onuchic, Proc. Natl. Acad. Sci. U. S. A., 2002, 99, 685–690 CrossRef CAS PubMed.
- S. Bae, R. Taylor, D. Hernández-Cruz, S. Yoon, D. Kilcoyne and P. J. M. Monteiro, J. Am. Chem. Soc., 2015, 98, 2914–2920 CAS.
- A. Vorobiev, A. Dennison, D. Chernyshov, V. Skrypnychuk, D. Barbero and A. V. Talyzin, Nanoscale, 2014, 6, 12151–12156 RSC.
- S. H. Donaldson, S. Das, M. A. Gebbie, M. Rapp, L. C. Jones, Y. Roiter, P. H. Koenig, Y. Gizaw and J. N. Israelachvili, ACS Nano, 2013, 7, 10094–10104 CrossRef CAS PubMed.
- T. Fukuma, M. J. Higgins and S. P. Jarvis, Biophys. J., 2007, 92, 3603–3609 CrossRef CAS PubMed.
- T. Fukuma, Y. Ueda, S. Yoshioka and H. Asakawa, Phys. Rev. Lett., 2010, 104, 016101 CrossRef PubMed.
- K. Kobayashi, N. Oyabu, K. Kimura, S. Ido, K. Suzuki, T. Imai, K. Tagami, M. Tsukada and H. Yamada, J. Chem. Phys., 2013, 138, 184704 CrossRef PubMed.
- C. Marutschke, D. Walters, J. Cleveland, I. Hermes, R. Bechstein and A. Kühnle, Nanotechnology, 2014, 25, 335703 CrossRef PubMed.
- D. Martin-Jimenez, E. Chacon, P. Tarazona and R. Garcia, Nat. Commun., 2016, 7, 12164 CrossRef CAS PubMed.
- T. Fukuma, B. Reischl, N. Kobayashi, P. Spijker, F. F. Canova, K. Miyazawa and A. S. Foster, Phys. Rev. B: Condens. Matter Mater. Phys., 2015, 92, 155412 CrossRef.
- K. Miyazawa, N. Kobayashi, M. Watkins, A. L. Shluger, K. Amano and T. Fukuma, Nanoscale, 2016, 8, 7334 RSC.
- K. Umeda, L. Zivanovic, K. Kobayashi, J. Ritala, H. Kominami, P. Spijker, A. S. Foster and H. Yamada, Nat. Commun., 2017, 8, 2111 CrossRef PubMed.
- H. Söngen, B. Reischl, K. Miyata, R. Bechstein, P. Raiteri, A. L. Rohl, J. D. Gale, T. Fukuma and A. Kühnle, Phys. Rev. Lett., 2018, 120, 116101 CrossRef PubMed.
- M. Watkins and A. L. Shluger, Phys. Rev. Lett., 2010, 105, 196101 CrossRef PubMed.
- B. Reischl, M. Watkins and A. S. Foster, J. Chem. Theory Comput., 2013, 9, 600–608 CrossRef CAS PubMed.
- M. D. Hoolingsworth, Science, 2009, 326, 1194 CrossRef PubMed.
- Y. Y. Kim, K. Ganesan, P. Yang, A. N. Kulak, S. Borukhin, S. Pechook, L. Ribeiro, R. Kröger, S. J. Eichhorn and S. P. Ames, Nat. Mater., 2011, 10, 890 CrossRef CAS PubMed.
- F. Natalio, T. P. Corrales, M. Panthofer, D. Schollmeyer, I. Lieberwirth, W. E. G. Muller, M. Kappl, H. J. Butt and W. Tremel, Science, 2013, 339, 1298 CrossRef CAS PubMed.
- S. Rode, N. Oyabu, K. Kobayashi, H. Yamada and A. Kühnle, Langmuir, 2009, 25, 2850 CrossRef CAS PubMed.
- H. Imada, K. Kimura and H. Onishi, Langmuir, 2013, 29, 10744–10751 CrossRef CAS PubMed.
- J. Tracey, K. Miyazawa, P. Spijker, K. Miyata, B. Reischl, F. F. Canova, A. L. Rohl, T. Fukuma and A. S. Foster, Nanotechnology, 2016, 27, 415709 CrossRef PubMed.
- M. Watkins and B. Reischl, J. Chem. Phys., 2013, 138, 154703 CrossRef PubMed.
- T. Fukuma, M. Kimura, K. Kobayashi, K. Matsushige and H. Yamada, Rev. Sci. Instrum., 2005, 76, 053704 CrossRef.
- T. Fukuma and S. P. Jarvis, Rev. Sci. Instrum., 2006, 77, 043701 CrossRef.
- T. Fukuma, K. Onishi, N. Kobayashi, A. Matsuki and H. Asakawa, Nanotechnology, 2012, 23, 135706 CrossRef CAS PubMed.
- T. Fukuma, Rev. Sci. Instrum., 2009, 80, 023707 CrossRef PubMed.
- K. Miyazawa, H. Izumi, T. Watanabe-Nakayama, H. Asakawa and T. Fukuma, Nanotechnology, 2015, 26, 105707 CrossRef CAS PubMed.
- S. M. R. Akrami, H. Nakayachi, T. Watanabe-Nakayama, H. Asakawa and T. Fukuma, Nanotechnology, 2014, 25, 455701 CrossRef CAS PubMed.
- J. E. Sader and S. P. Jarvis, Appl. Phys. Lett., 2004, 84, 1801–1803 CrossRef CAS.
- B. Reischl, P. Raiteri, J. D. Gale and A. L. Rohl, J. Phys. Chem. C, 2019, 123, 14985 CrossRef CAS.
- Y. Wu, H. L. Tepper and G. A. Voth, J. Chem. Phys., 2006, 124, 024503 CrossRef PubMed.
- P. Raiteri, R. Demichelis and J. D. Gale, J. Phys. Chem. C, 2015, 119, 24447 CrossRef CAS.
- B. Reischl, P. Raiteri, J. D. Gale and A. L. Rohl, Phys. Rev. Lett., 2016, 117, 226101 CrossRef PubMed.
Footnote |
| † Electronic supplementary information (ESI) available: Detailed explanations on the 3D-SFM measurements and data processing, and calculation of pattern scores; pattern scores calculated for the simulated force images; and electronic data of the water density distribution images just under the tip and their data format. See DOI: 10.1039/D0NR02043E |
| This journal is © The Royal Society of Chemistry 2020 |

