 Open Access Article
Transport of nanoprobes in multicellular spheroids†
Marta
Pilz
 a,
Karina
Kwapiszewska
*a,
Tomasz
Kalwarczyk
 a,
Grzegorz
Bubak
 a,
Dominika
Nowis
bc and
Robert
Hołyst
 *a
*a
aDepartment of Soft Condensed Matter, Institute of Physical Chemistry, Polish Academy of Sciences, Warsaw, Poland. E-mail: kkwapiszewska@ichf.edu.pl; rholyst@ichf.edu.pl
bGenomic Medicine, Medical University, Warsaw, Poland
cLaboratory of Experimental Medicine, Centre of New Technologies, University of Warsaw, Poland
First published on 28th August 2020
Abstract
The efficient delivery of drugs to cells depends on their diffusion through the extracellular matrix (ECM) of tissues. Here we present a study on the diffusion of nanoprobes of radius from 1 nm to over 100 nm in the ECM of spheroids of three cell types (HeLa, MCF-7 and fibroblasts). We quantified the nanoparticle transport in the spheroids’ proliferating zone. We determined the size-dependent viscosity of the ECM. We revealed that nanoobjects up to 10 nm in radius exhibited unobstructed diffusion in the ECM, regardless of the spheroid type. The presented length-scale dependent viscosity profiles for spheroids pave the way for advanced modelling of drug administration through tissues.
Introduction
One of the steps in the anti-cancer drug delivery is the diffusion of a therapeutic agent through the tumour interstitium.1–3 Thus, the penetration of the drug deep into the tumour is impaired by its size. Small molecules, like anthracyclines, can easily penetrate the tumour and that is associated with poor drug retention in the tumour as well as increased whole body toxicity.4,5 Increased size of the diffusing molecules and increased density of the tumour tissue are known to impair the penetrance of the drug. Hence, the relatively large size of novel therapeutics including nanoparticles (such as Abraxane® with a mean particle size of ∼130 nm![[thin space (1/6-em)]](https://www.rsc.org/images/entities/char_2009.gif) 6) or liposomes (such as Myocet® with the size of ∼190 nm
6) or liposomes (such as Myocet® with the size of ∼190 nm![[thin space (1/6-em)]](https://www.rsc.org/images/entities/char_2009.gif) 7) as well as the composition and structure of the tumour extracellular matrix (ECM) restrict the movement of these molecules within the tumour.8
7) as well as the composition and structure of the tumour extracellular matrix (ECM) restrict the movement of these molecules within the tumour.8
The extracellular matrix is a non-cellular component of the tissues. The ECM consists of a wide diversity of molecules, including fibrous-forming proteins (e.g. collagen, elastin and fibronectin), glycoproteins, proteoglycans and glycosaminoglycans.9 These biomolecules form a complex network by binding to each other as well as to the cell adhesion receptors. To describe the motion of nanoprobes in such complex liquids, one can apply the length-scale dependent viscosity model.10,11 It uses the fluctuation–dissipation theorem to calculate the effective viscosity, ηeff experienced by the probe in the extracellular matrix from the measurements of its diffusion coefficient, D:
 | (1) |
The length-scale dependent viscosity model relies on the exponential dependence of the effective viscosity experienced by the particle moving in a complex fluid (eqn (2)).
 | (2) |
Here ηeff is the viscosity experienced by the nanosized probes, η0 is the viscosity of the solvent (i.e. the buffer), A is a constant of the order of 1, ξ is the correlation length – a mean half-distance between the entanglement points in a polymer matrix (dependent on the concentration of crowding agents), Rh is the hydrodynamic radius corresponding to the size of polymer coils creating the environment, and rp is the hydrodynamic radius of the probe. Exponent a is a constant of the order of 1.
In this paper, we use the model expressed by eqn (2) to quantify the motion of biologically inert tracers in the three-dimensional models of cancer as well as non-cancerous cell culture (3D culture). 3D cell cultures are currently considered to be the most accurate in vitro tumour models, especially for the studies of the extracellular matrix.12–16 The extracellular space was probed by using fluorescent nanoprobes ranging in the radius from 1 to over 100 nm, encompassing the size of most therapeutic agents used in cancer treatment. Their motion within the ECM was measured using fluorescence correlation spectroscopy (FCS), as a noninvasive method successfully applied to living biological systems.17 This technique assumes a very small observation volume, Veff (of the order of 1 fl), and the diffusion coefficient, D, is determined from the correlation function obtained from the fluctuations in the fluorescence intensity. Those fluctuations originate from small variations in the number of fluorescent particles in the Veff. Eqn (2) allows for characterising the structure of the ECM providing parameters such as the interfibrillar spacing of the network (ξ), the hydrodynamic radius of the polymer creating the matrix (Rh) and its nanoviscosity and macroviscosity.
Experimental
Cell and spheroid formation
Human adenocarcinoma cell lines, such as HeLa (ATCC, USA), MCF-7 (ATCC, USA) and human skin fibroblasts (Coriell Institute for Medical Research, USA), were used. HeLa was routinely cultured as a monolayer using Dulbecco's modified Eagle's medium, DMEM (Sigma-Aldrich, USA) supplemented with 10% fetal bovine serum, FBS (Gibco™, USA), 1% L-glutamine (Sigma-Aldrich, USA) and 1% penicillin–streptomycin solution (10![[thin space (1/6-em)]](https://www.rsc.org/images/entities/char_2009.gif) 000 units per ml and 10 mg ml−1, respectively, Sigma-Aldrich, USA). MCF-7 cells were routinely cultured as a monolayer using DMEM supplemented with 10% FBS, 1% L-glutamine and 1% penicillin–streptomycin solution supplemented with 1% human insulin solution (Sigma-Aldrich, USA). Fibroblasts were routinely cultured as a monolayer using a 1
000 units per ml and 10 mg ml−1, respectively, Sigma-Aldrich, USA). MCF-7 cells were routinely cultured as a monolayer using DMEM supplemented with 10% FBS, 1% L-glutamine and 1% penicillin–streptomycin solution supplemented with 1% human insulin solution (Sigma-Aldrich, USA). Fibroblasts were routinely cultured as a monolayer using a 1![[thin space (1/6-em)]](https://www.rsc.org/images/entities/char_2009.gif) :
:![[thin space (1/6-em)]](https://www.rsc.org/images/entities/char_2009.gif) 1 mixture of Eagle's minimum essential medium, EMEM (Sigma-Aldrich, USA) and DMEM supplemented with 15% fetal bovine serum, 1% L-glutamine and 1% penicillin–streptomycin solution. All cells were maintained at 37 °C in a 5% CO2 humidified atmosphere. The passages were performed using a 0.25% Trypsin-EDTA solution (Gibco™, USA) and phosphate-buffered saline, PBS (Sigma-Aldrich, USA).
1 mixture of Eagle's minimum essential medium, EMEM (Sigma-Aldrich, USA) and DMEM supplemented with 15% fetal bovine serum, 1% L-glutamine and 1% penicillin–streptomycin solution. All cells were maintained at 37 °C in a 5% CO2 humidified atmosphere. The passages were performed using a 0.25% Trypsin-EDTA solution (Gibco™, USA) and phosphate-buffered saline, PBS (Sigma-Aldrich, USA).
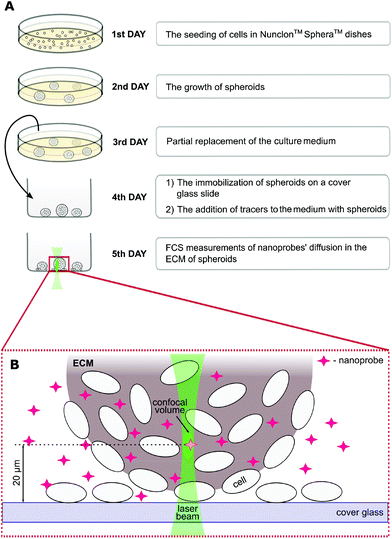
The spheroid formation protocol is schematically shown in Fig. 1. First, the cells (∼2 × 10⁵ ml−1) were cultured in a proper complete cell medium without phenol red using Nunclon™ Sphera™ dishes (Thermo Fisher Scientific, USA) with a surface coating inhibiting cell attachment. On the third day of culture, 50% of the medium was replaced. On the fourth day, spheroids were carefully transferred onto the 8-chamber cover glass Lab-Tek® (ThermoFisher Scientific, USA) slide. The nanoprobes were introduced into the ECM 24 hours before the FCS measurements by adding them to the cell culture medium to a final concentration of ∼100 nM.
Fluorescent tracers
The tracers used for probing the ECM structure were chosen according to their neutral charge, non-toxicity, and inertness to the extracellular and cellular components. The TRITC-labelled dextrans (Sigma-Aldrich, USA) and PEG-coated fluorescent silica nanoparticles filled with rhodamine B (Siliquan, Poland) were used to examine the ECM structure in FCS measurements. Before their use for biological assays, nanoprobes were diluted in PBS to nanomolar concentrations in order to measure the diffusion coefficients in solution.Fluorescence correlation spectroscopy (FCS)
Fluorescence correlation spectroscopy experiments were performed on a dedicated FCS system, based on a Nikon C1 inverted confocal microscope (Nikon Instruments, Japan) with a PlanApo 60×, NA = 1.2 water immersion objective. The setup is equipped with a Pico Harp 300 system (PicoQuant, Germany). The body of the microscope was enclosed in a climate chamber (Okolab, Italy), providing a temperature control at 36.0 ± 0.5 °C and the required humidity. All the tracers were excited using a 561 nm laser, and the fluorescence was detected through a 593/46 bandpass filter (Chroma, USA). Data acquisition was controlled using the SymPhoTime 64 software (PicoQuant, Germany). The experiments were preceded by establishing the dimension of the confocal volume using rhodamine B (Sigma-Aldrich, USA) dissolved in 2.5% glucose in PBS.18 FCS measurements were performed at a depth of 10–30 μm within the spheroids (Fig. 1), in the extracellular space at the distance of 2–10 μm from the cell edges. The detection volume was positioned in the ECM using the imaging mode of the microscope (ESI, Fig. S7†).Data analysis
The FCS data were fitted using the autocorrelation function, in the general form: | (3) |
For each tracer, at least 15 correlation functions were recorded per spheroid. The measurements were performed for 6 different spheroids. The autocorrelation function was analysed with Python using an appropriate diffusion model (ESI†) based on eqn (3) using the non-linear least squares fitting method. The standard uncertainty of the values of the autocorrelation function was calculated as the standard deviation of the average. The diffusion coefficients D[μm2 s−1] were then calculated using the relation: D = ω2/4τD.
Imaging
The spheroids were imaged using a Nikon A1 inverted confocal microscope (Nikon Instruments, Japan). For staining, the spheroids were placed on the 8-chamber cover glass Lab-Tek® slide in a dedicated culture medium without phenol red. Collagen and elastin of the ECM were pre-stained for 1 h at 37 °C using a fluorescent collagen-binding reagent, Col-F (Immunochemistry Technologies, USA) (10 μM final concentration in the cell culture medium). Next, the samples were washed 3 times with PBS, stained for 2 h at 37 °C with 15 μM Hoechst 33342 to visualise the cell nuclei within the spheroids and imaged. To visualise the position of the cells within the spheroids, we applied the excitation of Hoechst 33342 at 408 nm. The Col-F-stained ECM structures were excited using a 488 nm laser. Fluorescence was collected at the range of 425–475 nm (Hoechst 33342) and 500–550 nm (Col-F).Confocal immunofluorescence analysis was performed by plating the spheroids on the 8-chamber cover glass Lab-Tek™ slide, fixing overnight at 4 °C using the Image-iT™ fixative solution (4% formaldehyde, methanol free) (Invitrogen™, USA), permeabilising with 0.3% Triton X-100 (Sigma-Aldrich, USA) and blocking in normal goat serum (Gibco™, USA) for 4 h at room temperature. Then samples were washed and incubated overnight at 4 °C with a mouse collagen I monoclonal antibody (ThermoFisher, USA) diluted 1![[thin space (1/6-em)]](https://www.rsc.org/images/entities/char_2009.gif) :
:![[thin space (1/6-em)]](https://www.rsc.org/images/entities/char_2009.gif) 2000, a mouse elastin monoclonal antibody (Abcam, UK) diluted 1
2000, a mouse elastin monoclonal antibody (Abcam, UK) diluted 1![[thin space (1/6-em)]](https://www.rsc.org/images/entities/char_2009.gif) :
:![[thin space (1/6-em)]](https://www.rsc.org/images/entities/char_2009.gif) 100, a mouse fibronectin monoclonal antibody (ThermoFisher, USA) diluted 1
100, a mouse fibronectin monoclonal antibody (ThermoFisher, USA) diluted 1![[thin space (1/6-em)]](https://www.rsc.org/images/entities/char_2009.gif) :
:![[thin space (1/6-em)]](https://www.rsc.org/images/entities/char_2009.gif) 100 or a mouse tenascin-C monoclonal antibody (ThermoFisher, USA) diluted 1
100 or a mouse tenascin-C monoclonal antibody (ThermoFisher, USA) diluted 1![[thin space (1/6-em)]](https://www.rsc.org/images/entities/char_2009.gif) :
:![[thin space (1/6-em)]](https://www.rsc.org/images/entities/char_2009.gif) 4000. Next, the spheroids were washed three times with PBS and subsequently incubated for 3 hours at room temperature in the dark with Alexa Fluor 568 goat anti-mouse IgG1 cross-adsorbed secondary antibody (ThermoFisher, USA) diluted 1
4000. Next, the spheroids were washed three times with PBS and subsequently incubated for 3 hours at room temperature in the dark with Alexa Fluor 568 goat anti-mouse IgG1 cross-adsorbed secondary antibody (ThermoFisher, USA) diluted 1![[thin space (1/6-em)]](https://www.rsc.org/images/entities/char_2009.gif) :
:![[thin space (1/6-em)]](https://www.rsc.org/images/entities/char_2009.gif) 500, and was again washed three times with PBS. The cell nuclei were labelled with 15 μM Hoechst 33342 and excited using a 405 nm laser. The ECM structures were excited using a 561 nm laser.
500, and was again washed three times with PBS. The cell nuclei were labelled with 15 μM Hoechst 33342 and excited using a 405 nm laser. The ECM structures were excited using a 561 nm laser.
Results
The effective viscosity of the ECM depends on the length scale
The cancerous cell lines were chosen for this study due to the reported differences in their invasiveness and related to this feature, the ECM stiffness.19 HeLa cells are moderately invasive, while the MCF-7 cell line is non-invasive.20 Fibroblasts were used for the purpose to provide the model of the non-cancerous cell line, known to synthesise the extracellular matrix.First, we measured the diffusion coefficients of the fluorescent probes with various (from 1 nm to 110 nm) radii (rp). Each probe was measured by FCS under physiological conditions in HeLa, MCF-7 and fibroblast spheroids. In Fig. 2, we show the effective viscosity experienced by the nanoprobes listed in Table 1 within all three types of spheroids. The length-scale dependent viscosity model (eqn (2)) was fitted to the data with ξ, A, a and Rh as free parameters. The data analysis for all three spheroid types revealed that parameter a was close to unity within 7% of uncertainty, therefore we decided to fix this parameter as 1.
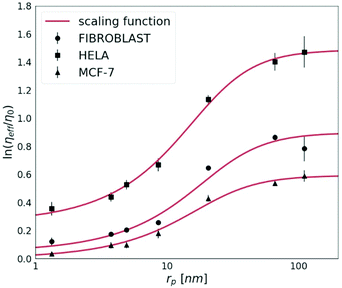 | ||
| Fig. 2 The logarithm of effective viscosity experienced by nanoprobes of radii rp moving in the ECM of HeLa, MCF-7, and fibroblast spheroids. Error bars correspond to the standard deviations (N > 30). The fit of a length-scale dependent viscosity model (eqn (2)) is presented as a solid line. The fitting parameters are listed in Table 2. The diffusion coefficient of any inert probe within the ECM of studied cell line spheroids can be estimated from the presented length-scale dependent model. | ||
| Sample name | r p [nm] |
|---|---|
| Dextran 4.4 kDa | 1.3 ± 0.2 |
| Dextran 20 kDa | 3.8 ± 0.3 |
| Dextran 40 kDa | 4.9 ± 0.5 |
| Dextran 155 kDa | 8.6 ± 0.7 |
| S34(1) nanoparticles | 20.6 ± 1.3 |
| S43(2) nanoparticles | 66.2 ± 3.1 |
| S44(3) nanoparticles | 110.7 ± 3.3 |
The diffusion of probes of up to 10 nm in radius is almost unobstructed by the ECM. This implicates that probes whose rp ≪ ξ experience effective viscosity similar to that of the solvent.
For tracers bigger than the correlation length rp > ξ, we observe an exponential increase in the values of the effective viscosity experienced by the probe. In all examined spheroids, tracers bigger than rp ≫ 90 nm (i.e. 4Rh) experience the effective viscosity corresponding to macroscopic viscosity. Thereby, we proved that the effective viscosity experienced by a probe undergoing motion in the ECM is a function of the hydrodynamic radius of the probe. Nanoparticles smaller than the correlation length, ξ, experienced much lower viscosity than the macroscopic one.
According to the length-scale dependent viscosity model, Rh corresponds to the mean value of hydrodynamic radii of obstacles creating the environment surrounding the probes. In the studied spheroids, type I collagen might be considered as the major hindrance since it is the most abundant fibrous protein within the ECM.21 Knowing that the radius of an individual collagen molecule rc = 0.75 nm,22 the length of the ECM obstacles can be calculated using the relation23Rh = L/(2s − 0.19 − 8.24/s + 12 s−2), where s = ln(L/r) and L is the length of the filament. The estimated values of the length of the obstacles are comparable with the collagen monomers, whose length (250–300 nm) was previously measured by AFM.24
The nanoviscosity of the ECM (ηECM,) as well as Rh, take similar values in both cancerous (HeLa and MCF-7) and non-cancerous (fibroblasts) spheroids. However, the correlation length, ξ, influencing the macroscopic viscosity value, ηmacro, is approximately two times higher in HeLa than in the other two tested cell lines.
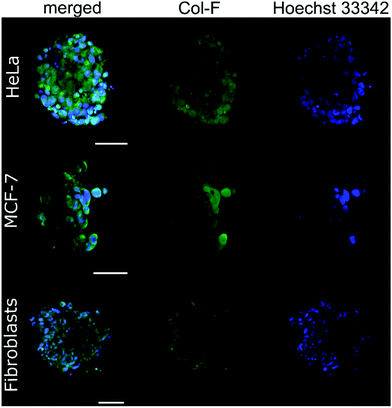
Next, we complemented our analyses with confocal imaging, as shown in Fig. 3 and 4.
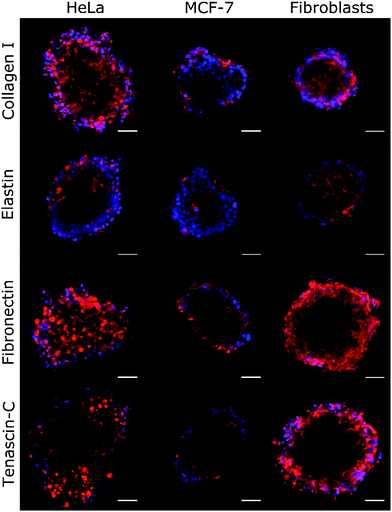 | ||
| Fig. 4 Immunochemical analysis of the ECM proteins collagen I, elastin, fibronectin, and tenascin-C was performed on HeLa, MCF-7, and fibroblast spheroids. The density of the labelled ECM fibres (in red) differs among the examined cell lines and follows the trend of change of ξ, as shown in Table 2. The observed density of fibres in MCF-7 spheroids is notably lower than in HeLa and fibroblast spheroids. Hoechst 33342 nuclear counterstain is also shown (in blue). Scale bars are 50 μm. | ||
By using Col-F fluorescent dye binding to elastic and collagenous fibres, we visualised the structure of the ECM within the spheroids.25 Additionally, we performed the immunohistochemical staining of four major extracellular matrix components: collagen type I, fibronectin, elastin, and tenascin-C. We found that the density of the labelled fibres differs among the examined cell lines and follows the trend of changes of ξ, as shown in Table 2. The observed density of fluorescent fibres in HeLa spheroids is markedly higher than in all other tested spheroids.
| Parameter | HeLa spheroids | MCF-7 spheroids | Fibroblast spheroids |
|---|---|---|---|
| η 0 corresponds to the viscosity of PBS, which is 0.75 mPa s. | |||
| Nanoviscosity of the ECM matrix, ηECM = Aη0 | (1.29 ± 0.04) η0 = 0.97 mPa s | (1.00 ± 0.03) η0 = 0.75 mPa s | (1.05 ± 0.07) η0 = 0.79 mPa s |
| Correlation length, ξ | 17.78 ± 1.73 nm | 39.72 ± 6.98 nm | 30.94 ± 7.50 nm |
| Hydrodynamic radius, Rh | 21.93 ± 1.94 nm | 23.47 ± 3.81 nm | 26.30 ± 6.30 nm |
| Obstacle length, L | 220 ± 2 nm | 240 ± 18 nm | 274 ± 40 nm |
| Macroscopic viscosity of the ECM, ηmacro | 4.43 η0 ≈ 3.32 mPa s | 1.81 η0 ≈ 1.36 mPa s | 2.46 η0 ≈ 1.85 mPa s |
The time-related changes of the ECM structure
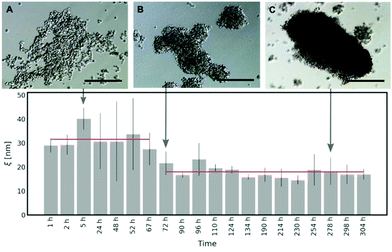
Spheroid formation involves three subsequent steps: an initial aggregation, compaction and spheroid maturation. Each of these steps consists of a plethora of biomolecule interactions.26,27 To have an insight into the process of the extracellular matrix formation in the spheroids, we measured the diffusivity of S34(1) nanoparticles in HeLa spheroids. We started the experiment 1 h after seeding the spheroids and continued for the next 13 days, evaluating the correlation length (ξ) at different time intervals to determine the changes in the ECM mesh size. Based on eqn (2), we get: | (4) |
In eqn (4), an effective radius of a probe is defined as Reff−2 = Rh−2 + rp−2. The values for Rh and A were taken from Table 2 (the second column, HeLa spheroids), and a = 1.
As shown in Fig. 5, in the first 3 days of HeLa spheroid culture, the average half-distance between the points of entanglement in the ECM is derived as follows: ξ = (31.59 ± 7.86) nm. After 72 h, there is around a two-fold decrease in ξ = (17.97 ± 6.65) nm, which does not change upon further maturation of spheroids. Thus, we conclude that it takes approximately 60–70 hours for the cells in the spheroids to create the network of collagen in the ECM. The occurring variation in the results (range from 72 h to 304 h of the spheroid culture) can be related to the heterogeneity of the ECM structure (for more details, please see Fig. S11 and S12 in the ESI†).
Possible factors influencing the ECM structure
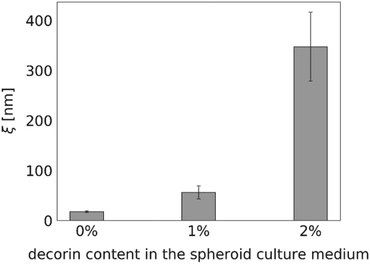
Proteoglycan decorin (DCN), one of the ECM constituents, is known to regulate fibrillogenesis. It inhibits type I collagen maturation and regulates collagenase expression.28 Thus, we expected the diffusion within the decorin-enriched spheroids to be faster than in the control group. To test our hypothesis, we incubated the HeLa spheroids with a culture medium enriched in 1% or 2% (w/v) decorin, followed by the evaluation of the effective diffusion of S34(1) nanoparticles by FCS (Fig. 6). We observed an approximately 20-fold increase of the interfibrillar spacing in the ECM network as well as a decrease of the effective viscosity experienced by a probe in the decorin-enriched spheroids. It indicates that indeed decorin has anti-fibrotic properties, and its presence makes the ECM structure to become looser. Moreover, the obtained results support the correctness of our measurements as we observed the alterations in the effective diffusion upon known changes in the ECM structure.Discussion
There are numerous studies on the penetration of specific nanoparticles through spheroids.29,30 In comparison with these reports, we present a systematic study on the rheological characteristics of the ECM in spheroids at different length scales.We used FCS as it is a high statistics, non-invasive method to study the internal dynamics of molecules at nanomolar concentrations in complex biological structures.31 Another tool that was used to study diffusion in spheroids is fluorescence recovery after photobleaching (FRAP).32 However, this historically older method has its drawbacks as it requires photobleaching of the studied biomatter, which can be phototoxic due to localised heating by the laser.33 Moreover, FRAP requires much higher concentrations of fluorophores. A technique used in similar concentration regimes to FCS is single particle tracking (SMT). SMT, performed using a new two-photon excitation microscopy TSUNAMI, allows tracking of a protein in spheroids even at a depth of ∼100 μm. But this type of system is not commercially available and probably is too expensive to be used on a regular basis to determine the diffusion of bioactive molecules within the ECM. In addition, SMT requires recordings of many tracks to obtain high statistics, which in the case of FCS can be collected in a single measurement.
Most of the prior reports on motion in the extracellular space used the collagen gel as the ECM model. For instance, Kihara et al.34 suspended the fibroblast cells in the collagen gels and analysed diffusion using FCS. In contrast to our results, the diffusion within the fibroblast-contracted collagen gel of molecules with rp from 1 to 10 nm follows the Stokes–Sutherland–Einstein relation.35,36 Consequently, the Deff/D0 ratio is constant, irrespective of the probe size. This result may be explained by the fact that for such a narrow range of molecular radii, the authors do not observe all the length scales of the hydrodynamic flow around the probe particles.
A key study of macromolecules’ diffusion in tumours was demonstrated experimentally by Pluen et al.32 Diffusion coefficients of FITC-conjugated particles in tumours growing in cranial windows (CW) and dorsal chambers (DC) were measured by fluorescence recovery after photobleaching (FRAP). As an outcome, it was found that D does not decrease linearly with an increasing radius of the probe. It has been suggested that an unexpectedly more significant decrease in the diffusion of larger molecules can be described by the concept of tortuosity. Here we propose a different explanation of their results. The observed reduction of the diffusion coefficient is well described by our length-scale dependent viscosity model. We used the data obtained for the tumours growing in the cranial windows (CW)32 to plot the dependence of the effective viscosity of the tissues on the radius of the probes, as shown in Fig. 7. The value of the correlation length for the CW tumours (obtained from the fitting of eqn (2)) is as follows: ξ = 10.17 ± 1.74 nm, which revealed that the concentration of the crowding agents is higher than that in spheroids (ξ = 19.31 ± 5.08 nm). Interestingly, we found that the hydrodynamic radius of the obstacles Rh = 22.98 ± 4.05 nm in the tumours is almost the same as the value obtained for the spheroids, Rh = 23.62 ± 5.75 nm, which clearly indicates the same size of the obstacles present in both the ECMs.
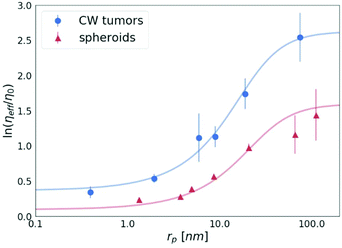 | ||
| Fig. 7 The logarithm of the effective viscosity experienced by the nanoprobes of radii rp moving in the CW tumours32 and spheroids (the average value for all 3 cell lines). The solid lines calculated from eqn (2). The error bars correspond to the maximal error calculated on the basis of standard deviations of measurements. | ||
Furthermore, the devised methodology allows to predict the motion of any probe particle directly from the displayed curve of the length-scale dependent viscosity. Based on the presented results and under the assumption that the effective viscosity of the ECM is the same in all parts of a tumour, we can calculate the time needed to cross a given distance by particles of any size (using the relation: t = x2πηR/kT![[thin space (1/6-em)]](https://www.rsc.org/images/entities/char_2009.gif) 35). For instance, the doxorubicin molecule (common chemotherapeutic with a radius of 0.7 nm) needs 22 seconds to pass through 200 μm of the tissue. On the other hand, the same active ingredient encapsulated in the liposome of ∼95 nm in the radius (Myocet®) requires over 8 hours (precisely 497 minutes).
35). For instance, the doxorubicin molecule (common chemotherapeutic with a radius of 0.7 nm) needs 22 seconds to pass through 200 μm of the tissue. On the other hand, the same active ingredient encapsulated in the liposome of ∼95 nm in the radius (Myocet®) requires over 8 hours (precisely 497 minutes).
It shows that diffusion can not only be significantly altered but also controlled by means of particles’ size. This outcome also correlates with markedly different pharmacokinetics of both drugs. The accumulation of bigger therapeutics in tissues and as a consequence a longer duration of their action at the target site enhances the treatment efficacy of liposomal DOX compared with the conventional doxorubicin.7,37
Our method of analysis of extracellular transport using spheroids seems to be a good compromise connecting the simple approach involving artificial ECM models34 and the advanced investigations with the use of animals.32 The ECM of spheroids provides an accurate imitation of the native ECM, maintaining the simplicity of cell culturing. The structure of the ECM of the compact spheroids does not change over time, which is manifested as constant interfibrillar spacing observed over the days (Fig. 5).
An additional advantage of our approach is the possibility to test factors influencing the ECM structure. Based on the diffusivity measurements and the length-scale dependent model, we can verify the anti-fibrosis properties of any compound. It can be useful in the assessment of novel therapeutic strategies using ECM-oriented cancer treatments.38,39 As an example, we examined the effect of decorin on HeLa spheroids. We estimated that the effective viscosity experienced by the liposomal DOX in spheroids exposed to decorin would be over 2 times higher than in the non-treated HeLa spheroids.
Conclusions
In summary, by applying FCS, we characterised the rheological structure of the ECM in spheroids. We quantified the transport of nanoprobes covering two orders of magnitude in size (from 1 to over 100 nm), which encompass the size of the majority of drug nanocarriers. Our results were further used for the determination of length-scale dependent viscosity profiles of the ECM. Based on this analysis, we have shown that the structure of the ECM varies between cell lines: the ECM of HeLa spheroids was found twice more packed than for the MCF-7 cell line and fibroblasts. We also have shown that the final structure of the ECM is created over 3 days after seeding.The length-scale dependence of viscosity of the ECM has its impact on drug distribution in tissues. While small drug carriers (smaller than 10 nm) move freely through the ECM, larger ones encounter diffusion hindrance. Free diffusion of small molecules – revealed in our study – also lead to important questions concerning the biology of 3D cultures. The majority of works on spheroid indicate “diffusion hindrance” as a significant factor causing hypoxia and deficiency in nutrients in the necrotic core of spheroids.13 Our results, however, suggest that diffusion of oxygen or glucose should remain unobstructed due to their small sizes (less than 0.4 nm in radius), and there should be other, more significant factors determining their shortage in the core of the spheroids.
Conflicts of interest
There are no conflicts to declare.Acknowledgements
This work was supported by the National Science Centre, Poland within the grant Maestro UMO-2016/22/A/ST4/00017.Notes and references
- A. I. Minchinton and I. F. Tannock, Drug penetration in solid tumors, Nat. Rev. Cancer, 2006, 6, 583–592 Search PubMed.
- S. H. Jang, M. G. Wientjes, D. Lu and J. L. Au, Drug Delivery and Transport to Solid Tumors, Pharm. Res., 2003, 20, 1337–1350 Search PubMed.
- R. K. Jain, Transport of Molecules in the Tumor Interstitium: A Review, Cancer Res., 1987, 47, 3039–3051 Search PubMed.
- A. Rahman, D. Carmichael, M. Harris and J. K. Roh, Comparative Pharmacokinetics of Free Doxorubicin and Doxorubicin Entrapped in Cardiolipin Liposomes, Cancer Res., 1986, 46, 2295–2299 Search PubMed.
- A. M. Rahman, S. W. Yusuf and M. S. Ewer, Anthracycline-induced cardiotoxicity and the cardiac-sparing effect of liposomal formulation, Int. J. Nanomed., 2007, 2(4), 567–583 Search PubMed.
- E. Miele, G. P. Spinelli, E. Miele, F. Tomao and S. Tomao, Albumin-bound formulation of paclitaxel (Abraxane® ABI-007) in the treatment of breast cancer, Int. J. Nanomed., 2009, 4, 99–105 Search PubMed.
- H. I. Chang and M. K. Yeh, Clinical development of liposome-based drugs: formulation, characterisation, and therapeutic efficacy, Int. J. Nanomed., 2012, 7, 49–60 Search PubMed.
- P. A. Netti, D. A. Berk, M. A. Swartz, A. J. Grodzinsky and R. K. Jain, Role of Extracellular Matrix Assembly in Interstitial Transport in Solid Tumors, Cancer Res., 2000, 60, 2497–2503 Search PubMed.
- R. O. Hynes, The Extracellular Matrix: Not Just Pretty Fibrils, Science, 2009, 326, 1216–1219 Search PubMed.
- T. Kalwarczyk, N. Ziębacz, A. Bielejewska, E. Zaboklicka, K. Koynov and J. Szymański, et al., Comparative Analysis of Viscosity of Complex Liquids and Cytoplasm of Mammalian Cells at the Nanoscale, Nano Lett., 2011, 11, 2157–2163 Search PubMed.
- T. Kalwarczyk, K. Sozański, A. Ochab-Marcinek, J. Szymański, M. Tabaka and S. Hou, et al., Motion of nanoprobes in complex liquids within the framework of the length-scale dependent viscosity model, Adv. Colloid Interface Sci., 2015, 223, 55–63 Search PubMed.
- W. Mueller-Klieser, Multicell spheroids - a review on cellular aggregate in cancer research, J. Cancer Res. Clin. Oncol., 1987, 113, 101–122 Search PubMed.
- A. S. Nunes, A. S. Barros, E. C. Costa, A. F. Moreira and I. J. Correia, 3D tumor spheroids as in vitro models to mimic in vivo human solid tumors resistance to therapeutic drugs, Biotechnol. Bioeng., 2019, 116, 206–226 Search PubMed.
- T. Nederman, B. Norling, B. Glimelius, J. Carlsson and U. Brunk, Demonstration of an Extracellular Matrix in Multicellular Tumor Spheroids, Cancer Res., 1984, 44, 3090–3097 Search PubMed.
- T. R. Olsen, B. Mattix, M. Casco, A. Herbst, C. Williams and A. Tarasidis, et al., Manipulation of cellular spheroid composition and the effects on vascular tissue fusion, Acta Biomater., 2015, 13, 188–198 Search PubMed.
- L. Polonchuk, M. Chabria, L. Badi, J. C. Hoflack, G. Figtree and M. J. Davies, et al., Cardiac spheroids as promising in vitro models to study the human heart microenvironment, Sci. Rep., 2017, 7(1), 7005 Search PubMed.
- R. Machán and T. Wohland, Recent applications of fluorescence correlation spectroscopy in live systems, FEBS Lett., 2014, 588, 3571–3584 Search PubMed.
- T. Kalwarczyk, K. Kwapiszewska, K. Szczepański, K. Soznański, J. Szymański, B. Michalska and P. Patalas-Krawczyk, et al., Apparent Anomalous Diffusion in the Cytoplasm of Human Cells: The Effect of Probes’ Polydispersity, J. Phys. Chem. B, 2017, 121, 9831–9837 Search PubMed.
- L. Wullkopf, A. V. West, N. Leijnse, T. R. Cox, C. D. Madsen, L. B. Oddershede and J. T. Erler, Cancer cells’ ability to mechanically adjust to extracellular matrix stiffness correlates with their invasive potential, Mol. Biol. Cell, 2018, 29, 2378–2385 Search PubMed.
- A. H. Baker and S. J. George, Inhibition of invasion and induction of apoptotic cell death of cancer cell lines by overexpression of TIMP-3, Br. J. Cancer, 1999, 79, 1347–1355 Search PubMed.
- A. D. Theocharis, S. S. Skandalis, C. Gialeli and N. K. Karamanos, Extracellular matrix structure, Adv. Drug Delivery Rev., 2016, 97, 4–27 Search PubMed.
- M. Gale, M. S. Pollanen, P. Markiewicz and M. C. Goh, Sequential Assembly of Collagen Revealed by Atomic Force Microscopy, Biophys. J., 1995, 68, 2124–2128 Search PubMed.
- W. Van De Sande and A. Persoons, The Size and Shape of Macromolecular Structures: Determination of the Radius, the Length, and the Persistence Length of Rodlike Micelles of Dodecyldimethylammonium Chloride and Bromide, J. Phys. Chem. B, 1985, 89, 404–406 Search PubMed.
- M. Gale, M. S. Pollanen, P. Markiewicz and M. C. Goh, Sequential Assembly of Collagen Revealed by Atomic Force Microscopy, Biophys. J., 1995, 68, 2124–2128 Search PubMed.
- E. Biela, J. Galas, B. Lee, G. L. Johnson, Z. Darzynkiewicz and J. W. Dobrucki, Col–F, a fluorescent probe for ex vivo confocal imaging of collagen and elastin in animal tissues, Cytometry, Part A, 2013, 83, 533–539 Search PubMed.
- R. Z. Lin and H. Y. Chang, Recent advances in three-dimensional multicellular spheroid culture for biomedical Research, Biotechnol. J., 2008, 3, 1172–1184 Search PubMed.
- I. Smyrek, B. Mathew, S. C. Fischer, S. M. Lisssek, S. Becker and E. H. K. Stelzer, E-cadherin, actin, microtubules and FAK dominate different spheroid formation phases and important elements of tissue integrity, Biol. Open, 2019, 8, bio037051 Search PubMed.
- W. Zhang, Y. Ge, Q. Cheng, Q. Zhang, L. Fang and J. Zheng, Decorin is a pivotal effector in the extracellular matrix and tumour microenvironment, Oncotarget, 2018, 9, 5480–5491 Search PubMed.
- A. Tchoryk, V. Taresco, R. H. Argent, M. Ashford and P. R. Gellert, et al. Penetration and uptake of nanoparticles in 3D tumor spheroids, Bioconjugate Chem., 2019, 30, 1371–1384 Search PubMed.
- M. B. Cutrona and J. C. Simpson, A high-throughput automated confocal microscopy platform for quantitative phenotyping of nanoparticle uptake and transport in spheroids, Small, 2019, 15, 1902033 Search PubMed.
- S. Kim, K. Heinze and P. Schwille, Fluorescence correlation spectroscopy in living cells, Nat. Methods, 2007, 4, 963–973 Search PubMed.
- A. Pluen, Y. Boucher, S. Ramanujan, T. D. McKee, T. Gohongi, E. di Tomaso and E. B. Brown, et al. Role of tumor-host interactions in interstitial diffusion of macromolecules: Cranial vs. subcutaneous tumors, Proc. Natl. Acad. Sci. U. S. A., 2001, 98, 4628–4633 Search PubMed.
- C. De Los Santos, C. W. Chang, M. A. Mycek and R. A. Cardullo, FRAP, FLIM, and FRET: Detection and analysis of cellular dynamics on a molecular scale using fluorescence microscopy, Mol. Reprod. Dev., 2015, 82, 587–604 Search PubMed.
- T. Kihara, J. Ito and J. Miyake, Measurements of biomolecular diffusion in extracellular matrix condensed by fibroblasts using fluorescence correlation spectroscopy, PLoS One, 2013, 8, e82382 Search PubMed.
- A. Einstein, Über die von der molekularkinetischen Theorie der Wärme geforderte Bewegung von in ruhenden Flüssigkeiten suspendierten Teilchen, Ann. Phys., 1905, 17, 549–560 Search PubMed.
- W. Sutherland, A dynamical theory of diffusion for non-electrolytes and the molecular mass of albumin, Philos. Mag. J. Sci., 1905, 9, 781–785 Search PubMed.
- A. Fukuda, K. Tahara, Y. Hane, T. Matsui, S. Sasaoka, H. Hatahira and Y. Motooka, et al. Comparison of the adverse event profiles of conventional and liposomal formulations of doxorubicin using the FDA adverse event reporting system, PLoS One, 2017, 12, e0185654 Search PubMed.
- A. W. Holle, J. L. Young and J. P. Spatz, In vitro cancer cell–ECM interactions inform in vivo cancer treatment, Adv. Drug Delivery Rev., 2015, 97, 270–279 Search PubMed.
- R. Raavé, T. H. van Kuppevelt and W. F. Daamen, Chemotherapeutic drug delivery by tumoral extracellular matrix targeting, J. Controlled Release, 2018, 274, 1–8 Search PubMed.
Footnote |
| † Electronic supplementary information (ESI) available. See DOI: 10.1039/d0nr01986k |
| This journal is © The Royal Society of Chemistry 2020 |

