
 Open Access Article
 This Open Access Article is licensed under a Creative Commons Attribution-Non Commercial 3.0 Unported Licence
Scalable growth of single-walled carbon nanotubes with a highly uniform structure†
Aqeel
Hussain
 a,
Er-Xiong
Ding
a,
Ben
Mclean
b,
Kimmo
Mustonen
c,
Saeed
Ahmad
a,
Mohammad
Tavakkoli
a,
Alister J.
Page
b,
Qiang
Zhang
*a,
Jani
Kotakoski
c and
Esko I.
Kauppinen
*a
a,
Er-Xiong
Ding
a,
Ben
Mclean
b,
Kimmo
Mustonen
c,
Saeed
Ahmad
a,
Mohammad
Tavakkoli
a,
Alister J.
Page
b,
Qiang
Zhang
*a,
Jani
Kotakoski
c and
Esko I.
Kauppinen
*a
aDepartment of Applied Physics, Aalto University School of Science, P.O. Box 15100, FI-00076 Aalto, Finland. E-mail: qiang.zhang@aalto.fi; esko.kauppinen@aalto.fi
bSchool of Environmental & Life Sciences, University of Newcastle, Callaghan 2308, Australia
cFaculty of Physics, University of Vienna, Boltzmanngasse 5, 1090 Vienna, Austria
First published on 13th May 2020
Abstract
Here, a scalable floating catalyst chemical vapor deposition (FCCVD) method is developed for the production of single-walled carbon nanotubes (SWCNTs) with a controlled structure. For the first time, water is used as the growth promoter in the FCCVD process to modulate the growth of SWCNTs. At an optimum water concentration of ca. 115 ppm, the water-assisted FCCVD process synthesizes SWCNTs with a significantly narrow chirality distribution. In particular, the proportion of (9,8) and (8,7) semiconducting tubes was dramatically enhanced to 45% with 27% of the (9,8) tube in the end product. This is attributed to the changes in both the SWCNT diameter and the chiral angle. The experiment results and accurate quantum chemical molecular dynamics simulations show that the addition of water affects the nucleation and the size distribution of nanoparticle catalysts, thus resulting in the growth of SWCNTs with a highly uniform structure. This direct and continuous water-assisted FCCVD provides the possibility for the mass production of high-quality SWCNTs with a controlled structure.
Control over the diameter and chirality of single-walled carbon nanotubes (SWCNTs) is one of the major obstacles to their application.1 The electronic properties of SWCNTs are so sensitive to their structure that even a slight shift in nanotube chirality results in significant changes in their electronic band structure.2 For example, chirality determines the metallic or semiconducting nature of the tubes.3,4 SWCNTs are produced with different structures and this structural heterogeneity limits their applications. SWCNTs with narrow chirality distribution have narrow bandgap which reduces the device performance variations, e.g., in the on/off ratio of a transistor. Uniform devices are the main target for applications, this is why single or the narrowest possible chirality distribution tubes are needed for applications in field-effect transistors (FETs),5 integrated circuits6 and other nanoelectronics. Moreover, for semiconducting tubes, the energy band structure of a SWCNT is inversely proportional to the diameter.7 Due to their large band gaps, small diameter SWCNTs provide a very high on/off ratio in transistor applications, and a fast spectral response in optoelectronics.8
Tremendous efforts have been devoted to the growth of SWCNTs with a controlled chirality. There have been attempts to directly grow SWCNTs with a defined chirality. An important method for this is the selective synthesis of SWCNTs using well-controlled and high-temperature stabilized catalyst nanoparticles (NPs) on a substrate.9,10 Selective etching is another well-known strategy for the controlled growth of SWCNTs in an oxidative environment of oxygen,11 water,12 ammonia13 and carbon dioxide.14,15 Despite the progress, there are significant obstacles to the mass production of SWCNTs with controlled structures9,16,17 for practical applications. Substrate-CVD produces SWCNTs at a low yield and has limited potential for upscale production. However, floating catalyst chemical vapor deposition (FCCVD) has demonstrated potential for the direct and continuous manufacturing of SWCNTs at a high yield, while maintaining their intrinsic electronic properties and eliminating the need for time-consuming solution processing.18
We have developed water-assisted floating catalyst chemical vapor deposition (FCCVD) for the scalable synthesis of SWCNTs with obviously narrow chirality distribution. FCCVD has already been scaled up for large-scale synthesis of SWCNTs. This is the first time that H2O has been used as a promoter for structure-controlled SWCNT synthesis by FCCVD. Water has only been used in substrate-CVD before for the growth of SWCNTs.19–21 H2O addition increases the yield of SWCNTs over 100-fold. We were able to mass synthesize SWCNTs with a high enrichment (45%) of two dominant chiral indices (9,8) and (8,7) tuned from near-random chirality distribution. In comparison, our work produces SWCNTs with narrower chirality distribution than several other studies using FCCVD.13,14,22 Scaling up the production of SWCNTs with highly controlled chirality will play an essential role for their commercial applications.
We studied the effect of water on highly individual SWCNTs grown using 0.75 standard cubic centimeter per minute (sccm) ethylene, 45 ccm hydrogen and 40 sccm of N2 through the ferrocene cartridge (Fig. S1†).22 The yield was calculated by the transmittance of SWCNT films based on the Beer–Lambert law.23 The reaction yield is significantly increased upon adding water (Fig. 1a). For 115 ppm H2O, the reaction yield increases more than 10 times compared to 0 ppm water and reaches a maximum value at 300 ppm H2O with a more than 100-fold increase in the yield. However, once the H2O concentration exceeds 300 ppm the yield decreases. To further clarify the increase of the yield, a Differential Mobility Analyzer (DMA) was employed for the online analysis.24 DMA profiles indicate the increase of both particle and nanotube concentrations upon adding water (Fig. S2b†). The concentration of SWCNTs is negligible at 0 ppm water, which increases to 1.2 × 10⁶ nanotubes per cm3 for the addition of 115 ppm water. DMA analysis also showed a maximum yield at 300 ppm with concentration 2 × 10⁶ nanotubes per cm3. It confirms the increase in the nanotube synthesis yield for the addition of water.
 | ||
| Fig. 1 (a) Normalized SWCNT synthesis yield at varied H2O concentrations. (b) Absorption spectroscopy indicates variation in nanotube diameters at different H2O concentrations. | ||
Optical absorption spectroscopy allows rapid quantification of the SWCNT diameter. The absorption spectra of the SWCNT films are shown in Fig. 1b. With an increase in the H2O concentration, the transition peak S11 from the semiconducting tubes first has a blue-shift at lower water concentrations (0 to 140 ppm) and then red-shift at high water concentrations (190 to 350 ppm). From the Kataura plot and the absorption spectra, the mean diameter of SWCNTs was calculated.25,26 The mean diameter of SWCNTs is 1.30 nm in the absence of H2O, which significantly decreases to 1.05 nm with the addition of a small amount of H2O (50 to 140 ppm). However, the SWCNT diameter unexpectedly increases with more water addition (190 to 350 ppm) resulting in a mean diameter of 1.20 nm at 300 ppm H2O. The absorption peaks (S11 and S22) of SWCNTs synthesized at a small concentration of water (50 to 140 ppm) are obviously narrower compared to the peaks arising from the nanotubes produced in the absence of water. This suggests that water addition produces SWCNTs with a narrower diameter distribution. The SWCNT diameter variations due to the addition of water are supported by the analysis from Raman spectra (Fig. S4†). Raman spectroscopy also showed the growth of small diameter tubes at 115 ppm H2O.
Electron diffraction analysis was used to study the chiral structure of individual SWCNTs. The SWCNTs were deposited on the TEM grid and each tube was approached separately to assess its diffraction pattern. The diffraction patterns of different types of tubes are shown in Fig. S5.† Based on the intrinsic layer line analysis method from the electron diffraction pattern, the chiral indices (n, m) were assigned to individual tubes.27 We investigated SWCNTs grown at 0 ppm, 115 ppm and at a high H2O concentration of 300 ppm, and their corresponding absorption spectra are shown in Fig. S3.† The statistical (n, m) and diameter distribution of 120 individual SWCNTs for each condition are shown in Fig. 2 and S6.†
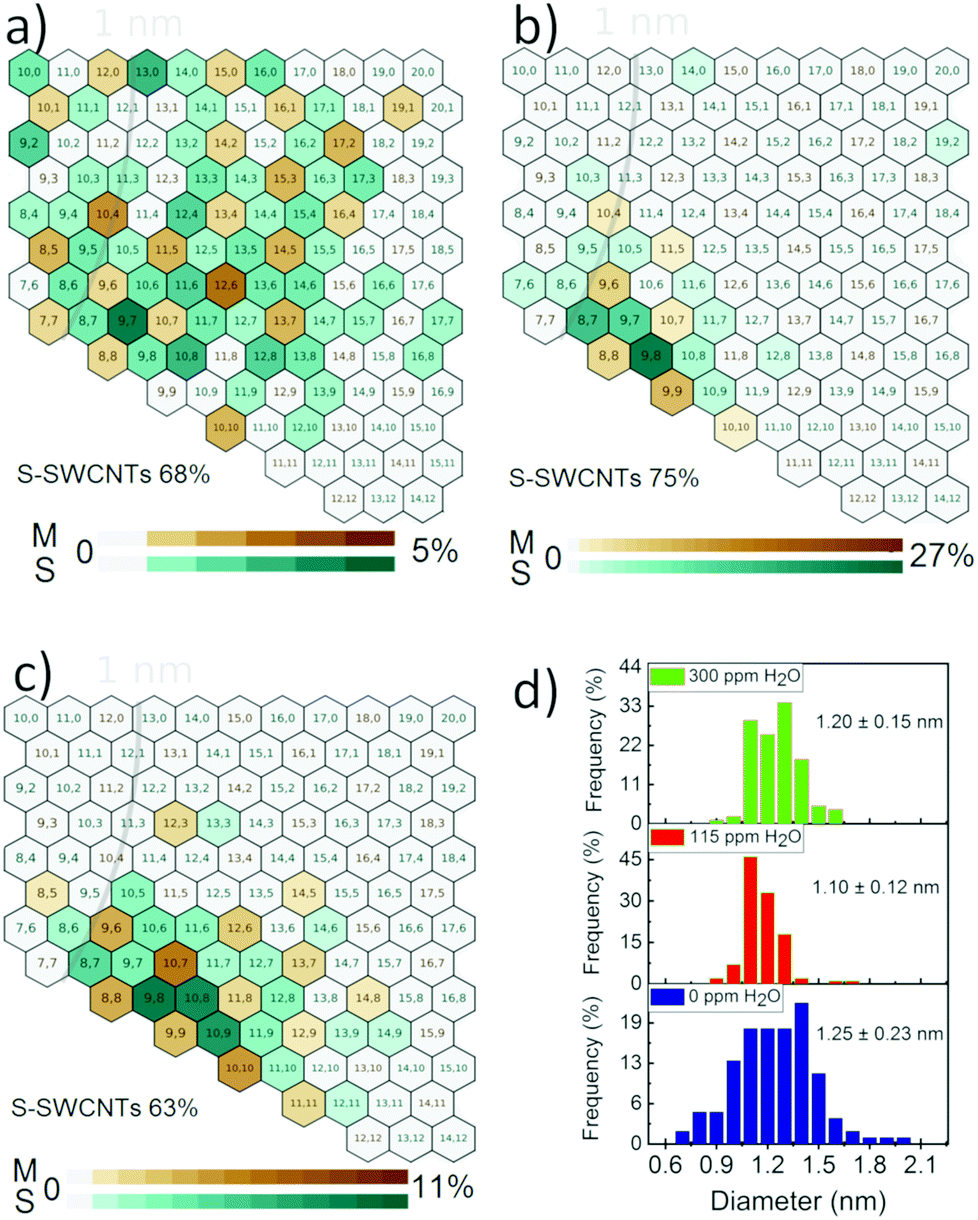 | ||
| Fig. 2 Chirality distribution of 120 individual SWCNTs for the H2O concentration of (a) 0 ppm, (b) 115 ppm and (c) 300 ppm. (d) The nanotube diameter distribution obtained from electron diffraction measurements. | ||
Accurate chirality maps (Fig. 2) show that the addition of water affects diameter, chirality and chiral angle distribution of SWCNTs. As shown in Fig. 2d, the mean diameter of SWCNTs first decreases from 1.25 nm to 1.10 nm and then increases to 1.20 nm with increasing water concentration, which is consistent with the absorption results. The chiral angle distributions of SWCNTs are shown in Fig. S6b.† Without H2O, the chiral angles are evenly and randomly distributed between 0 and 30° with a mean chiral angle of 16°. However, SWCNTs are accumulated near the armchair edge at high chiral angles with the addition of water, which is in accordance with the screw dislocation theory.28 The optimized 115 ppm H2O, in particular, produced SWCNTs with an extremely narrow chirality distribution. More than 95% of the tubes produced at this concentration have chiral angles between 20° and 30° and 90% of the tubes have diameters between 1.05 and 1.30 nm. Two dominant chiralities of (9,8) and (8,7) are semiconductive and their enrichment reaches to 45% of the tubes among which single chirality (9,8) accounts for 27% of the SWCNTs in the sample. Evaluated by the standard deviations of chiral angle and diameter as well as the maximum enrichment of single chirality, SWCNTs produced with 115 ppm H2O have the narrowest chirality distribution reported in the FCCVD process (Table S1†). In addition, the semiconducting ratio at 115 ppm H2O increases to 75% from 68% at 0 ppm H2O. Notably, the yield of these SWCNTs with controlled structures is an order of magnitude higher than that without water and from other substrate CVD9,10 methods which suffer from low yields due to their activity-limited catalyst. The yield further increases at higher water concentrations, but chirality scatters again (Fig. 2c). For example, the enrichment of (9,8) decreases to 10% at 300 ppm H2O.
Our results, revealing for the first time the impact of water addition in FCCVD on SWCNT synthesis, differ from the previous studies on water-assisted substrate CVD synthesis of SWCNTs.11,29 Water is believed to create an oxidative environment where low chiral angle and small diameter nanotubes are preferably etched due to their high reactivity.30,11,29 So, we propose that the oxidative environment of water selectively removed the low chiral angle tubes (Fig. S6b†). Kimura et al. recently calculated the reaction energy of an OH radical (ΔEOH) for different chiralities and proposed that there is a selective removal of low chiral angle tubes in the presence of OH due to a high ΔEOH.31 This prevents the growth of nanotubes in a wide distribution of chiral angles and makes the distribution narrow at high chiral angles. Similarly, the addition of water selectively removed the small diameter (less than 1 nm) SWCNTs as shown in diameter distribution (Fig. 2d). Despite this, the mean diameter of the SWCNTs is decreased at 115 ppm water which suggests further investigations of the process are needed.
Previous studies have correlated variations in the diameter and structure of the SWCNTs to the NP catalyst size.20,21,32 To observe the effect of water on NP nucleation and the subsequent SWCNT growth, we studied ferrocene decomposition decoupled from SWCNT growth. We stopped the ethylene flow to prevent the carbon source entering the reactor and used DMA for online measurement of the effect of water on the decomposition of ferrocene. In the absence of water, the concentration of NPs is extremely low in the reaction zone and is below the DMA measurement limits (Fig. S2a†). However, the addition of 115 ppm H2O enormously increases the NP number concentration and it approaches 1.4 × 10⁷ NPs per cm3. The concentration of NPs increases for a higher concentration of H2O and for DMA calculated to be 2.2 × 10⁷ NPs per cm3 for 300 ppm H2O. Water is proposed to change the NP formation mechanisms, i.e., the nucleation rate affecting the ferrocene homogeneous decomposition rate.
To further investigate the effect of water on the size of the NPs during the SWCNT growth, we used a scanning transmission electron microscope (STEM). The detailed STEM images of NPs for the growth of SWCNTs are shown in Fig. S7† and 3d. The NP size obviously decreases with the addition of a small amount of water. Fig. 3 shows a mean NP size of 2.93 nm at 0 ppm water, which decreases to 1.31 nm with the addition of 115 ppm of water. Moreover, the addition of 115 ppm of water narrows down the NP size distribution. It shows that water impedes the size of NPs during nucleation. However, the highest water concentration of 300 ppm produced larger size NPs with a mean size of 2.25 nm.
 | ||
| Fig. 3 Catalyst NP size distribution at (a) 0 ppm, (b) 115 ppm and (c) 300 ppm. (d) High resolution STEM images of NPs at 0 ppm, 115 ppm and 300 ppm H2O. | ||
To explore the mechanism of the influence of water on catalyst NP nucleation, we performed quantum chemical molecular dynamics (MD) simulations of NP nucleation with and without an ambient water atmosphere. We observed that the nucleation of Fe NPs is influenced by the concentration of ambient water. Fig. 4a shows that the addition of water decreases the number of Fe–Fe bonds formed during Fe NP formation. We can relate this to the diameter of the NPs. Fig. 4b shows the Fe NP diameter as a function of the water concentration. When no water is present, there is no impediment to Fe growth. Presumably the size of the catalyst particle here, ∼1.1 nm, is only limited by the number of atoms present in the simulation. The addition of water to the simulation limits this diameter, via the dissociation of water molecules and formation of Fe–O bonds on the NP surface. These Fe–O bonds hinder further catalyst growth, and ultimately limits the particle size. For a given ferrocene density, this increases the concentration of NPs present, consistent with DMA and STEM measurements. At higher water concentrations, however, a shift to a larger NP size is observed (Fig. 4b). The incorporation of O into the NP structure is proposed to lead to an increase in the NP diameter at high water concentrations, despite the decreased number of Fe–Fe bonds shown in Fig. 4a. These observations are consistent with the larger NPs observed by STEM when the water concentration used during FCCVD is 300 ppm.
 | ||
| Fig. 4 (a) Rate of Fe–Fe bonding and (b) catalyst NP size distribution at 300 ps during DFTB simulations of 50-atom catalyst NPs with a varying H2O molecule content at 1050 °C. | ||
Our investigation suggests that the addition of water influences the catalyst formation, which ultimately affects the growth of SWCNTs. The small NPs, synthesized at 115 ppm water, do not grow large diameter nanotubes, which is indicated by the absence of larger diameter (more than 1.3 nm) tubes and a decrease in the mean diameter from 1.20 nm to 1.10 nm, as shown in Fig. 2d. This, along with the removal of small diameter tubes (less than 1 nm) due to an oxidative environment, compresses the diameter distribution of SWCNTs and makes it obviously narrow. In addition, the synthesis of more uniform size distributed NPs at 115 ppm water narrows down the diameter distribution of SWCNTs. So, the addition of water into the ethylene-based FCCVD produced SWCNTs with a highly uniform structure at a higher yield by narrowing the diameter and chiral angle distribution.
Conclusions
In summary, we achieved continuous synthesis of SWCNTs with a very narrow chirality distribution using water as a growth promoter. By optimizing the water concentration, the diameter of the nanotubes was reduced from 1.30 nm to 1.10 nm. We observed an enormous shift in nanotube chirality from a random distribution at 0 ppm to a narrow distribution at 115 ppm with the content of chiral indices (9,8) and (8,7) enhanced to 45%. The impact of water on the nucleation and growth of NPs accounts for the narrow diameter distribution. Etching of less stable zigzag SWCNTs and nucleation of narrow size distribution of catalyst NPs were proposed to elucidate the narrow chirality distribution of SWCNTs. Nanotubes with narrow chirality distribution are desirable for transistor devices and nanoelectronics.Experimental
Synthesis of SWCNTs
SWCNTs were synthesized in an ethylene-based FCCVD reactor as described in our previous work (Fig. S1†).22 Briefly, 0.75 sccm of ethylene was used as the carbon source of which decomposition was balanced by 45 ccm of H2. The flow of N2 through the ferrocene cartridge was fixed at 40 sccm. H2O vapor was introduced into the reactor by bubbling N2 gas through a water-filled bubbler kept at 21 °C. A flow of 0 to 40 sccm of N2 was passed through the water bubbler, corresponding to 0 to 350 ppm of H2O.12 The total flow through the reactor was maintained at 346 sccm and the temperature of the reactor was fixed at 1050 °C.Characterization
The SWCNTs were characterized using various techniques including Raman spectroscopy (Horiba Jobin–Yvon Labram HR 800), optical absorption spectroscopy (Agilent Cary 5000) and electron diffraction (JEOL 2200FS Double Cs-corrected TEM). Chirality was determined by an intrinsic layer spacing method from the electron diffraction patterns.27 A Differential Mobility Analyzer (DMA, GRIMM Aerosol Technik GmbH & Co. KG, Germany) was employed for the online tracking of the number, size and concentration of catalyst particles as well as SWCNTs. The measurement of catalyst size was achieved from scanning transmission electron microscopy (aberration-corrected Nion UltraSTEM 100) micrographs.Theoretical simulation
The DFTB simulations employed the velocity-Verlet algorithm33 to integrate Newton's equations of motion with a time step of 1.0 fs. An NVT ensemble was enforced at 1050 °C using a Nose–Hoover chain thermostat.34,35 The quantum chemical potential energy and energy gradients were calculated “on the fly” at each MD iteration using the SCC-DFTB method36 with the trans3d-0–1 parameter set37 and a finite electronic temperature of 10![[thin space (1/6-em)]](https://www.rsc.org/images/entities/char_2009.gif) 000 K.38–40
000 K.38–40
The influence of ambient water on the formation of Fe NPs during FCCVD was simulated via 10 Fe5 clusters and either 0, 5, 10, 20 or 30 water molecules in a cubic simulation box with a side length of 3 nm. Trajectories were replicated 10 times for each simulation set (50 total trajectories), so that a representative chemical mechanism and statistically significant data were obtained.
Conflicts of interest
There are no conflicts to declare.Acknowledgements
The research leading to these results has received partial funding from the European Union Seventh Framework Programme (FP7/2007–2013) under the Grant Agreement No. 604472 (IRENA project) and the Aalto Energy Efficiency (AEF) Research Program through the MOPPI project. The research has also been partially supported by the Academy of Finland via projects 286546 (DEMEC) and 292600 (SUPER) as well as by TEKES Finland via projects 3303/31/2015 (CNT-PV) and 1882/31/2016 (FEDOC). The authors acknowledge the Finnish Academy of Science and Letters for the financial support of this research work. This work made use of the Aalto University Nanomicroscopy Center (Aalto-NMC) premises.References
- Y. Chen, Y. Zhang, Y. Hu, L. Kang, S. Zhang, H. Xie, D. Liu, Q. Zhao, Q. Li and J. Zhang, Adv. Mater., 2014, 26, 5898–5922 CrossRef CAS PubMed.
- T. W. Odom, J.-L. Huang, P. Kim and C. M. Lieber, J. Phys. Chem. B, 1998, 391, 62–64 CAS.
- T. W. Odom, J. L. Huang, P. Kim and C. M. Lieber, Nature, 1998, 391, 62–64 CrossRef CAS.
- A. Hassanien, M. Tokumoto, Y. Kumazawa, H. Kataura, Y. Maniwa, S. Suzuki and Y. Achiba, Appl. Phys. Lett., 1998, 73, 3839–3841 CrossRef CAS.
- A. D. Franklin, Science, 2015, 349, 6249 CrossRef PubMed.
- D. Sun, M. Y. Timmermans, Y. Tian, A. G. Nasibulin, E. I. Kauppinen, S. Kishimoto, T. Mizutani and Y. Ohno, Nat. Nanotechnol., 2011, 6, 156–161 CrossRef CAS PubMed.
- R. Saito, G. Dresselhaus and M. S. Dresselhaus, Phys. Rev. B: Condens. Matter Mater. Phys., 2000, 61, 2981–2990 CrossRef CAS.
- D. j. Bindle, M. Wu, F. C. Prehn and M. S. Arnold, Nano Lett., 2011, 11, 455–460 CrossRef PubMed.
- F. Yang, X. Wang, D. Zhang, J. Yang, D. Luo, Z. Xu, J. Wei, J. Q. Wang, Z. Xu, F. Peng, X. Li, R. Li, Y. Li, M. Li, X. Bai, F. Ding and Y. Li, Nature, 2014, 510, 522–524 CrossRef CAS PubMed.
- S. Zhang, L. Kang, X. Wang, L. Tong, L. Yang, Z. Wang, K. Qi, S. Deng, Q. Li, X. Bai, F. Ding and J. Zhang, Nature, 2017, 543, 234–238 CrossRef CAS PubMed.
- B. Yu, C. Liu, P. X. Hou, Y. Tian, S. Li, B. Liu, F. Li, E. I. Kauppinen and H. M. Cheng, J. Am. Chem. Soc., 2011, 133, 5232–5235 CrossRef CAS PubMed.
- B. Liu, H. Jiang, A. V. Krasheninnikov, A. G. Nasibulin, W. Ren, C. Liu, E. I. Kauppinen and H. M. Cheng, Small, 2013, 9, 1379–1386 CrossRef CAS PubMed.
- Z. Zhu, H. Jiang, T. Susi, A. G. Nasibulin and E. I. Kauppinen, J. Am. Chem. Soc., 2011, 133, 1224–1227 CrossRef CAS PubMed.
- Y. Liao, H. Jiang, N. Wei, P. Laiho, Q. Zhang, S. A. Khan and E. I. Kauppinen, J. Am. Chem. Soc., 2018, 140, 9797–9800 CrossRef CAS PubMed.
- B. Liu, H. Jiang, A. V. Krasheninnikov, A. G. Nasibulin, W. Ren, C. Liu, E. I. Kauppinen and H. M. Cheng, Small, 2013, 9, 1379–1386 CrossRef CAS PubMed.
- B. Liu, F. Wu, H. Gui, M. Zheng and C. Zhou, ACS Nano, 2017, 11, 31–53 CrossRef CAS PubMed.
- X. Wang, M. He and F. Ding, Mater. Today, 2018, 21, 845–860 CrossRef CAS.
- A. Kaskela, A. G. Nasibulin, M. Y. Timmermans, B. Aitchison, A. Papadimitratos, Y. Tian, Z. Zhu, H. Jiang, D. P. Brown, A. Zakhidov and E. I. Kauppinen, Nano Lett., 2010, 10, 4349–4355 CrossRef CAS PubMed.
- K. Hata, D. N. Futaba, K. Mizuno, T. Namai, M. Yumura and S. Iijima, Science, 2004, 306, 1362–1364 CrossRef CAS PubMed.
- A. R. Harutyunyan, G. Chen, T. M. Paronyan, E. M. Pigos, O. A. Kuznetsov, K. Hewaparakrama, S. M. Kim, D. Zakharov, E. A. Stach and G. U. Sumanasekera, Science, 2009, 326, 116–120 CrossRef CAS PubMed.
- F. Yang, X. Wang, J. Si, X. Zhao, K. Qi, C. Jin, Z. Zhang, M. Li, D. Zhang, J. Yang, Z. Zhang, Z. Xu, L. M. Peng, X. Bai and Y. Li, ACS Nano, 2017, 11, 186–193 CrossRef CAS PubMed.
- A. Hussain, Y. Liao, Q. Zhang, E. X. Ding, P. Laiho, S. Ahmad, N. Wei, Y. Tian, H. Jiang and E. I. Kauppinen, Nanoscale, 2018, 10, 9752–9759 RSC.
- A. Kaskela, Doctoral Thesis, Aalto University, 2013.
- A. Moisala, A. G. Nasibulin, S. D. Shandakov, H. Jiang and E. I. Kauppinen, Carbon, 2005, 43, 2066–2074 CrossRef CAS.
- G. A. Rance, D. H. Marsh, R. J. Nicholas and A. N. Khlobystov, Chem. Phys. Lett., 2010, 493, 19–23 CrossRef CAS.
- Y. Tian, H. Jiang, J. V. Pfaler, Z. Zhu, A. G. Nasibulin, T. Nikitin, B. Aitchison, L. Khriachtchev, D. P. Brown and E. I. Kauppinen, J. Phys. Chem. Lett., 2010, 1, 1143–1148 CrossRef CAS.
- H. Jiang, A. G. Nasibulin, D. P. Brown and E. I. Kauppinen, Carbon, 2007, 45, 662–667 CrossRef CAS.
- F. Ding, A. R. Harutyunyan and B. I. Yakobson, Proc. Natl. Acad. Sci. U. S. A., 2009, 106, 2506–2509 CrossRef CAS PubMed.
- Y. Tian, M. Y. Timmermans, S. Kivistö, A. G. Nasibulin, Z. Zhu, H. Jiang, O. G. Okhotnikov and E. I. Kauppinen, Nano Res., 2011, 4, 807–815 CrossRef CAS.
- W. Zhou, S. Zhan, L. Ding and J. Liu, J. Am. Chem. Soc., 2012, 134, 14019–14026 CrossRef CAS.
- R. Kimura, Y. Hijikata, C. A. Eveleens, A. J. Page and S. Irle, J. Comput. Chem., 2019, 40, 375–380 CrossRef CAS.
- M. F. C. Fiawoo, A. M. Bonnot, H. Amara, C. Bichara, J. Thibault-Pénisson and A. Loiseau, Phys. Rev. Lett., 2012, 108, 195503 CrossRef.
- W. C. Swope, H. C. Andersen, P. H. Berens and K. R. Wilson, J. Chem. Phys., 1995, 32, 505 Search PubMed.
- S. Nosé, J. Chem. Phys., 1984, 81, 511–519 CrossRef.
- W. G. Hoover, Phys. Rev. A, 1985, 31, 1695–1697 CrossRef PubMed.
- M. Elstner, D. Porezag, G. Jungnickel, J. Elsner, M. Haugk and T. Frauenheim, Phys. Rev. B: Condens. Matter Mater. Phys., 1998, 58, 7260–7268 CrossRef CAS.
- G. Zheng, H. A. Witek, P. Bobadova-Parvanova, S. Irle, D. G. Musaev, R. Prabhakar, K. Morokuma, M. Lundberg, M. Elstner, C. Köhler and T. Frauenheim, J. Chem. Theory Comput., 2007, 3, 1349–1367 CrossRef PubMed.
- M. Weinert and J. W. Davenport, Phys. Rev. B: Condens. Matter Mater. Phys., 1992, 45, 13709 CrossRef.
- R. M. Wentzcovitch, J. L. Martins and P. B. Allen, Phys. Rev. B: Condens. Matter Mater. Phys., 1998, 45, 11372 CrossRef PubMed.
- F. Wagner, T. Laloyaux and M. Scheffler, Phys. Rev. B: Condens. Matter Mater. Phys., 1998, 57, 2102 CrossRef CAS.
Footnote |
| † Electronic supplementary information (ESI) available. See DOI: 10.1039/d0nr01919d |
| This journal is © The Royal Society of Chemistry 2020 |