 Open Access Article
Hard X-ray-based techniques for structural investigations of CO2 methanation catalysts prepared by MOF decomposition†
Nils
Prinz‡
 a,
Leif
Schwensow‡
 b,
Sven
Wendholt‡
 c,
Andreas
Jentys
 d,
Matthias
Bauer
 *c,
Wolfgang
Kleist
 *b and
Mirijam
Zobel
 *a
*a
aChemistry Department, University Bayreuth, Universitätsstr. 30, Bayreuth 95447, Germany. E-mail: mirijam.zobel@uni-bayreuth.de
bFaculty of Chemistry and Biochemistry, Ruhr University Bochum, Universitätsstr. 150, 44801 Bochum, Germany. E-mail: wolfgang.kleist@rub.de
cFaculty of Science and Center for Sustainable Systems Design (CSSD), Paderborn University, Warburger Str. 100, Paderborn 33098, Germany. E-mail: matthias.bauer@upb.de
dDepartment of Chemistry, Technical University of Munich, Lichtenbergstr. 4, 85748 Garching, Germany
First published on 21st July 2020
Abstract
Thermal decomposition of metal–organic framework (MOF) precursors is a recent method to create well-dispersed metal centers within active catalyst materials with enhanced stability, as required for dynamic operation conditions in light of challenges caused by the renewable energy supply. Here, we use a hard X-ray-based toolbox of pair distribution function (PDF) and X-ray absorption spectroscopy (XAS) analysis combined with X-ray diffraction and catalytic activity tests to investigate structure–activity correlations of methanation catalysts obtained by thermal decomposition of a Ni(BDC)(PNO) MOF precursor. Increasing the decomposition temperature from 350 to 500 °C resulted in Nifcc nanoparticles with increasing particle sizes, alongside a decrease in Ni2+ species and strain-induced peak broadening. For lower temperatures and inert atmosphere, Ni3C and NiO phases co-existed. A graphitic shell stabilized the Ni particles. Compared to an inert atmosphere, reducing conditions led to larger particles and a faster decomposition of the MOF precursor. Catalytic studies revealed that the decomposition at an intermediate temperature of 375 °C in 5% H2/He is the best set of parameters to obtain high specific surface areas while maintaining particle sizes that feature many active Ni centers for the formation of CH4.
Introduction
The long-term storage of energy from renewable resources will be a key challenge for sustainable power supply within the next decades. In this scenario, excess energy from wind or solar sources can be utilized to operate electrochemical cells for water electrolysis, generating hydrogen in a sustainable way. This hydrogen can be subsequently used for the synthesis of valuable energy carriers. A promising approach within this “power to X” (P2X) concept is the methanation of CO2 according to the Sabatier reaction (eqn (1)).1,2| CO2 + 4H2 ⇌ CH4 + 2H2O (g) | (1) |
The formation of methane from CO2 can be formally described by a combination of the reverse water gas shift reaction (eqn (2)) and the methanation of CO (eqn (3)).
| CO2 + H2 ⇌ CO + H2O (g) | (2) |
| CO + 3H2 ⇌ CH4 + H2O (g) | (3) |
Typical catalyst systems for this transformation are supported Ni species due to their high activity and methane selectivity at relatively mild conditions.3 Since the catalytic performance depends strongly on the properties and the nature of the active Ni species and the support, various studies have been performed to enhance the catalytic performance and to study the reaction mechanisms.4 Improvements were achieved by optimizing the properties of the active Ni sites and their dispersion at the surface of the support materials.5–7 In many cases, the applied preparation routes lead to a surface or even bulk oxidation of the Ni particles at the end of the synthesis. Since metallic Ni species are required to catalyze the methanation reaction, these pre-catalysts need to be activated in a reducing atmosphere prior to the methanation reaction.
Due to the fluctuations in solar or wind energy, the hydrogen production will also be fluctuating, which represents a major challenge for the continuous operation of the methanation reactor, since the active catalyst is prone to deactivation by surface oxidation or sintering under dynamic feed conditions. Operando studies revealed a severe deactivation of active Ni species during periods of a hydrogen dropout.8,9 Consequently, for P2X reactions based on renewable energies, highly stable catalyst systems are required, which can tolerate fluctuating conditions at elevated temperatures without being deactivated under the resulting less reducing atmospheres during a hydrogen dropout.
In the present contribution, we have chosen the thermal decomposition of metal–organic framework (MOF) precursors as a promising approach for the synthesis of carbon-supported catalysts featuring unique properties.10,11 The so-called MOF-mediated synthesis (MOFMS) describes the treatment of a metal–organic framework in a defined atmosphere at elevated temperatures.12 During this process, the organic linkers of the MOF precursor are decomposed, oxidized or converted to carbonaceous species and the resulting materials typically feature high dispersions of metal nanoparticles, which are supported and stabilized by a carbon matrix.13,14
The easy synthesis, modifiability, versatility and high crystallinity make MOFs promising as precursor materials for the synthesis of catalytically relevant materials, which can feature high thermochemical resistance, improved longevity and hydrothermal stability.15–17 Depending on the decomposition conditions and possible post-synthetic modifications, different morphologies, compositions and surface properties can be obtained.12,18–20 This gives access to an exceptional freedom to tune and optimize the properties of catalysts synthesized by this rather new strategy. The decomposition of metal–organic frameworks has already been used to create catalytically active nanoparticles,21,22 electrode materials,23,24 nanoporous carbon materials25 and hybrid supercapacitors.26 To our knowledge, energy-related applications of such materials have rarely been studied. Previous studies primarily showcased the sustainability of Ni-MOF-derived carbon-confined nanoparticles for the methanation of CO2 or focused solely on the investigation of the geometry and electronic properties of the decomposed materials.27,28 However, the thermal decomposition and its multiple parameters impacting the final structure–activity correlations of the catalyst material have not been targeted at all.27
In the present work, we have chosen the metal–organic framework Ni(BDC)(PNO) as the precursor species, which features a well-defined crystal structure.29 Ni(BDC)(PNO) contains Ni2+ centers, which are cross-linked using benzene-1,4-dicarboxylate (BDC) and pyridine-N-oxide (PNO) molecules. The crystal structure (Fig. 1) is very similar to MIL-53 and contains one-dimensional channels. The Ni coordination can be described by distorted octahedral NiO6, but in contrast to the MIL-53 structure, the metal centers are not connected via OH groups parallel to the channels, but via PNO molecules, which leads to a blocking of the channels and a relatively low porosity of the framework.30
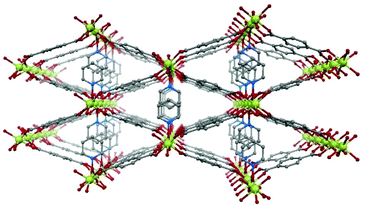 | ||
| Fig. 1 Schematic representation of the crystal structure of Ni(BDC)(PNO) with nickel atoms in green, oxygen atoms in red, nitrogen atoms in blue and carbon atoms in grey. Hydrogen atoms are omitted. | ||
To retain a carbonaceous matrix around the Ni species in the catalysts, the decomposition should be performed under inert or slightly reducing conditions to avoid combustion of the organic material. Core methods for the characterization of the precursor and the obtained catalyst materials are based on hard X-rays. X-ray absorption spectroscopy (XAS) and pair distribution function (PDF) analysis are very well suited to study the short-, medium- and long-range order of materials that potentially contain a high fraction of amorphous structures.
Synchrotron PDF experiments have recently been used to study MOFs and heterogeneous catalysts. The PDF is a real-space representation of all interatomic distances in the sample and, thus, its particular strength is the access to disordered structures with only short- to medium-range order. In the PDF, small structural transformations can be followed that occur when reaction conditions are varied.31,32 Here, the structure and size of small supported Ni species can be accessed. To obtain complementary information in an element-specific manner on the short-range order and oxidation state, XAS is a versatile tool. Both XANES (X-ray absorption near edge structure) and EXAFS (extended X-ray absorption fine structure) analysis are used for this purpose.33–39 XANES provides qualitative information for analysis of the oxidation states and EXAFS delivers the local structure for the averaged local structure of Ni species, including type, number and distance of coordinating atoms40
PDF and XAS are complemented by PXRD, physisorption and catalytic activity tests to establish first of all a proof of principle for the feasibility of the chosen approach to decompose MOFs with the aim of obtaining active methanation catalysts. In particular, the combination of PXRD, PDF and XAS, which are sensitive to structures of different degrees of disorder, allows to establish a detailed and highly differentiated structure–activity correlation.
Experimental section and methods
Synthesis of Ni(BDC)(PNO)
For the synthesis of Ni(BDC)(PNO), 9.887 g (34.00 mmol) of Ni(NO3)2·6H2O, 5.684 g (34.00 mmol) of terephthalic acid and 3.804 g (40.00 mmol) of pyridine-N-oxide were dissolved in 200 mL of dimethylformamide (DMF) in a 500 mL Schott flask using an ultrasonic bath. Subsequently, the reaction solution was heated to 120 °C for 18 h in an oven, and the resulting solid was filtered off from the hot mixture and washed with 1 × 100 mL of DMF, 2 × 60 mL of DMF and 1 × 60 mL of deionized water. The solid green material was dried over night at room temperature and subsequently for 3 days at 130 °C in air.Formation of methanation catalysts via thermal decomposition of Ni(BDC)(PNO) precursor
The methanation catalysts were synthesized by placing 800 mg of Ni(BDC)(PNO) in a glass boat in a tube furnace. The catalyst precursor was treated for 10 min in He with a flow rate of 102 mL min−1 and subsequently for 10 min in 102 mL min−1 of He, 5% H2/He or 10% H2/He, respectively. The samples were heated in the reaction gas mixture to temperatures between 350 °C and 500 °C with a heating ramp of 5 K min−1 and held at the final temperature for 1 h. Subsequently, the samples were treated in 102 mL min−1 of He and cooled to room temperature.Standard characterization methods
Powder X-ray diffraction was carried out at room temperature with a STOE STADI P Mythen2 4K diffractometer (Ge(111) monochromator; Ag Kα1 radiation, λ = 0.5594 Å) using four Dectris MYTHEN2 R 1K detectors in Debye–Scherrer geometry. Samples were measured in 1 mm diameter Kapton capillaries for 12 h. The Q-range was 20.4 Å−1. For more information on this dedicated diffractometer for pair distribution function analysis, see ref. 41. Inductively coupled plasma optical emission spectroscopy (ICP-OES) was performed with an iCAP 6500 Duo from Thermo Scientific via a six-point calibration. The software iTEVA9.8 was used for data processing. The thermal stability and the decomposition of Ni(BDC)(PNO) were investigated on a thermo balance Cahn TG-2131 in He atmosphere. 15 mg of the sample was heated from 40 °C to 1000 °C with a heating rate of 5 K min−1. For temperature programmed reduction (TPR) analysis, 59.3 mg of the sample was heated with 2 K min−1 with a gas flow of 84.1 mL min−1 in an atmosphere of 4.6% H2/Ar. The hydrogen consumption was determined using a Conthos 3 thermal conductivity detector.X-ray absorption spectroscopy
X-ray absorption experiments at the Ni K-edge (8333 eV) were carried out at PETRA III beamlines P64 and P65 at DESY in Hamburg (Germany). The PETRA III storage ring at DESY operates at 6 GeV particle energy with a current of 100 mA in top-up mode keeping the flux stable with 1%. While using the 1st harmonic, the measurements have been carried out in transmission mode using a Ni foil for calibration of the beam. Simultaneously, the foil has been measured during the sample measurements as a reference. For beamline P65, an 11 period mini-undulator is the photon source which is providing a moderate photon flux density and the incident energy is selected using a water-cooled Si(111), double crystal monochromator. At beamline P64, the photon source is a 2 m-long undulator. Specific energies are selected using a Si(111) double crystal monochromator. All samples were measured as pellets diluted with cellulose. For every sample, a XANES and EXAFS analysis was carried out.X-ray total scattering experiments
Total scattering data were acquired both on the laboratory diffractometer and at Petra III P21.1 beamline at the DESY facility in Hamburg with an X-ray energy of 102 keV (wavelength of 0.1215 Å). At the beamline, all samples were measured in Kapton capillaries with a diameter of 1 mm for 200 seconds. The powder diffraction patterns were collected using a Pilatus CdTe 2M detector, resulting in a Q-range of 0.5–22.4 Å−1. Radial integration was done with the software xpdtools,42 PDF calculation with PDFgetX3![[thin space (1/6-em)]](https://www.rsc.org/images/entities/char_2009.gif) 43 and PDF modelling with diffpy-cmi.44
43 and PDF modelling with diffpy-cmi.44
Transmission electron microscopy
Transmission electron microscopy images were collected using a JEOL JEM-2200FS equipped with a Schottky field-emission gun operated at 200 kV and a magnetic in-column omega type energy filter. Images were acquired using a GatanOneView imaging filter with a CMOS camera. Samples were prepared by dipping a lacey carbon film coated on a copper grid (Electron Microscopy Sciences) into the sample powder. For determination of particle sizes, about 200 particles were counted for each sample.CO2 hydrogenation studies
For the CO2 hydrogenation studies, 40 mg of the pre-catalysts was diluted with 160 mg SiC in a stainless-steel u-tube reactor coated with Silconert2000 and activated at 350 °C for 2 h with 2 K min−1 in H2 atmosphere to generate the active methanation catalyst. The CO2 hydrogenation was then performed with 30 mL min−1 of a stoichiometric gas composition of CO2![[thin space (1/6-em)]](https://www.rsc.org/images/entities/char_2009.gif) :
:![[thin space (1/6-em)]](https://www.rsc.org/images/entities/char_2009.gif) H2 = 1
H2 = 1![[thin space (1/6-em)]](https://www.rsc.org/images/entities/char_2009.gif) :
:![[thin space (1/6-em)]](https://www.rsc.org/images/entities/char_2009.gif) 4 and 3 mL min−1 Ar as an internal standard. The temperature was increased with a ramp of 5 K min−1 and the methanation activity was tested at 250 °C, 275 °C, 300 °C, 325 °C, 350 °C, 375 °C, 400 °C and 425 °C. The products were separated with the help of a CP-Al2O3/KCl capillary, a PoraPLOT Q capillary and a MolSieve 5 Å and analyzed using GC-2010 systems from Shimadzu with a thermal conductivity detector and two flame ionization detectors. To determine the CO2 conversion and the product yields, the peak areas of CO2, CO and CH4 were correlated to the gas feeds and to the peak area of Ar as an internal standard to exclude volume changes caused by the CO2 methanation.
4 and 3 mL min−1 Ar as an internal standard. The temperature was increased with a ramp of 5 K min−1 and the methanation activity was tested at 250 °C, 275 °C, 300 °C, 325 °C, 350 °C, 375 °C, 400 °C and 425 °C. The products were separated with the help of a CP-Al2O3/KCl capillary, a PoraPLOT Q capillary and a MolSieve 5 Å and analyzed using GC-2010 systems from Shimadzu with a thermal conductivity detector and two flame ionization detectors. To determine the CO2 conversion and the product yields, the peak areas of CO2, CO and CH4 were correlated to the gas feeds and to the peak area of Ar as an internal standard to exclude volume changes caused by the CO2 methanation.
Results and discussion
Standard characterization of catalyst precursor and pre-catalyst
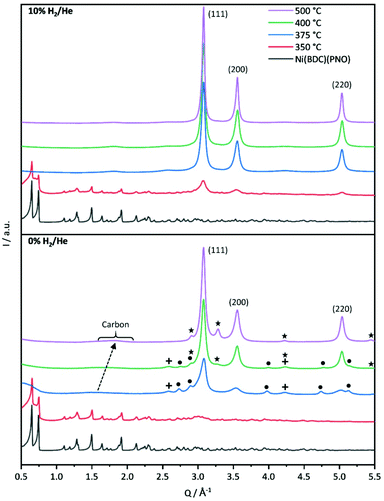
Powder X-ray diffraction analysis of Ni(BDC)(PNO) shown in Fig. 2 proves that the MOF precursor is obtained as a highly crystalline material with a structure that is closely related to MIL-53 and in accordance with the structure reported by Munn et al.29ATR-IR spectroscopy (see ESI, Fig. S2†) reveals that only small amounts of free N,N-dimethylformamide (IR bands around 1100 cm−1 and 1670 cm−1) and no significant amounts of free pyridine-N-oxide (IR band at 1243 cm−1) or free terephthalic acid (IR bands at 2500 cm−1 – 2600 cm−1) are present in the pores of Ni(BDC)(PNO).45–47 Therefore, the linker molecules are mostly incorporated in the framework of Ni(BDC)(PNO), which results in carboxylate vibrations at 1380 cm−1 and 1571 cm−1 and N–O vibrations at 1213 cm−1, respectively (see ESI†).46,48 The BDC/PNO ratio could be determined to 1.05![[thin space (1/6-em)]](https://www.rsc.org/images/entities/char_2009.gif) :
:![[thin space (1/6-em)]](https://www.rsc.org/images/entities/char_2009.gif) 1 via1H NMR spectroscopy (Fig. S3†), which is in good accordance with the expected ratio of 1
1 via1H NMR spectroscopy (Fig. S3†), which is in good accordance with the expected ratio of 1![[thin space (1/6-em)]](https://www.rsc.org/images/entities/char_2009.gif) :
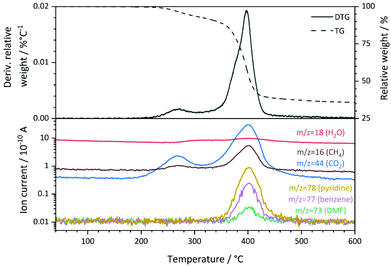
:![[thin space (1/6-em)]](https://www.rsc.org/images/entities/char_2009.gif) 1. The specific surface area of 7 m2 g−1 that was derived from N2 physisorption experiments using the BET method (Table S2†) is low compared to other metal–organic frameworks, but can be explained by the pore blocking of PNO linker molecules (schematically shown in Fig. 1). The first derivative of the TG signal (DTG curve, Fig. 3) features two main maxima at 270 °C and 398 °C, respectively, with a shoulder at approximately 376 °C. Quadrupole mass spectroscopy (QMS) revealed that the removal of solvent molecules starts at temperatures around 220 °C (maximum rate at 270 °C), before the decomposition of the MOF lattice is initiated around 330° and reaches the highest decomposition rate at 398 °C. The small shoulder at 376 °C might indicate a second step during the decomposition process. CO2, CH4 and NO2 also feature a shoulder at this temperature in the mass spectrum. Since DMF is not thermally decomposed at this temperature and should only be present in small amounts as revealed by ATR-IR spectroscopy, the nitrogen containing species will likely originate from PNO.
1. The specific surface area of 7 m2 g−1 that was derived from N2 physisorption experiments using the BET method (Table S2†) is low compared to other metal–organic frameworks, but can be explained by the pore blocking of PNO linker molecules (schematically shown in Fig. 1). The first derivative of the TG signal (DTG curve, Fig. 3) features two main maxima at 270 °C and 398 °C, respectively, with a shoulder at approximately 376 °C. Quadrupole mass spectroscopy (QMS) revealed that the removal of solvent molecules starts at temperatures around 220 °C (maximum rate at 270 °C), before the decomposition of the MOF lattice is initiated around 330° and reaches the highest decomposition rate at 398 °C. The small shoulder at 376 °C might indicate a second step during the decomposition process. CO2, CH4 and NO2 also feature a shoulder at this temperature in the mass spectrum. Since DMF is not thermally decomposed at this temperature and should only be present in small amounts as revealed by ATR-IR spectroscopy, the nitrogen containing species will likely originate from PNO.
The main signal of the DTG curve can be attributed to the collapse of the framework, which is also supported by the observation of fragments from both organic linker molecules (pyridine-N-oxide at m/z = 78 and terephthalate at m/z = 77). No significant weight losses were observed below 200 °C and between 600 °C and 800 °C. The total weight loss of Ni(BDC)(PNO) during the thermal decomposition in He was approximately 64.2%.
Consequently, the decomposition of the Ni(BDC)(PNO) precursor was performed in the temperature range between 350 °C and 500 °C to study the potential influence of the decomposition process on the activity and structure of the resulting catalysts. To avoid a combustion of the organic linkers, which would be expected in oxygen-containing atmosphere, the MOF precursor was decomposed in inert or H2-containing atmospheres, as this might result in a stabilization of the active Ni particles in a carbonaceous matrix.
The relative Ni content in the samples strongly depends on the decomposition parameters (Table S1†). Only 23–27 wt% of Ni are found in the samples that were decomposed at 350 °C. Generally, more reducing atmospheres result in higher Ni loadings at identical decomposition temperatures, which is explained by the formation of volatile hydrocarbons via the hydrogenation of carbonaceous species in the presence of H2, leading to higher weight losses. In contrast, the specific surface areas increase to over 100 m2 g−1 from 350 °C to 375 °C for the hydrogen containing atmospheres compared to He atmosphere with 32 m2 g−1. Noticeably, the specific surface areas decrease for all atmospheres from 375 °C to 400 °C, but increase only for the He and the 5% H2/He atmosphere from 400 °C to 500 °C (Table S2†). The increase of the specific surface areas from 350 °C to 375 °C might be explained by a release of the pore-blocking pyridine-N-oxide molecules in Ni(BDC)(PNO) at lower temperatures. The collapse of the framework structure and the subsequent formation of porous carbonaceous species could then explain the decrease between 375 °C and 400 °C and the increase from 400 °C to 500 °C in He and 5% H2/He.
First insights into the structures after the decomposition are provided by powder XRD measurements shown in Fig. 2. The decomposition of the Ni(BDC)(PNO) precursors in He reveals that a temperature of 350 °C is not sufficient to destroy the MOF lattice completely. The intensities of the Ni(BDC)(PNO) reflections decrease, but are still visible in the diffraction pattern. In addition, the formation of small fractions of metallic and oxidic Ni nanoparticles is observed. At higher decomposition temperatures, crystalline Nifcc particles form, for which crystallite sizes of 15.9 nm and 15.0 nm at 400 °C and 500 °C, respectively, are determined using Williamson–Hall plots (Table S4†). Additionally, Ni3C and NiO appear as secondary phases denoted as dots and crosses. These secondary phases disappear at 500 °C. In their place, another hexagonal species with different lattice parameters evolves, likely interstitial-atom-free Nihcp.49 Amorphous carbon is visible in the PXRDs as a broad hump at 1.5 Å−1, which shifts to 1.8 Å−1 and gets narrower with temperature. This points towards a graphitization of the amorphous carbon.50,51
Decomposition in 5% H2/He (Fig. S4†) and 10% H2/He at 350 °C led to significantly lower intensities of the Ni(BDC)(PNO) reflections compared to the decomposition in He atmosphere, which is in line with a more efficient, but still incomplete decomposition of the framework structure. Furthermore, broad reflections indicate the formation of Nifcc at 350 °C already, which points toward a faster formation of nanoparticles in the presence of hydrogen. For both, 5 and 10% H2/He (Fig. 2), only Nifcc was observed after decomposition at 375 °C, 400 °C and 500 °C without contributions of other crystalline phases. Williamson–Hall analysis results in crystallite sizes of 18.8 nm, 15.9 nm and 21.9 nm in 5% H2/He and 17.5 nm, 18.8 nm and 20.2 nm in 10% H2/He, respectively (Table S4†). Further, Williamson-Hall analysis reveals a size anisotropy in the 200 crystal direction, as the 200 and 400 reflections lie above the linear regression of all other reflections (see Fig. S5†). The diameter in the 200 direction is smaller than in the other directions, approximately by 2.1–8.3 nm (respectively 10–45%) for the different samples (Table S4†). The exact origin of this anisotropy is subject of ongoing studies.
A significant amount of microstrain or defects such as stacking faults or dislocations exists in all samples, given by the slope of the linear regression in the Williamson Hall plots, decreasing with higher decomposition temperature. This contributes decisively to the Bragg peak broadening, resulting in an underestimation of particle sizes with other XRD methods like Scherrer analysis.
X-ray absorption spectroscopy
As can be seen in the PXRD data, a large fraction of X-ray amorphous structures are present in the catalysts obtained by decomposition of the Ni(BDC)(PNO) MOF. X-ray absorption spectroscopy (XAS) is a powerful tool to characterize such amorphous species due to its short range sensitivity.40,52–56 The XANES (X-ray absorption near edge structure) region of a XAS spectrum provides information about the oxidation state by means of the absorption edge and about the local structure in a fingerprinting manner by the first oscillations after the edge step. The XANES data obtained for the different catalysts are shown in Fig. 4.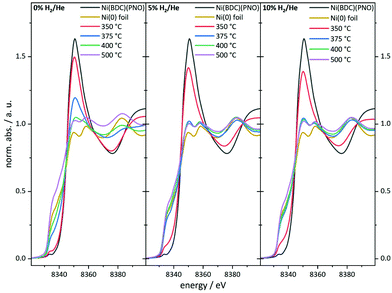 | ||
| Fig. 4 Ni K-edge XANES spectra of the catalyst precursor decomposed in an atmosphere containing 0% (left), 5% (middle) and 10% of hydrogen (right) in helium. | ||
In particular, the pre-edge region at around 8335 eV and the first resonance after the edge step, the so-called white line, in the range of 8345–8355 eV represents a first diagnostic tool to identify the formed structures in the decomposed MOF samples.
With increasing degree of reduction, the pre-edge signal intensity increases and approximates that of the Ni0 reference foil. Additionally, the white line intensity drops and splits into a doublet-like signal. Compared to the MOF precursor, treatment at 350 °C in He leads to a partial reduction of the Ni2+ centers, which is slightly more pronounced in the presence of 10% H2/He. By means of linear combination XANES fit57 using the MOF precursor and bulk nickel foil as references (Fig. 5), the individual fractions of Ni0 are determined resulting in values between 19% (0% H2/He) and 36% (10% H2/He), respectively (full table, see Table S5†).
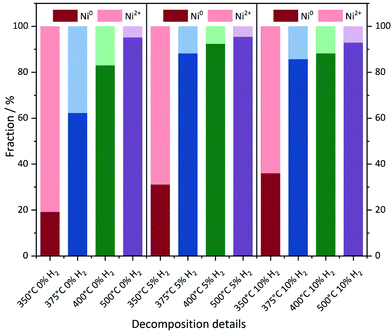 | ||
| Fig. 5 Linear combination fitting of the XANES spectra. Ni foil and the Ni(BDC)(PNO) precursor were used as the Ni0 and Ni2+ references, respectively. | ||
At 375 °C in He, the fraction of reduced Ni centers is increased. Still the white line is characteristic for Ni2+, but according to the LC-XANES fit, already 63% are present as Ni0. Contrary, the XANES spectrum of the sample decomposed at 375 °C in 10% H2/He exhibits a typical Ni0 doublet white line. Interestingly, here still a fraction of 14% Ni2+ is present. At 400 °C in 10% H2/He, the composition is only slightly changed and 88% Ni0 is found. Although a comparable white line intensity is observed at 400 °C in He and the LC-XANES analysis yields 83% Ni0, the white line shape indicates a much smaller Ni0 particle size deduced from the smeared out fine structure.58 After decomposition at 500 °C, the Ni0 fraction increases to 95% under inert conditions, but interestingly only to 93% in 10% hydrogen atmosphere. The samples have also been decomposed in a 5% H2/He atmosphere, representing intermediate conditions. For 350 °C, the amount of Ni0 is around 31%, which is in accordance with the findings in inert and 10% H2/He atmosphere. For higher temperatures, the amount of Ni0 in the 5% H2/He samples is similar to the samples, which were decomposed in 10% H2/He atmosphere. For 375 °C, the 5% H2/He sample shows a Ni0 amount of 88% in comparison to 86% for 10% H2. If the 400 °C samples are compared to each other, it is getting clear, that 92% of Ni0 are present, making it a similar amount as in the sample which has been decomposed at 500 °C in 10% H2/He atmosphere. In the comparable Ni@C-5%H2-500 sample 95% of Ni0 are observed. This fact also illustrates the weakness of the LC-XANES analysis. Although the Ni2+ reference is very well represented by the MOF precursor, the bulk Ni0 metal foil might be less suited to model the small nanoparticles that are present after reduction. In order to account for slightly shifting edge positions due to particle size effects, alternative fits were carried out with floating edge positions. The according fit results are shown in Table S5,† and only small changes are observed. The fractions of the obtained oxidation states can therefore be used with high confidence.
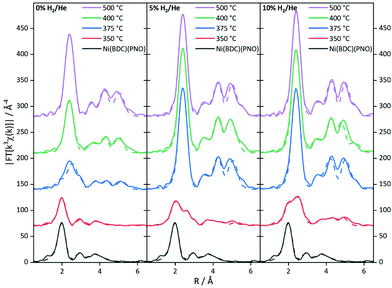
To further substantiate these results, an EXAFS analysis was carried out. Although this delivers mainly structural parameters, also information about the particle size and the composition of the decomposed samples can be gained. Fig. 6 shows the Fourier-transformed EXAFS spectra of the investigated samples.
The EXAFS results for the samples decomposed in He are summarized in Fig. S6 and Table S6.† In agreement with the XANES and PXRD results, treatment at 350 °C leaves the MOF structure intact to a large extent. The first coordination shell contains still six light backscatters. The Ni–C shell at 3.02 Å shows an increased coordination number, which might be indicative of the decomposition process. In turn, the higher contributions are reduced in intensity due to the same reason. At 375 °C, the Fourier-transformed spectrum already shows the onset of a significant Ni0 contribution with the formation of a Ni–Ni pair at 2.5 Å with 3.5 neighbors. Compared to the coordination number of twelve for bulk Ni0, this corresponds to a particle size of only 10–20 atoms.59,60 In contrast, the Ni–O coordination number in the first shell suggests a decomposition of the initial MOF structure by 50%. This is in rough agreement with the XANES analysis. Due to the very small particle size in the decomposed MOF sample, the bulk Ni foil is not fully suited as a reference in the LC-XANES fit and causes an error, potentially making the EXAFS data more reliable in this case. In turn, at 400 °C Ni0 is dominating the spectrum and no remaining MOF shells can be found in the EXAFS analysis anymore. From the first Ni–Ni contribution with a coordination number of 6.9, a particle size of around 1.2 nm is deduced (see Table 1 for particle sizes).59,60 Since the LC-XANES fit yields remaining 17% Ni2+, it might be discussed, whether this is an artefact of the LC-XANES approach or the consequence of a large degree of disorder in the remaining Ni2+ structures shading their visibility in the EXAFS analysis. A similar situation is found for the sample decomposed at 500 °C. In the first shell 8.1 Ni–Ni backscatterers can be seen at 2.5 Å distance. If the method for size estimation is used for the first shell it leads to 75 atoms resulting in roughly 1.5 nm particle size. It is interesting to note that a Ni–C shell was necessary to achieve a satisfactory quality of fit at elevated decomposition temperatures. Although the bond distance is too long for a direct Ni–C contact, this contribution could be tentatively assigned to the formation of a carbon shell around the nickel particles.
| Crystallite/particle sizes with different methods in nm | ||||||||||||
|---|---|---|---|---|---|---|---|---|---|---|---|---|
| Temperature | 0% H2/He | 5% H2/He | 10% H2/He | |||||||||
| TEM | XRD | XAS | TEM | XRD | XAS | TEM | XRD | XAS | ||||
| a Upper limit to size estimation according to the text is 6 nm. Due to the found coordination numbers, particles seem to be larger than this limit. b Bimodal distribution, average over all particle sizes. | ||||||||||||
| 350 °C | 12.6 ± 3.1 | — | 2.1 | <0.8 | 17.5 ± 4.0 | — | 5.7 | 1.0 ± 0.2 | 16.0 ± 3.1 | — | 6.2 | 0.9 ± 0.2 |
| 375 °C | 12.1 ± 3.7 | — | 4.8 | 1.0 ± 0.2 | 22.0 ± 5.2 | 18.8 + 4.1–2.8 | 8.8 | >6a | 20.4 ± 4.7 | 17.5 + 1.9–1.6 | 9.1 | >6a |
| 400 °C | 13.9 ± 4.8 | 15.9 + 4.6/−2.8 | 9.2 | 1.2 ± 0.3 | 19.6 ± 11.3b | 15.9 + 1.6–1.3 | 9.7 | >6a | 19.2 ± 4.3 | 18.8 + 2.3–1.8 | 9.7 | >6a |
| 500 °C | 16.5 ± 10.0b | 15.0 + 1.4–1.2 | 9.3 | 1.5 ± 0.3 | 21.7 ± 4.7 | 21.9 + 3.1–2.4 | 10.5 | 3.0 ± 1.0 | 23.7 ± 6.7 | 20.2 + 0.8–0.7 | 13.7 | >6a |
The EXAFS structure parameters for 5% H2/He are summarized in Table S7.† At 350 °C, a Ni–Ni coordination number of 2.7 is found at a distance of 2.5 Å. If this amount of nearly one fourth of the saturated fcc first shell is used for EXAFS size estimation, a particle size of 10 to 20 atoms, i.e. roughly 1 nm is obtained.59,60 The full fcc Ni–Ni coordination number of 12 at around 2.5 Å is observed at 375 °C. The high coordination number is in agreement with the LC-XANES fit of 88% Ni0 contribution in the sample. A very similar situation is found for decomposition at 400 °C. Since from a cluster size of roughly 6 nm the bulk coordination number of 12 is detected by EXAFS, the particle sizes in the 375 and 400 °C must be larger than this value.
Decomposition at 500 °C leads to a slightly reduced coordination number of 10.5 in the first shell at 2.47 Å. This corresponds to 87% of the bulk fcc value and a particle size of around 3 nm, thus a partial decomposition of the particles formed at 400 °C might be observed. However, due to the already large coordination numbers, the error is rather large.
The spectra of the samples decomposed in 10% H2/He (Fig. 6) show a distinctly different behavior (for details of the parameters see Table S8†). Already at 350 °C, a Ni–Ni shell at 2.48 Å characteristic of Ni0 is found. Additional Ni–Ni shells at 3.49 Å and 4.31 Å support this finding. The first three shells are indicating 8–10 atoms leading to particle sizes smaller than 0.8 nm. From the Ni–O coordination number a fraction of 80% precursor-like short range order can be concluded. Compared to the XANES analysis, this value is larger, and the small Ni0 particles are identified again as a potential source of error in the LC-XANES fit. Above 375 °C, bulk-like Ni–Ni coordination numbers are found. These nickel structures dominate the spectra in such a way that minor contributions of light atoms cannot be identified anymore. Due to the large Ni–Ni coordination numbers a particle size larger than 6 nm can be concluded from the 375 °C upwards.
X-ray total scattering
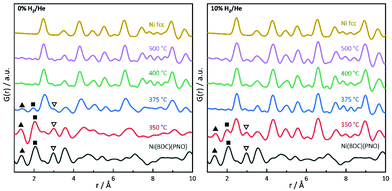
PDF analysis complements the XAS analysis by providing not only insight into the local coordination environment, but also the medium- to long-range structure in the nanometer range, as well as information about the local disorder and crystallite sizes.61,62In the PDFs, we can observe the MOF decomposition and the Ni0 particle growth for increasing temperatures, see Fig. 7 (left) for the decomposition in He. The comparison of the sample decomposed at 350 °C with the original MOF shows many remaining MOF peaks. For increasing temperatures, the interatomic C–C distance at 1.37 Å and the Ni–O distance at 2.0 Å decrease in peak height and are not distinguishable in the samples decomposed at 400 and 500 °C. Simultaneously, peaks appear and grow, which indicate a Nifcc structure and, thus, the formation of Ni0 particles (see Fig. 7). At 375 °C, an additional hexagonal phase, likely Ni3C can be observed via the broadening of the peaks at 2.65 and 4.60 Å and a shoulder at 7.00 Å (for a detailed overview of the difficulty to differentiate between Ni3C and Nihcp see ref. 63).64
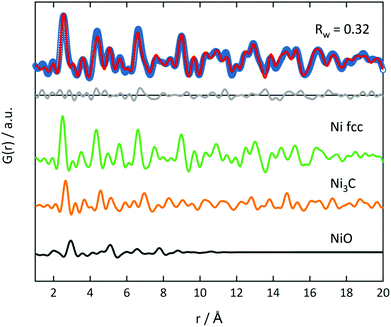
The fraction of this hcp phase decreases with increasing temperature and disappears at 500 °C. The contribution of this hcp phase in the 375 °C sample was investigated by the simultaneous refinement of three phases, consisting of Nifcc, Ni3C and NiO. NiO was additionally included as a third phase, as it further improved the fit quality indicating a nickel oxide formation during decomposition under inert conditions (Fig. 8). The goodness-of-fit Rw improved significantly from Rw = 0.54 for a single-phase fit of Nifcc to Rw = 0.32 with the additional Ni3C and NiO phases. For detailed refined final values see Table S9.† The relative fractions of the phases refined to 47% fcc, 38% Ni3C and 15% NiO for the sample decomposed at 375 °C, while the percentage of Nifcc increased to 55% for the sample decomposed at 400 °C with co-existing Ni3C (38%) and NiO (7%, Fig. S8†). Note, that the domain size of the hcp structure decreases from 5.4 nm at 375 °C to 1.4 nm at 400 °C, indicating the transformation of the hcp to the fcc structure.
In the range up to 10 Å, the samples decomposed at 400 and 500 °C differ only slightly (see Fig. 7, left). Stronger dampening of PDF peak heights in the 400 °C sample is visible in the high r-region indicating smaller crystalline domains (for longer range PDF see Fig. S10†). Overall, the dampening is consistently decreasing with temperature, which shows the growth of the crystallite domains.
In 5% and 10% H2/He at 350 °C, there are PDF peaks reminiscent of the initial MOF structure out to around 10 Å (see Fig. 7 and Fig. S7†). This corresponds approximately to the unit cell dimension of the MOF in b and c direction, but is smaller than the a lattice parameter of 19.3 Å.29 The interatomic distance at 3.56 Å in the MOF precursor originates from Ni–Ni pairs of Ni–O–Ni chains in the MOF, and it shortens to 3.53 Å at 350 °C and further to 3.51 Å at 400 °C. The latter distance of 3.51 Å can be ascribed to the second coordination shell of Ni atoms in Nifcc.65 This indicates that the Ni–O–Ni chains of the initial b-axes in the MOF are destroyed rather fast with increasing temperature. Yet at 350 °C, the Ni–O distance still remains intense due to remaining NiO6 octahedrons from the MOF lattice. The fact that the Ni–O and C–C distances vanish already at 375 °C in 5% H2/He and 10% H2/He can be explained by an accelerated framework decomposition, because of the reducing atmosphere.
The particle size in PDF is visible in the dampening of peaks with higher distances. PDF refinements were done for all samples and atmospheres to extract particle sizes. At 350 °C, spherical Nifcc nanoparticles with diameters of 2.1 nm, 5.7 nm and 6.2 nm form in 0% H2/He, 5% H2/He and 10% H2/He (Table 1). Generally, smaller nanoparticles form under inert conditions. With higher temperatures, PDF refinements show larger crystallite domains, for instance under inert conditions refined particle diameters grow from 2.1 nm at 350 °C to 9.2 nm for 500 °C final decomposition temperature. For reducing conditions, the same trend exists, yet with overall larger domain sizes. The strain, confirmed by Williamson–Hall plots, can lead to PDF peak shifts, additional peak broadening and a faster decay of G(r).66,67 The particle sizes estimated here by the decay of PDF peak heights, therefore underestimate the true particle diameters. Additionally, the strain-induced peak broadening is reflected in larger thermal displacement parameters Uiso for lower decomposition temperatures (Tables S4 and S10†). The trend of Uiso values is in accordance with the Williamson-Hall analysis.
Transmission electron microscopy/comparison of particle sizes from different methods
TEM analysis shows lognormal particle size distributions for most samples (Fig. 9). The mean diameters extracted from fits of lognormal distributions agree well with particle diameters from the Williamson-Hall analysis of XRD data that larger particles form at higher temperatures under all investigated atmospheres (Fig. S12 and S13†). This can be explained by an Ostwald ripening of the nanoparticles, which leads to a growth of larger particles and a shrinking of small particles.68,69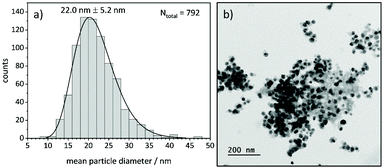 | ||
| Fig. 9 (a) Particle size distribution of Ni(BDC)(PNO) decomposed at 375 °C in 5% H2/He and (b) corresponding TEM image of the sample. | ||
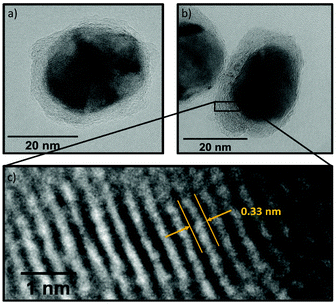
In TEM, it becomes evident that most of the nanoparticles are still embedded in the framework matrix at lower temperatures. Furthermore, the confinement of the nanoparticles in the matrix is more pronounced for the samples decomposed in He, supporting the findings of XRD, XAS and PDF, which show a faster decomposition of the framework in reducing atmosphere. This in fact hinders the extraction of particle sizes at lower temperatures, as the small particles cannot be distinguished from the metal–organic framework matrix. Further TEM analysis of single particles proves the presence of a graphitic carbon shell around the Ni particles (Fig. 10). This is visible in the ordered structure of the carbon matrix, which can clearly be distinguished from the amorphous carbon background of the TEM grid. The distance between the layers is approximately 0.33 nm, which is in accordance with the plane separation between two graphene layers and furthermore supports the finding of graphitic carbon, as non-graphitic carbon layers have a larger interlayer spacing.70 Based on the slight ellipsoidal shape of the particle in Fig. 10a/b, we evaluate the degree of particle anisotropy for the catalytically most active sample (375 °C in 5% H2/He sample) by separately extracting particle lengths and widths from TEM images. On average, particle lengths exceed particle widths by 14.3%, indicating a slightly ellipsoidal shape (Fig. S11†). Overall, the trends in nickel particle sizes determined from TEM and XRD match very well, while PDF and XAS underestimate particle sizes. In general, XRD (and PDF) data is more sensitive to larger particles, while TEM is equally sensitive to differently sized particles above a certain size limit. PDF underestimates the particle diameters due to the strain-induced peak broadening as discussed above, yet it provides valuable insight into the MOF residuals and simultaneous detection of multiple phases like Nifcc, Ni3C, Nihcp and NiO in refinements. On the contrary, XAS averages over all metal centers in the samples. It is thus also sensitive to very small clusters in the ensemble, which are not detected by TEM and XRD. Additionally, the error for size determination becomes very large for particles larger than 6–7 nm, which is therefore considered as a soft upper detection limit. Particles beyond that size do not change the coordination number anymore and thus XAS is blind for very large particles. The particle sizes determined by EXAFS analysis therefore due not contradict the other results.
Despite these different sensitivity ranges, all techniques indicate larger particles for higher decomposition temperatures. The carbonaceous matrix hides particularly small nanoparticles in the TEM images, so that the average diameters determined by TEM for samples 350–400 °C 0% H2/He and 350 °C 5/10% H2/He, likely overestimate the true average diameter. With TEM, we additionally observe that the sample decomposed at 500 °C in 0% H2/He shows a bimodal size distribution with a fraction of particle diameters <10 nm and larger particles with diameters >10 nm (Fig. S12†). A similar behavior is also found for decomposition in 5% H2/He, although the determined particle sizes at 500 °C are larger than under inert conditions. The largest particles are formed in 10% H2/He atmosphere.
Since the trends are the same under all applied decomposition conditions, a general statement about the methodical combination of TEM, XRD, PDF and XAS is possible here. From the TEM images shown in Fig. 9, it is obvious that only a broad Ni0 particle size distribution can be obtained with the proposed preparation method. This having said, it follows that the potential in situ methods PDF and XAS can only detect the average of these size distributions including the X-ray amorphous species in the catalyst. On the other hand, it can also be concluded that the applied method combination is currently necessary to collect all structural aspects of the catalysts prepared by MOF decomposition: TEM and XRD are suitable for larger particles with long range order, XAS for very small ones including amorphous structures and remaining MOF structures, and PDF to connect both ranges. The equivalence of XAS and PDF concerning the short-range order is also reflected in the coordination numbers obtained for the different coordination shells in the nanoparticles as shown in the ESI.†
According to the previous discussion, more simple characterization efforts can only be applied after a preparation method has been identified that yields phase-pure structures or a narrow distribution of particle sizes. Therefore, also the catalytic results discussed in the next section can only be correlated to the average structures in the catalysts.
Catalytic studies
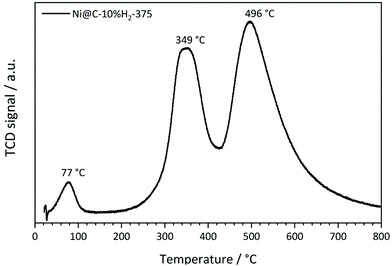
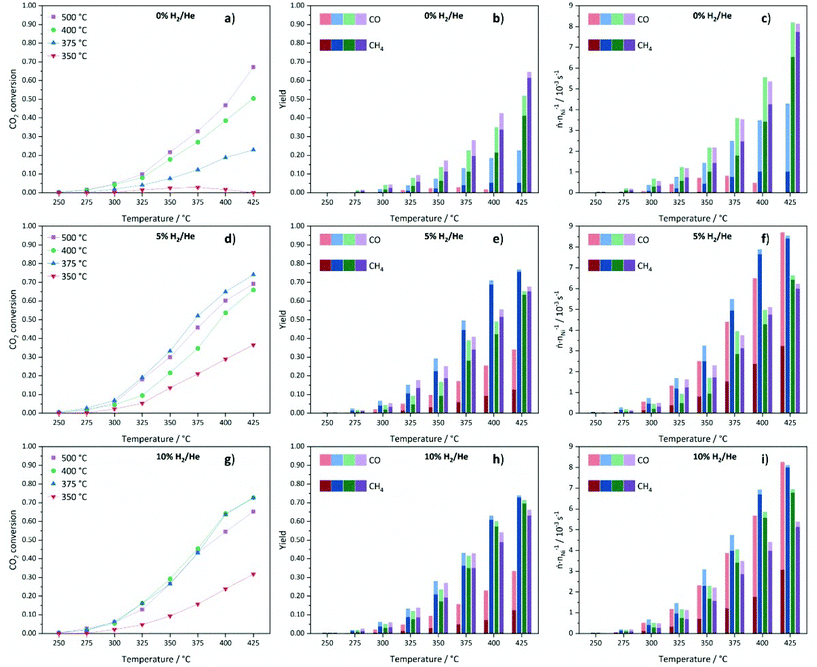
As a first step of the catalytic studies, TPR profiles are recorded to determine a suitable activation temperature for the reduction of oxidized surface Ni species in hydrogen atmosphere in the methanation reactor. Exemplarily, the result for the sample decomposed at 375 °C in 10% H2/He is shown in Fig. 11. It reveals three distinct signals. The peak at 77 °C can be assigned to the desorption or decomposition of physisorbed species from the catalyst precursor.71 The maximum at 349 °C corresponds to the reduction of amorphous NiO species in the catalyst to metallic Ni,71 which starts already at temperatures below 300 °C. The maximum at 496 °C is assigned to the hydrogenation of carbonaceous species to methane or other volatile hydrocarbons in the presence of Ni,72 which needs to be prevented during the activation process in order to retain the carbonaceous matrix around the Ni particles. This behavior is in accordance with the results of the ICP-OES measurements, since the Ni metal loading is increasing with rising decomposition temperature and hydrogen content. To minimize losses of the carbon matrix during the activation prior to methanation, the decomposed pre-catalysts were therefore reduced at 350 °C for 2 h in hydrogen atmosphere.The catalytic data for methanation of CO2 at atmospheric pressure are compared in Fig. 12 for the catalysts prepared at different decomposition temperatures and atmospheres. Beside the desired product methane, also CO and minor traces of ethane are detected as side products, but the latter one is neglected in the following due to its very low amount.
Low CO2 conversions are observed at 250 °C for all materials and they increase with rising reaction and decomposition temperature. The catalysts decomposed in 0% H2/He show a good correlation between the decomposition temperature and the catalytic performance (Fig. 12a). Generally, higher decomposition temperatures lead to higher CO2 conversions. The very low activity of Ni@C-0%H2-350 is in accordance with the incomplete decomposition of the metal–organic framework precursor and, thus, a relatively high fraction of catalytically inactive Ni centers. The decrease in conversion above a reaction temperature of 350 °C for this sample can be explained by a further framework decomposition at reaction temperatures above the decomposition temperature, which does not yield highly active Ni sites. The Ni@C-0%H2-500 catalyst features the highest CO2 conversion of 67% with a methane selectivity of 91% at 425 °C. In comparison, the material decomposed at 400 °C shows both lower conversion (50%) and methane selectivity (81%). Remarkably, the decomposition at 375 °C leads to much lower CO2 conversion (23%) and, more importantly, a low selectivity towards methane (23%), while large amounts of CO are formed. The very low CH4 yield for Ni@C-0%H2-375 can be explained by the additional presence of the hcp phase, which is inactive for the methanation reaction and instead favors the production of CO.73
Note that the methane yield (see Fig. 12b) increases with increasing decomposition temperature. In Fig. 12c, the productivity normalized to the relative Ni content of the samples is plotted to evaluate the performance of the catalysts with respect to the number of Ni centers. Considering the normalized molar product yields at a reaction temperature of 425 °C (Fig. 12c), the Ni@C-0%H2-500 catalyst shows the highest productivity with a very high selectivity towards CH4, followed by Ni@C-0%H2-400 and Ni@C-0%H2-375. The increasing activity of the catalysts with increasing decomposition temperature can be explained by the absence of Nihcp, Ni3C and NiO and, consequently, the exclusive presence of catalytically active Nifcc in Ni@C-0%H2-500. The results are also in accordance with the particle size investigations, since the decomposition in inert atmosphere does not lead to significant sintering at high temperatures (cf.Table 1), and the high specific surface area of 127 m2 g−1 of Ni@C-0%H2-500 (compare Table S2†), which both favor a high dispersion and, thus, an increasing amount of active Ni centers. For the catalysts that were decomposed in 5% H2/He, the CO2 conversions are very low at 250 °C (<1%), as shown in Fig. 12d, whereas an increase of the reaction temperature to 425 °C results in significantly higher conversions of CO2 (37%–74%). In general, the methane yields are increasing at higher reaction temperature for all materials (Fig. 12e). Interestingly, the decomposition in 5% H2/He does not give the same activity trend for the four catalysts of the series, which has been observed in inert atmosphere. While Ni@C-5%H2-350 still features the lowest activity and methane selectivity, Ni@C-5%H2-375 turns out to be the most active sample, resulting in a CO2 conversion of 74% and a methane selectivity close to 100% at a reaction temperature of 425 °C. Both samples decomposed at higher temperatures, Ni@C-5%H2-400 (66% conversion at 425 °C) and Ni@C-5%H2-500 (69% conversion at 425 °C), are less active. This activity trend correlates with the specific surface area of the three samples (cf. Table S2†), since Ni@C-5%H2-375 (102 m2 g−1) exhibits a larger surface area than Ni@C-5%H2-400 (56 m2 g−1) and Ni@C-5%H2-500 (89 m2 g−1). The decrease of the specific surface area at higher decomposition temperatures can be explained by a partial gasification of the porous carbon support under these conditions, which results in a higher relative Ni content (cf. Table S1†). Furthermore, the particle sizes (cf.Table 1), show the same trend, as slightly smaller particles are obtained after decomposition at 375 °C in comparison to 400 °C and 500 °C. In addition, the observed strain or defects in the particles might be a possible reason for the different reactivity of the samples. Decomposition at high temperatures results in less defects in the particles, which might be leading to a different surface structure with a lower number of highly exposed Ni sites. The productivity of the catalysts normalized to the Ni content (Fig. 12f), is in accordance with these observations, since Ni@C-5%H2-375 produces the largest amounts of methane, followed by Ni@C-5%H2-400 and Ni@C-5%H2-500. Remarkably, the Ni@C-5%H2-350 catalyst shows a very high CO selectivity, while the methane yield is much lower than for all other catalysts of the series.
Consequently, the activity of the catalysts of this series seems to correlate with the dispersion and particle size of the Ni species in the carbon matrix, which gives also an explanation for the high methane selectivity of the Ni@C-5%H2-375 catalyst.
Finally, the catalysts that are prepared in 10% H2/He, have also been tested in the methanation reaction and also for this series low CO2 conversions are obtained for all materials at 250 °C, which start to steadily increase with rising reaction temperature (shown in Fig. 12g). Like in the other atmospheres, the sample that was decomposed at 350 °C is significantly less active than the other three samples, which can be explained by the incomplete destruction of the MOF lattice and the high fraction of inactive Ni centers. Therefore, activity trends are only discussed for the other three samples of the series. The highest CO2 conversions are achieved for the Ni@C-10%H2-375 and Ni@C-10%H2-400 samples with 73% at 425 °C. The sample that was decomposed at 375 °C features a slightly higher methane yield (73% vs. 69%), but both catalysts reach methane selectivities close to 100%. Similar to the materials that were decomposed in 5% He/H2, smaller Ni nanoparticles seem to be beneficial for the methanation reaction, since the CO2 conversion is decreased for Ni@C-10%H2-500 (65%) with larger particle size. Also for this series, high decomposition temperatures lead to less defects in the Ni particles, which might be another explanation for the reduced catalytic activity of these catalysts. All three samples decomposed in 10% H2/He at 375 °C, 400 °C and 500 °C feature very high methane selectivities above 95%. These observations can be understood considering the adsorption strength of intermediate COads species, which increases with increasing particle sizes.74 A longer residence time of the CO molecules at the surface of the Ni particles increases the probability to react to methane, but inhibits the adsorption of gaseous CO2 molecules by blocking adsorption sites. As a consequence, larger Ni particles enhance the formation of CH4, but decrease the CO2 conversion. The determined specific surface areas (cf. Table S2†) follow the same trend as the catalytic activity. The most active catalyst material Ni@C-10%H2-375 (111 m2 g−1) features a larger specific surface area than Ni@C-10%H2-400 (77 m2 g−1) and Ni@C-10%H2-500 (63 m2 g−1), which is again in line with the increasing relative Ni contents (cf. Table S1†) due to a partial gasification of the stabilizing carbon shell. The highest production rate of methane in relation to the Ni content (Fig. 12i) is also achieved with the Ni@C-10%H2-375 catalyst.
In summary, the decomposition at an intermediate temperature of 375 °C and in an atmosphere with intermediate hydrogen content (5% H2/He) seems to be the best set of parameters to obtain a high specific surface area of the carbon matrix and a relatively small particle size of Ni, which results in a high dispersion of highly active Nifcc centers.
In general, our observations are in accordance with the findings of Tayal et al.,28 who also reported that higher decomposition temperatures lead to a more pronounced decomposition of Ni-MOF precursors and larger Ni particles. However, these authors have described the structure of their catalyst as a mixture of Ni nanoparticles and a residual MOF phase without considering the fact that organic linkers break and disintegrate at high decomposition temperatures. This disintegration of organic linkers, which has been confirmed at temperatures above 350 °C in the present work, results in the formation of a graphitic shell around the Ni nanoparticles, which seems to be beneficial for the catalytic performance and probably also for the long-term stability of our novel catalysts compared to systems that are prepared using conventional preparation methods. Our observations concerning the MOF decomposition and carbon layer formation are also in accordance with a study by Lin et al.27 on a MOF-derived methanation catalyst. However, the present investigation represents one of the first systematic studies concerning the impact of a wide range of decomposition parameters on the final structures and the activity of Ni-based methanation catalysts that have been prepared via the controlled decomposition of MOF-based precursors. Such systematic studies are essential to establish structure–activity correlations for targeted catalyst preparation.
Conclusions
The present work has proven that the controlled thermal decomposition of metal–organic framework precursors is a promising synthesis route for the preparation of highly active Ni@C catalysts for the methanation of carbon dioxide. The decomposition of Ni(BDC)(PNO) was performed at four different temperatures (350, 375, 400 and 500 °C) in three different atmospheres (0%, 5% and 10% H2 in He) and the resulting materials were studied using a wide variation of characterization techniques, including X-ray absorption spectroscopy (XAS) and pair distribution function (PDF) analysis to reveal structure–activity correlations. In combination with standard characterization methods, the two complementary hard X-ray-based techniques proved that a decomposition at 350 °C was not sufficient in all atmospheres to destroy the metal–organic framework completely, resulting in a very low catalytic activity of these three catalysts. Decomposition in inert atmosphere led to phase mixtures of highly active Nifcc and undesired Ni3C and NiO impurities at medium temperatures (375 and 400 °C), which resulted in a lower activity than for the sample that was decomposed at 500 °C and contained only Nifcc. In contrast, for the decomposition in both reducing atmospheres the best catalytic performance was achieved with the catalysts that were decomposed at medium temperatures. This behavior can be explained by larger specific surface areas and the presence of a protective carbon shell around the Ni particles, which both favor the formation of smaller particles leading to a high dispersion of active Nifcc. In contrast, decomposition at 500 °C led to a partial gasification of the porous carbonaceous matrix, causing a reduced specific surface area and sintering of less strained Ni particles resulting in a lower catalytic activity. Ni@C-5%H2-375 emerged as the best catalyst, resulting in a CO2 conversion of 73% and a methane selectivity close to 100% at a reaction temperature of 425 °C. Consequently, medium decomposition temperatures and slightly reducing atmospheres appear to be ideal for the preparation of Ni@C catalysts via decomposition of the Ni(BDC)(PNO) precursor. Since the structures of the decomposed catalysts are very complex and contain both crystalline and amorphous components, only the unique combination of TEM, XRD, XAS and PDF enabled the establishment of the structure–activity correlations that have been presented in this work. As long as the available preparation methods for MOF decomposition do not yield a narrower size distribution of Ni0 particles, such an approach is mandatory to access the full width of possible active species.Conflicts of interest
There are no conflicts to declare.Acknowledgements
We acknowledge funding by the Deutsche Forschungsgemeinschaft (DFG, German Research Foundation) via SPP2080 (BA 4467/8-1, KL 2913/1-1, ZO 369/2-1). We thank Marco Schwarzmann and Oliver Scharold for TEM support and Ute Krämer and Petra Düchting for performing ICP-OES measurements. We further thank the Bavarian Polymer Institute (BPI) for access to the keylabs ‘Electron and Optical Microscopy’. We gratefully acknowledge beamtime at P21.1, P64 and P65 at DESY Petra III and Ann-Christin Dippel, Wolfgang Caliebe and Edmund Welter for support, and Soham Banerjee for discussion.Notes and references
- S. Rönsch, J. Schneider, S. Matthischke, M. Schlüter, M. Götz, J. Lefebvre, P. Prabhakaran and S. Bajohr, Fuel, 2016, 166, 276 CrossRef.
- P. Sabatier and J. B. Senderens, J. Chem. Soc., 1902, 82, 333 Search PubMed.
- G. A. Mills and F. W. Steffgen, Catal. Rev.: Sci. Eng., 1974, 8, 159 CrossRef.
- P. Frontera, A. Macario, M. Ferraro and P. Antonucci, Catalysts, 2017, 7, 59 CrossRef.
- T. A. Le, M. S. Kim, S. H. Lee, T. W. Kim and E. D. Park, Catal. Today, 2017, 293–294, 89 CrossRef CAS.
- H. Muroyama, Y. Tsuda, T. Asakoshi, H. Masitah, T. Okanishi, T. Matsui and K. Eguchi, J. Catal., 2016, 343, 178 CrossRef CAS.
- S. Danaci, L. Protasova, J. Lefevere, L. Bedel, R. Guilet and P. Marty, Catal. Today, 2016, 273, 234 CrossRef CAS.
- B. Mutz, P. Sprenger, W. Wang, D. Wang, W. Kleist and J.-D. Grunwaldt, Appl. Catal., A, 2018, 556, 160 CrossRef CAS.
- B. Mutz, A. M. Gänzler, M. Nachtegaal, O. Müller, R. Frahm, W. Kleist and J.-D. Grunwaldt, Catalysts, 2017, 7, 279 CrossRef.
- H.-L. Jiang, B. Liu, Y.-Q. Lan, K. Kuratani, T. Akita, H. Shioyama, F. Zong and Q. Xu, J. Am. Chem. Soc., 2011, 133, 11854 CrossRef CAS PubMed.
- B. Liu, H. Shioyama, H. Jiang, X. Zhang and Q. Xu, Carbon, 2010, 48, 456 CrossRef CAS.
- L. Oar-Arteta, T. Wezendonk, X. Sun, F. Kapteijn and J. Gascon, Mater. Chem. Front., 2017, 1, 1709 RSC.
- B. Liu, H. Shioyama, T. Akita and Q. Xu, J. Am. Chem. Soc., 2008, 130, 5390 CrossRef CAS PubMed.
- T. Kundu, S. C. Sahoo and R. Banerjee, Cryst. Growth Des., 2012, 12, 2572 CrossRef CAS.
- A. H. van Pelt, O. A. Simakova, S. M. Schimming, J. L. Ewbank, G. S. Foo, E. A. Pidko, E. J. M. Hensen and C. Sievers, Carbon, 2014, 77, 143 CrossRef CAS.
- M. T. Claure, S.-H. Chai, S. Dai, K. A. Unocic, F. M. Alamgir, P. K. Agrawal and C. W. Jones, J. Catal., 2015, 324, 88 CrossRef.
- M. D. Porosoff, X. Yang, J. A. Boscoboinik and J. G. Chen, Angew. Chem., Int. Ed., 2014, 53, 6705 CrossRef CAS PubMed.
- Y. Kimitsuka, E. Hosono, S. Ueno, H. Zhou and S. Fujihara, Inorg. Chem., 2013, 52, 14028 CrossRef CAS PubMed.
- Z. Long, L. Wei, L. Shuang, W. Jifei, W. Huanlei and C. Jiaxin, J. Mater. Chem. A, 2015, 3, 14210 RSC.
- M. van de Voorde and B. Sels, Nanotechnology in Catalysis, Wiley-VCH Verlag GmbH & Co. KGaA, Weinheim, Germany, 2017 Search PubMed.
- J. M. Zamaro, N. C. Pérez, E. E. Miró, C. Casado, B. Seoane, C. Téllez and J. Coronas, Chem. Eng. J., 2012, 195–196, 180 CrossRef CAS.
- J. Li, B. Wang, Y. Qin, Q. Tao and L. Chen, Catal. Sci. Technol., 2019, 9, 3726 RSC.
- Z. Guo, F. Wang, Y. Xia, J. Li, A. G. Tamirat, Y. Liu, L. Wang, Y. Wang and Y. Xia, J. Mater. Chem. A, 2018, 6, 1443 RSC.
- Y. Guo, X. Gao, C. Zhang, Y. Wu, X. Chang, T. Wang, X. Zheng, A. Du, B. Wang, J. Zheng, K. Ostrikov and X. Li, J. Mater. Chem. A, 2019, 7, 8129 RSC.
- W. Chaikittisilp, K. Ariga and Y. Yamauchi, J. Mater. Chem. A, 2013, 1, 14 RSC.
- J. Kim, C. Young, J. Lee, Y.-U. Heo, M.-S. Park, M. S. A. Hossain, Y. Yamauchi and J. H. Kim, J. Mater. Chem. A, 2017, 5, 15065 RSC.
- X. Lin, S. Wang, W. Tu, Z. Hu, Z. Ding, Y. Hou, R. Xu and W. Dai, Catal. Sci. Technol., 2019, 9, 731 RSC.
- A. Tayal, Y. Chen, C. Song, S. Hiroi, L. S. R. Kumara, N. Palina, O. Seo, M. Mukoyoshi, H. Kobayashi, H. Kitagawa and O. Sakata, Inorg. Chem., 2018, 57, 10072 CrossRef CAS PubMed.
- A. S. Munn, G. J. Clarkson, F. Millange, Y. Dumont and R. I. Walton, CrystEngComm, 2013, 15, 9679 RSC.
- C. Serre, F. Millange, C. Thouvenot, M. Noguès, G. Marsolier, D. Louër and G. Férey, J. Am. Chem. Soc., 2002, 124, 13519 CrossRef CAS PubMed.
- A. E. Platero-Prats, A. Mavrandonakis, L. C. Gallington, Y. Liu, J. T. Hupp, O. K. Farha, C. J. Cramer and K. W. Chapman, J. Am. Chem. Soc., 2016, 138, 4178 CrossRef CAS PubMed.
- Y. Lei, H. Zhao, R. D. Rivas, S. Lee, B. Liu, J. Lu, E. Stach, R. E. Winans, K. W. Chapman, J. P. Greeley, J. T. Miller, P. J. Chupas and J. W. Elam, J. Am. Chem. Soc., 2014, 136, 9320 CrossRef CAS PubMed.
- M. Bauer and C. Gastl, Phys. Chem. Chem. Phys., 2010, 12, 5575 RSC.
- M. Bauer, T. Kauf, J. Christoffers and H. Bertagnolli, Phys. Chem. Chem. Phys., 2005, 7, 2664 RSC.
- A. J. Dent, Top. Catal., 2002, 18, 27 CrossRef CAS.
- C. C. Scarborough, S. Sproules, T. Weyhermüller, S. DeBeer and K. Wieghardt, Inorg. Chem., 2011, 50, 12446 CrossRef CAS PubMed.
- S. C. E. Stieber, C. Milsmann, J. M. Hoyt, Z. R. Turner, K. D. Finkelstein, K. Wieghardt, S. DeBeer and P. J. Chirik, Inorg. Chem., 2012, 51, 3770 CrossRef CAS PubMed.
- N. M. Martin, F. Hemmingsson, X. Wang, L. R. Merte, U. Hejral, J. Gustafson, M. Skoglundh, D. M. Meira, A.-C. Dippel, O. Gutowski, M. Bauer and P.-A. Carlsson, Catal. Sci. Technol., 2018, 8, 2686 RSC.
- C. Nayak, P. Jain, C. P. Vinod, S. N. Jha and D. Bhattacharyya, J. Synchrotron Radiat., 2019, 26, 137 CrossRef CAS PubMed.
- M. Bauer and H. Bertagnolli, in Methods in Physical Chemistry, ed. R. Schäfer and P. C. Schmidt, Wiley-VCH, Weinheim, 2012, p. 231 Search PubMed.
- S. L. J. Thomae, N. Prinz, T. Hartmann, M. Teck, S. Correll and M. Zobel, Rev. Sci. Instrum., 2019, 90, 43905 CrossRef PubMed.
- C. J. Wright and X. D. Zhou, J. Synchrotron Radiat., 2017, 24, 506 CrossRef PubMed.
- P. Juhás, T. Davis, C. L. Farrow and S. J. L. Billinge, J. Appl. Crystallogr., 2013, 46, 560 CrossRef.
- P. Juhás, C. L. Farrow, X. Yang, K. R. Knox and S. J. L. Billinge, Acta Crystallogr., Sect. A: Found. Adv., 2015, 71, 562 CrossRef PubMed.
- A. Shastri, A. K. Das, S. Krishnakumar, P. J. Singh and B. N. R. Sekhar, J. Chem. Phys., 2017, 147, 224305 CrossRef PubMed.
- J. V. Quagliano, J. Fujita, G. Franz, D. J. Phillips, J. A. Walmsley and S. Y. Tyree, J. Am. Chem. Soc., 1961, 83, 3770 CrossRef CAS.
- C. Volkringer, T. Loiseau, N. Guillou, G. Férey, E. Elkaïm and A. Vimont, Dalton Trans., 2009, 2241 RSC.
- F. G. Sherif, Ind. Eng. Chem. Prod. Res. Dev., 1970, 9, 408 CrossRef CAS.
- R.-T. Chiang, R.-K. Chiang and F.-S. Shieu, RSC Adv., 2014, 4, 19488 RSC.
- Z. Q. Li, C. J. Lu, Z. P. Xia, Y. Zhou and Z. Luo, Carbon, 2007, 45, 1686 CrossRef CAS.
- A. M. Molodets and A. A. Golyshev, J. Exp. Theor. Phys., 2018, 126, 772 CrossRef CAS.
- R. P. W. J. Struis, T. J. Schildhauer, I. Czekaj, M. Janousch, S. M. A. Biollaz and C. Ludwig, Appl. Catal., A, 2009, 362, 121 CrossRef CAS.
- E. Keceli, M. Hemgesberg, R. Grünker, V. Bon, C. Wilhelm, T. Philippi, R. Schoch, Y. Sun, M. Bauer, S. Ernst, S. Kaskel and W. R. Thiel, Microporous Mesoporous Mater., 2014, 194, 115 CrossRef CAS.
- S. Schuster, E. Klemm and M. Bauer, Chem. – Eur. J., 2012, 18, 15831 CrossRef CAS PubMed.
- M. A. Gotthardt, R. Schoch, S. Wolf, M. Bauer and W. Kleist, Dalton Trans., 2015, 44, 2052 RSC.
- M. A. Gotthardt, R. Schoch, T. S. Brunner, M. Bauer and W. Kleist, ChemPlusChem, 2015, 80, 188 CrossRef CAS.
- M. Bauer, G. Heusel, S. Mangold and H. Bertagnolli, J. Synchrotron Radiat., 2010, 17, 273 CrossRef CAS PubMed.
- D. Bazin and J. J. Rehr, J. Phys. Chem. B, 2003, 107, 12398 CrossRef CAS.
- A. Jentys, Phys. Chem. Chem. Phys., 1999, 1, 4059 RSC.
- A. I. Frenkel, C. W. Hills and R. G. Nuzzo, J. Phys. Chem. B, 2001, 105, 12689 CrossRef CAS.
- S. J. L. Billinge and I. Levin, Science, 2007, 316, 561 CrossRef CAS PubMed.
- S. J. L. Billinge and M. G. Kanatzidis, Chem. Commun., 2004, 749 RSC.
- L. He, J. Magn. Magn. Mater., 2010, 322, 1991 CrossRef CAS.
- R. W. G. Wyckoff, Crystal structures, Wiley, New York, 1963, vol. 1 Search PubMed.
- K. Pirkkalainen and R. Serimaa, J. Appl. Crystallogr., 2009, 42, 442 CrossRef CAS.
- A. S. Masadeh, E. S. Božin, C. L. Farrow, G. Paglia, P. Juhas, S. J. L. Billinge, A. Karkamkar and M. G. Kanatzidis, Phys. Rev. B: Condens. Matter Mater. Phys., 2007, 76, 115413 CrossRef.
- B. Gilbert, F. Huang, H. Zhang, G. A. Waychunas and J. F. Banfield, Science, 2004, 305, 651 CrossRef CAS PubMed.
- C. J. Gommes, Nanoscale, 2019, 11, 7386 RSC.
- V. P. Zhdanov, E. M. Larsson and C. Langhammer, Chem. Phys. Lett., 2012, 533, 65 CrossRef CAS.
- G. E. Bacon, Acta Crystallogr., 1951, 4, 558 CrossRef CAS.
- J. Sá, Y. Kayser, C. J. Milne, D. L. A. Fernandes and J. Szlachetko, Phys. Chem. Chem. Phys., 2014, 16, 7692 RSC.
- A. Tomita, Y. Ohtsuka and Y. Tamai, Fuel, 1983, 62, 150 CrossRef CAS.
- Y. Guo, M. U. Azmat, X. Liu, J. Ren, Y. Wang and G. Lu, J. Mater. Sci., 2011, 46, 4606 CrossRef CAS.
- C. Vogt, E. Groeneveld, G. Kamsma, M. Nachtegaal, L. Lu, C. J. Kiely, P. H. Berben, F. Meirer and B. M. Weckhuysen, Nat. Catal., 2018, 1, 127 CrossRef CAS.
Footnotes |
| † Electronic supplementary information (ESI) available. See DOI: 10.1039/d0nr01750g |
| ‡ These authors contributed equally to this work. |
| This journal is © The Royal Society of Chemistry 2020 |

