 Open Access Article
Creative Commons Attribution 3.0 Unported Licence
Direct 3D printing of graphene using capillary suspensions†
Hui
Ding
 ab,
Suelen
Barg
ab and
Brian
Derby
 *ab
*ab
aDepartment of Materials, University of Manchester, Oxford Road, Manchester M13 9PL, UK. E-mail: brian.derby@manchester.ac.uk
bHenry Royce Institute, University of Manchester, Oxford Road, Manchester M13 9PL, UK
First published on 21st May 2020
Abstract
Conventional 3D printing of graphene requires either a complex formulation of the ink with large quantities of polymers or essential post-processing steps such as freeze drying to allow printability. Here we present a graphene capillary suspension (GCS) containing 16.67 wt% graphene nanoparticles in aqueous suspension with 3.97 wt% carboxymethyl cellulose (CMC) as a stabiliser and a small quantity of the immiscible liquid octanol. This is shown to have the appropriate rheological properties for 3D printing, which is demonstrated through the fabrication of a simple lattice structure by direct writing and air drying at room temperature. The printed structure has a porosity of 81%, is robust for handling with a compression strength of 1.3 MPa and has an electrical conductivity of 250 S m−1. After heat treatment at 350 °C conductivity is 2370 S m−1 but the strength reduces to 0.4 MPa. X-Ray tomography of the internal architecture after printing shows the formation of the capillary suspension eliminates ordering of the 2D materials during extrusion through the printer nozzle. Thus capillary suspensions can be used to direct write graphene 3D structures without the necessity of complicated drying steps or burn-out of large quantities of polymer additions, facilitating shape retention and property control as compared to current 2D material ink formulations used for 3D printing.
Introduction
Porous 3D graphene structures have previously been fabricated using both template-directed1 and template-free methods.2–5 For example, aerogels have been produced using chemical vapour deposition (CVD)6 or dip coating7,8 on nanoporous templates followed by template dissolution. Similar high specific surface area monoliths have been formed from graphene oxide hydrogels,2 and by freeze casting of aqueous suspensions of graphene materials9,10 and with other solvents.11 These latter methods can be readily combined with 3D printing (additive manufacturing) methods. A range of 3D printing strategies have been shown to be compatible with graphene, including direct writing (extrusion printing or robocasting),11–16 inkjet printing17 and stereolithography.18,19 Direct write printing requires shear thinning rheology of the inks with a distinct yield stress (Bingham behaviour).20 This is normally achieved using a complex formulation that includes viscosity modifiers, surfactants, dispersants, binders, plasticisers and humectants, in addition to the active material and solvent (Table S1†). This results in inks containing >25 wt% of polymer or large molecular weight organic additions.12–14 Consequently, extensive post-printing thermal treatment is normally required to remove these additives, enabling successful fabrication of robust 3D graphene structures with restored properties. Freeze casting methods use lower solvent loads but require freezing and subliming steps to achieve the desired porosity.13,16Here we propose an alternative method, using simpler graphene ink formulations based on the principles of capillary suspensions.21 A particulate suspension can be transformed to a capillary suspension when a small amount of an immiscible secondary liquid, which strongly wets the particles in suspension, is added. Given an appropriate balance of liquid/particle and liquid/liquid interfacial energies, the minority secondary liquid phase wets the particle surfaces and capillary forces lead to the formation of liquid bridges between adjacent particles in suspension. Thus forming a network within the primary liquid that is termed the pendular state (see Fig. 1). Koos and Willenbacher proposed that stable capillary bridges form when the triple junction contact angle between the secondary liquid and primary solution at the solid surface, θT < 90° (Fig. 1).21 This can be determined from the contact angles of the primary and secondary liquids on the particle measured in air, θ1 and θ2 respectively, with
 | (1) |
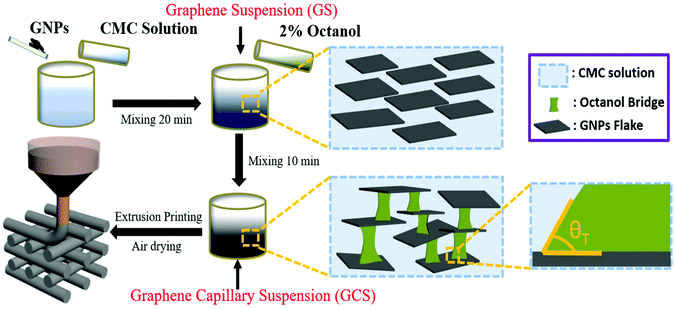 | ||
| Fig. 1 Schematic of ink manufacture and 3D printing with GCS. The secondary liquid (octanol) forms capillary bridges between the GNP flake when the 3-phase contact angle (θT) is less than 90°. | ||
Experimental section
Graphene capillary suspension preparation
Sodium carboxymethyl cellulose (CMC) (Sigma-Aldrich, Gillingham, Dorset, UK) was dissolved in de-ionised water to form a CMC solution (CMC polymer![[thin space (1/6-em)]](https://www.rsc.org/images/entities/char_2009.gif) :
:![[thin space (1/6-em)]](https://www.rsc.org/images/entities/char_2009.gif) Di-water is 1
Di-water is 1![[thin space (1/6-em)]](https://www.rsc.org/images/entities/char_2009.gif) :
:![[thin space (1/6-em)]](https://www.rsc.org/images/entities/char_2009.gif) 20 by weight). Graphene nanoplatelets, with average thickness ≈8 nm, diameter ≈5 μm, hence displaying an aspect ratio ≈600 (M5 GNP: XG Science Inc., Lansing, MI, USA), were added to the CMC solution and mixed in a Speed Mixer (Synergy Devices Ltd, Bucks, UK) at 1800 rpm for 10 minutes and then another 10 minutes at 2400 rpm to form a homogeneous 16.67 wt% graphene suspension (GS) (M5 GNP
20 by weight). Graphene nanoplatelets, with average thickness ≈8 nm, diameter ≈5 μm, hence displaying an aspect ratio ≈600 (M5 GNP: XG Science Inc., Lansing, MI, USA), were added to the CMC solution and mixed in a Speed Mixer (Synergy Devices Ltd, Bucks, UK) at 1800 rpm for 10 minutes and then another 10 minutes at 2400 rpm to form a homogeneous 16.67 wt% graphene suspension (GS) (M5 GNP![[thin space (1/6-em)]](https://www.rsc.org/images/entities/char_2009.gif) :
:![[thin space (1/6-em)]](https://www.rsc.org/images/entities/char_2009.gif) CMC polymer is 4.2
CMC polymer is 4.2![[thin space (1/6-em)]](https://www.rsc.org/images/entities/char_2009.gif) :
:![[thin space (1/6-em)]](https://www.rsc.org/images/entities/char_2009.gif) 1 by weight). Then 2 vol% octanol (Sigma-Aldrich) was added to the GS and the mixture was mixed for another 10 minutes at 2400 rpm to obtain the graphene capillary suspension (GCS). See Fig. 1 for a graphical schematic of the process.
1 by weight). Then 2 vol% octanol (Sigma-Aldrich) was added to the GS and the mixture was mixed for another 10 minutes at 2400 rpm to obtain the graphene capillary suspension (GCS). See Fig. 1 for a graphical schematic of the process.
Rheology measurements
All rheological properties were measured with a 60 mm 2.01° cone plate using a Discovery Hybrid Rheometer HR-3 (TA Instruments, New Castle, DE, USA). Viscosity measurements were made in the flow ramp mode at shear rates from 10−1 to 103 s−1. When measuring viscoelastic properties such as storage modulus G′, and shear modulus G′′, the oscillation amplitude mode is used, with oscillation stress ranging from 10−1 to 103 Pa. The peak hold testing was divided into three stages: (1) 0–60 s, shear rate: 0.1 s−1; (2) 60–120 s, shear rate: 200 s−1; (3) 120–180 s, shear rate: 0.1 s−1.Surface tension and contact angle measurement
Surface tension and contact angle measurements were conducted using Drop Shape Analysis (DSA) 100 (KRUSS GmbH, Hamburg, Germany). All experiments were carried at ambient laboratory temperature (20–25 °C) and relative humidity (20–40%). The surface tension and contact angle were measured using pendant and sessile drop methods, respectively. The surface tension of octanol and the CMC solution was measured in air. The interfacial tension between octanol and the CMC solution was determined by using an immersed pendant drop of the CMC solution (the denser phase) in octanol. Each measurement was repeated three times.3D printing and drying process
The graphene inks were dispensed using a 30 cm3 pressure driven syringe mounted on a translation platform (I&J 7300R-LF Robots, I&J Fisnar Inc. Germantown, WI, USA). Air pressure and nozzle/substrate translation speed were adjusted to print filaments with different diameters. The printed graphene structures were dried under ambient laboratory conditions.X-ray tomography
X-Ray tomographic analysis of GNP distribution and orientation was determined following procedures previously used to determine these parameters in composite materials.26 GS and GCS filaments with diameter of ≈300 μm were extruded through the robot printer and mounted on an aluminium pillar for tomographic imaging (Xradia Versa 520, Carl Zeiss, Jena, Germany) under a fixed energy of 50 kV. Projections for each sample were acquired in phase contrast mode with 100 s exposure time, 1600–1800 projections were used with a pixel size of 0.2482 μm. The obtained projections were reconstructed using XMReconstructor (version 9.1.12862, Carl Zeiss). All visualisation and thresholding was performed with the Avizo software package (version 9.5, ThermoFisher Scientific, Waltham, MA, USA). Segmentation was performed through global thresholding, followed by removal of islands of volume less than 15 pixels. The porosity was calculated through the Avizo Label Measures. The orientations of the GNPs flakes were analysed using ImageJ (ImageJ, NIH, Bethesda, MA, USA) with the Plugin, OrientationJ.TGA, SEM and Raman characterization
Thermogravimetric analysis (TGA) was carried out from room temperature (28 °C) to 1000 °C at a scanning rate of 10 °C min−1 in air using a TGA Q500 (TA Instruments). The scanning electron microscope (SEM) images were obtained using a (Zeiss Ultra 55) in secondary electron mode. A Raman spectrometer (Horiba LabRAM HR Evolution system) with a laser wavelength excitation of 633 nm was used to characterize the raw M5 GNP flakes, and the extruded samples GS and GCS.Mechanical testing
The GCS and GS mechanical samples were prepared by the injection of the suspensions into cylindrical Teflon moulds. Normally it took 4–6 days for the samples to fully dry, after which the top and bottom parts of the prepared GCS and GS cylinders were cut into flat parallel faces for mechanical testing. The samples were tested using an Instron load frame (3340 Instron, High Wycombe, UK) with a 500 N load cell at a displacement rate of 1 mm min−1 until failure.Electrical conductivity testing
The printed filaments were annealed at 200, 250, 300 and 350 °C for 30 minutes, after which their electrical resistance was determined from the potential difference between two probes contacted on the surface of the printed filaments, measured using a 2182A nanovoltmeter (Keithley Instruments, Cleveland, OH, USA), through which a constant current flowed, from a 6220 current source (Keithley Instruments). The surface profiles and dimensions of the width and thickness of the printed filaments were measured using a DektakXT stylus surface profilometer (Bruker AXS GmbH, Karlsruhe, Germany). Electrical conductivity, σ, was calculated using the equation , where σ is the electrical conductivity, ρ is the electrical resistivity, and L, S and R are the filament length, cross-sectional area and the measured electrical resistance, respectively.
Results and discussion
The graphene phase is stabilised in aqueous suspension (the primary suspension) through the presence of 3.97 wt% CMC in solution and the addition of a small quantity of the immiscible liquid octanol (secondary liquid). The resulting material has a very high viscosity under static conditions and is effectively rigid (ESI, Fig. S1†). The interfacial tensions of the CMC solution/air, octanol/air and CMC/octanol interfaces, measured using the pendant drop method, along with the contact angles of the CMC solution and octanol on a GNP surface are displayed in Table 1 (see ESI Fig. S2†). The contact angle at the CMC/octanol/graphene triple point has been computed (using eqn (1)) to give, θT = 69. Hence as θT < 90°, the three phase system is expected to be in the pendular state (Fig. 1, final column).21| CMC sol./air | Octanol/air | CMC sol./octanol | |
|---|---|---|---|
| Interfacial tension Γxy (mN m−1) | 68.7 − ΓV1 | 31.0 − ΓV2 | 43.0 − Γ12 |
| Contact angle on GNP surface | 77° | ≈0° | θ T = 69° (computed) |
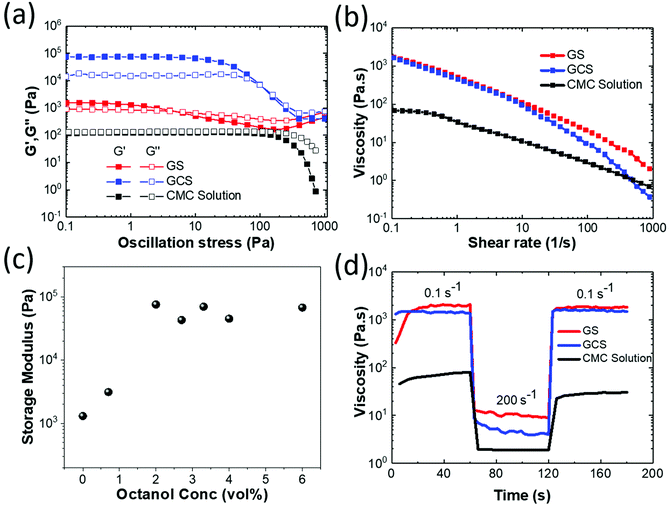
The rheological behaviour of the three fluids used in the study: GCS containing 16.67 wt% GNP and 2 vol% octanol, GS also containing 16.67 wt% GNP but without octanol and the parent CMC solution were investigated through measurements of the dynamic modulus (Fig. 2a) and viscosity (Fig. 2b). At low strain rates the CMC solution shows almost Newtonian behaviour with similar values of storage (G′) and loss (G′′) modulus (Fig. 2a). Following the addition of 16.67 wt% GNP to form GS, there is an increase and a small separation in the modulus values with a low crossover point of the G′′ and G′ measurements at 5 Pa oscillation stress, characteristic of a viscous fluid. However, on the addition of 2 vol% octanol to form GCS the storage modulus increases by over 2 orders of magnitude with the loss modulus showing a smaller increase and larger separation is observed between G′′ and G′, consistent with a weak viscoelastic solid. This transition is further confirmed through measurements of the loss tangent (ESI, Fig. S3†). The GCS shows a transition in behaviour to a more viscous liquid like behaviour at a stress around 120 Pa, which can be interpreted as a diffuse yield stress. A similar transition is seen with the viscosity measurements (Fig. 2b) with the GCS showing more pronounced shear thinning behaviour than displayed by GS.
The addition of octanol increases storage modulus. Fig. 2c shows the storage modulus measured at an oscillatory stress of 1 Pa as a function of octanol content. The storage modulus value reaches a plateau at >2 vol% octanol addition. However, when the concentration reaches 6 vol%, excess octanol appears in the form of droplets in the liquid. Thus maximum octanol concentration has been achieved and extra liquid octanol cannot be fully absorbed to form bridges between the graphene flakes. The full rheological behaviour of the graphene suspensions at different octanol concentrations (0 vol% to 6 vol%) are shown in Fig. S4.†
Finally Fig. 2d shows “peak-hold” experiments, monitoring fluid viscosity during step changes in shear rate (0.1–200 s−1). All fluids show a rapid decrease in viscosity over about 1 s with increasing strain rate, however both GS and GCS show a further reduction in viscosity associated with nanoplatelet alignment in the shear flow over intervals >10 s. On reducing strain rate CMC shows the slowest response with the viscosity increasing to 30% of its original value in 6 s, followed by a gradual increase that does not achieve its original value over 60 s. In contrast, GCS recovers rapidly to its low strain rate viscosity in 2.7 s. This quick recovery allows the GCS ink to maintain its shape after deposition, properties required for 3D printing.
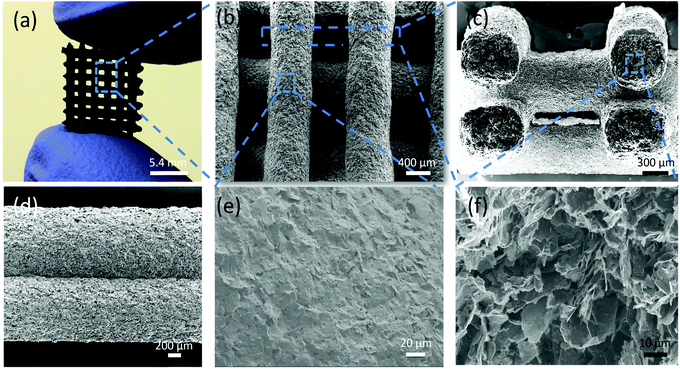
Fig. 3 shows a simple 3D lattice structure printed using the GCS ink and dried in air; it is sufficiently robust for handling (Fig. 3a). After heat treatment, the printed GCS structure retains its shape and sufficient strength for handling (Fig. S5†). The extruded sections retain a good cylindrical profile with no evidence of sagging when filaments bridge the layer below (Fig. 3b and c). However, for GS ink, the printed filaments are directly merged together without any shape retention (Fig. S6†). There is also good adhesion between GCS filaments (Fig. 3c and d). Scanning electron microscopy (SEM) images of the outer surface of the extruded filament show densely packed GNPs (Fig. 3e), however, cross-sections through the interior of the filament show a highly porous structure (Fig. 3f). Similar differences between flake packing and porosity when comparing the surface and interior of extruded filaments have been reported after direct write printing using conventional graphene suspensions. 3D printed structures were made using a range of extrusion speeds with 0.2–1.6 mm nozzle diameters (ESI, Fig. S7†). In all cases the inks and structures showed identical behaviour.
Raman spectroscopy of the GNPs in both the GS and GCS were characterised after extrusion and they show characteristic peaks of graphene-based materials, e.g., D-, G- and 2D-bands. When compared with the M5 GNP flakes in the as-received condition, all samples exhibit a similar intensity ratio between D- and G-bands, ID/IG (0.42, 0.44 and 0.44 for M5 GNP, GS and GCS, respectively, see Fig. S8 in the ESI† for representative spectra). This indicates that the GNP flakes are not damaged during the ink preparation and printing processes.
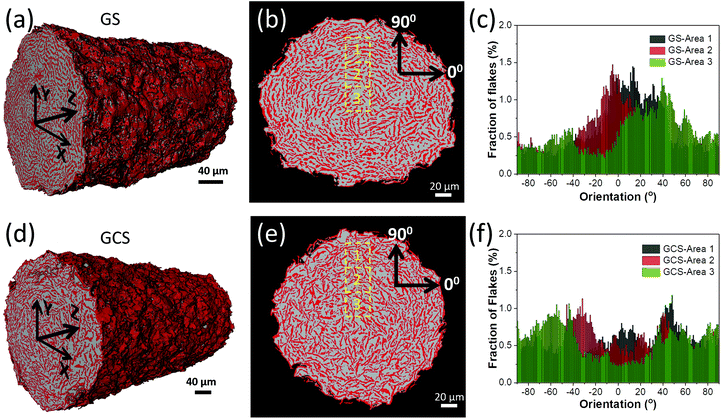
X-ray tomographic reconstructions (XTRs) through sections of dried extruded filaments obtained from the GS and GCS inks are shown in Fig. 4. The conventional GS ink shrinks 38% by volume during drying (equivalent linear shrinkage 15%) and the GCS ink shrinks by 8% (linear shrinkage 3%) (see also ESI, Fig. S9†). We hypothesize that the octanol capillary bridges in the GCS (boiling temperature 188 °C) impede shrinkage of the graphene microstructure during water evaporation. Both filaments show an interconnected network of regions of relatively high X-Ray absorption within a void network. Using image analysis of the filament XTRs, the porosities of GS and GCS filaments were computed as 69% and 66%, respectively However by determining the relative densities of each filament from their mass and external volume, the respective porosities for GS and GCS are 70% and 81% (ESI Table S2†), which is consistent with the relative shrinkages reported earlier. This discrepancy is probably a result of the dense, X-Ray absorbing regions in the microstructure containing small diameter pores, smaller than the resolution limit of the X-Ray tomographic equipment (nanoporosity), present in both the GS and GCS filaments caused by the imperfect stacking of graphene flakes.
The XTRs reveal different microstructural textures with the GS and GCS inks. Fig. 4b shows denser red regions in the GS filament are arranged in concentric rings circumferential to the extrusion axis (Z-axis in Fig. 4a and d). However, the GCS ink (Fig. 4e) shows a more disordered structure. Histograms of flake orientations (Fig. 4c and f) show the orientation distribution of the denser red regions in three different regions (labelled 1, 2 and 3 on Fig. 4b and e) perpendicular to the radial direction (0° axis). The filament from the extruded GS ink (Fig. 4c) shows a preferred orientation, with the majority of the flakes arranged normal to the radius, whereas the GCS filament shows no such preferred orientation (Fig. 4f). The ordered structure seen after extruding the GS ink is consistent with the expected behaviour of plate like particles in extrusion flow. The parabolic velocity distribution will rotate and align the flakes parallel to the flow direction and geometrical constraints will lead to localised parallel stacking of adjacent flakes normal to the pipe radius. We propose that the absence of order in the extruded GCS filament is explained by the formation of pendular bridges after extrusion, the capillary forces associated with this rotate the GNPs destroying any alignment induced through extrusion.
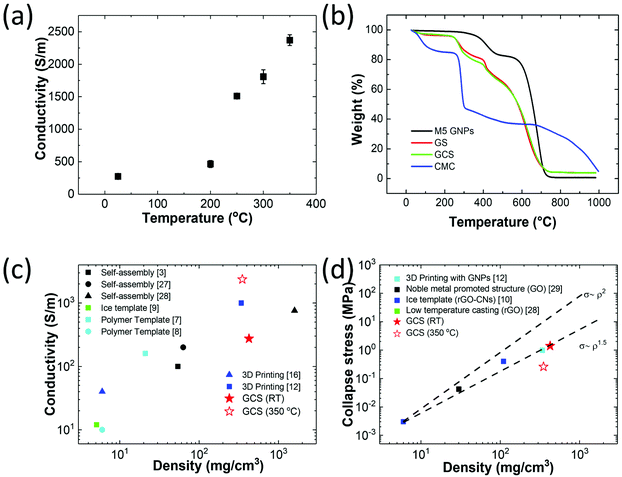
The electrical conductivity of printed GCS filaments was measured at room temperature (250 S m−1) and after heat treatment, with a maximum value of 2370 S m−1 at 350 °C (Fig. 5a). Fig. 5b compares the conductivity data with thermogravimetric analysis (TGA); it is clear that the increase in conductivity above 200 °C is associated with the removal of the CMC phase. The conductivity of the objects as a function of the density is compared with literature values in Fig. 5c, and our data is shown to be comparable with porous graphene fabricated through other fabrication routes.3,7–9,12,16,27,28 The compression strength of the GCS based structures determined from bulk cast samples are compared with literature values in Fig. 5d and is also shown to be consistent with graphene solids produced using other methods.10,12,28,29 These results follow the Gibson and Ashby model for brittle foams, the relative strength σ/σo is proportional with the relative density to a power of 1.5 (ρ/ρo)1.5.30 See ESI Fig. S9† for the mechanical test data.
Conclusions
We have successfully prepared a capillary suspension graphene ink that displays Bingham rheological behaviour, suitable for use in direct write (extrusion) based 3D printing of robust graphene structures without the necessity of complicated post-processing steps. We believe this to be the first demonstration of stable capillary suspensions with high aspect ratio 2D materials platelets. The dual solvents of water and octanol require only a relatively small quantity of a dispersing/binding polymer to ensure suspension stability. Hence electrical conductivity of the 3D printed structures are comparable to or better than literature data for 3D printed graphene monoliths using other routes. After heat treatment at 350 °C to fully remove the CMC stabiliser, the electrical properties are equivalent to the best reports in the literature. X-Ray tomographic reconstruction of the internal structure of the 3D printed objects shows that the capillary suspension produces a more isotropic internal structure than seen after the extrusion of conventional graphene inks and displays less shrinkage during drying. This behaviour confers advantages over conventional particle containing inks in controlling the shape, electrical and mechanical properties of 3D printed structures. We believe that the principles developed in this study can be applied to formulate printable inks that incorporate other 2D materials, such as BN, transition metal dichalcogenides and MXenes for electrical, thermal and biological applications. Finally we note that our formulation is identical to that used to form capillary suspensions from equiaxed graphite particles,25 hence we believe that the formulation of capillary suspensions is relatively insensitive to particle aspect ratio, although further work is needed to confirm this hypothesis.Conflicts of interest
There are no conflicts to declare.Acknowledgements
The authors would like to acknowledge the support of the EPSRC through grants EP/L012022/1, EP/N010345/1, EP/P025021/1, EP/R00661X/1 and EP/S019367/1. HD also acknowledges the University of Manchester for financial support through the provision of a graduate studentship.References
- Z. Chen, W. Ren, L. Gao, B. Liu, S. Pei and H. M. Cheng, Nat. Mater., 2011, 10, 424–428 CrossRef CAS PubMed.
- Y. Xu, K. Sheng, C. Li and G. Shi, ACS Nano, 2010, 4, 4324–4330 CrossRef CAS PubMed.
- X. Zhang, Z. Sui, B. Xu, S. Yue, Y. Luo, W. Zhan and B. Liu, J. Mater. Chem., 2011, 21, 6494 RSC.
- M. A. Worsley, P. J. Pauzauskie, T. Y. Olson, J. Biener, J. H. Satcher Jr. and T. F. Baumann, J. Am. Chem. Soc., 2010, 132, 14067–14069 CrossRef CAS PubMed.
- S. Nardecchia, D. Carriazo, M. L. Ferrer, M. C. Gutierrez and F. del Monte, Chem. Soc. Rev., 2013, 42, 794–830 RSC.
- M. Mecklenburg, A. Schuchardt, Y. K. Mishra, S. Kaps, R. Adelung, A. Lotnyk, L. Kienle and K. Schulte, Adv. Mater., 2012, 24, 3486–3490 CrossRef CAS PubMed.
- Y. A. Samad, Y. Li, A. Schiffer, S. M. Alhassan and K. Liao, Small, 2015, 11, 2380–2385 CrossRef PubMed.
- X. Du, H. Y. Liu and Y. W. Mai, ACS Nano, 2016, 10, 453–462 CrossRef CAS PubMed.
- L. Qiu, J. Z. Liu, S. L. Chang, Y. Wu and D. Li, Nat. Commun., 2012, 3, 1241 CrossRef PubMed.
- S. Barg, F. M. Perez, N. Ni, P. do Vale Pereira, R. C. Maher, E. Garcia-Tunon, S. Eslava, S. Agnoli, C. Mattevi and E. Saiz, Nat. Commun., 2014, 5, 4328 CrossRef CAS PubMed.
- Y. Lin, F. Liu, G. Casano, R. Bhavsar, I. A. Kinloch and B. Derby, Adv. Mater., 2016, 28, 7993–8000 CrossRef CAS PubMed.
- G. de la Osa, D. Pérez-Coll, P. Miranzo, M. I. Osendi and M. Belmonte, Chem. Mater., 2016, 28, 6321–6328 CrossRef CAS.
- C. Zhu, T. Y. Han, E. B. Duoss, A. M. Golobic, J. D. Kuntz, C. M. Spadaccini and M. A. Worsley, Nat. Commun., 2015, 6, 6962 CrossRef CAS PubMed.
- A. E. Jakus, E. B. Secor, A. L. Rutz, S. W. Jordan, M. C. Hersam and R. N. Shah, ACS Nano, 2015, 9, 4636–4648 CrossRef CAS PubMed.
- C. Zhu, T. Liu, F. Qian, T. Y. Han, E. B. Duoss, J. D. Kuntz, C. M. Spadaccini, M. A. Worsley and Y. Li, Nano Lett., 2016, 16, 3448–3456 CrossRef CAS PubMed.
- E. Garcia-Tunon, S. Barg, J. Franco, R. Bell, S. Eslava, E. D'Elia, R. C. Maher, F. Guitian and E. Saiz, Adv. Mater., 2015, 27, 1688–1693 CrossRef CAS PubMed.
- Q. Zhang, F. Zhang, S. P. Medarametla, H. Li, C. Zhou and D. Lin, Small, 2016, 12, 1702–1708 CrossRef CAS PubMed.
- D. Lin, S. Jin, F. Zhang, C. Wang, Y. Wang, C. Zhou and G. J. Cheng, Nanotechnology, 2015, 26, 434003 CrossRef PubMed.
- K. Chi, Z. Zhang, J. Xi, Y. Huang, F. Xiao, S. Wang and Y. Liu, ACS Appl. Mater. Interfaces, 2014, 6, 16312–16319 CrossRef CAS PubMed.
- J. A. Lewis, Adv. Funct. Mater., 2006, 16, 2193–2204 CrossRef CAS.
- E. Koos and N. Willenbacher, Science, 2011, 331, 897–900 CrossRef CAS PubMed.
- E. Koos, J. Johannsmeier, L. Schwebler and N. Willenbacher, Soft Matter, 2012, 8, 6620 RSC.
- J. Maurath and N. Willenbacher, J. Eur. Ceram. Soc., 2017, 37, 4833–4842 CrossRef CAS.
- S. Roh, D. P. Parekh, B. Bharti, S. D. Stoyanov and O. D. Velev, Adv. Mater., 2017, 29, 1701554 CrossRef PubMed.
- B. Bitsch, T. Gallasch, M. Schroeder, M. Börner, M. Winter and N. Willenbacher, J. Power Sources, 2016, 328, 114–123 CrossRef CAS.
- S. H. Li, Z. L. Li, T. L. Burnett, T. J. A. Slater, T. Hashimoto and R. J. Young, J. Mater. Sci., 2017, 52, 9558–9572 CrossRef CAS.
- M. A. Worsley, S. Charnvanichborikarn, E. Montalvo, S. J. Shin, E. D. Tylski, J. P. Lewicki, A. J. Nelson, J. H. Satcher, J. Biener, T. F. Baumann and S. O. Kucheyev, Adv. Funct. Mater., 2014, 24, 4259–4264 CrossRef CAS.
- H. Bi, K. Yin, X. Xie, Y. Zhou, N. Wan, F. Xu, F. Banhart, L. Sun and R. S. Ruoff, Adv. Mater., 2012, 24, 5124–5129 CrossRef CAS PubMed.
- Z. Tang, S. Shen, J. Zhuang and X. Wang, Angew. Chem., 2010, 49, 4603–4607 CrossRef CAS PubMed.
- L. J. Gibson and M. F. Ashby, Cellular solids: structure and properties, Cambridge university press, 1999 Search PubMed.
Footnote |
| † Electronic supplementary information (ESI) available. See DOI: 10.1039/c9nr10831a |
| This journal is © The Royal Society of Chemistry 2020 |

