
 Open Access Article
 This Open Access Article is licensed under a Creative Commons Attribution-Non Commercial 3.0 Unported Licence
Tailoring magnetic and mechanical properties of mesoporous single-phase Ni–Pt films by electrodeposition
Konrad
Eiler
 *a,
Jordina
Fornell
a,
Cristina
Navarro-Senent
a,
Eva
Pellicer
a and
Jordi
Sort
*ab
*a,
Jordina
Fornell
a,
Cristina
Navarro-Senent
a,
Eva
Pellicer
a and
Jordi
Sort
*ab
aDepartament de Física, Universitat Autònoma de Barcelona, 08193 Bellaterra (Cerdanyola del Vallès), Spain. E-mail: konrad.eiler@uab.cat; jordi.sort@uab.cat
bInstitució Catalana de Recerca i Estudis Avançats (ICREA), 08010 Barcelona, Spain
First published on 25th March 2020
Abstract
Homogeneous mesoporous Ni-rich Ni–Pt thin films with adjustable composition have been synthesised by one-step micelle-assisted electrodeposition. The films exhibit a face-centred cubic solid solution (single phase) and their magnetic and mechanical properties can be tuned by varying the alloy composition. In particular, the Curie temperature (TC) is shown to decrease with the Pt content and thin films with a TC close to room temperature (i.e. Ni58Pt42) and below can be produced. Hysteresis loops show a decrease of saturation magnetisation (Ms) and coercivity (Hc) with decreasing Ni content. A comparison of porous and dense films reveals significantly lower saturation magnetic field strength for porous films. Concerning mechanical properties, mainly two trends can be observed: a decrease of the Young's modulus of the nanoporous films with respect to dense films by 10% in average and a progressive increase of Young's modulus with the Ni content from 4.2 GPa to 5.7 GPa in both types of films. The tunability of properties and facility of synthesis make this alloy a promising material for microelectromechanical systems (MEMS).
1 Introduction
The ability to adjust the magnetic properties of a system without drastically changing other physical properties—such as electrical, mechanical or thermal properties—is beneficial for application in magnetic micro- and nanoelectromechanical systems (MEMS/NEMS), where para- and ferromagnetic phases need to be in electrical contact while ensuring mechanical compatibility between different components.1 If there is a low difference in composition between the paramagnetic and the ferromagnetic phase, there will be only little difference in electrical conductivity—thus avoiding local heating—, a low mismatch in thermal expansion—avoiding excessive thermally induced interfacial stresses—and good mechanical integrity.2 Single-phase alloys have the potential to prevent these problems from occurring intrinsically, and—in the case of full miscibility—do not undergo phase transition and avoid temperature-induced formation of secondary phases.3 Additionally, an electrical contact between two phases of similar composition is less susceptible to atmospheric corrosion caused by humidity.Electrodeposited soft magnetic alloys are widely used as writing heads for hard disks, where the main requirements include corrosion resistance, low stress and thermal stability.4 For many applications, soft ferromagnetic materials with Curie temperature (TC) close to room temperature (RT) are of interest in order to reduce energy consumption during storage and access of data.
A TC close to RT also allows to study the magnetic behaviour in this temperature region without applying heat, helping to advance in the theoretical models to understand the magnetic phase transition effects. In general, TC can be tailored by varying the content of a ferromagnetic element in a solid solution comprising ferromagnetic and paramagnetic elements. In this work, Ni–Pt is used to that purpose. While Pt is an excellent corrosion resistant material, Ni provides ferromagnetic properties. Moreover, Ni has a high abundancy and provides mechanical stability and electrical conductivity. This makes Ni–Pt a multifunctional alloy whose properties can be tuned by the composition, rendering it ideal for application in magnetic MEMS or NEMS. Ni and Pt promote the formation of single-phase alloys due to their full miscibility, given their identical lattice structure (fcc) and their comparable atomic radii.5
Compared to coarse-grained materials, nanocrystalline metals and alloys exhibit larger yield stress and hardness due to enhanced dislocation pile-up at grain boundaries (Hall–Petch strengthening).6 Using suitable conditions for electrodeposition, nanocrystalline films can be readily obtained, thus improving the mechanical properties without compromising any other properties.7,8
Mesoporous materials, due to their high surface-to-volume ratio, are generally of interest in biomedicine, water remediation, catalysis, and energy storage and conversion devices such as batteries and fuel cells.9–13 In the case of nanoporous magnetic materials, the coercivity can be reduced by applying voltage, due to large electric charge accumulation effects on the surface (converse magnetoelectric effect).14 Again, this can reduce the energy consumption during writing of information in magnetic storage media and other magnetically actuated devices.15
Furthermore, the interest in the biomedical field and bio-MEMS is growing.4 Here, mesoporous materials are appealing for application in drug delivery since the pores may act as reservoirs for the drugs to be delivered.16
Nanoporous materials are often superhydrophobic (and oleophilic), a property that may be utilised in water remediation (i.e. oil decontamination). If the material is at the same time ferromagnetic, it can easily be retrieved from the water and thereby recycled for multiple usage.17,18
The formation of a single-phase alloy generally depends on the thermodynamics of the system; the phase diagram and the mixing enthalpy for the element pair being suitable indicators as to whether a single-phase alloy can be obtained. The Ni–Pt phase diagram shows full miscibility with the existence of ordered phases, and an approximately linear dependence of TC on composition, reaching 373 K (100 °C) at 26 at% Pt.19 Ni–Pt exhibits a negative mixing enthalpy,20 favouring the formation of a single phase. However, especially by electrodeposition the stabilisation of metastable phases is possible.
Another requirement for alloy electrodeposition is that the deposition potentials of the two elements need to be sufficiently close together; complexing agents are commonly used to shift the deposition potential for one of the elements in order to approach the deposition potential of the other and thus achieve their co-deposition.7 The use of a polymeric surfactant to introduce nanoporosity can interfere with the crystal growth of the metallic film,21 eventually changing the microstructure and leading to phase separation. A general issue in the electrodeposition of metallic films is also the incorporation of oxygen and hydrogen, leading to the formation of oxide/hydroxide phases22,23 and hydrogen embrittlement, to which Ni is rather susceptible.24
Single-phase dense Ni–Pt films have already been electrodeposited from K2PtCl4 containing solution at acidic pH for the purpose of oxygen reduction reaction in the full compositional range.25
Here, the synthesis of Ni–Pt thin films is accomplished using the well-described mechanism of micelle-assisted electrodeposition to introduce porosity.26–28 In this one-step deposition process, a block copolymer forms micelles when its concentration in water is above the critical micellar concentration (cmc), and the metal ions assemble at the exterior (hydrophilic) part of the micelles. The latter are thus co-deposited when the metal ions are reduced at the working electrode. The polymer can later be easily dissolved, leaving a mesoporous metallic film behind.
Since mostly magnetic properties of the Ni–Pt system are investigated here, this work focuses on Ni-rich alloys of the Ni–Pt system. A dependence of TC, Ms and Hc on the composition (NixPt1−x) is observed, as well as progressive variation in their mechanical properties. The nanocrystalline, single-phase material is characterised for both mesoporous and dense morphology, revealing that the mesoporosity influences both the magnetic and mechanical behaviour.
2 Experimental
The electrodeposition of mesoporous Ni–Pt films was carried out using an aqueous solution containing 200 mM NiCl2, 3 mM Na2PtCl6·6H2O, 200 mM H3BO3, 25 mM NH4Cl, and 10 g l−1 Pluronic P-123 (average molecular mass Mn = 5800). HCl was added to adjust the pH to 2.7. For the deposition of dense films, the block copolymer P-123 was omitted while keeping the concentration of all other chemicals constant.A three-electrode set-up with an Ag|AgCl 3 M KCl reference electrode and a platinum wire as counter electrode was used while the temperature during deposition was kept at 30 °C. All given potentials refer to the Ag|AgCl electrode. De-aeration with nitrogen gas was performed before each deposition, and the deposition was performed while stirring the electrolyte at 100 rpm.
For electrodeposition, silicon substrates were metallised with a 10 nm Ti adhesion layer and a 200 nm Cu seed layer, both deposited by sputter deposition. The back of the substrates was insulating due to the presence of SiO2. Potentiostatic deposition, using potentials between −1.3 V and −0.6 V and deposition times from 30 s to 180 s, were applied using an Autolab 302N potentiostat/galvanostat to deposit films with different Ni to Pt ratios. Since the deposition rate was higher for more negative potentials, the deposition time was adjusted for each deposition potential in order to obtain similar film thickness for all compositions. In practice, this meant increasing the deposition time when moving towards more positive potentials (Fig. 1). After deposition of the porous films, the block copolymer was removed by ultrasonic cleaning in ethanol for 10 min.
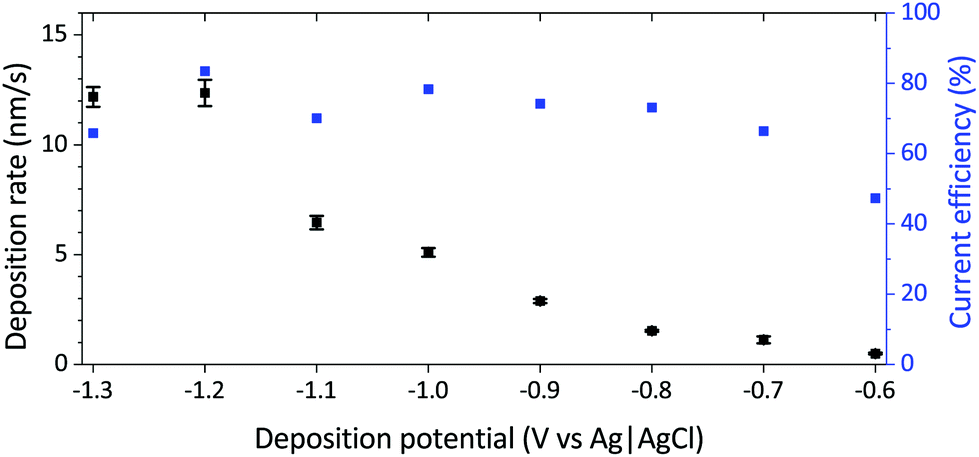 | ||
| Fig. 1 Deposition rate and faradaic efficiency of mesoporous Ni–Pt films as a function of the applied deposition potential. | ||
In order to determine the faradaic current efficiency, the theoretical mass (mtheoretical) of a NixPt(1−x) film was determined assuming that all current measured during the deposition process corresponds to the reduction of the metal ions (eqn (1)).
 | (1) |
Together with the real masses of the deposits determined by ICP-MS (see below for the procedure), which also allowed the determination of the atomic fractions of Ni and Pt, the faradaic efficiency is determined by the ratio of the real and the theoretical mass mreal/mtheoretical.
For determination of the deposition rates, the real masses of the deposits were used to estimate their density, from which the total thickness was calculated. Thus the deposition rates reported show the total thickness divided by the deposition time.
The synthesised Ni–Pt thin films were analysed by scanning electron microscopy (SEM) coupled with energy-dispersive X-ray spectroscopy (EDX) on a Zeiss Merlin electron microscope. Imaging was done at an acceleration voltage of 1–2 kV using an InLens detector to reveal the existence of mesoporosity.
Transmission electron microscopy (TEM) was performed on a Jeol JEM-2011 electron microscope with an acceleration voltage of 200 kV working in bright field and diffraction mode. Sample preparation for TEM was performed by making a cross-cut of a mesoporous sample with a diamond saw. By grinding and polishing with a final diamond polish of 1 μm particle size, the thickness was reduced to about 30 μm. Finally, Ar ion milling with an energy of 5 keV was performed at an angle of 8° for several hours to reduce the thickness locally to a few nanometers. For the preparation of the cross-section of a dense Ni–Pt film, a lamella was cut using a focused ion beam SEM (FIB-SEM).
Grazing incidence X-ray diffraction (GIXRD) was conducted on a Malvern-PANalytical Xpert Pro MRD diffractometer using Cu-Kα radiation for phase analysis of the films in a 2θ range from 38° to 62°. Rietveld refinement was performed using the software MAUD29 in order to determine the lattice parameter and crystallite size for each composition.30
The mechanical properties of the films, i.e. hardness (H) and reduced Young's modulus (Er), were evaluated by nanoindentation. The continuous stiffness measurement (CSM) technique was used since it allows the assessment of depth-dependent properties of materials in a single step. The method involves applying a dynamic (oscillatory) load on top of a static load while the material is penetrated in order to determine the continuous stiffness, which is then further processed to calculate H and Er.31
E r can be seen as a combined modulus of the tested sample and the indenter (eqn (2)).32
 | (2) |
The nanoindentation tests were carried out with a Nanoindenter XP from MTS using a Berkovich-shaped diamond tip with Ei = 1140 and νi = 0.07. Due to the large Young's modulus of the indenter in comparison with most metals, the difference between Er and Es is usually within a few per cent. The CSM mode was applied with a harmonic displacement of 2 nm and a harmonic frequency of 45 Hz. The experiments were performed in displacement control mode, with a strain rate of 0.05 s−1 up to a maximum penetration depth of 100 nm. The Poisson's ratio ν was assumed to be 0.3. Sixteen indents, separated by 10 μm each, were performed on each sample from on top (on the films’ surfaces).
Magnetic hysteresis loops were recorded at RT in-plane and out-of-plane by vibrating sample magnetometry (VSM) on an LOT-QuantumDesign MicroSense VSM up to 20![[thin space (1/6-em)]](https://www.rsc.org/images/entities/char_2009.gif) 000 Oe. VSM was also used for measuring the temperature dependence of the magnetisation in the saturated regime at 1000 Oe in order to determine TC, using nitrogen gas flow to control the temperature. After first measurements of TC, the deposition potential was refined in the range between −0.70 V and −0.60 V to obtain films with a TC in the desired range. All thin films were subsequently dissolved in aqua regia for chemical analysis by ICP-MS using an Agilent 7500ce spectrometer to obtain the exact compositions of the Ni–Pt films, and to normalise the measured magnetic moment by the total mass of Ni and Pt for each sample. TC was determined by the two-tangent method, applying tangents to the linear parts of the M–T (magnetisation over temperature) curve both below and above the magnetic transition and taking TC at the point of their intersection.33
000 Oe. VSM was also used for measuring the temperature dependence of the magnetisation in the saturated regime at 1000 Oe in order to determine TC, using nitrogen gas flow to control the temperature. After first measurements of TC, the deposition potential was refined in the range between −0.70 V and −0.60 V to obtain films with a TC in the desired range. All thin films were subsequently dissolved in aqua regia for chemical analysis by ICP-MS using an Agilent 7500ce spectrometer to obtain the exact compositions of the Ni–Pt films, and to normalise the measured magnetic moment by the total mass of Ni and Pt for each sample. TC was determined by the two-tangent method, applying tangents to the linear parts of the M–T (magnetisation over temperature) curve both below and above the magnetic transition and taking TC at the point of their intersection.33
3 Results and discussion
3.1 Chemical composition
The composition of the synthesised thin films is determined by the electrodeposition parameters, mainly the deposition potential. Since Pt(IV) deposits at less negative potentials than Ni(II), the Ni content increases when the potential is more negative (Table 1). The same trend was observed by Liu et al. during the electrodeposition of dense Ni–Pt films from a different bath formulation.25 Progressive enrichment in Ni as the applied potential was made more negative was accompanied by an increase in the deposition rate up to −1.2 V (Fig. 1). The compositions of the dense thin films are similar to their porous counterparts deposited under the same conditions, i.e. the composition is not influenced by the presence of the P-123 triblock copolymer for a given potential. All percentages of Ni and Pt in this work, ranging from 61 at% Ni to 99 at% Ni, are given in atomic percentage. For the film compositions, oxygen or other impurities are not taken into account, however those were monitored by EDX and the oxygen content never exceeded 10 at% (note that in EDX, it is not possible to discriminate whether the oxygen originates from the film or the substrate layers). Current efficiencies determined for the mesoporous Ni–Pt films were between 65% and 85% for all deposition potentials except −0.6 V, where the current efficiency was 47% (Fig. 1).| Deposition potential [V] | Composition | |
|---|---|---|
| Porous | Dense | |
| −1.3 | Ni99Pt1 | |
| −1.2 | Ni98Pt2 | Ni98Pt2 |
| −1.0 | Ni95Pt5 | Ni93Pt7 |
| −0.9 | Ni92Pt8 | Ni91Pt9 |
| −0.8 | Ni84Pt16 | |
| −0.7 | Ni76Pt24 | Ni79Pt21 |
| −0.6 | Ni61Pt39 | |
3.2 Microstructure
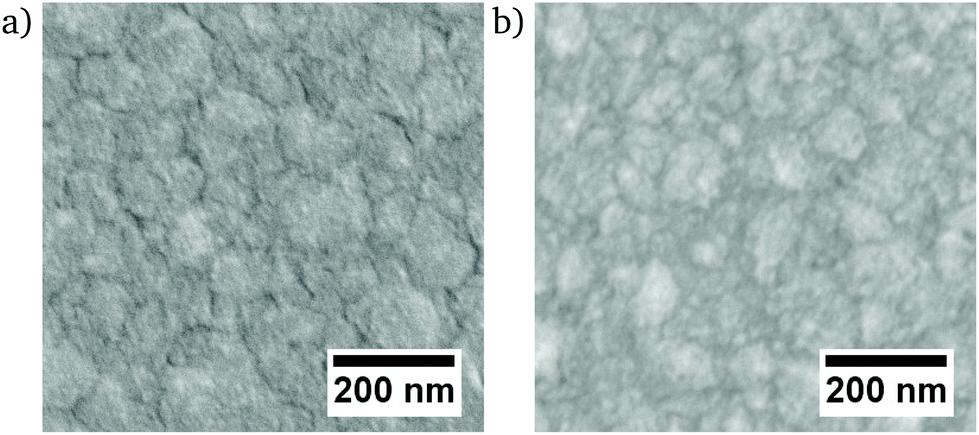
All films deposited from the electrolyte containing P-123 exhibit a homogeneously distributed mesoporosity (Fig. 2). The thin films containing 99% and 98% Ni have a clearly visible grain structure with an appreciable roughness (Fig. 2a and b). For 95% Ni, a rough surface without perceptible grain structure is observed (Fig. 2c), while the films ranging from 94% to 61% Ni are smoother, since no topographic contrast other than the one caused by the porosity is visible. Furthermore, those films do not show any apparent grain structure on the nanoscale, and they are highly mesoporous with a narrowly distributed pore size on the order of 10 nm. The microstructures of the dense films show the continuous surfaces with an appreciable, low roughness (Fig. 3).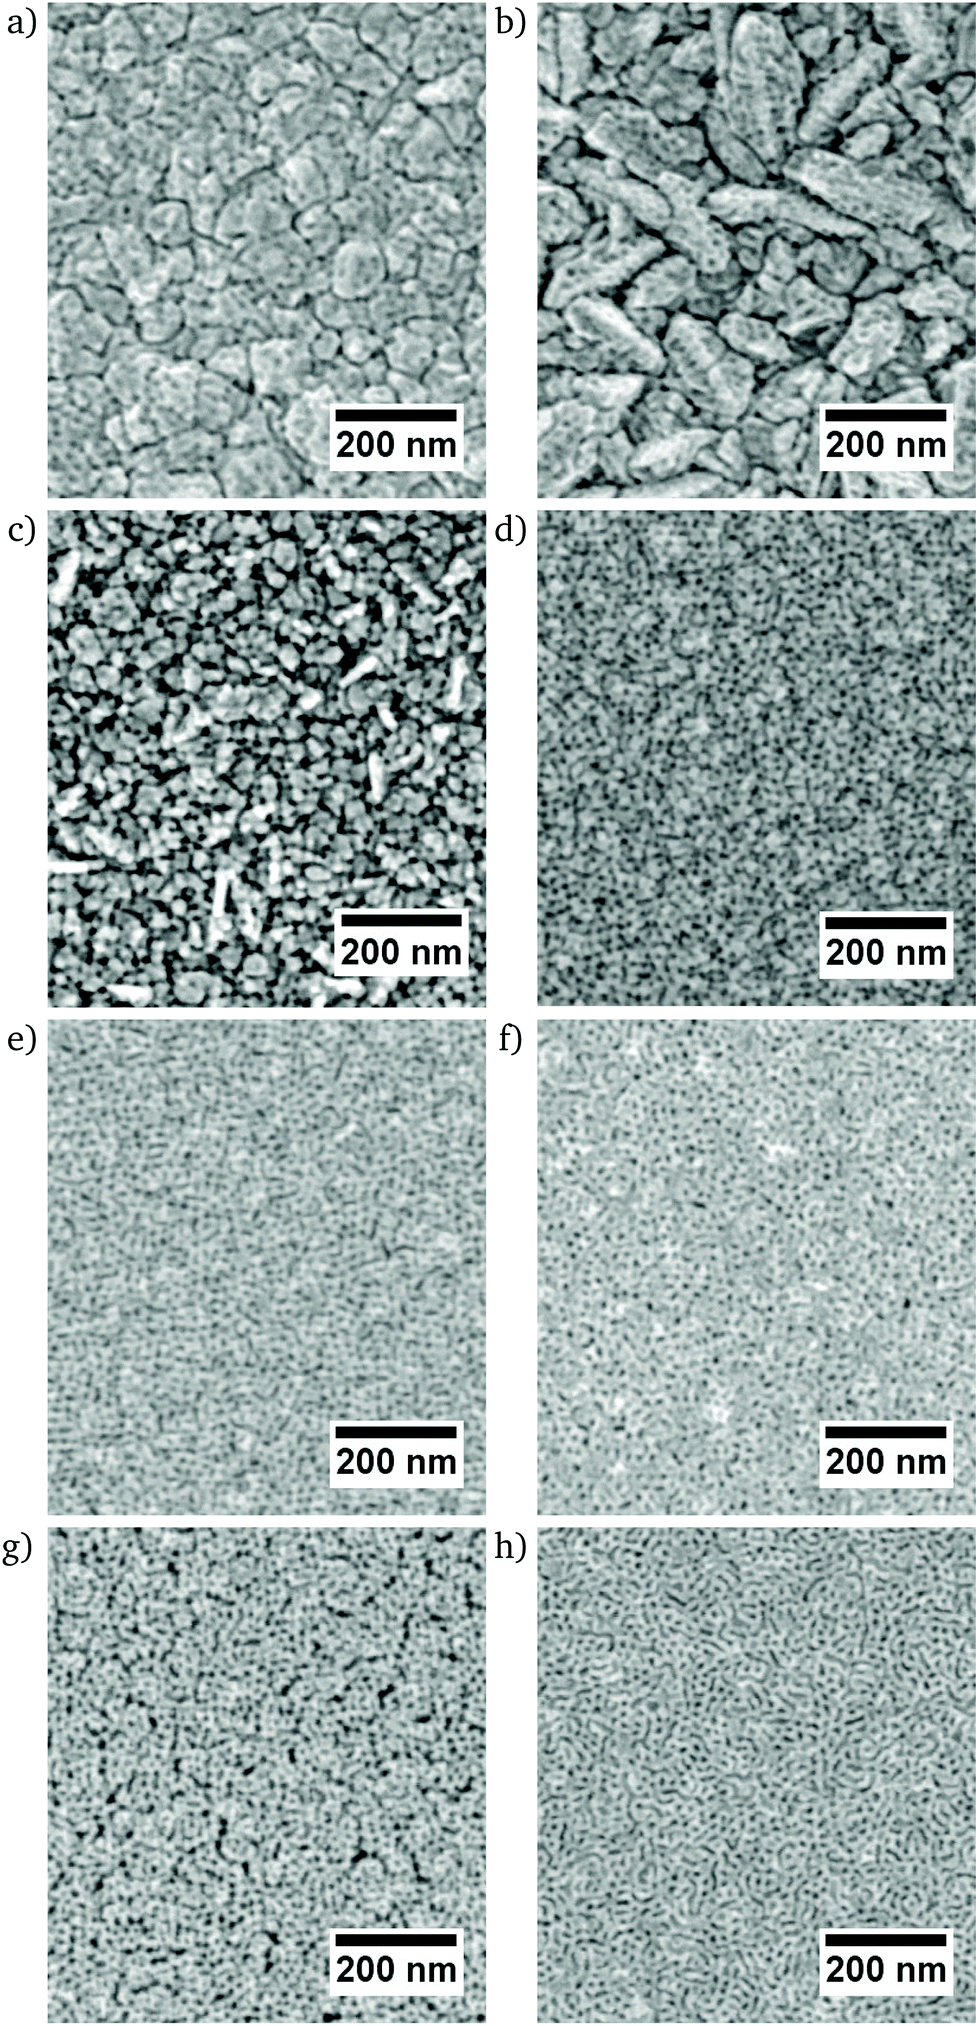 | ||
| Fig. 2 SEM micrographs of mesoporous Ni–Pt thin films (a) Ni99Pt1, (b) Ni98Pt2, (c) Ni95Pt5, (d) Ni94Pt6, (e) Ni92Pt8, (f) Ni84Pt16, (g) Ni76Pt24, (h) Ni61Pt39 acquired by InLens detector. | ||
 | ||
| Fig. 3 SEM micrographs of dense Ni–Pt thin films (a) Ni98Pt2, (b) Ni91Pt9 acquired by InLens detector. | ||
On a cross-section of a Ni92Pt8 thin film, the porosity over the full film thickness is observed by TEM, together with the Cu seed layer (Fig. 4a). Underneath the Cu layer, the Ti layer and Si substrate are visible. The irregular shape of the film suggests that the film surface has been partially removed during ion polishing. SEM micrographs of this cross-section reveal the film's homogeneity at surface level and the film thickness is around 280 nm (Fig. 4b).
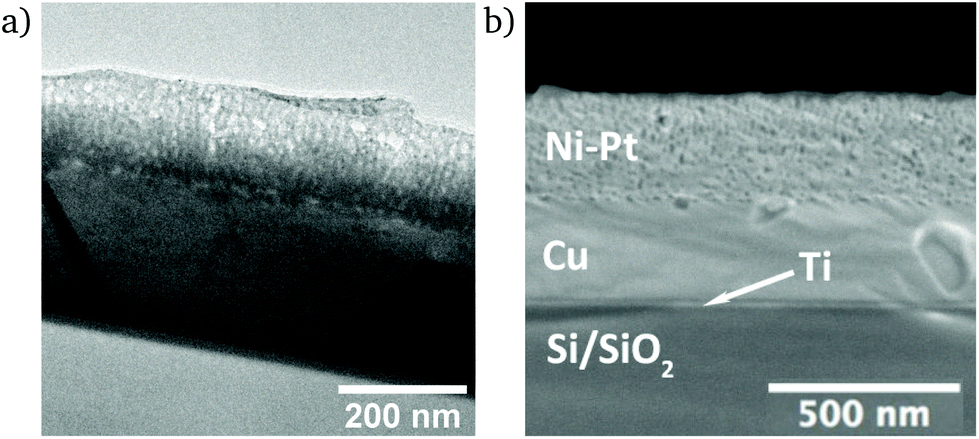 | ||
| Fig. 4 (a) TEM and (b) SEM micrograph of a cross-section of mesoporous Ni92Pt8 thin film. | ||
At high resolution, crystal planes become visible and indicate the nanocrystalline structure of the thin film (Fig. 5). A few nanometre thick layer covers the surface of the thin film, which may be a surface oxide, or a damaged layer caused by amorphisation of the metal due to the ion beam polishing during preparation.
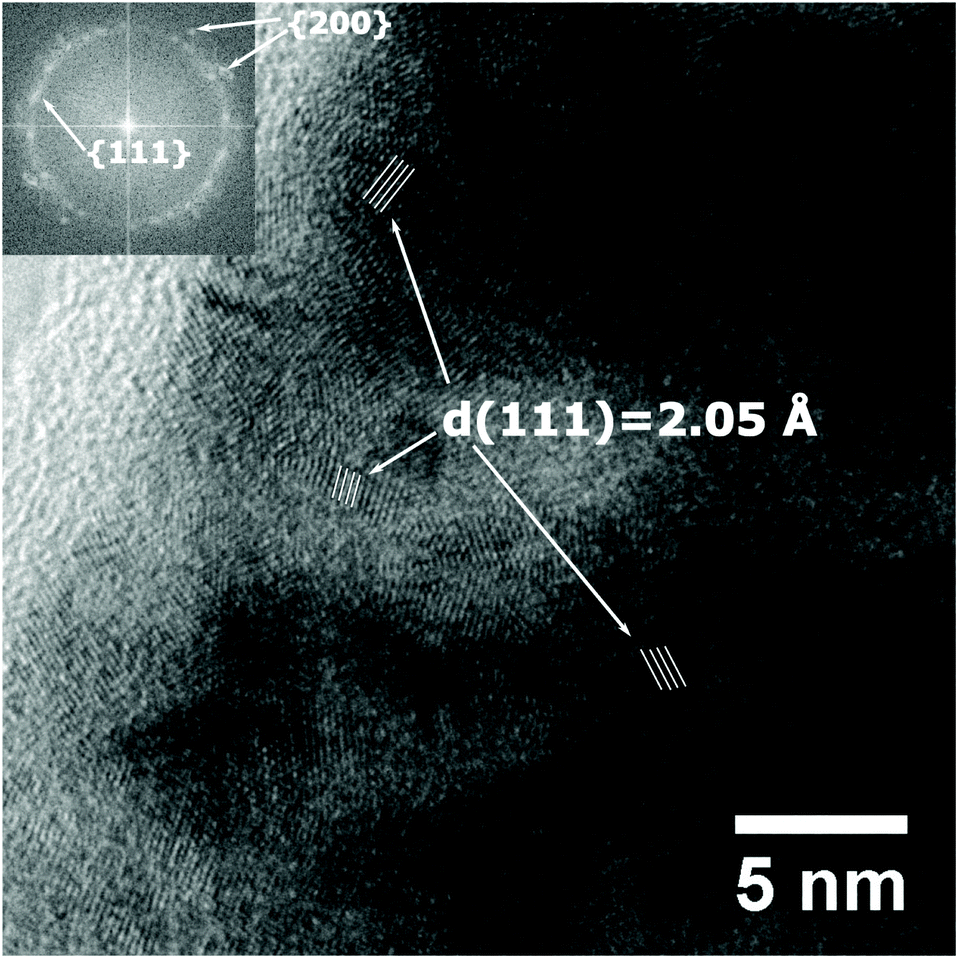 | ||
| Fig. 5 High resolution TEM micrograph of a cross-section of mesoporous Ni92Pt8 thin film with selected crystal planes indicated. The corresponding fast Fourier transform (FFT) image for the entire zone is shown as an inset on the top left. | ||
In the cross-section of the dense Ni91Pt9 film, a film thickness of ca. 250 nm is observed (Fig. 6a). Similar to the mesoporous film (Fig. 5), its nanocrystalline morphology is revealed in high resolution conditions (Fig. 6b).
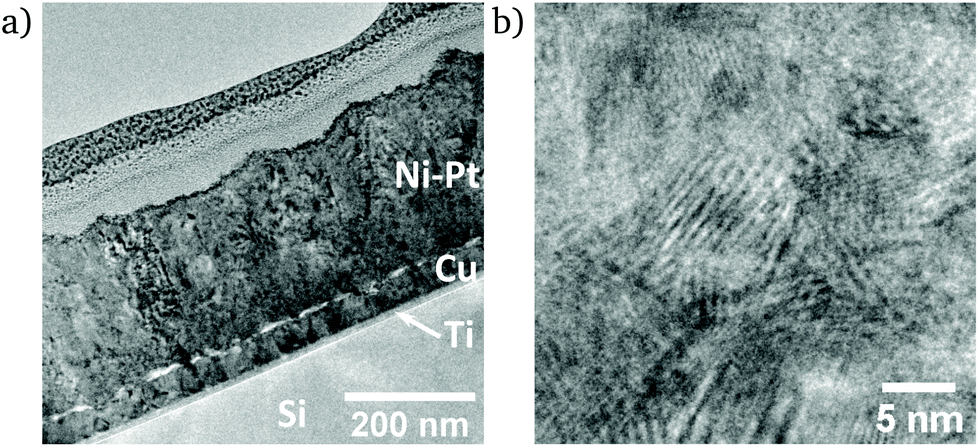 | ||
| Fig. 6 TEM micrographs of dense Ni91Pt9 thin film (a) over the full cross-section and (b) under high-resolution conditions. | ||
3.3 Phase analysis
The diffraction patterns obtained by GIXRD show an fcc single-phase solid solution with a cell parameter between those for fcc Ni and fcc Pt (as indicated by the discontinuous lines in Fig. 7) for all compositions. The diffraction patterns of the Ni–Pt films are superposed on the reflections of the fcc Cu seed layer (Fig. 7). | ||
| Fig. 7 GIXRD diffraction patterns of Ni–Pt thin films showing the deconvolution of the Ni–Pt (green) and Cu (red curve) phases after Rietveld refinement for (a1) Ni98Pt2, (a2) dense Ni98Pt2, (b) Ni92Pt8, (c) Ni84Pt16, (d) dense Ni79Pt21, (e) Ni76Pt24, (f) Ni61Pt39. With exception of (a2) and (d) all films are mesoporous. | ||
Remarkably, there is no apparent difference in the diffraction patterns between dense and porous films of identical composition, i.e. the porosity has very little or no influence on the structure (cf.Fig. 7, by comparing curves a1 and a2 or d and e).
Upon increasing Pt content in the alloy, the diffraction peaks shift towards lower diffraction angles, indicating a progressive increase in the cell parameter. The cell parameter of the Pt–Ni phase obtained by Rietveld refinement scales linearly with the alloy composition, thus following Vegard's law.34 However, there is a tendency towards cell parameters slightly higher than expected (Fig. 8). This effect was also observed by Kumar et al.,35 and related to the size mismatch due to the different atomic radii of Ni and Pt. Similar deviations, ascribed to the presence of tensile microstrain, have been documented for electrodeposited Ni films.36
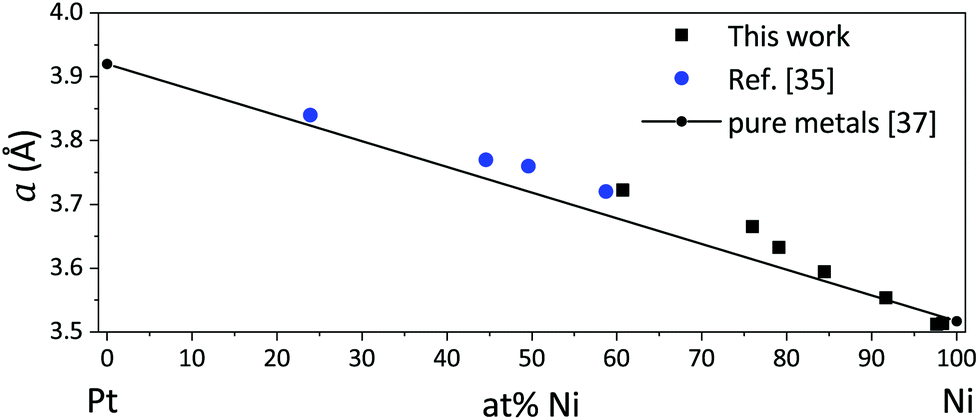 | ||
| Fig. 8 Dependence of cell parameter a on composition of Ni–Pt thin films as determined in this work as well as by Kumar et al.35 Values for pure Ni and Pt are included as a reference.37 | ||
With the exception of the film containing 98 at% Ni, the reflections of the Ni–Pt phase are significantly broadened due to the small crystallite size. The Rietveld refinement returned crystallite sizes on the order of 5 nm for Ni contents between 61% and 92%, and 50 nm in the case of Ni98Pt2. Similar values are obtained for dense films, hence the nanocrystallinity resulted entirely from the electrodeposition parameters and electrolyte composition (Table 2). The presence of the P-123 surfactant did not provoke or influence the formation of a nanocrystalline structure. It can be concluded that differences in behaviour between mesoporous and dense films are entirely related to effects of porosity, since there are no other structural differences apparent.
| Composition | Morphology | Crystallite size [nm] |
|---|---|---|
| Ni98Pt2 | Porous | 41 |
| Ni98Pt2 | Dense | 53 |
| Ni92Pt8 | Porous | 7 |
| Ni84Pt16 | Porous | 6 |
| Ni79Pt21 | Dense | 5 |
| Ni76Pt24 | Porous | 5 |
| Ni61Pt39 | Porous | 6 |
The nanocrystalline nature of the films is also demonstrated by TEM under diffraction conditions, showing that crystals are oriented in all possible directions within the cross-section (Fig. 9).
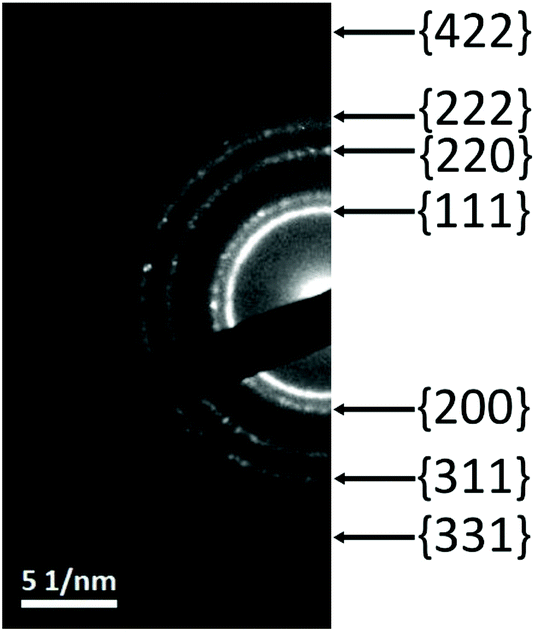 | ||
| Fig. 9 Selected area electron diffraction pattern taken at a cross-section of mesoporous Ni92Pt8 with the Miller indices of the diffraction rings indicated. | ||
3.4 Mechanical properties
Representative curves obtained from nanoindentation tests display the dependences of Er and H on the penetration depth into the surface for selected samples (Fig. 10). Nanoindentation measurements may have some influence from the substrate. It is commonly accepted that if the maximum penetration depth is kept lower than one tenth of the overall film thickness, the contribution of the substrate can be disregarded.31 Considering the experimentally determined film thickness of approximately 280 nm for the Ni–Pt films, the contribution of the substrate may not be neglected for penetration depths higher than 30 nm. Nevertheless, since the film thickness is similar for all compositions, the influence of the substrate on the obtained mechanical properties may be considered similar for all samples, and thus the observed trends in Er and H are representative of the films’ properties.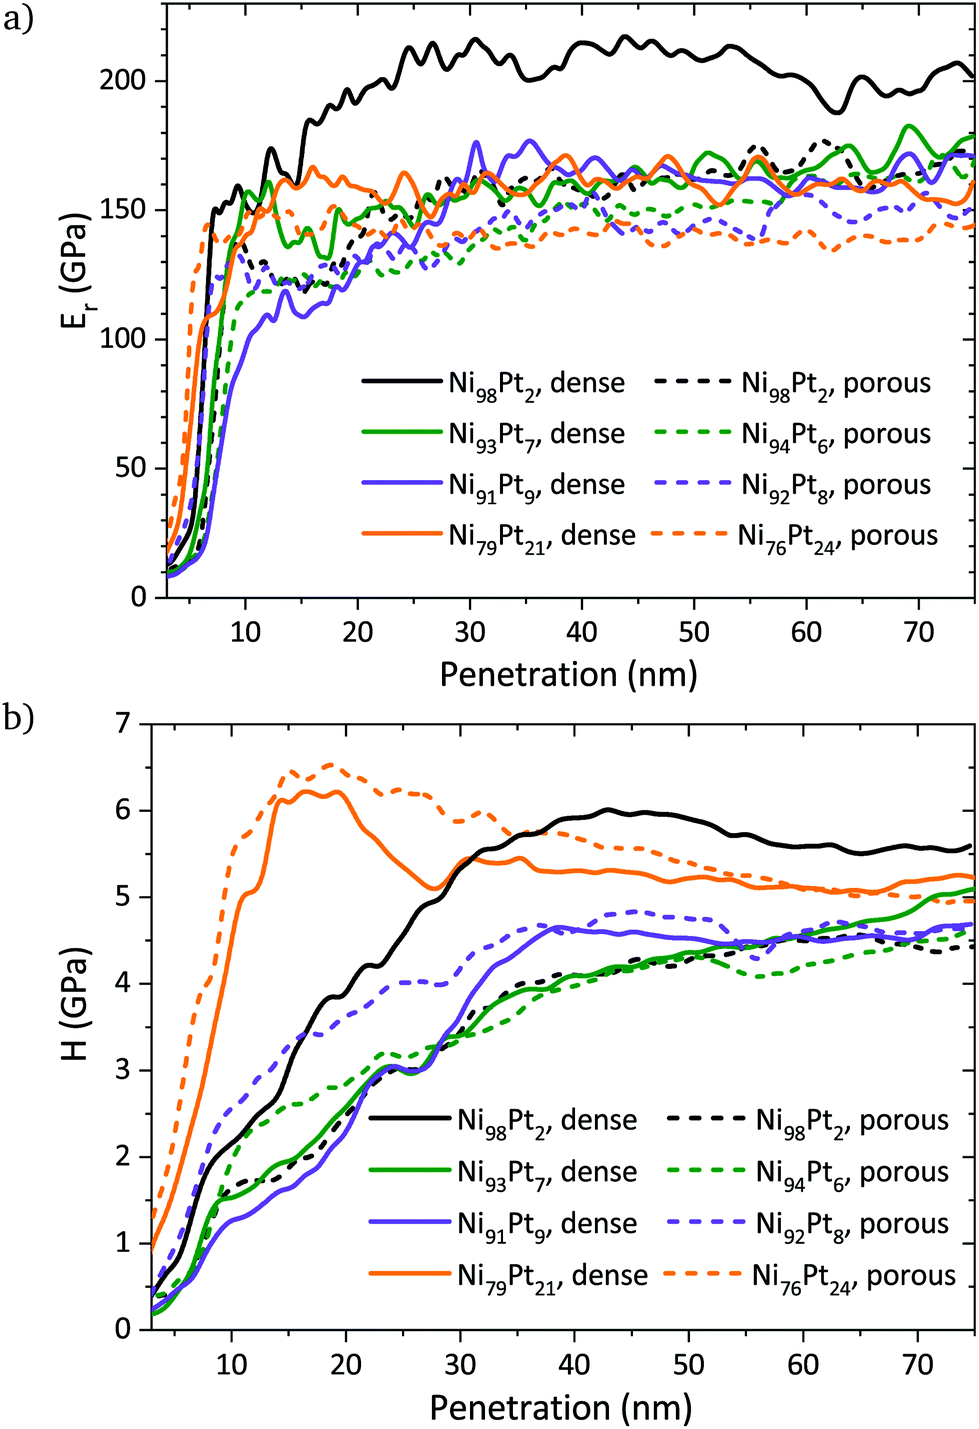 | ||
| Fig. 10 Representative curves of (a) the reduced Young's modulus and (b) hardness as a function of the nanoindenter's penetration into the surface for selected dense and porous thin films. | ||
For a given composition, the dense films show a higher Young's modulus than their porous counterparts, as expected due to their higher density (Fig. 10a). The decrease of hardness and Young's modulus with porosity is a well-documented effect.38–40 The relation between the Young's moduli of the porous and bulk materials is given by
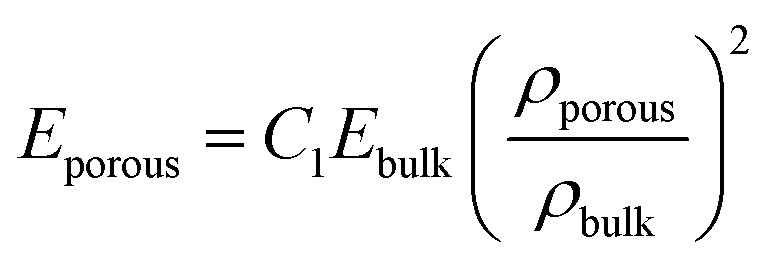 | (3) |
 | (4) |
 | ||
| Fig. 11 Averaged reduced Young's modulus and hardness of porous and dense Ni–Pt thin films (a) and the relative changes in Er and H introduced by porosity, in percentage of the values determined for the dense films (b), at a penetration depth of 40 nm. | ||
Comparing the reduced Young's moduli of porous and non-porous films with similar composition using eqn (3), the relative density is different for each composition. From the microstructures it can be assumed that the mesoporosity introduced by the surfactant is constant over all compositions, however, Ni98Pt2 may have some additional porosity due to voids in-between the grains (cf.Fig. 2). For Ni98Pt2, the relative density yields 61%, i.e. a porosity of 39%. Contrarily, for the pair Ni94Pt6 (porous) and Ni93Pt7 (dense), the determined relative density is 92% (and thus corresponding to a porosity of 8%). The relative densities of the two remaining porous/non-porous pairs (Ni92Pt8/Ni91Pt9 and Ni76Pt24/Ni79Pt21) are 82% and 83%, respectively.
An interplay between porosity, Ni/Pt ratio and grain size may be appreciated in the Young's modulus. As observed, E is always larger in bulk solid films than in their porous counterparts. Also, the Young's modulus tends to increase with the Ni content in agreement with the rule of mixture of two different elements where ENi = 200 GPa and EPt = 172 GPa.5 Grain size might also have an influence on E but its effect should be negligible compared to the other two.
Depending on the state of annealing, the hardness of a pure metal can vary significantly from a metallurgical viewpoint. Generally, Ni bulk metal can reach a Vickers hardness of 1.7 GPa in an annealed state, and 6.3 GPa in a hardened state.5 Concerning electrodeposited pure Ni, nanocrystalline films with grain sizes (d) between 12 nm and 22 nm exhibit hardness values between 3.9 (d = 22 nm) and 6.4 GPa (d = 14) nm (ref. 43)—in this case, the high hardness is a result of the nanocrystallinity. For Pt bulk material, the hardness values vary between 0.4 GPa (annealed) and 2.1 GPa (hardened).5 The inversion of the Hall–Petch relationship due to a change in the mechanism of plastic deformation was determined for nanocrsytalline Pt for grain sizes lower than 10 nm.44
The Ni–Pt films possess hardness values lying between 4 GPa and 6 GPa. The generally high values are a result of the nanocrystallinity, however, internal stresses may also contribute to an increased hardness. In the compositional range between 75% and 95% Ni, where the grain size is constant, a trend of increasing hardness with increasing Pt content is observed, which may be related to a solid solution strengthening. For Ni98Pt2, this trend is not continued and its higher hardness may be the result of the difference in grain size (cf.Fig. 2b and Table 2). It has been shown that below a grain size of 14 nm, the breakdown of the Hall–Petch relationship is reached for Ni.43 Thus, apart from the Ni98Pt2 films, all other Ni–Pt films are subject to an inverse Hall–Petch effect, resulting in lower hardness values for those films.
An effect of the porosity on the hardness of the films in the compositional range between 75% and 95% Ni lies within the measurement uncertainty and cannot be observed (Fig. 10b and 11a). Only for the composition Ni98Pt2, the hardness is significantly lower when porosity is present.
3.5 Magnetic properties
In-plane hysteresis loops conducted by VSM show highest saturation magnetisation Ms and coercivity Hc for Ni-rich films, both decreasing with Pt content (Fig. 12). A change of slope (the orientation of magnetic domains is increasingly hindered) occurring between the coercivity field and the saturation magnetisation is observed for both mesoporous and dense films. This effect is generally stronger for dense films—with the exception of Ni98Pt2 which shows the same behaviour as its porous counterpart—indicating that the observed behaviour may be caused by internal stresses which are less pronounced in the porous films. In the case of Ni98Pt2, it is assumed that internal stresses are minimised due to the fact that the material is almost pure Ni and therefore the effect of stresses due to dissolution of Pt (with a higher atomic radius) into the Ni lattice is smaller. | ||
| Fig. 12 In-plane magnetic hysteresis loops for porous and dense Ni–Pt thin films with different compositions. | ||
The saturation magnetisation Ms follows a linear trend with the composition for all films. For a given composition, the mass-normalised Ms is identical for both dense and porous films. The same is true for the coercivity of the porous films (Fig. 13). For Ni98Pt2, Ms reaches 46 emu g−1, approaching the value for pure Ni of 54 emu g−1 (ref. 45) and thus confirming again that the oxygen content is negligible.
 | ||
| Fig. 13 Dependence of saturation magnetisation Ms and coercivity Hc on composition of Ni–Pt thin films, taken from in-plane hysteresis measurements. The linear trends for the mesoporous films are displayed as dotted lines. | ||
Comparing the behaviour along in-plane and out-of-plane measuring directions, it is clearly observed that the magnetically hard axis lies out of plane, where the loops are strongly tilted with respect to the in-plane direction. Therefore, the hysteresis loops of dense and porous films are dominated by shape anisotropy. Here, the orientation of magnetic domains normal to the plane is energetically unfavourable, and an increased energy input (applied field) is needed to fully magnetise the films normal to the plane (Fig. 14). The out-of-plane coercivity is lower, i.e. it is easier to demagnetise the material in this mode compared to in-plane. Contrarily to the in-plane mode, the out-of-plane hysteresis loops show a widening when approaching saturation. This effect is generally observed in Ni-rich alloy films—permalloy in particular—as the so-called transcritical state.46 When the film thickness is sufficiently high, magnetic stripe domains form by part of the magnetisation orienting out of the plane (when applying an external magnetic field in plane) due to an anisotropy caused by in-plane internal stresses.46
 | ||
| Fig. 14 In-plane and out-of-plane magnetic hysteresis loops for two selected dense and porous Ni–Pt thin films with similar composition. | ||
The temperature scans reveal a phase transition of the Ni–Pt alloys from ferromagnetic to paramagnetic state (Fig. 15). The fact that a single transition is observed consolidates that the structure of the films is indeed single-phase.
 | ||
| Fig. 15 Dependence of magnetisation on temperature of mesoporous Ni–Pt thin films at 1000 Oe. | ||
As a general trend, the magnetic transition and therefore the Curie temperature shifts to lower temperatures for films with higher Pt content. The magnetisation curve for Ni58Pt42 shows only the final part of the phase transition, indicating that its TC is very close to RT (Fig. 15, violet curve).
The resulting values for TC show a linear relationship with the percentage of Ni (Fig. 16). The TC was only determined for those films where the magnetic transition appeared sufficiently above the start of the measurement range (298 K).
 | ||
| Fig. 16 Curie temperature TC as a function of composition of mesoporous Ni–Pt thin films. TC for pure Ni is shown for reference. The general trend is indicated by a dotted line. | ||
4 Conclusions
Mesoporous and dense Ni–Pt thin films have been synthesised by electrodeposition from aqueous media, achieving the mesoporosity through micelle-assisted deposition with a block copolymer. The composition of the thin films can be tuned in a large range between Ni98Pt2 and Ni61Pt39 by varying the deposition potential, resulting in a single-phase Ni–Pt solid solution in all cases. The porosity is homogeneously distributed for all compositions and the nanocrystallinity is not affected by the porosity. Crystallite sizes are around 50 nm for the most Ni-rich composition Ni98Pt2, and between 5–7 nm for the other compositions. The mechanical properties are strongly dependent on both porosity and composition. The ratio of the reduced Young's moduli suggests a porosity of around 18% for Pt contents of 8 at% and more, whereas a porosity of 39% is obtained for Ni98Pt2. Apart from the effect of porosity, the reduced Young's modulus shows a strong compositional dependence, increasing with the Ni content. The measured hardness shows the effect of solid solution strengthening, and an effect of the microstructure in the case of Ni98Pt2, due to the significantly different morphology and grain size at this particular composition. The single-phase character also makes it possible to tune the magnetic properties with the composition; TC can be adjusted to a desired value reaching from the TC of Ni (630 K) down to RT and below. Adjusting TC to RT may allow to study the magnetic behaviour close to TC, and other possible effects such as a voltage-dependency of TC. Apart from TC, the saturation magnetisation and—in the case of the mesoporous films—also the coercivity scales with the composition, thus facilitating to predict the magnetic behaviour for a certain composition and to easily select a suitable composition in order to obtain the desired magnetic properties.Conflicts of interest
There are no conflicts to declare.Acknowledgements
This work has received funding from the European Union's Horizon 2020 research and innovation programme under the Marie Skłodowska-Curie grant agreement no. 764977. Further funding has been obtained from the Generalitat de Catalunya (2017-SGR-292 Project) and the Spanish Ministerio de Economía, Industria y Competitividad (MAT2017-86357-C3-1-R and associated FEDER Project). The European Research Council (SPIN-PORICS 2014-consolidator grant, agreement no. 648454) is also acknowledged. J. F. is grateful to MINECO for the “Juan de la Cierva” (IJCI-2015-27030) contract.Notes and references
- G. Schiavone, M. P. Y. Desmulliez and A. J. Walton, Micromachines, 2014, 5, 622 CrossRef.
- MEMS: A practical guide to design, analysis, and applications, ed. J. Korvink and O. Paul, William Andrew, NY and Springer-Verlag, Germany, 2006 Search PubMed.
- R. Coutu Jr., P. Kladitis, K. Leedy and R. Crane, J. Micromech. Microeng., 2004, 14, 1157 CrossRef.
- D. Niarchos, Sens. Actuators, A, 2003, 106, 255 CrossRef CAS.
- F. Cardarelli, Materials Handbook, Springer Intl. Publishing AG, Switzerland, 3rd edn, 2018 Search PubMed.
- J. Weertman, Mater. Sci. Eng., A, 1993, 166, 161 CrossRef.
- E. Pellicer, A. Varea, S. Pané, B. J. Nelson, E. Menéndez, M. Estrader, S. Suriñach, M. D. Baró, J. Nogués and J. Sort, Adv. Funct. Mater., 2010, 20, 983 CrossRef CAS.
- H. Li and F. Ebrahimi, Mater. Sci. Eng., A, 2003, 347, 93 CrossRef.
- Z. Li, J. Barnes, A. Bosoy, J. F. Stoddart and J. Zink, Chem. Soc. Rev., 2012, 41, 2590 RSC.
- N. Linares, A. Silvestre-Albero, E. Serrano, J. Silvestre-Albero and J. García-Martínez, Chem. Soc. Rev., 2014, 43, 7681 RSC.
- L. Zhang, L. Jin, B. Liu and J. He, Front. Chem., 2019, 7, 22 CrossRef CAS PubMed.
- A. L. Wang, H. Xu, J. X. Feng, L. X. Ding, Y. X. Tong and G. R. Li, J. Am. Chem. Soc., 2013, 135, 10703 CrossRef CAS PubMed.
- L. X. Ding, A. L. Wang, G. R. Li, Z. Liu, W. X. Zhao, C. Su and Y. X. Tong, J. Am. Chem. Soc., 2012, 134, 5730 CrossRef CAS PubMed.
- A. Quintana, J. Zhang, E. Isarain-Chávez, E. Menéndez, R. Cuadrado, R. Robles, M. D. Baró, M. Guerrero, S. Pané, B. J. Nelson, C. M. Müller, P. Ordejón, J. Nogués, E. Pellicer and J. Sort, Adv. Funct. Mater., 2017, 27, 1701904 CrossRef.
- C. Navarro-Senent, A. Quintana, E. Menéndez, E. Pellicer and J. Sort, APL Mater., 2019, 7, 030701 CrossRef.
- B. G. Trewyn, S. Giri, I. I. Slowing and V. S.-Y. Lin, Chem. Commun., 2007, 31, 3236 RSC.
- R. Du, Q. Zhao, Z. Zheng, W. Hu and J. Zhang, Adv. Energy Mater., 2016, 6, 1600473 CrossRef.
- O. Kharissova, H. V. R. Dias and B. I. Kharisov, RSC Adv., 2015, 5, 6695 RSC.
- P. Nash and M. F. Singleton, Bull. Alloy Phase Diagrams, 1989, 10, 258p CrossRef.
- R. A. Walker and J. B. Darby Jr., Acta Metall., 1970, 18, 1261 CrossRef CAS.
- A. Gomes and M. I. da Silva Pereira, Electrochim. Acta, 2006, 51, 1342 CrossRef CAS.
- C. Navarro-Senent, J. Fornell, E. Isarain-Chávez, A. Quintana, E. Menéndez, M. Foerster, L. Aballe, E. Weschke, J. Nogués, E. Pellicer and J. Sort, ACS Appl. Mater. Interfaces, 2018, 10, 44897 CrossRef CAS PubMed.
- E. Isarain-Chávez, M. D. Baró, E. Pellicer and J. Sort, Nanoscale, 2017, 9, 18081 RSC.
- B. Craig, ASM Handbook, Volume 13A: Corrosion: Fundamentals, Testing, and Protection, ASM Intl., 2003, pp. 367–380 Search PubMed.
- Y. Liu, C. M. Hangarter, U. Bertocci and T. P. Moffat, J. Phys. Chem. C, 2012, 116, 7848–7862 CrossRef CAS.
- V. Malgras, H. Ataee-Esfahani, H. Wang, B. Jiang, C. Li, K.-W. Wu, J. Kim and Y. Yamauchi, Adv. Mater., 2015, 28, 993 CrossRef PubMed.
- H. Wang, L. Wang, T. Sato, Y. Sakamoto, S. Tominaka, K. Miyasaka, N. Miyamoto, Y. Nemoto, O. Terasaki and Y. Yamauchi, Chem. Mater., 2012, 24, 1591 CrossRef CAS.
- J. Zhang, A. Quintana, E. Menéndez, M. Coll, E. Pellicer and J. Sort, ACS Appl. Mater. Interfaces, 2018, 10, 14877–14885 CrossRef CAS PubMed.
- Materials analysis using diffraction, http://maud.radiographema.com/, (accessed Dec. 2019).
- L. Luterotti, Nucl. Instrum. Methods Phys. Res., Sect. B, 2010, 268, 334 CrossRef.
- A. C. Fischer-Cripps, Nanoindentation, Springer, NY, 1st edn, 2002 Search PubMed.
- W. C. Oliver and G. M. Pharr, J. Mater. Res., 1992, 7, 1564 CrossRef CAS.
- C. S. Grommé, T. L. Wright and D. L. Peck, J. Geophys. Res., 1969, 74, 5277 CrossRef.
- L. Vegard, Z. Phys., 1921, 5, 17 CrossRef CAS.
- U. Kumar, K. G. Padmalekha, P. K. Mukhopadhyay, D. Paudyal and A. Mookerjee, J. Magn. Magn. Mater., 2005, 292, 234–240 CrossRef CAS.
- S. Sengupta, A. Patra, S. Jena, K. Das and S. Das, Metall. Mater. Trans. A, 2018, 49A, 920–937 CrossRef.
- A. W. Hull, Phys. Rev., 1921, 17, 571–588 CrossRef CAS.
- F. Tancret and F. Osterstock, Philos. Mag., 2003, 83, 125 CrossRef CAS.
- S. Cariou, F.-J. Ulm and L. Dormieux, J. Mech. Phys. Solids, 2008, 56, 924 CrossRef CAS.
- J. Biener, A. M. Hodge, A. V. Hamza, L. M. Hsiung and J. H. Satcher Jr., J. Appl. Phys., 2005, 97, 024301 CrossRef.
- L. J. Gibson and M. F. Ashby, Cellular solids: structure and properties, Cambridge University Press, UK, 2nd edn, 1997 Search PubMed.
- H. J. Jin, L. Kurmanaeva, J. Schmauch, H. Rösner, Y. Ivanisenko and J. Weissmüller, Acta Mater., 2009, 57, 2665 CrossRef CAS.
- C. Schuh, T. Nieh and T. Yamasaki, Scr. Mater., 2002, 46, 735 CrossRef CAS.
- X. Shu, D. Kong, Y. Lu, H. Long, S. Sun, X. Sha, H. Zhou, Y. Chen, S. Mao and Y. Liu, Sci. Rep., 2017, 7, 13264 CrossRef PubMed.
- B. Cullity and C. Graham, Introduction to magnetic materials, John Wiley & Sons, Inc., NJ, 2nd edn, 2009 Search PubMed.
- A. V. Svalov, I. R. Aseguinolaza, A. Garcia-Arribas, I. Orue, J. M. Barandiaran, J. Alonso, M. L. Fernández-Gubieda and G. V. Kurlyandskaya, IEEE Trans. Magn., 2010, 46, 333 CAS.
| This journal is © The Royal Society of Chemistry 2020 |