 Open Access Article
Creative Commons Attribution 3.0 Unported Licence
Photoacoustic identification of laser-induced microbubbles as light scattering centers for optical limiting in a liquid suspension of graphene nanosheets†
Qiuhui
Zhang‡
 ab,
Yi
Qiu‡
 bc,
Feng
Lin
 bd,
Chao
Niu
 e,
Xufeng
Zhou
 f,
Zhaoping
Liu
 f,
Md Kamrul
Alam
g,
Shenyu
Dai
 bh,
Wei
Zhang
 e,
Jonathan
Hu
 e,
Zhiming
Wang
d and
Jiming
Bao
 *dg
*dg
aDepartment of Electrical Information Engineering, Henan University of Engineering, Xinzheng, Henan 451191, China
bDepartment of Electrical and Computer Engineering, University of Houston, Houston, Texas 77204, USA
cSchool of Sciences, Southwest Petroleum University, Chengdu 610500, China
dInstitute of Fundamental and Frontier Science, University of Electronic Science and Technology of China, Chengdu, Sichuan 610054, China
eDepartment of Electrical and Computer Engineering, Baylor University, Waco, Texas 76798, USA
fKey Laboratory of Graphene Technologies and Applications of Zhejiang Province, Ningbo Institute of Materials Technology and Engineering, Chinese Academy of Sciences Ningbo, Zhejiang 315201, China
gMaterials Science and Engineering, University of Houston, Houston, Texas 77204, USA. E-mail: jbao@uh.edu
hCollege of Electronics & Information Engineering, Sichuan University, Chengdu, Sichuan 610064, China
First published on 5th March 2020
Abstract
Liquid suspensions of carbon nanotubes, graphene and transition metal dichalcogenides have exhibited excellent performance in optical limiting. However, the underlying mechanism has remained elusive and is generally ascribed to their superior nonlinear optical properties such as nonlinear absorption or nonlinear scattering. Using graphene as an example, we show that photo-thermal microbubbles are responsible for optical limiting as strong light scattering centers: graphene sheets absorb incident light and become heated up above the boiling point of water, resulting in vapor and microbubble generation. This conclusion is based on the direct observation of bubbles above the laser beam as well as a strong correlation between laser-induced ultrasound and optical limiting. In situ Raman scattering of graphene further confirms that the temperature of graphene under laser pulses rises above the boiling point of water but still remains too low to vaporize graphene and create graphene plasma bubbles. Photo-thermal bubble scattering is not a nonlinear optical process and requires very low laser intensity. This understanding helps us to design more efficient optical limiting materials and understand the intrinsic nonlinear optical properties of nanomaterials.
Introduction
Optical limiting (OL) of a medium describes drastically reduced transmission for high intensity laser beams. Because this property can be used to prevent potential laser damage, OL has attracted a lot of attention since the invention of the laser.1 However, it has been challenging to identify or develop suitable materials to exhibit OL at a controlled threshold of laser intensity.1–6 Due to the same reason, the mechanism of OL has also remained an active research field. OL is generally regarded as a nonlinear optical phenomenon because it can be induced by nonlinear absorption or scattering.1–6 Recently, atomically thin 2D nanomaterials have emerged as novel optoelectronic materials with strong nonlinear optical properties.7–11 As an important application, OL has been reported in liquid suspensions of graphene,3,5,12–20 graphene oxide (GO),3,19,21–30 transition metal dichalcogenides (TMD),4,31–37 and black phosphorus.2,38–41 Some OL were observed even with CW lasers.29,30,42,43However, as in previous OL materials, the mechanism of OL in these 2D nanomaterials has not been clearly identified, and more importantly, many proposed mechanisms are either confusing or misleading as to whether the OL is originating from the intrinsic nonlinear optical properties of nanomaterials.12–14,17,18,21–23,31–33,35,38,44–51 Based on the observed strong scattered light, the majority of reported works attribute OL to nonlinear scattering.1,3,12–14,17,33,38,44,46–50 Bubbles were suggested as possible nonlinear scattering centers, but there is no direct experimental proof, and it was still not clear whether the bubbles were generated by plasma breakdown of nanomaterials14,49,50 or evaporation of solvents.3,13,14,17,31–33,38,44,46,48,49 A serious confusion arises when many people still associate OL with the nonlinear optical properties of nanomaterials by simply referring it as nonlinear scattering despite the proposed bubble scattering mechanism.12–14,17,33,38,44,46,48 To make the situation worse, the nonlinear optical coefficient χ3 of nanostructures was also calculated from Z-scan measurement before identifying the OL mechanism,3,12–14,17,18,22,23,29,33,38,45,48–50,52,53 because if the scattering comes from bubbles, it has nothing to do with χ3.
In this work, we chose graphene as a representative nanomaterial to investigate the mechanism of OL.2–5,12–15,17,18,23,31 Using direct imaging of bubbles and the correlation between photoacoustic signals and OL, we conclude that laser-induced microbubbles are responsible for the sudden drop in optical transmission. We also point out that this is the most effective method to achieve OL at low laser intensity, and bubble-induced OL cannot be regarded as nonlinear scattering because it is not directly related to the nonlinear optical property of nanomaterials. This conclusion is applicable to other low dimensional materials. The understanding and clarification of the OL mechanism helps to design a more efficient optical limiter and explore the intrinsic nonlinear optical properties of nanomaterials.
Results and discussion
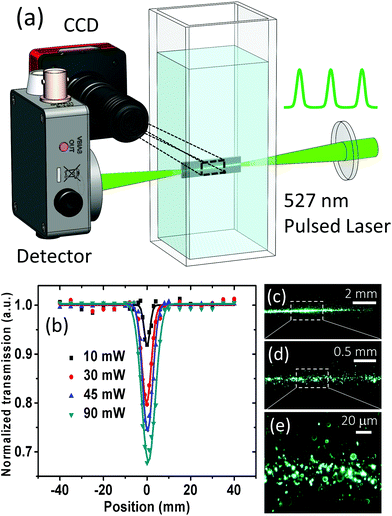
Graphene nanosheets were synthesized via electrochemical exfoliation of highly oriented pyrolytic graphite (HOPG) in K2SO4 salt solution.54 After filtration and ultra-sonication in NMP for 2 hours, the average size of graphene was 1.5 μm with a thickness of 2.4 nm.55,56Fig. 1a shows our initial experimental setup to investigate the mechanism of OL. In addition to the traditional open-aperture Z-scan configuration, we used a high-speed video camera coupled with a microscope objective lens. This setup can not only monitor the scattered light like a photodetector used in previous Z-scan experiments,12,13,17,33,38,46 but also directly image the motion of graphene sheets and emerging bubbles. Here, a 527 nm pulsed laser (150 ns pulse width, 1 kHz repetition rate) was focused with a 10 cm focal length lens on a cuvette, which was filled with graphene suspension in deionized water (DIW). Fig. 1b shows normalized Z-scan transmission at increasing laser power. OL can be clearly confirmed by the sudden drop in transmission near the focus point of the laser beam. As usual, a stronger OL, i.e., lower optical transmission, is achieved with an increasing laser power.The stronger scattering from the focused laser spot is obvious from Fig. 1c. To find out whether the strong scattering originated from bubbles, we zoomed in the camera to obtain higher resolution pictures (Fig. 1d and e). Bubble-like ring objects could be seen in Fig. 1d. However, we quickly realized that these were not bubbles, they were the same bright spots as in low resolution, appearing as bubbles when bright spots were out of focus. Because the lateral sizes of graphene sheets are typically in the range of 500 nm to a few micrometers, larger than the wavelength of visible light, graphene sheets can scatter light and appear as bright spots. In other words, both graphene and bubbles can scatter light, and it is difficult to distinguish them with this direct optical imaging.
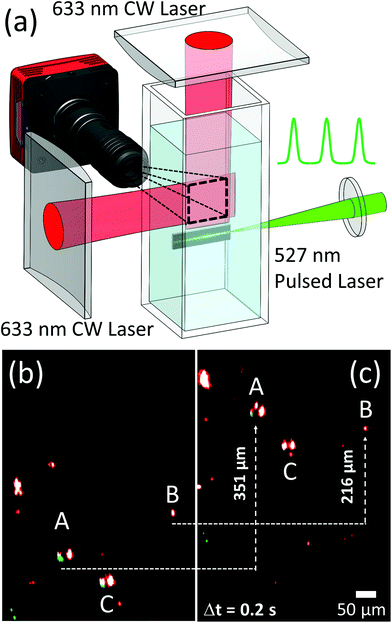
To distinguish graphene scattering from potential bubble scattering and to obtain a clear image of bubbles, we designed a new configuration. As shown in Fig. 2a, we focused two perpendicular 633 nm laser beams with two cylindrical lenses to create a light sheet above the 527 nm laser beam, and monitored the area for a possible bubble in this thin region.57,58 A 527 nm longpass filter was placed in front of the camera to block the strong green laser light. There are several reasons for this detection configuration. First, a thin light sheet allowed us to detect bubbles only in the light sheet and made bubbles outside the light sheet invisible so that ring-like bubble artifacts can be avoided.57–59 Second, the sheet provided a large space for us to study the dynamics of possible bubbles. Third, we expected to observe larger size bubbles as microbubbles merged when drifting upward due to the buoyant force. The rationale behind this configuration is that if there were no micro-bubbles generated in the laser beam, we should not observe any bubbles above the beam.
As expected, fewer scattering centers were observed due to the thin light sheet. Fig. 2b and c show two consecutive snapshots separated by 200 ms. No ring-shaped scattering centers were observed, confirming that they were caused by out-of-focus of the camera. Now there were two types of scattering centers: large-sized centers with two or three bright points together such as A and C versus an individual, dimmer point such as B. A and C were bubbles with a diameter of 30 μm, their two left and right bright spots were due to the scattering of 633 nm laser in the horizontal directions, while a relatively weak point was due to the scattering of light in the vertical direction. The scattering by a single graphene sheet produced a single isolated spot, such as point B. This identification of bubbles from graphene sheets can be further confirmed by their higher upward moving speed: bubble A moved up by 351 μm while graphene B only traveled 261 μm in 0.2 seconds. This is because the motion of graphene sheet was driven by the fluid convection, which was induced by local laser heating. Bubbles moved faster because of the additional buoyant force. Note that bubbles were only observed above the focused laser beam when OL occurred. These observations indicate that microbubbles must be produced in the laser beam during the OL.
Having observed the bubbles during OL, we employed a new technique to further confirm the generation of microbubbles and identify them as light scattering centers. Fig. 3a shows the new experimental design where a hydrophone was used to detect ultrasound.57,58 The purpose was to hear laser-induced micro-bubbles instead of seeing them. To establish a tight correlation between ultrasound generation and OL, we performed OL first, obtained the Z-scan curve shown in Fig. 3b, and then chose three positions A, B, and C. Position A exhibited the strongest OL, while position C exhibited no OL. Fig. 3c shows the corresponding ultrasound traces. It can be seen that the strongest ultrasound was observed at position A, and the ultrasound was too weak to be detected at position C. We want to point out that under nanosecond laser excitation, graphene can produce ultrasound through thermal expansion at position C, but that ultrasound signal will be dramatically enhanced with the microbubbles that were generated at position A.60–62
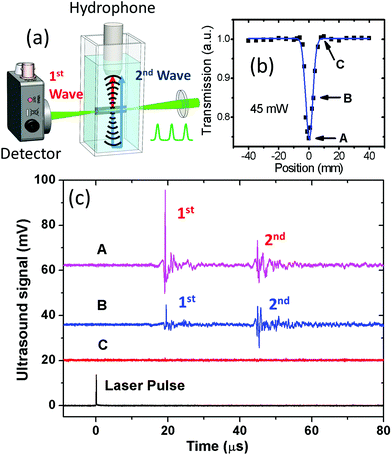 | ||
| Fig. 3 Experimental setup to correlate OL with the photoacoustic signal of bubbles. (a) Schematic of the experimental setup. (b) The same Z-scan curve of graphene suspension as in Fig. 1b under a 45 mW laser. (c) Ultrasound signals at different positions of the OL Z-scan curve. The second ultrasound pulses around 45 μs were due to reflection from the bottom of the cuvette. The laser pulse is also included to mark the beginning of laser excitation. The 2nd pulse (2nd Wave) is a reflection of the 1st pulse (1st Wave) from the bottom of the cuvette. | ||
A pre-condition for bubble generation is that the temperature of graphene sheets must become higher than the boiling point of water under laser excitation. To estimate the rise of temperature due to laser absorption during OL, we used the same excitation laser to measure the Raman shift of graphene. Because of a relatively long interaction time (∼150 ns), this Raman shift will reflect an average temperature of graphene during laser irradiation. Fig. 4a shows the Raman-OL experimental setup, and Fig. 4b shows the Raman spectra of graphene sheets under the same laser powers of 10 and 45 mW as shown in Fig. 1. A Raman shift of nearly 3 cm−1 was observed, corresponding to a rise of 180 °C,63 which brings the sheets above the boiling point of water. This proves that the temperature of graphene became high enough to generate vapor on its surface. However, this temperature rise was certainly not high enough to vaporize graphene and create a micro-plasma which could also become a light scattering center.64–66 Such a mechanism can be further ruled out since no blackbody radiation in the visible wavelength was observed.
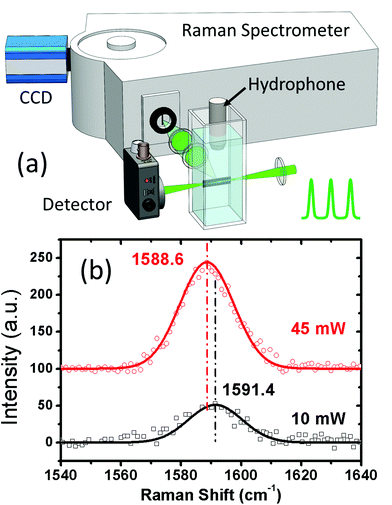 | ||
| Fig. 4 Measurement of graphene temperature using Raman scattering. (a) Schematic for the experimental setup. (b) The Raman spectra of graphene under 10 mW and 45 mW of laser powers. | ||
Based on the above observations and discussions, we can now depict each step of OL. As shown in Fig. 5a, graphene sheets absorbed incident laser energy and became hot, vaporizing the surrounding water and producing micro-bubbles,48,67–70 which in turn strongly scattered incident laser and reduced its transmission. Note that reaching the boiling point is only a necessary condition for OL, other solvent parameters such as thermal capacity and conductivity determine the temperature evolution of graphene flakes,13,71,72 and the dynamics of bubbles is mainly governed by the surface tension of solvents.13,48,67–70 Fig. S1 and S2† show that the boiling points of water and NMP can be quickly reached, and OL is stronger in NMP than in water although the boiling point of NMP (202 °C) is much higher than that of water.
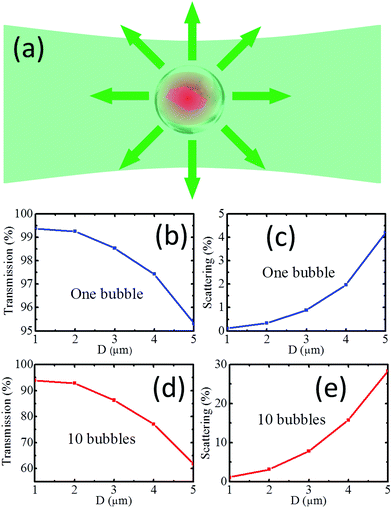
Microbubbles were proposed as light scattering centers in OL,12–14,33,38,44,46,48 as a bubble can create a total reflection of light, but the scattering properties of bubbles and graphene sheets were not quantitatively investigated and compared. Here we use FDTD from Lumerical to calculate the transmission of light through a bubble, assuming that a 0.8 μm diameter graphene sheet with a thickness of 5 nm is located in the center of the bubble with different sizes, as shown in Fig. 5a. Fig. 5b, c and S3† reveal that the scattering power of a bubble increases significantly as its size increases. Fig. 5d and e indicate that 10 cascaded bubbles with 5 μm diameter can reduce the transmission to 60%. The growth and collapse of these microbubbles have been investigated in liquid suspensions of Au or carbon nanoparticles,48,69,70 and we believe that the same picture can be applied to graphene dispersions. More vapors will be generated with higher laser powers, resulting in larger microbubbles and stronger OL.
Laser induced ultrasound was used to investigate OL in carbon black and TiS2, and a similar correlation was obtained.32,49,73 However, thermal expansion of nanomaterials or solvents, instead of bubbles, was considered to generate the photoacoustic signal, and OL was attributed to the nonlinear absorption of carbon black or TiS2.32,49,73 Nonlinear scattering of nanomaterials was traditionally referred to their intrinsic nonlinear optical properties. Under a higher laser intensity, the optical refractive index of the suspended nanomaterials increases, resulting in a larger index mismatch with their surrounding media and stronger light scattering.74–77 Phenomenologically, the reduced transmission in Z-scan appears as a nonlinear effect, but it is misleading to simply call it nonlinear scattering,12–14,17,33,38,44,46,48 and the calculation of χ3 based on Z-scan alone without knowing the underlying mechanism should be avoided.3,12–14,17,18,22,23,29,33,38,45,48–50,52,53
Conclusions
In conclusion, we have designed and developed a series of experiments to prove that laser induced bubbles are responsible for the observed OL in graphene suspension. The same techniques and mechanism are applicable to other 2D nanomaterials and even carbon nanotubes.48–51,53 Bubble scattering is not a nonlinear optical process, so the mechanism of such OL cannot be simply called nonlinear scattering. An accurate understanding and identification of the mechanism of OL is crucial for the design of effective laser protection media and exploration of optical application of nanomaterials’ intrinsic properties. Because of the low laser intensity required to generate microbubbles, it is possible to use graphene to design broadband efficient OL devices.Author contributions
Q. Z., Y. Q., F. L., M. A. and S. D. performed optical limiting experiments, C. N., W. Z. and J. H. calculated bubble scattering, F. L., X. Z. and Z. L. synthesized graphene, J. B. and Z. W. designed the experiments. Q. Z. and J. B. wrote the paper. All the authors read the manuscript and provided comments.Conflicts of interest
The authors declare no competing financial interest.Acknowledgements
Q. H. Zhang acknowledges support from the National Natural Science Foundation of China (No. 61805071, 61605186) and Key Scientific and Technological projects in Henan Province of China (No. 202102310002). J. H. acknowledges support from the U. S. National Science Foundation (ECCS-1809622). J. M. Bao acknowledges support from the Welch Foundation (E-1728) and National Science Foundation (EEC-1530753).References
- L. W. Tutt and T. F. Boggess, Prog. Quantum Electron., 1993, 17, 299–338 CrossRef CAS.
- Z. Liu, B. Zhang and Y. Chen, Chemistry, 2019, 1, 17–43 CrossRef.
- Y. Chen, T. Bai, N. Dong, F. Fan, S. Zhang, X. Zhuang, J. Sun, B. Zhang, X. Zhang, J. Wang and W. J. Blau, Prog. Mater. Sci., 2016, 84, 118–157 CrossRef CAS.
- J. W. You, S. R. Bongu, Q. Bao and N. C. Panoiu, Nanophotonics, 2018, 8, 63–97 Search PubMed.
- Z. Liu, X. Zhang, X. Yan, Y. Chen and J. Tian, Chin. Sci. Bull., 2012, 57, 2971–2982 CrossRef CAS.
- J. J. Butler, A. S. Bowcock, S. R. Sueoka, S. R. Montgomery, S. R. Flom, E. J. Friebele, B. M. Wright, J. R. Peele, R. G. S. Pong, J. S. Shirk, J. Hu, C. R. Menyuk and T. F. Taunay, Opt. Express, 2013, 21, 20707–20712 CrossRef PubMed.
- F. Bonaccorso, Z. Sun, T. Hasan and A. C. Ferrari, Nat. Photonics, 2010, 4, 611–622 CrossRef CAS.
- A. K. Geim and K. S. Novoselov, Nat. Mater., 2007, 6, 183–191 CrossRef CAS PubMed.
- J. B. Khurgin, Appl. Phys. Lett., 2014, 104, 161116 CrossRef.
- J. R. Schaibley, P. Rivera, K. Seyler, T. Karin, J. Yan, D. G. Mandrus, W. Yao, K. M. Fu and X. Xu, CLEO, 2016, 1–2 Search PubMed.
- W. Li, B. Chen, C. Meng, W. Fang, Y. Xiao, X. Li, Z. Hu, Y. Xu, L. Tong, H. Wang, W. Liu, J. Bao and Y. R. Shen, Nano Lett., 2014, 14, 955–959 CrossRef CAS PubMed.
- L. Yan, Y. Xiong, J. Si, X. Sun, W. Yi and X. Hou, Opt. Express, 2014, 22, 31836–31841 CrossRef CAS PubMed.
- J. Wang, Y. Hernandez, M. Lotya, J. N. Coleman and W. J. Blau, Adv. Mater., 2009, 21, 2430–2435 CrossRef CAS.
- X. Cheng, N. Dong, B. Li, X. Zhang, S. Zhang, J. Jiao, W. J. Blau, L. Zhang and J. Wang, Opt. Express, 2013, 21, 16486–16493 CrossRef PubMed.
- A. Benoy, K. Adarsh, S. S. Siva Sankara, P. Reji and R. Sundara, J. Mater. Chem. C, 2013, 1, 2773–2780 Search PubMed.
- L. Cao, S. Sahu, P. Anilkumar, K. Changyi and S. Ya-Ping, MRS Bull., 2012, 37, 1283–1289 CrossRef CAS.
- M. Feng, H. Zhan and Y. Chen, Appl. Phys. Lett., 2010, 96, 033107 CrossRef.
- G. Demetriou, H. T. Bookey, F. Biancalana, E. Abraham, Y. Wang, W. Ji and A. K. Kar, Opt. Express, 2016, 24, 13033–13043 CrossRef CAS PubMed.
- Y. Liu, J. Zhou, X. Zhang, Z. Liu, X. Wan, J. Tian, T. Wang and Y. Chen, Carbon, 2009, 47, 3113–3121 CrossRef CAS.
- G. Lim, Z. Chen, J. Clark, R. G. S. Goh, W. Ng, H. Tan, R. H. Friend, P. K. H. Ho and L. Chua, Nat. Photonics, 2011, 5, 554–560 CrossRef CAS.
- Z. Liu, Y. Wang, X. Zhang, Y. Xu, Y. Chen and J. Tian, Appl. Phys. Lett., 2009, 94, 021902 CrossRef.
- X. Zhang, Z. Liu, X. Li, Q. Ma, X. Chen, J. Tian, Y. Xu and Y. Chen, Opt. Express, 2013, 21, 7511–7520 CrossRef CAS PubMed.
- N. Liaros, K. Iliopoulos, M. M. Stylianakis, E. Koudoumas and S. Couris, Opt. Mater., 2013, 36, 112–117 CrossRef CAS.
- S. Biswas, A. Kole, C. Tiwary and P. Kumbhakar, RSC Adv., 2016, 6, 10319–10325 RSC.
- N. Liaros, P. Aloukos, A. Kolokithas-Ntoukas, A. Bakandritsos, T. Szabo, R. Zboril and S. Couris, J. Phys. Chem. C, 2013, 117, 6842–6850 CrossRef CAS.
- X. Zhang, X. Zhao, Z. Liu, S. Shi, W. Zhou, J. Tian, Y. Xu and Y. Chen, J. Opt., 2011, 13, 075202 CrossRef.
- Y. Yu, L. Yan, M. Yue and H. Xu, R. Soc. Open Sci., 2018, 5, 171436 CrossRef PubMed.
- R. Prizia, C. Conti and N. Ghofraniha, J. Opt. Soc. Am. B, 2019, 36, 19–25 CrossRef CAS.
- G. Muruganandi, M. Saravanan, G. Vinitha, M. J. Raj and T. S. Girisun, Chem. Phys., 2017, 488, 55–61 CrossRef.
- F. Ghasemi, S. Razi and K. Madanipour, J. Electron. Mater., 2018, 47, 2871–2879 CrossRef CAS.
- N. Dong, Y. Li, S. Zhang, X. Zhang and J. Wang, Adv. Opt. Mater., 2017, 5, 1700543 CrossRef.
- S. J. Varma, J. Kumar, Y. Liu, K. Layne, J. Wu, C. Liang, Y. Nakanishi, A. Aliyan, W. Yang, P. M. Aiayan and J. Thomas, Adv. Opt. Mater., 2017, 5, 1700713 CrossRef.
- N. Dong, Y. Li, Y. Feng, S. Zhang, X. Zhang, C. Chang, J. Fan, L. Zhang and J. Wang, Sci. Rep., 2015, 5, 14646 CrossRef CAS PubMed.
- M. Zhao, M. Chang, Q. Wang, Z. Zhu, X. Zhai, M. Zirak, A. Z. Moshfegh, Y. Song and H. Zhang, Chem. Commun., 2015, 51, 12262–12265 RSC.
- K. Zhou, M. Zhao, M. Chang, Q. Wang, X. Wu, Y. Song and H. Zhang, Small, 2015, 11, 694–701 CrossRef CAS PubMed.
- H. Long, L. Tao, C. P. Chiu, C. Y. Tang, K. H. Fung, Y. Chai and Y. H. Tsang, Nanotechnology, 2016, 27, 414005 CrossRef PubMed.
- H. Pan, H. Chu, Y. Li, S. Zhao and D. Li, J. Alloys Compd., 2019, 806, 52–57 CrossRef CAS.
- J. Huang, N. Dong, S. Zhang, Z. Sun, W. Zhang and J. Wang, ACS Photonics, 2017, 4, 3063–3070 CrossRef CAS.
- F. Zhang, Z. Wu, Z. Wang, D. Wang, S. Wang and X. Xu, RSC Adv., 2016, 6, 20027–20033 RSC.
- X. Zheng, R. Chen, G. Shi, J. Zhang, Z. Xu, X. Cheng and T. Jiang, Opt. Lett., 2015, 40, 3480–3483 CrossRef CAS PubMed.
- X. Jiang, Z. Zeng, S. Li, Z. Guo, H. Zhang, F. Huang and Q. Xu, Materials, 2017, 10, 210 CrossRef PubMed.
- M. M. Ara, H. Akheratdoost and E. Koushki, J. Mol. Liq., 2015, 206, 4–9 CrossRef.
- M. Zidan, A. Allaf, M. Alsous and A. Allahham, Opt. Laser Technol., 2014, 58, 128–134 CrossRef CAS.
- L. Vivien, D. Riehl, F. Hache and E. Anglaret, Physica B, 2002, 323, 233–234 CrossRef CAS.
- S. Husaini, J. E. Slagle, J. M. Murray, S. Guha, L. P. Gonzalez and R. G. Bedford, Appl. Phys. Lett., 2013, 102, 191112 CrossRef.
- J. Wang and W. J. Blau, J. Phys. Chem. C, 2008, 112, 2298–2303 CrossRef CAS.
- J. Wang, D. Fruchtl, Z. Sun, J. N. Coleman and W. J. Blau, J. Phys. Chem. C, 2010, 114, 6148–6156 CrossRef CAS.
- I. M. Belousova, N. G. Mironova, A. G. Scobelev and M. S. Yur'ev, Opt. Commun., 2004, 235, 445–452 CrossRef CAS.
- I. M. Kislyakov and C. S. Yelleswarapu, Appl. Phys. Lett., 2013, 103, 151104 CrossRef.
- M. N. Karen and P. W. Diane, J. Opt. Soc. Am. B, 1995, 12, 1228–1237 CrossRef.
- I. M. Belousova, N. G. Mironova and M. S. C. Yur'ev, Opt. Spectrosc., 2003, 94, 86–91 CrossRef CAS.
- H. Zhang, S. Virally, Q. Bao, L. K. Ping, S. Massar, N. Godbout and P. Kockaert, Opt. Lett., 2012, 37, 1856–1858 CrossRef CAS PubMed.
- R. Y. Krivenkov, T. N. Mogileva, K. G. Mikheev, A. V. Okotrub and G. M. Mikheev, J. Phys. Chem. C, 2018, 122, 16339–16345 CrossRef CAS.
- K. Parvez, Z. Wu, R. Li, X. Liu, R. Graf, X. Feng and K. Miillen, J. Am. Chem. Soc., 2014, 136, 6083–6091 CrossRef CAS PubMed.
- F. Lin, G. Yang, C. Niu, Y. Wang, Z. Zhu, H. Luo, C. Dai, D. Mayerich, Y. Hu, J. Hu, X. Zhou, Z. Liu, Z. Wang and J. Bao, Adv. Funct. Mater., 2018, 28, 1805255 CrossRef.
- F. Lin, Z. Zhu, X. Zhou, W. Qiu, C. Niu, J. Hu, D. Keshab, Y. Wang, Z. Zhao, Z. Ren, L. Dimitri, Z. Liu, Z. Wang and J. Bao, Adv. Mater., 2017, 29, 1604453 CrossRef PubMed.
- Y. Wang, Q. Zhang, Z. Zhu, F. Lin, J. Deng, G. Ku, S. Dong, S. Song, M. K. Alam, D. Liu, Z. Wang and J. Bao, Sci. Adv., 2018, 3, e1700555 CrossRef PubMed.
- S. Yue, F. Lin, Q. Zhang, N. Epie, S. Dong, X. Shan, D. Liu, W. Chu, Z. Wang and J. Bao, Proc. Natl. Acad. Sci. U. S. A., 2019, 116, 6580–6585 CrossRef CAS PubMed.
- O. E. Olarte, J. Andilla, E. J. Gualda and P. Loza-Alvarez, Adv. Opt. Photonics, 2018, 10, 111–179 CrossRef.
- X. Wang, R. S. Witte and H. Xin, Appl. Phys. Lett., 2016, 108, 143104 CrossRef.
- A. Vogel, S. Busch and U. Parlitz, J. Acoust. Soc. Am., 1996, 100, 148–165 CrossRef.
- M. G. Gonzalez, X. Liu, R. Niessner and C. Haisch, Appl. Phys. Lett., 2010, 96, 174104 CrossRef.
- I. Calizo, A. A. Balandin, W. Bao, F. Miao and C. N. Lau, Nano Lett., 2007, 7, 2645–2649 CrossRef CAS PubMed.
- L. A. Openov and A. I. Podlivaev, Phys. Solid State, 2016, 58, 847–852 CrossRef CAS.
- S. S. Harilal, R. C. Lssac, C. V. Bindhu, V. P. N. Nampoori and C. P. G. Vallabhan, J. Phys. D: Appl. Phys., 1997, 30, 1703–1709 CrossRef CAS.
- S. Zhang, X. Wang, M. He, Y. Jiang, B. Zhang, W. Huang and B. Huang, Spectrochim. Acta, Part B, 2014, 97, 13–33 CrossRef CAS.
- L. Lin, X. Peng, Z. Mao, W. Li, M. N. Yogeesh, B. B. Rajeeva, E. P. Perillo, A. K. Dunn, D. Akinwande and Y. Zheng, Nano Lett., 2015, 16, 701–708 CrossRef PubMed.
- A. O. Govorov and R. H. H. Richardson, Nano Today, 2007, 2, 30–38 CrossRef.
- E. Lukianova-hleb, Y. Hu, L. Latterini, L. Tarpani, S. Lee, R. A. Drezek, J. H. Hafner and D. O. Lapotko, ACS Nano, 2010, 4, 2109–2123 CrossRef CAS PubMed.
- M. G. Gonzalez, X. Liu, R. Niessner and C. Haisch, Appl. Phys. Lett., 2010, 96, 174104 CrossRef.
- Y. Wang, Y. Tang, P. Cheng, X. Zhou, Z. Zhu, Z. Liu, D. Liu, Z. Wang and J. Bao, Nanoscale, 2017, 9, 3547–3554 RSC.
- J. Wang, D. Fruchtl, W. J. Blau, O. J. Wang, D. Fruchtl and W. J. Blau, Opt. Commun., 2010, 283, 464–468 CrossRef CAS.
- P. Chantharasupawong, R. Philip and J. Thomas, Appl. Phys. Lett., 2013, 102, 041116 CrossRef.
- V. Joudrier, P. Bourdon, F. Hache and C. Flytzanis, Appl. Phys. B, 1998, 67, 627–632 CrossRef CAS.
- R. W. Terhune, P. D. Maker and C. M. Savage, Phys. Rev. Lett., 1965, 14, 681–684 CrossRef.
- N. C. Kothari and C. Flytzanis, Opt. Lett., 1987, 12, 492–494 CrossRef CAS PubMed.
- R. Sylvie and G. Grazia, Annu. Rev. Phys. Chem., 2012, 63, 353–378 CrossRef PubMed.
Footnotes |
| † Electronic supplementary information (ESI) available. See DOI: 10.1039/c9nr10516f |
| ‡ These authors contributed equally to this work. |
| This journal is © The Royal Society of Chemistry 2020 |

