
 Open Access Article
 This Open Access Article is licensed under a Creative Commons Attribution-Non Commercial 3.0 Unported Licence
Release of graphene-related materials from epoxy-based composites: characterization, quantification and hazard assessment in vitro†
Woranan
Netkueakul‡
 ab,
Daria
Korejwo‡
cd,
Tobias
Hammer
ab,
Savvina
Chortarea
c,
Patrick
Rupper
e,
Oliver
Braun
fg,
Michel
Calame
efh,
Barbara
Rothen-Rutishauser
d,
Tina
Buerki-Thurnherr
c,
Peter
Wick§
*c and
Jing
Wang§
*ab
ab,
Daria
Korejwo‡
cd,
Tobias
Hammer
ab,
Savvina
Chortarea
c,
Patrick
Rupper
e,
Oliver
Braun
fg,
Michel
Calame
efh,
Barbara
Rothen-Rutishauser
d,
Tina
Buerki-Thurnherr
c,
Peter
Wick§
*c and
Jing
Wang§
*ab
aInstitute of Environmental Engineering, ETH Zurich, 8093, Zurich, Switzerland. E-mail: jing.wang@ifu.baug.ethz.ch
bLaboratory for Advanced Analytical Technologies, Empa, Swiss Federal Laboratories for Materials Science and Technology, 8600, Dübendorf, Switzerland
cParticles-Biology Interactions Lab, Empa, Swiss Federal Laboratories for Materials Science and Technology, 9014, St Gallen, Switzerland. E-mail: Peter.wick@empa.ch
dAdolphe Merkle Institute, University of Fribourg, 1700 Fribourg, Switzerland
eLaboratory for Advanced Fibers, Empa, Swiss Federal Laboratories for Materials Science and Technology, 9014, St Gallen, Switzerland
fTransport at Nanoscale Interfaces Laboratory, Empa, Swiss Federal Laboratories for Materials Science and Technology, 8600, Dübendorf, Switzerland
gUniversity of Basel, Department of Physics, Basel, 4056, Switzerland
hUniversity of Basel, Swiss Nanoscience Institute, Basel, 4056, Switzerland
First published on 28th April 2020
Abstract
Due to their mechanical strength, thermal stability and electrical conductivity, graphene-related materials (GRMs) have been extensively explored for various applications. Moreover, GRMs have been studied and applied as fillers in polymer composite manufacturing to enhance the polymer performance. With the foreseen growth in GRM production, occupational and consumer exposure is inevitable, thus raising concerns for potential health risks. Therefore, this study aims (1) to characterize aerosol particles released after mechanical abrasion on GRM-reinforced epoxy composites, (2) to quantify the amounts of protruding and free-standing GRMs in the abraded particles and (3) to assess the potential effects of the pristine GRMs as well as the abraded particles on human macrophages differentiated from the THP-1 cell line in vitro. GRMs used in this study included graphene nanoplatelets (GNPs), graphene oxide (GO), and reduced graphene oxide (rGO). All types of pristine GRMs tested induced a dose-dependent increase in reactive oxygen species formation, but a decrease in cell viability was only detected for large GNPs at high concentrations (20 and 40 μg mL−1). The particle modes measured using a scanning mobility particle sizer (SMPS) were 300–400 nm and using an aerodynamic particle sizer (APS) were between 2–3 μm, indicating the release of respirable particles. A significant fraction (51% to 92%) of the GRMs embedded in the epoxy composites was released in the form of free-standing or protruding GRMs in the abraded particles. The abraded particles did not induce any acute cytotoxic effects.
Introduction
Graphene is a two dimensional single atomic layer material consisting of hexagonally arranged sp2 carbon. This allows graphene to possess exceptional properties such as a high charge carrier mobility of 2.5 × 105 cm2 V−1 s−1 at room temperature,1 superior elastic properties of 1 TPa,2 and excellent thermal conductivity with reported values of up to 5300 W m−1 K−1.3 Despite graphene's unique characteristics, it is challenging in terms of costs and processing to produce high quality graphene in bulk. Graphene-related materials (GRMs) such as graphene nanoplatelets (GNP), graphene oxide (GO), and reduced GO (rGO) are derivative species of graphene containing a few to multiple graphene layers. They can be classified according to their thickness, C/O ratio or lateral size.4GRMs are studied and applied as fillers to enhance the properties of polymers. Epoxy is a widely used thermoset polymer with a variety of applications as a structural, coating and adhesive material in several fields such as automotive, aeronautics and electronics, due to its high chemical resistance, good adhesive strength, ease of processing, and reasonable price. However, it is brittle and has poor thermal and electrical conductivity.5,6 The addition of GRMs can improve the electrical properties,7,8 thermal conductivity,9,10 mechanical properties,11–13 and flame retardancy14–18 of epoxy composites.
Due to increased interest in the possible applications of GRMs, concerns about their risk and potential adverse effects on human health have been raised, in particular upon inhalation that represents the most likely route of exposure. Several in vitro and in vivo studies, with different exposure conditions, doses and time points, have shown that some types of GRMs can induce cell apoptosis, oxidative stress or DNA damage, while others did not induce any adverse effects.19–23 The toxicity of GRMs is generally dependent on their physicochemical properties including lateral dimension, surface structure, and functionalization, as well as on their dispersion state and exposure dose.19,20,24–28 For example, Mittal and colleagues revealed that both lateral dimension and functional groups play an important role in the internalization of graphene derivatives including GO, thermally reduced GO and chemically reduced GO by human lung cells.27 Thermally reduced GO, having a smaller lateral size than GO and sharp corners that promoted cellular uptake, showed increased adverse effects on cell viability, oxidative stress and genotoxicity as compared to GO and chemically reduced GO.27 Surface properties such as the C/O ratio of GRMs also play an important role in their toxicity effects. GNPs are hydrophobic, while GO is more hydrophilic due to oxygenated groups. The hydrophilicity of rGO is between that of GNP and GO. GO was reported to cause significantly less cytotoxicity to A549 human alveolar basal epithelial cells than rGO probably due to the differences in hydrophilicity.29 Moreover, because of a higher oxygen content and higher hydrophilicity of GO, which facilitates the formation of a protein corona30 and prevents particle agglomeration,31 GO showed less cytotoxicity to human erythrocytes and skin fibroblasts (CRL-2522) than GNPs.31
During the use phase of GRM-containing composites, GRMs might be released from the composite due to the degradation of the matrix by means of mechanical force, thermal degradation, hydrolysis or UV exposure.32,33 The released particles might be in the form of free-standing GRMs, GRMs fully-embedded in the polymer matrix, or GRMs partially protruding from the polymer matrix. They might pose risks to human health depending on their size and shape. Particles with an aerodynamic diameter smaller than 100 μm can be inhaled, but only a certain percentage of the particles with an aerodynamic diameter smaller than 10 μm can penetrate to the alveolar region of the lung.34 The 2D morphology of GNPs and other GRMs leads to a significant difference between the geometric dimensions (thickness and lateral size) and the aerodynamic size ( , where da is the aerodynamic diameter, dproj is the projected diameter, t is the platelet thickness and ρ and ρ0 are the unit density and particle density, respectively).21 This means that the aerodynamic size of such 2D materials can be much smaller than their lateral dimension, represented by the projected area diameter. Su and colleagues studied the deposition of graphene nanoparticles with a lateral size of 2 μm using human upper airway replicas including nasal and oral-to-lung airways. Only a small fraction (less than 4%) of the graphene nanoparticles were deposited on the studied airways with a deposition efficiency lower than 0.03, implying that the inhalable fraction of graphene nanoparticles could penetrate and deposit into the lower lung compartments.35
In contrast to pristine nanoparticles, hazard assessment of processed particles released from nanoparticle-containing products is scarce and there is, to the best of our knowledge, no study available on the biological impact of particles released from GRM-reinforced composites. For example, the toxicity of the particles generated in the workplace by the machining process of six different epoxy/carbon fiber composites was investigated in vitro using rabbit alveolar macrophages and in vivo using direct intratracheal injection into rat lungs.36 They found that in vitro and in vivo results showed similar ranking for all samples. The toxicity results showed that two of the composites were more toxic than the reference inert particle (Al2O3) for alveolar macrophages, while other four composites showed little toxicity. The inconsistent results among different composites suggested that the composition of the matrix material, i.e. types of epoxy and hardener, could play an important role for the different biological impacts.36–38 For epoxy/carbon nanotube (CNT) composites, Schlagenhauf and co-workers found that abraded particles contained a low fraction of free-standing or protruding CNTs but they did not significantly induce reactive oxygen species (ROS) formation, DNA damage, release of inflammatory cytokines, or cytotoxicity in differentiated human THP-1 macrophages and A549 human alveolar epithelial cells.39 Pang et al. investigated the in vitro toxicity of released particles from the sanding process of nanoscale copper phthalocyanine (n-CuPc)-containing automobile coatings on mouse macrophages. They demonstrated that although n-CuPc itself induced the formation of ROS, the released particles did not induce the ROS formation because n-CuPc particles were embedded in the polymer matrix.40 A recent study found that the released nano-clay particles from low-density polyethylene (LDPE) composites by the aging process using UV and ozone did not induce ROS formation nor a decrease in cell viability on A549 alveolar epithelial cells at both 24 h and 48 h time points.41
Overall, there is inconsistency in the biological impacts of pristine GRMs and a lack of studies on the released particles from the GRM-containing composites, which is critical to the safe and sustainable design of novel GRM-reinforced composites. To fill this knowledge gap, we aim to perform a comprehensive analysis on the safety of GRMs along some stages of the life cycle of epoxy/GRM composites i.e. the occupational exposure to pristine GRMs and the exposure to released particles during the use phase simulated by an abrasion process. This includes investigations on the acute toxicity of pristine GRMs (commercial GNP, GO and rGO) with distinct physicochemical properties on human macrophages differentiated from the THP-1 cell line, particle size distributions (PSDs) of the released particles from the abrasion of epoxy/GRM composites, quantification of the amount of free-standing and protruding GRMs from the abraded particles and the acute cytotoxicity of released particles on differentiated THP-1 macrophages. In this study, epoxy resin, which is an important and frequently used polymer, was chosen as a polymer matrix to produce GRM-reinforced composites due to its transparency and ease of manufacturing. We used human macrophages differentiated from the THP-1 cell line for cytotoxicity evaluation because they are important for the host defense mechanism and cellular response to foreign particles deposited in the lungs, which signify the acute inhalation toxicity in vitro. The results are essential for the hazard and risk evaluation of occupational and consumer exposure and will support the safe development and use of GRM-reinforced polymer composites.
Materials and methods
Fabrication of epoxy/GRM composites
Five types of GRMs were assessed including two types of GNP: GNP-1 (Cheaptubes, USA) and GNP-2 (XG Science, USA), two types of GO: GO-1 (Cheaptubes, USA) and GO-2 and one type of reduced GO (rGO). GO-2 and rGO were provided by Université Paul Sabatier, CNRS, Toulouse, France. The epoxy and hardener used were diglycidyl ether of bisphenol A, DGEBA (Araldite GY 250, Huntsman, USA) and Jeffamine D-230 (Huntsman, USA), respectively. In order to manufacture the epoxy/GRM composites, epoxy resin and 1 wt% GRMs were mixed manually and homogenized using a high speed mixer at 2000 rpm for 5 min. Then GRMs were evenly dispersed in the epoxy matrix using a three-roll-mill (SDY 200, Bühler AG, Switzerland). After addition of the hardener, mixing and degassing, the mixture was poured into a metal mold and cured at 80 °C for 12 h and post-cured at 120 °C for 4 h. The fabricated composites were cut to the desired size for an abrasion process.Characterization of pristine GRMs and abraded particles
The morphology of pristine GRMs and the released particles from the composites was characterized using a scanning electron microscope (SEM) (Nova NanoSEM 230). A SEM equipped with EDX was used to analyze the elemental composition of the materials. Atomic force microscopy was conducted with a Solver Nano atomic force microscope (NT-MTD Spectrum Instruments, Moscow, Russia) to analyze the thickness of pristine GRMs. Raman spectra were obtained using a Raman spectrometer (Senterra, Bruker, Billerica, MA). Diffuse reflectance Fourier transform spectroscopy (DRIFTS) was performed using a VECTOR 22 spectrometer (Bruker Optics). X-ray photoelectron spectroscopy was performed with a Scanning XPS Microprobe system (PHI VersaProbe II spectrometer, Physical Electronics) using monochromatic Al Kα radiation (1486.6 eV). Two random spots per sample were analyzed with a microfocused X-ray beam of 100 μm diameter and dual beam charge neutralization. The samples were pressed onto an indium foil producing flat and continuous areas (no indium signal was observed in the spectra). Survey scan spectra (0–1100 eV) were acquired with 0.8 eV energy step width, 187.85 eV pass energy and 200 ms acquisition time per data point. In addition, higher resolution scans over carbon C 1s and oxygen O 1s were measured (0.125 eV energy step width, 29.35 eV pass energy, 2.4 s acquisition time per data point). More details about the XPS measurements are given in ref. 26. X-ray diffraction was performed on an X-ray diffractometer with the scan range between 5 and 80 degrees and a scan rate of 0.017. The zeta potential and hydrodynamic size distribution of both the pristine GRMs and released particles was characterized using a Zetasizer (model Nano ZS, Malvern Instruments, Worcestershire, UK). For zeta potential measurement, the particles were dispersed in 10% PBS in water. It was not feasible to measure the zeta potential in biological medium since the high ionic strength and the biological constituents in the medium could induce electrode blackening, which could cause errors to the measurement results. The average values of three consecutive measurements were reported. The particle dispersions were prepared in water and complete RPMI-1640 cell culture medium followed by ultra-sonication prior to hydrodynamic size measurement. Due to the instability of the particle dispersion, ultra-sonication was performed just before each size measurement. The mean Z average (Zave) size was obtained from three separate measurements. GRMs were tested for endotoxin contamination with an Endosafe® PTS portable test system (PTS100, Charles River Laboratories; temperature control 37 ± 1 °C; photodetectors at 395 nm wavelength) and Endosafe®PTS Cartridges (Charles River Laboratories, Charleston, USA; assay sensitivity 0.01 EU mL−1) according to the manufacturer's instructions. Further technical details were reported in previous studies.23,26Abrasion process and particle collection
The schematic of the experimental setup is depicted in Fig. S1† (adapted from Schlagenhauf et al., 201242). In this study, we used a Taber abraser (Model 5135, Taber, North Tonawanda, NY) equipped with an S-42 sandpaper strip wrapped around a CS-0 wheel and an additional weight of 1 kg to simulate the sanding process on the surface of the composites. The released particles from the abrasion were drawn from the abrasion area by a rectangular probe, that was placed next to the abrasive wheel above the composite, with a small suction area of 40 mm2 to increase the air flow rate near the sample surface, while the suction area used in the study of Schlagenhauf et al., 2012 was 48 mm2. The samples were analyzed using two instruments including an aerodynamic particle sizer (APS) (Model 3321, TSI) and a scanning mobility particle sizer (SMPS) consisting of a differential mobility analyzer (DMA) (Model 3080, TSI, Shoreview, MN) and a condensation particle counter (CPC) (Model 3775, TSI). These instruments enable online measurement of the particle size distribution of the release particles. After that, the particles were collected on Nuclepore track-etched polycarbonate membranes (Whatman) with a pore size of 0.2 μm. The flow rate was generated by the vacuum line and monitored in the range of 9 to 11 L min−1 using a mass flow controller (Model GFM37, Aalborg, NY). With our setup, the SMPS analyzed the particles with the electrical mobility diameter ranging from 13 to 573 nm, while the APS analyzed the particles with the aerodynamic diameter ranging from 0.54 to 19.81 μm. At least three particle size distributions were collected from each sample. The collection of abraded particles for in vitro toxicity analysis and for further characterization was performed without the SMPS and the APS to reduce the loss of particles through tubing.To validate the experimental setup, we also performed experiments with polystyrene latex (PSL) particles with well-defined sizes of 105 nm, 1 μm and 2 μm. A house-made atomizer was employed to generate aerosol particles of PSL dispersions. After the diffusion dryer (silica gel), the aerosol particles entered the instrumentation (either SMPS or APS). The results demonstrated that using a rectangular probe did not affect the particle size distributions of the aerosolized particles (Fig. S2†).
The Origin 2018 software (OriginLab Corporation, Northampton, MA) was used to fit the particle size distributions to lognormal distribution (eqn (1)) (coefficient of determination >0.99). The parameters in eqn (1) are listed as follows: f(d) is the normalized fraction of the measured particle size distributions as a function of particle size, d; n is the number of the fitted modes; y0 is the baseline of the lognormal distribution; Ai is the area under the graph of each fitted mode; wi is the standard deviation of each fitted mode; μi is the mean of each fitted mode.
 | (1) |
Detection and quantification of free-standing and protruding GRMs
Raman spectroscopy mapping was employed to differentiate between the GRMs from epoxy in the abraded particles. The abraded particles from the epoxy/GNP-2 composite were used as a representative for Raman spectroscopy mapping. Raman mapping was performed with a WITec Alpha 300 R confocal Raman microscope in backscattering geometry. For excitation, a laser with a wavelength of 532 nm and 0.25–5 mW power was employed. To focus the light on the sample a 50× objective (Zeiss, NA = 0.55) is used. The backscattered light was coupled to a spectrometer: a 300 mm lens-based spectrometer with a grating of 600 g mm−1 equipped with a thermoelectrically cooled CCD. An area of 35 μm × 35 μm (115 × 115 points) was scanned with an integration time of 2 s per point. The area intensity map was plotted with a spatial average size of 2.The released particles might contain particles with free-standing GRMs, GRMs fully-embedded in the polymer matrix, or GRMs partially protruding from the polymer matrix. The GRMs that are not completely covered by the epoxy matrix are called exposed GRMs, including the free-standing and the partially protruding forms. To determine the exposed fraction of GRMs in the abraded particles, an indirect quantification approach using lead-labeling techniques combined with inductively coupled plasma – optical emission spectrometry (ICP-OES) was applied.39 Lead ions adsorbed on the GRMs can be desorbed from the exposed part of the GRMs, whose amount can be correlated with the desorbed lead ions detected. Therefore, this method can quantify the amount of the exposed GRMs, but it cannot differentiate between free-standing and protruding GRMs. It is important to emphasize that the Pb2+-labelled GRMs were only employed for quantification of the free-standing and protruding fraction of GRMs by ICP-OES. Other experiments were performed using the Pb2+-free specimen.
Lead-labeling of GRMs and determination of Pb2+ adsorption and release capacity
Three GRMs, GNP-1, GNP-2 and GO-1, were used as representatives for a wide range of different species of GRMs. Adapting the lead uptake and release approach of Schlagenhauf et al., 2015, master batches of lead-labeled GRMs were produced. The lead ion (Pb2+) was used as the labeling element for GRM detection. Pb2+-loaded GRMs were produced by immersion of 1.5 g of GRMs in 400 mL of Pb2+ solution. The Pb2+ solution was prepared by dissolving 200 mg of lead(II) acetate trihydrate in 1 L of Millipore water. The GRMs were dispersed in the solution by ultra-sonication for 30 min. After further stirring for 2.5 h, the Pb2+-loaded GRMs were collected by filtration and dried at 50 °C under vacuum for 14 h. The Pb2+ uptake capacity was analyzed by immersion of 100 mg Pb2+-loaded GRMs into 5 mL of 0.1 M HNO3 for 1 h. Then the GRMs were filtered out by centrifugal filtration (Amicon Ultra-4 30 kDa, Merck Millipore) at 3000 rpm for 10 min. The filtrate was collected for Pb2+ analysis by ICP-OES (Vistra-PRO, Varian Inc., Palo Alto, CA).Detection of Pb2+ by ICP-OES
100 mg of abraded epoxy/Pb2+-loaded GRM particles were immersed in 5 mL of 0.1 M HNO3 for 1 h. The GRMs were removed by centrifugal filtration and the Pb2+ concentration in the filtrate was analyzed by ICP-OES. Three independent measurements of each GRM sample were performed. In addition, two control samples were produced to detect the potential leaching of lead ions into the epoxy (control A) and to determine, after adding the hardener, how much lead ions might be released into the epoxy matrix and later exposed by the abrasion process (control B). For control A, 1 g of epoxy resin was mixed with 0.1 g of lead-coated GRMs and ultra-sonicated for 1 h. Then the GRMs were removed by filtration. The remaining epoxy was dissolved in acetone and 0.1 M HNO3, consecutively. The solution was analyzed for Pb2+ by ICP-OES. For control B, the highest possible amount of Pb2+ that could be absorbed and released by GRMs was added into epoxy. Then hardener was added and the mixture was cured at 80 °C for 12 h and post-cured at 120 °C for 4 h. After curing, the abrasion process was performed for control B. Control B was assumed as an extreme case when all of the loaded lead ions were released from GRMs into the epoxy matrix due to the addition of the hardener and tested how much such lead ions could be detected in the abraded particles after the abrasion process. The abraded particles were analyzed for Pb2+ by ICP-OES as described above.Cell culture and cell treatment
Human THP-1 monocytes were obtained from the European collection of cell cultures (Lot number13 C011, ECOCC, England). After thawing, the cells were grown in suspensions in T75 cell culture flasks, sub-cultured at least three times prior to experiments and grown in complete cell culture medium (RPMI-1640 medium, Sigma-Aldrich) supplemented with 10% fetal calf serum (FCS, Sigma-Aldrich), 1% L-glutamine (Sigma-Aldrich) and 1% penicillin–streptomycin–neomycin (PSN, Sigma-Aldrich). Cells were maintained at 37 °C and 5% CO2 in a humidified atmosphere and routinely sub-cultured twice a week at 70–80% confluency. For experiments, THP-1 monocytes were differentiated to macrophages with 200 nM phorbol 12-myristate 13-acetate (PMA; Sigma-Aldrich) for 72 h before particle exposure. THP-1 cells were seeded in well plates with densities of 4 × 10⁴ cells per well (96 wells per 0.35 cm2 growth area) in 200 μl medium (MTS, LDH and DCF assay), 2.5 × 10⁵ cells per well (24 wells per 1.9 cm2 growth area) in 500 μl medium (for ELISA) or 5 × 10⁵ cells per well (12 wells per 3.9 cm2 growth area) in 1000 μl complete cell culture medium (for GSH) and cultivated for 72 h in the presence of 200 nM PMA. After differentiation, PMA containing medium was removed and the cells were washed with pre-warmed phosphate buffered saline (PBS) twice before experiments. For all experiments, stock dispersions of the tested materials of 1 mg mL−1 in ultrapure water (GOs, rGO and abraded particles) or sterile filtered (0.22 μm pores) 160 ppm Pluronic F-127 (Sigma-Aldrich) in ultra-pure water (GNPs) were prepared by sonication for 10 min (ultrasonic bath, Sonorex Super RK 156 BH, Bandelin) prior to usage and used for maximum one month. Stock dispersions were diluted to the final experimental concentrations in complete cell culture medium, with a percentage of 10% dispersion in medium and suspensions were gently pipetted on top of the cells growing in well plates.Analysis of cell viability and cytotoxicity (MTS and LDH assay)
Cell viability was assessed after 24 and 48 h of exposure by measurement of the metabolic activity via the MTS (3-(4,5-dimethylthiazol-2-yl)-5-(3-cyrboxymethoxy-phenyl)-2-(4-sulfophenyl)-2H-tetrazolium, inner salt) assay obtained as CellTiter96 Aqueous One Solution (Promega). The assay was performed according to the manufacturer's protocol considering the intrinsic GRM absorbance. Differentiated THP-1 cells were exposed to 200 μL of GRMs or abraded particles diluted in complete cell culture medium at a concentration in the range of 0–40 μg mL−1 for 24 and 48 h. Cadmium sulphate (CdSO4, Sigma-Aldrich) was applied as the positive control at a concentration of 1000 μM. After exposure, the medium was replaced by 120 μL MTS working solution (20 μL MTS reagent plus 100 μL phenol-red free RPMI-1640). Background absorbance was measured at 490 nm directly after addition of the working solution to consider the intrinsic absorbance of the residual GRMs. The final absorbance was measured at 490 nm in a microplate reader (Mithras2 Plate reader, Berthold Technologies, Germany) after incubating the cells under standard cell culture conditions for 60 min. Absorbance values were corrected for intrinsic GRM absorbance by subtraction of the background values and normalized to untreated samples.In addition, cytotoxicity was assessed by the lactate-dehydrogenase assay (LDH, CytoTox96® Non-Radioactive Cytotoxicity Assay, Promega) according to the manufacturer's instruction. Differentiated THP-1 cells were exposed to GRMs and abraded particles as mentioned before. 0.2%Triton X-100 (Sigma-Aldrich) served as the positive control. After exposure, the cell culture medium was collected, centrifuged to remove GRMs and analyzed for LDH release. The assay reagent was added to each well containing the collected cell culture medium and the background absorbance was measured at 490 nm right after application to consider the intrinsic absorbance of the GRM in the medium. The 96-well plates were incubated at room temperature for 30 min and the final absorbance was measured at 490 nm in the Mithras2 microplate reader. The background absorbance was subtracted from the final values and normalized to untreated samples. Cell free interference assays were performed for the pristine GRMs and abraded particles from neat epoxy with the MTS assay at a concentration range of 0–40 μg mL−1 to exclude the potential interference reactions of GRMs with the assay reagents along with possible wrong interpretation (Fig. S12†).43
Detection of reactive oxygen species and oxidative stress (DCF and GSH assay)
The formation of reactive oxygen species (ROS) was detected using a 2′,7′-dichlorofluorescein assay (H2DCF-DA).44 The cell-permeant H2DCF-DA (2′,7′-dichlorodihydrofluorescein-diacetate; Molecular Probes, Invitrogen) enters the cells and intracellular esterases cleave off the diacetate part. The resulting H2DCF is ROS sensitive. Its transformation to the fluorescent form DCF serves as a measure of total ROS production. GRMs and abraded particles were diluted in Hank's balanced salt solution (HBSS). Differentiated THP-1 cells were loaded with 50 μM H2DCF-DA in HBSS per well and incubated in a humidified incubator under standard growth conditions for 60 min. After washing twice with pre-warmed HBSS, the cells were exposed to 100 μL of particle dilutions followed by incubation in a humidified incubator under standard growth conditions for 2 h. The positive control was 50 μM 3-morpholinosydnonimine (Sin-1, Sigma-Aldrich). Fluorescence was measured in the Mithras2 microplate reader with excitation at λ = 485 nm and emission at λ = 528 nm. Fluorescence values were blank-corrected and normalized to untreated controls. To address the possibility of false-positive and false-negative results, we performed cell free interference assays to evaluate the reactivity towards H2-DCF of the materials alone (Fig. S12†).44The intracellular total reduced glutathione (GSH) content of the exposed THP-1 cells was measured using the Glutathione Assay Kit (Cayman Chemical) for deprotonated cell lysates. For cell deproteination, the cells were collected by gently scrapping them from the well plate. The cells were then homogenised in 50 mM cold MES buffer (2-(N-morpholino)ethanesulphonic acid) and centrifuged (10![[thin space (1/6-em)]](https://www.rsc.org/images/entities/char_2009.gif) 000g for 15 min at 4 °C). The lysates were deproteinated by the addition of equal volumes of metaphosphoric acid (MPA) reagent to each sample. After 5 min incubation at RT, the samples were centrifuged (2000g for 5 min at 4 °C) and assessed for their GSH content according to the manufacturer's protocol. L-Buthionine-sulfoximine (BSO; 300 μM; Sigma-Aldrich) for 24 h was used as a positive control. GSH analysis was performed following GRM exposure as described above for 24 h and 48 h. Absorbance was measured at 405 nm in the Mithras2 microplate reader. Values are presented as fluorescence percentage relative to the negative control, which contained the cells without the treatment with the tested materials.
000g for 15 min at 4 °C). The lysates were deproteinated by the addition of equal volumes of metaphosphoric acid (MPA) reagent to each sample. After 5 min incubation at RT, the samples were centrifuged (2000g for 5 min at 4 °C) and assessed for their GSH content according to the manufacturer's protocol. L-Buthionine-sulfoximine (BSO; 300 μM; Sigma-Aldrich) for 24 h was used as a positive control. GSH analysis was performed following GRM exposure as described above for 24 h and 48 h. Absorbance was measured at 405 nm in the Mithras2 microplate reader. Values are presented as fluorescence percentage relative to the negative control, which contained the cells without the treatment with the tested materials.
(Pro)-inflammatory cytokine detection
The (pro)-inflammatory response of differentiated THP-1 macrophages after 24 h and 48 h of exposure to GRMs, and abraded particles was analyzed with enzyme-linked immunosorbent assays (ELISA) for the inflammatory markers interleukin 8 (IL-8), interleukin 6 (IL-6), interleukin 1-beta (IL-1β) and tumor necrosis factor alpha (TNF-α), where the exposure time ranged from 6 h and 24 h. Lipopolysaccharide (LPS, from Escherichia coli, 1 mg mL−1 in complete cell culture medium, Sigma Aldrich) served as the positive control to stimulate inflammatory response. The amount of inflammatory proteins released in the supernatant was quantified using the commercially available uncoated ELISA kits (Invitrogen) according to the manufacturer's protocol. Prior to analysis cell supernatants were centrifuged to remove GRMs. The measured values (Mithras2 Plate reader, Berthold Technologies, Germany) were blank corrected and are shown relative to the negative control. Interference assays for the pristine GRMs and abraded particles from neat epoxy were performed as described by Drasler and collegues,23 to exclude false-positive and false-negative results (data not shown).Cell morphology
Phase contrast (Axio Imager 10×/20×/40×, Carl Zeiss AG, Switzerland) and fluorescence microscopy (CLSM, LSM780, 60×/1,40 oil, Carl Zeiss AG, Switzerland) analysis of differentiated THP-1 macrophages were conducted after 24 h and 48 h of exposure to GRMs and abraded particles. For fluorescence microscopy, the cells were washed 3 times with PBS, fixed in 4% paraformaldehyde (PFA, in PBS, Sigma Aldrich) for 15 min and incubated in 0.1 M glycine in PBS for 15 min to remove the remaining PFA. Thereupon, the cells were permeabilized with 0.2% Triton X-100 (in PBS, Sigma Aldrich). F-actin was stained with Alexa-488 conjugated phalloidin (Life Technologies, Thermo Fisher Scientific, Switzerland), and nuclei were counterstained with DAPI (4′,6-diamidino-2-phenylindole Life Technologies, Thermo Fisher Scientific, Switzerland). DAPI (1:1000) and phalloidin (1:50) were diluted in 0.3% Triton X-100 and 1 g bovine serum albumin in PBS. Staining was performed for 1.5 h at room temperature. Cells were washed 3 times with PBS and mounted with mowiol (Sigma-Aldrich) and kept at 4 °C until microscopic analysis.
Statistical analysis
The results are expressed as mean ± standard error of mean (StEM) with at least three independent experiments (n ≥ 3). Comparison between groups was evaluated by Student's t-test and two-way analysis of variance (ANOVA) using the Graph Pad Prism (GraphPad Software Inc., La Jolla, CA, USA). A statistical significance was defined as p < 0.05 compared to the control group.Results
Characterization of the pristine GRMs and abraded particles from epoxy/GRM composites
The characterization results of the physicochemical properties of the pristine GRMs and abraded particles from epoxy/GRM composites are summarized in Fig. 1. The SEM micrographs of the pristine GRMs showed loose agglomerates of micrometer-sized platelet-like (GNP-1, GNP-2, GO-2) or sheet-like structures with some wrinkles (GO-1, rGO) (Fig. 1a–c and S3†). The abraded samples showed a broad range of differently sized particles with irregular morphologies and rather flat surfaces. The presence of GRMs in the abraded particles could not be detected by SEM imaging. The dispersion stability from the zeta potential measurement revealed that the pristine GRMs were fairly stable in water (absolute zeta potential >30 mV), whereas the abraded particles were more likely to agglomerate (Fig. 1e). | ||
| Fig. 1 Characterization of pristine GRMs and abraded particles from epoxy/GRM composites. SEM images of (a) pristine GO-2, (b) abraded particles from neat epoxy, and (c) abraded particles from an epoxy/GO-2 composite. (d) Summary of the physicochemical properties of pristine GRMs. (e) The zeta potential of the abraded particles. | ||
Raman spectra showed similar absorption peaks of GNP-1 and GNP-2 containing D, G, and 2D bands45 at around 1355 cm−1, 1581 cm−1 and 2700 cm−1, respectively (Fig. S4a†). For GO-1, GO-2 and rGO, strong D and G bands were observed while the 2D band appeared only weakly. The intensity of the G band relates to the vibration of sp2 hybridized carbon atoms, whereas that of the D band is associated with the vibration of sp3 hybridized carbon atoms, missing atoms or added atoms of species other than carbon in the carbon structures and the defects in the crystal.46,47 The intensity ratio I(D)/I(G) of GNP-1 and GNP-2 was clearly lower than that of GO-1, GO-2 and rGO, suggesting that GO-1, GO-2 and rGO accommodated more oxidized carbons with sp3 hybridization than GNPs did. This is in agreement with the XPS results showing a higher oxygen content of GOs and rGO than that of GNPs (Fig. 1d). Reproducible results were obtained with XPS from the two different measurement points, pointing towards the homogeneity of the investigated samples. Moreover, the fitting of functional groups to the obtained XPS spectra demonstrated that both GNPs were similar in terms of composition and bonding with only a low amount of oxygen-containing functional groups. These groups are significantly enhanced in the GO-1, GO-2 and rGO samples. Thereby, slight differences in the distribution of C–O, C![[double bond, length as m-dash]](https://www.rsc.org/images/entities/char_e001.gif) O and COO type bonds were found between the GO-1 and GO-2 samples.
O and COO type bonds were found between the GO-1 and GO-2 samples.
Regarding the FTIR results (see Fig. S4b†), all GRMs showed an absorption peak around 1400 cm−1, which is the vibration peak of the O–H deformation.48 The peaks between 1635 and 1683 cm−1, which were observed for all GRMs, can be assigned to either the stretching vibration of the CC backbone or to the resonance of the O–H stretching of the absorbed water molecules or hydroxyl groups between 3100–3600 cm−1.49 The bending of the C–OH bond was observed as a sharp peak at 1521 cm−1 for GO-1 and a small peak at 1540 cm−1 for GO-2,50 in agreement with the XPS results, where GO-1 contained more C–O than GO-2.
The XRD patterns of GNP-1 and GNP-2 displayed sharp diffraction at a 2-theta of 26.7° and 26.9°, which corresponded to the 002 crystal plane with a d-spacing of 3.31 Å and 3.33 Å, respectively (Fig. S4c†). The 001 crystal plane of GO-1 and GO-2 was observed at a 2-theta of 12.3° and 12.2° associated with the d-spacing of 7.2 Å for both GOs. The higher d-spacing in the case of GO indicates the presence of oxygen-containing functional groups (epoxy, hydroxyl, carboxyl) on graphene sheets constructing GO.49,51 The disappearance of the peak around 12° was observed for rGO, since the reduction of GO to rGO significantly removed the oxygen-containing functional groups from the graphene sheets. This is consistent with the FTIR results showing the disappearance of O–H vibration peaks from rGO.
EDX mapping was employed to analyze the elemental compositions of the abraded particles, specifically to identify whether the abrasive materials could be released from the sanding paper. Since Al2O3 was the main component of the abrasive material, we used aluminum as an identification element. The representative SEM/EDX image of the abraded particles from neat epoxy showed only small amounts of aluminum (Fig. S5†). This indicates that the release of abrasive materials was negligible and is not expected to affect the particle size distribution nor toxic effects.42
Particle size distributions of the abraded particles
The particle size distributions of the abraded particles from neat epoxy and epoxy/GRM composites were analyzed and the results are shown in Fig. 2. Particle size distributions fitted with lognormal distribution are presented in Table S3,† which includes the particle mode, electrical mobility (de), aerodynamic diameter (da), the count median diameter CMD (μm), the geometric standard deviation σg, and the area fraction F. During abrasion, the total concentrations measured by SMPS ranged from 0.5 × 10⁴ to 1 × 10⁵ particles per cm3 with background concentrations between 1000 and 1500 particles per cm3 (CMD ∼100 nm) and those analyzed by APS ranged from 4000 to 6000 particles per cm3 with background concentrations between 6 and 15 particles per cm3 (CMD ∼0.7 μm).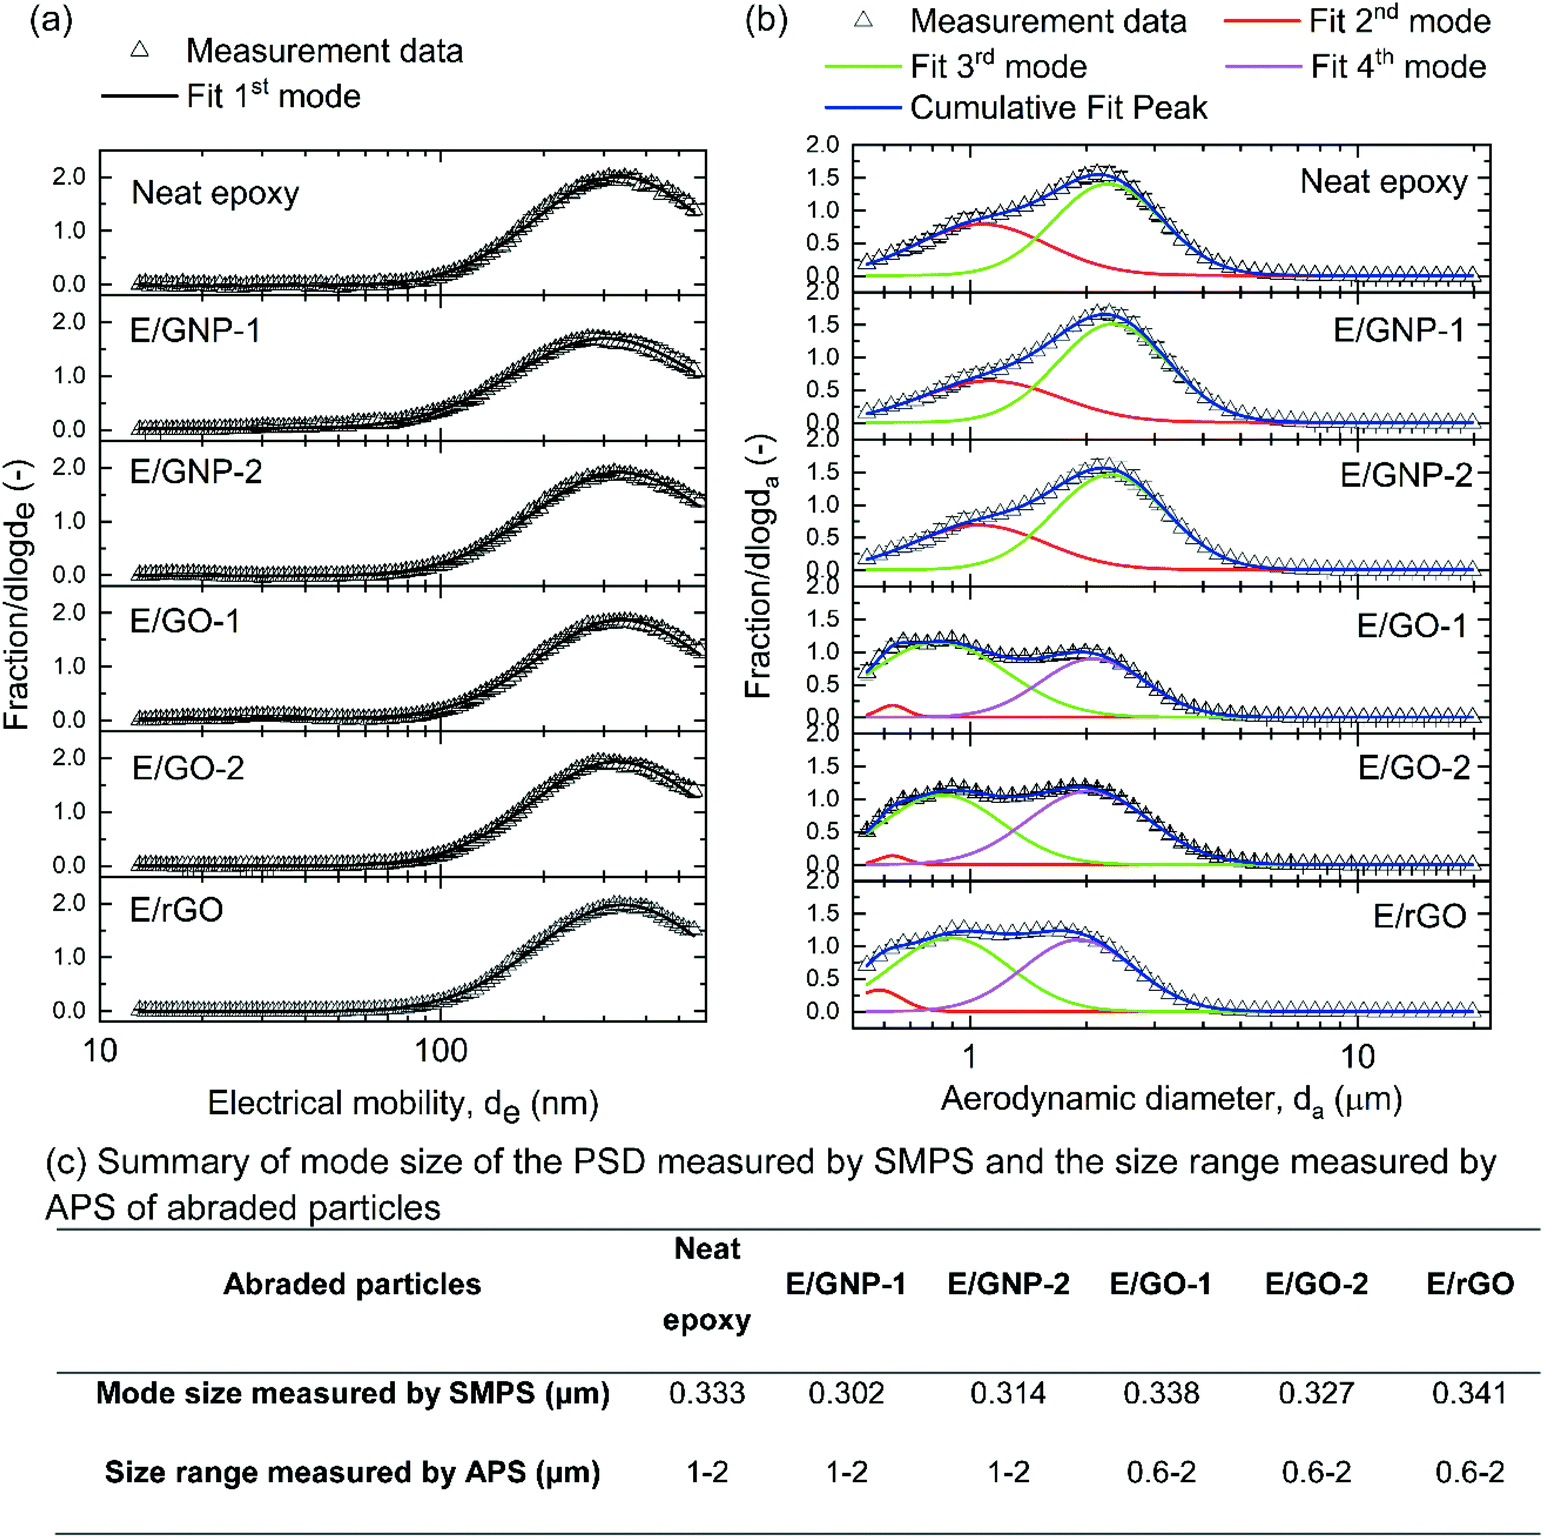 | ||
| Fig. 2 Particle size distributions (PSD) of the abraded particles from neat epoxy or epoxy/GRM (E/GRM) composites. (a) Particle size distributions in the sub-micrometer range (13–573 nm) measured by SMPS. (b) Particle size distributions in the micrometer range (0.54–19.81 μm) measured by APS. The measurement data were the average of at least three experiments. (c) Summary of the mode size of the PSD measured by SMPS and the size range measured by APS of the abraded particles. | ||
The abraded particles from neat epoxy and epoxy/GNP composites showed three modes, while those from epoxy/GO and epoxy/rGO composites showed four modes. The first mode was below 500 nm and analyzed by SMPS (Fig. 2a), while the other modes were in the micrometer range and measured by APS (Fig. 2b).
The first modes of all abraded particles were between 300 nm and 400 nm, and no clear difference in the particle size distributions among all abraded particles was observed. For the other modes, there was no significant difference between the particle size distributions of neat epoxy and those of epoxy/GNP, whereas a notable divergence in the particle size distributions between neat epoxy and epoxy/GO, epoxy/rGO was apparent. For neat epoxy and epoxy/GNP, two modes were detected. Mode 3 that ranged from 2 to 2.5 μm was more dominant than mode 2 at 1 μm. The particle size distributions of epoxy/GO and epoxy/rGO from APS contained 3 modes. Mode 2 at 0.6 μm was the least significant mode. For epoxy/GO, the third mode at 0.8 μm was more prevalent than the fourth mode at 2 μm. For epoxy/rGO, the difference between the fractions of mode 3 at 0.9 μm and mode 4 at 2 μm was not as large as that of epoxy/GO. Considering cumulative fractions, larger amounts of sub-micrometer particles were released from epoxy/GO and epoxy/rGO as compared to neat epoxy and epoxy/GNP composites.
Detection and quantification of free-standing and protruding GRMs
Raman spectroscopy mapping was employed to differentiate GRMs from epoxy in the abraded particles. The abraded particles from the epoxy/GNP-2 composite were used as a representative for Raman spectroscopy mapping. To quantify the fraction of the exposed GRMs from the abraded particles, epoxy/GRM composites were produced using GRMs (GNP-1, GNP-2 and GO-1) that had been pre-labeled with lead ions. Abraded particles were subsequently subjected to acid treatment and ICP-OES analysis to quantify the amount of Pb2+ released from protruding and free-standing GRMs.39Detection of free-standing and protruding GRMs from the abraded particles by Raman spectroscopy mapping
Owing to the distinctive Raman spectra of GNP, Raman mapping was performed in order to differentiate GNPs from epoxy in the abraded particles obtained from the epoxy/GNP-2 composites. The presence of free-standing and protruding GRMs was confirmed by the Raman mapping of a representative area as shown in Fig. 3(a) and (b), which qualitatively demonstrated the release of GNP-2 from the abrasion process of the composites. The Raman spectrum of the reference abraded epoxy particles exhibited the vibration of the epoxy backbone at 1114, 1185, and 1460 cm−1, the vibration of aromatic CC at 1610 cm−1 and the stretching vibration of the aliphatic C–H bond at 2800–3000 cm−1. The reference spectrum of GNP-2 shows the typical D band at around 1355 cm−1, the G band at 1581 cm−1 and the 2D band at 2700 cm−1. Fig. 3a shows a map of the intensity ratio of the 2D band (center 2700 cm−1, width 200 cm−1) to an epoxy related band (center 3065 cm−1, width 60 cm−1). The non-selected area indicated in gray was mainly the bare substrate not covered by the abraded particles. The color scale indicated the darker color as higher epoxy content and the brighter color as higher GNP content. The fate of GNPs in the epoxy composites after the abrasion process could possibly be explained by the representative Raman spectra in Fig. 3b. GNPs might be released from the composite without notable transformation represented by spectrum A, which was almost identical to the GNP reference spectrum. GNPs might be transformed and released from the composite during the fabrication or abrasion process resulting in a defected structure as evidenced by spectra B and C showing different I(D)/I(G) ratios from the reference GNP-2. GNPs might be still embedded in a thin layer of epoxy (spectra C and D) since the spectra show both the epoxy signature and GNP peaks. The representative spectra from the flat surface and cross-sectional surface of the composite (Fig. S6†) always showed the epoxy feature because GNPs were covered by epoxy, which could represent the GNP in the embedded form. Therefore, we can assume that spectra A and B in Fig. 3b were more likely to represent free-standing and/or protruding GNPs because the epoxy feature did not appear. With Raman spectroscopy mapping, the presence of free-standing and/or protruding GNPs (exposed GNPs) can be verified.
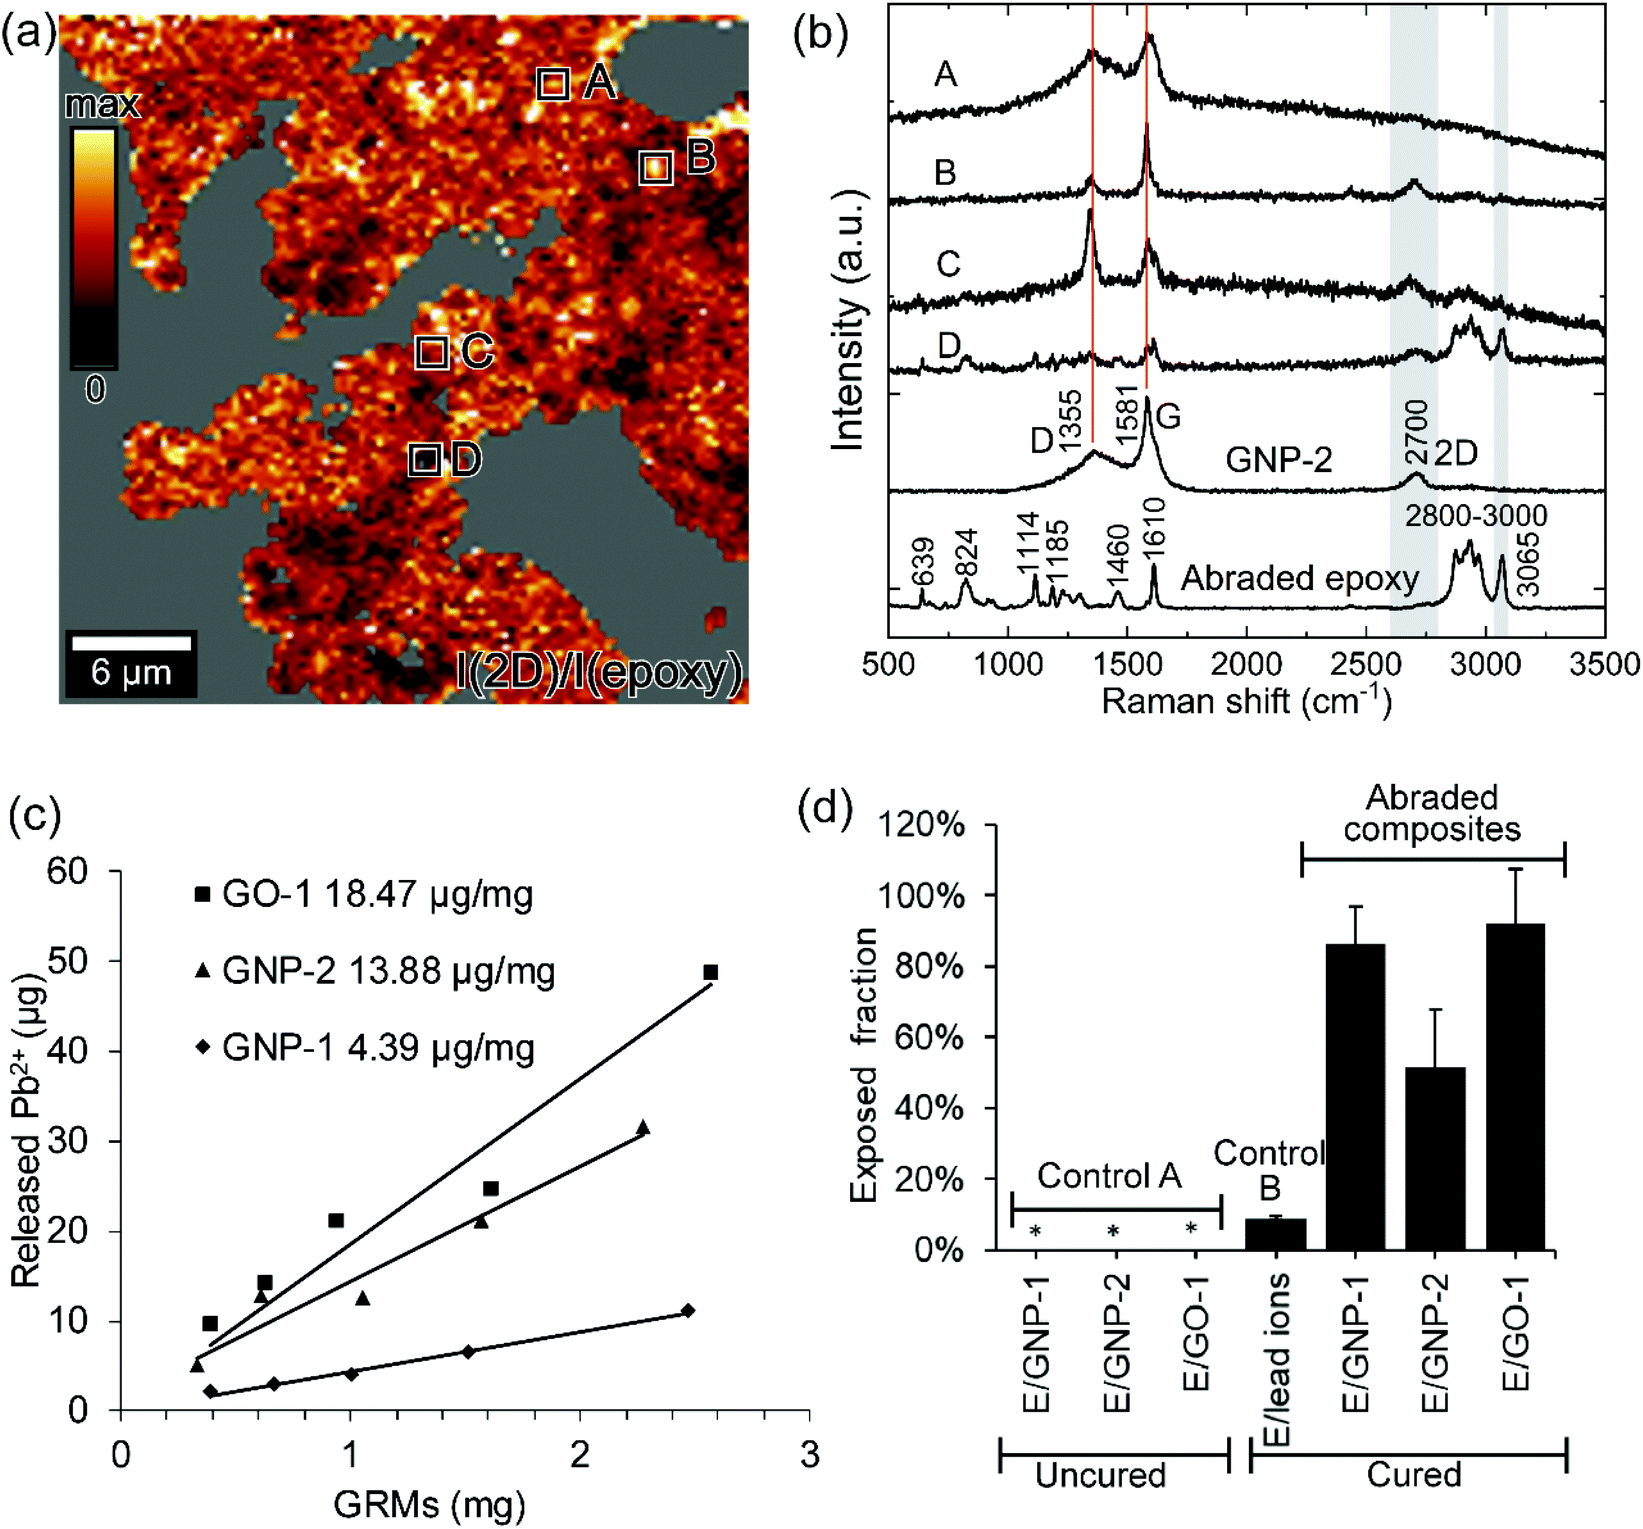 | ||
| Fig. 3 Qualitative and quantitative detection of GRMs released from abrasion. Raman spectroscopy mapping of the abraded particles from E/GNP-2 showing (a) map of the ratio of the intensity of the 2D band (center at 2700 cm−1) as a marker of GNP-2 to the intensity of an epoxy related Raman band (center at 3065 cm−1). The compared Raman bands are indicated in (b) by gray areas. (b) Representative Raman spectra from different regions in the mapping area as compared to the reference GNP-2 and abraded neat epoxy. Red lines are a guide to the eye indicating the GNP-2 related Raman bands. (c) Pb2+ release capacity of GNP-1, GNP-2, and GO-1 from one representative example of each material. (d) Bar chart of the release fraction of Pb2+ from the control samples and the exposed fraction of GRMs from three epoxy/GRM composites. Three measurements were performed for each sample. The average mean values are reported with the standard deviations. The concentration of Pb2+ in control A (uncured samples) was below the detection limit of 0.1 mg L−1, which is marked by *. | ||
Quantification of free-standing and protruding GRMs by the Pb2+ labelling method
Fig. 3(d) shows the amounts of free-standing and protruding GRMs (the exposed fraction of GRMs) calculated as the ratio of the free-standing or protruding GRMs divided by the total amount of GRMs embedded in the composite. The fraction of 51% to 92% of the added GRMs in the composites was present as free-standing and protruding GRMs. Highly exposed fractions were measured for GNP-1 and GO-1 as 86.2 ± 10.8% and 92.0 ± 15.5%, respectively. The fraction of the exposed GNP-2 was 51.7 ± 16.3%, lower than the other two GRMs.
 | ||
| Fig. 4 Oxidative stress measured by DCF and GSH assays. ROS accumulation was assessed after 2 h of exposure to (a) pristine GRMs or (b) abraded particles. 50 μM Sin-1, a morpholino compound, was used as a positive control. Antioxidant glutathione levels of THP-1 cells were measured after 24 h and 48 h of exposure to (c) GRMs and (d) abraded particles. 300 μM BSO was used as the positive control. The results show the mean ± StEM from at least three independent experiments. The * symbol represents p < 0.05 as compared to the negative control (untreated cells). | ||
 | ||
| Fig. 5 Pro-inflammatory response of THP-1 macrophages after treatment with the GRMs and abraded particles from neat epoxy and epoxy/GRM composites. Concentrations of IL-1β, IL-6 and IL-8 were measured after 24 h and 48 h of exposure while TNF-α release was measured after 6 h and 24 h of exposure. 1 μg mL−1 LPS was used as the positive control. The results are shown as mean ± StEM from at least three independent experiments. The * symbol represents p < 0.05 as compared to the negative control (untreated cells). | ||
 | ||
| Fig. 6 Cell viability measured by the MTS assay. MTS was performed to evaluate the cell viability of THP-1 macrophages after treatment for 24 h and 48 h with (a) pristine GRMs or (b) abraded particles. 1000 μM CdSO4 was used as a positive control. The results show mean ± StEM from at least three-independent experiments. The * symbol represents p < 0.05 as compared to negative controls (untreated cells). | ||
No major alterations of the cell morphology, i.e. the cell nuclei and F-actin cytoskeleton, were observed 48 h post-exposure to the pristine GRMs or abraded particles (Fig. S13†). Some pristine GRMs quenched the fluorescence signal at 488 nm, in particular for GO-1 and GO-2. The deposition of particles on the cells was confirmed from the phase contrast images (Fig. S13†).
Discussion
In this study, we focused on the human health risks of GRMs concerning both occupational exposure to pristine GRMs during the manufacturing process and consumer exposure to the GRM-containing products. Therefore, we investigated the particles released from GRM-reinforced epoxy composites by an abrasion process. Moreover, the cytotoxicity of the pristine GRMs and the abraded particles was assessed.Particle size distributions
Addition of 1 wt% GO and 1 wt% rGO, enough to improve the material properties of epoxy, induced considerable changes in the particle size distributions of the abraded particles in the micrometer size range as compared to particles released from neat epoxy or epoxy/GNP composites. These changes included the presence of an additional mode at 0.6 μm and an increase in the fraction of the particles with the aerodynamic diameter around 1 μm. This might be related to the improvement in dispersion of GO in the epoxy matrix as compared to the dispersion of GNPs in the epoxy matrix because of an increase in interfacial adhesion between GO and epoxy due to the presence of carboxylic groups on the GO surface. A better dispersion could result in an enhancement of mechanical properties, i.e. tensile strength and toughness of the composites.55 As reported by Chandrasekaran et al., the epoxy/thermally reduced GO composite demonstrated higher fracture toughness than the epoxy composite filled with GNPs.56 The increase of toughness could make the composites more difficult to crack,57 leading to delamination of smaller particles. Since the addition of GO and rGO provoked the release of smaller particles as compared to the addition of GNPs, this indicated that the released particles can be tuned or controlled via the properties of GRMs. Nevertheless, this will need further investigations and is not the aim of this study.The PSDs of the abraded particles from all of the investigated epoxy/GRM composites were in the same range (between 70 nm and 3 μm) as the previously reported PSDs for the epoxy system.42 In particular, the value of the first mode of abraded particles from neat epoxy (0.333 ± 0.0073 μm) was comparable to the value reported for neat epoxy by Schlagenhauf and co-workers (0.326 ± 0.040 μm).42 However, in contrast to our study where we did not observe a noticeable shift of the first mode by adding 1 wt% GRMs, they found that addition of 0.1 wt% and 1 wt% of CNTs shifted the first mode of the abraded particles from 326 nm to 392 nm and 415 nm, respectively. CNTs were found to form interconnected structures in the epoxy composites,58 while GRMs could not form such interlinked structures due to their innate 2D morphology. Consequently, the size of the abraded particles from the composites containing an interconnected particle network might be increased because such structures could reinforce the epoxy matrix. Total concentrations of the abraded particles measured by SMPS in our study were around 5-fold higher than those reported by Schlagenhauf et al., while the total concentrations measured by APS from both studies were comparable. This suggested that the experimental conditions used in this study could generate a higher fraction of smaller particles as compared to those used by Schlagenhauf et al.42 The divergence in the PSDs of the abraded particles might be due to the use of different abrasive materials (alumina and silica- versus alumina-containing abrasive materials) or different abrasion conditions (applied load of 0.5 kg versus 1 kg).
Detection and quantification of free-standing and protruding GRMs
We measured the fraction of the GRMs that was presented as a free-standing and protruding form relative to the amount of added GRMs. The results showed a substantially high fraction of protruding and free-standing GRMs in the abraded particles, which was 86.2 ± 10.8%, 51.7 ± 16.3% and 92.0 ± 15.5% for GNP-1, GNP-2 and GO-2, respectively. The highly exposed fraction of GRMs from the abraded particles of the epoxy/GRM composite could be explained by the failure mechanism of the composite, which led to release of GRMs embedded in the epoxy matrix. The failure mechanism of GRM-reinforced epoxy nanocomposites was investigated in previous studies.64–66 Interfacial debonding between the GRM and epoxy molecule or adhesive failure could occur due to the weak interaction between the GRM and epoxy resin. The cohesive failure inside graphene sheets such as the breakage of the graphene layer could simultaneously occur as evidenced in the previous study.64
The failure mechanism of epoxy/GNP composites could be identified from the SEM images of the fractured surface of the composite.64Fig. 7 shows the SEM images of the freeze-fractured surface of neat epoxy resin and the epoxy/GNP-2 composite. The fracture morphology of neat epoxy (Fig. 7a) shows a smooth and mirror-like surface with parallel ridges along the direction of crack propagation. In the presence of GNP-2, the fracture surface (Fig. 7b and c) is rougher in comparison to neat epoxy resin and shows bulges and a fracture structure. This was due to the fact that the mechanical reinforcement effect of GNP-2 could hinder and alter the path of crack propagation.64 When the crack approached the GNP layer, it could propagate along the interface between the GNP and epoxy resin matrix. Since GNPs in our study were not functionalized, they bound to epoxy resin by van der Waals force and not by the covalent bond. Therefore, interfacial debonding could occur between the epoxy matrix and GNP, which could be described by pulled-out GNPs marked by solid arrows in Fig. 7c. Since the pulled-out GNPs were partially or entirely detached from the epoxy matrix, they could be identified from the brighter areas implying that the pulled-out GNPs tilted upward from the surface. In the abraded particles, the pulled-out GNPs from epoxy matrix could be observed in the TEM images in Fig. 8.
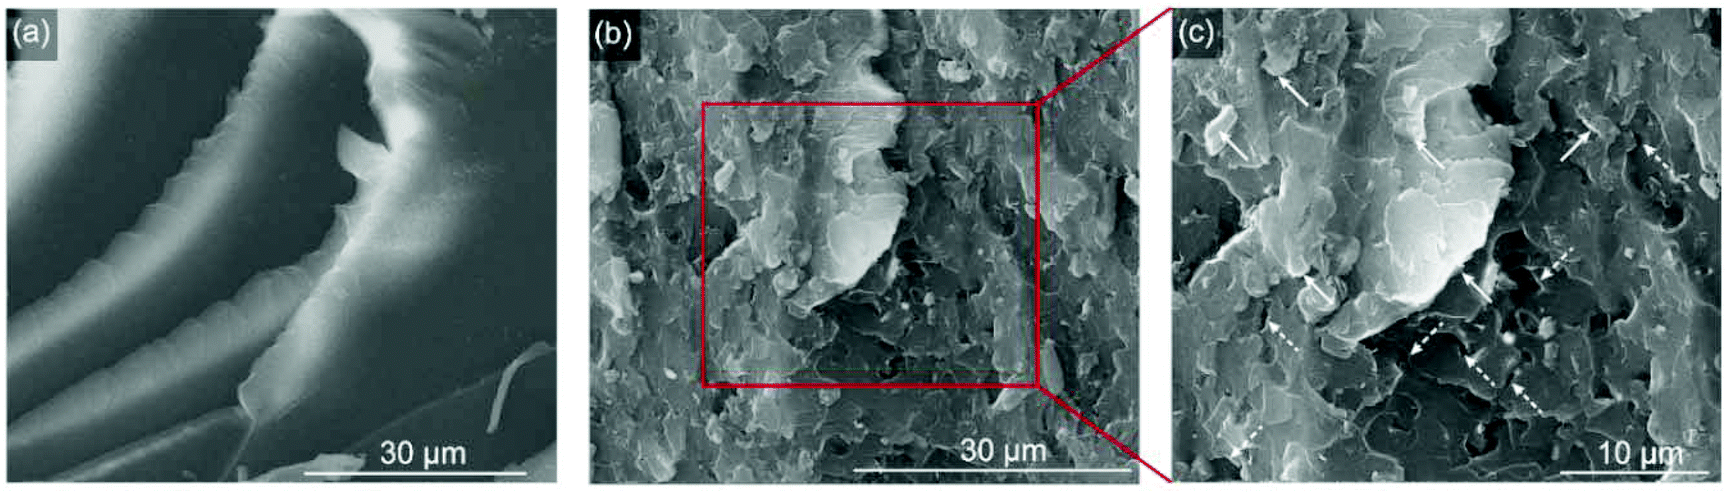 | ||
| Fig. 7 SEM images of the crack surface of the freeze-fractured samples of (a) neat epoxy resin and (b), (c) epoxy/GNP-2 composite. Solid arrows in (c) indicate pulled-out GNPs. Some parts of the pulled-out GNPs, seen as brighter areas when tilted upward from the fractured surface, detached from the epoxy matrix. Dashed arrows in (c) indicate broken GNPs. Broken GNPs were still attached to the epoxy matrix and could be identified from cleavages and voids on the fractured surface. | ||
 | ||
| Fig. 8 (a) TEM image of the abraded particles from the epoxy/GNP-2 composite showing the protruding GNP-2 (pulled-out GNP-2) from epoxy resin marked with a dashed line and (b) layered structure of GNP-2 at higher magnification. | ||
GRM agglomerates could also act as a stress concentrator leading to cohesive failure inside the graphene layer since the increasing number of graphene layers could reduce the efficiency of stress transfer between graphene layers.67 In Fig. 7c, ruptured GNPs, which could be identified from cleavages and voids on the fractured surface, were indicated by dashed arrows. Therefore, interfacial debonding between the GRM and epoxy matrix as well as the cohesive failure inside graphene sheets can explain the high freely accessible fraction of the GRM in the abraded particles.
The highly released fraction of GRMs is in strong contrast to that reported in a previous study39 on the release of CNTs from epoxy composites, which found only a minor amount of exposed CNTs from the abraded particles of 0.4%. This might be explained by the fact that GRMs and CNTs are extremely different in terms of morphology and size. GRMs are a two-dimensional material and their agglomerates are still a platelet structure, while a CNT is one-dimensional material, but CNT agglomerates can be formed by CNTs entwining together. CNTs reported by Schlagenhauf et al.39,42 had an outer diameter of about 13 nm and a length of 1–10 μm. In the epoxy matrix, some CNTs can be coiled into a compact structure in the range of 200–300 nm, while some CNTs can be chopped during a three-roll milling process resulting in an average tube length of 0.7 ± 0.2 μm.68 GRMs have a lateral size in the range of tens to hundreds of μm. The sizes (projected area equivalent diameter) of the pristine GNP-2 from the SEM images (Fig. S7†) ranged from 10 μm to 150 μm. The optical microscopic images (Fig. S8a–c†) showed that after high speed mixing, particles smaller than 10 μm were observed and particles larger than 100 μm were still detected. This implied that agglomerates of GNP-2 could be disintegrated by shear force caused by a high speed mixer. After three-roll milling, the sizes of GNP-2 particles were substantially reduced (Fig. S8d–f†) and all particles observed were smaller than 16.5 μm. Similar results after three-roll milling from the optical microscopic images were also observed for GNP-1 (Fig. S9†) and GO-1 (Fig. S10†) as their particle sizes were smaller than 8.5 μm and 11.5 μm, respectively. Detailed analysis of GRMs’ sizes during processing is described in the ESI.† The sizes of the abraded particles ranged from a few hundred nanometers to several micrometers, which could be bigger than the size range of CNTs, but smaller than that of the pristine GRMs. In other words, GRMs were less likely to be entirely covered in the epoxy matrix in comparison to CNTs, which was in agreement with the TEM results in Fig. 8.
GNP-2 had the least amounts of exposed fraction and the largest lateral dimension. GNP-1 and GO had smaller lateral dimension and higher exposed fraction. If we consider a single particle of GRMs, a smaller particle has a less accessible surface and thus a weaker interaction between the surface of GRMs and epoxy molecules. Therefore, smaller GRMs could be more easily pulled out from the composites when the abrasive force is applied on the composite's surface. However, further studies are needed to confirm this hypothesis. Nonetheless, this lead-labelling approach provides the necessary quantitative values that are of extreme importance to properly assess the cytotoxicity of the released particles.
All GRMs induced ROS after 2 h of cell exposure, but we only found a slight decrease in GSH, which indicates some oxidative stress. For GNP-2 the strong drop in the GSH level does not necessarily occur due to the induction of oxidative stress by the particles but could be partly a secondary response following the induction of cell death. The slight increase of GSH levels from 24 h to 48 h exposure might indicate that the cells partially adapted with the oxidative stress response by activation of antioxidative responses and enzyme scavenging systems. According to the oxidative stress paradigm, prolonged oxidative stress to cells may result in the activation of inflammatory responses.44 Studies with different types of immune cells (Jurkat, THP-1, PBMC and RAW 264.7)21,71,74 showed an induction of cytokine release as a consequence of GRM exposure. Additionally, Schinwald and colleagues confirmed that cytokine release was stimulated by phagocytosis of GRM.21 However, we did not detect a significant pro-inflammatory response although we observed that the cells were in close contact with particles. Only GNP-2 slightly induced the expression of the different pro-inflammatory cytokines at the two highest concentrations (20 and 40 μg mL−1). As the ultimate and most deleterious outcome of the oxidative stress paradigm, we analyzed if GRM exposure did reduce the cell viability and result in cell death. GNP-2 induced a time- and concentration-dependent decrease in the mitochondrial activity of differentiated THP-1 macrophages as measured by the MTS assay, while membrane rupture as an indicator of cell death followed a dose-but not time-dependent response. This could suggest a more sustained impact of GNP-2 on the mitochondrial enzyme activity that did however not lead to cell death. The decrease in cytotoxicity from the 24 h to 48 h time point may be explained by a partial adaptation of the cells to GNP-2 induced oxidative damage. For the other pristine GRMs, we did not observe any significant acute adverse effects on cell viability or cytotoxicity up to 48 h of exposure. Nevertheless, further studies should address if prolonged exposure to relatively biopersistent GRMs22 may induce a more pronounced oxidative stress response with oxidative damage to proteins and DNA in the cells and long-term adverse effects. Furthermore, addition of radical scavengers such as N-acetylcystein could help to further corroborate the role of ROS in GNP-2 induced cell death since some of the observed effects may also be secondary due to cell death.
It is well known that there is a strong correlation between the biological activity of nanoparticles and their physicochemical properties.54 This is also the case for many carbon-based materials, where a complex interaction of several characteristics is defining their toxicity.76 By choosing five GRMs, we intended to cover a large part of GRM characteristics and to relate their properties to their biological activity. In general the biological activity of particles increases as the particle size decreases.54 Similar results have been reported for GO, showing a more significant impact on the immune cells of smaller GO flakes in comparison to bigger GO flakes.74 Additionally, it was shown that GRMs with a smaller lateral size and increased functional group densities showed a larger impact on epithelial cells.27 For GNPs, we found a positive correlation between the lateral size of the particles and their toxicity while no such effect was apparent for the different GO materials, probably due to the relatively small difference in their lateral dimensions. Another study from Mendes and co-workers22 further showed the size affected uptake of GO by macrophages with a preferential internalization of larger GO flakes and clusters. However, we could not verify the preferential uptake of larger particles since it is technically challenging to quantify the internalization of label-free GRMs.
Studies focusing on composites found that the abraded particles from polymer/CNT composites did not cause acute toxic effects,39,77,78 which is comparable to our findings. Wohlleben and colleagues, who investigated the in vitro toxicity of the abraded particles from polyurethane/3% CNT composites on lung tissue, also found no significant increase in toxicity from the addition of CNTs to the polymer matrix.77 Similarly, the abraded particles from epoxy/1% CNT composites did not show any acute cytotoxic effects, i.e. an increase in ROS formation, DNA damage, an increase in TNF-α and IL-8, and a decrease in mitochondrial activity, on A549 human alveolar epithelial cells or THP-1 differentiated macrophages.39 They reported only a very low release of free-standing or protruding CNTs (0.4%) and that CNTs were mostly embedded in the polymer matrix, which could explain the absence of cytotoxic effects. However, in our study, we found substantially high fractions of exposed (free standing or protruding) GRMs in the abraded particles (86%, 92% and 51% for GNP-1, GO-1 and GNP-2, respectively). While 20 μg mL−1 GNP-2 were cytotoxic to THP-1 macrophages, even 40 μg mL−1 of abraded particles from epoxy/GNP-2 composites did not affect any of the investigated endpoints.
Previous studies showed that the neat epoxy or other polymer matrix materials did not induce (pro-)inflammatory responses.38,79,80 Similarly, this study also confirmed that the abraded particles from neat epoxy do not elicit any inflammatory responses. Therefore, the potential inflammation could only be expected due to the protruding or released GRMs or due to the formation of new materials from the mixing of GRM with epoxy and from the fabrication process of the composite. In the former case, where the toxicity was caused by the released GRMs and assuming no transformation of the GRMs from the processing, we did not expect significant pro-inflammatory responses since we did not find any pro-inflammatory response for pristine GRMs with the exception of a low response from a high concentration of GNP-2 exposure, which was confirmed in our experiments. Moreover, only 1 wt% GRM is added to the epoxy composite and thus, even with a release of 100% of GRMs, the cells would be mostly exposed to epoxy materials. For example, 20 μg ml−1 exposure to abraded particles would correspond to 0.15 μg ml−1 exposure to pristine GRMs. In the latter case, where the transformation of the materials could occur during the processing, we showed that the abraded particles did not induce cytokine expression. This indicated that the transformation of the materials did not result in the formation of new particles with immunotoxic properties.
Conclusions
The release of the particles from the GRM-reinforced epoxy composites is dependent on the GRM type as evidenced by our findings showing that the addition of GO and rGO induced the release of a new mode at around 0.6 μm of the abraded materials as compared to innate epoxy or epoxy/GNP composites. This reveals the potential to tune the release of the particles. In order to evaluate potential health risks of particles released from GRM-reinforced epoxy composites and pristine GRMs, we assessed the acute toxicity of physicochemically distinct GRMs and epoxy/GRM composites on human macrophages. A significant fraction of the embedded GRMs (51–92%) was released in the free-standing and protruding form in the abraded particles. Pristine GRMs induced some oxidative stress responses and in the case of GNP-2 even cell death. However, the abraded particles from epoxy/GRM composites did not reveal any adverse cell responses in human THP-1 macrophages, which was probably due to the low percentage of GRMs used in the composites and limited intrinsic in vitro toxicity of the GRMs. Therefore, GRMs with appropriate size and chemical properties in the appropriate concentration range may be good options as nanofillers with limited human health impact.Author contributions
W.N. fabricated epoxy composites, performed abrasion tests, and characterized the physicochemical properties of GRMs and abraded particles. D.K. performed in vitro toxicity assessments and evaluated the interference of pristine GRMs as well as analyzed the toxicity data. W.N. and S.C. performed the in vitro toxicity assessment of the abraded particles. T.H. analyzed the exposed GRMs using the lead-labeling method with ICP-OES. P.R. performed XPS analysis. O.B. performed Raman spectroscopy mapping of the abraded particles under supervision of M.C. T.B.T. supervised and helped with the in vitro toxicity assessment. B.R.-R. supervised the in vitro toxicity part. P.W. and J.W. initiated the project and conceived the study. W.N. and D.K. wrote the manuscript. All of the authors have discussed the results and have given approval to the final version of the manuscript.Conflicts of interest
There are no conflicts of interest to declare.Acknowledgements
We thank Dr Emmanuel Flahaut from Université Paul Sabatier, CNRS, Toulouse, France for kindly providing GO-2 and rGO for this study. The research leading to these results has received funding from EU Horizon 2020 Framework Graphene Flagship project GrapheneCore1 (Grant Agreement No. 696656), the NanoScreen materials challenge co-sponsored by the Competence Centre for Materials Science and Technology (CCMX) as well as the Swiss National Science Foundation (grant number 310030_169207).References
- A. S. Mayorov, R. V. Gorbachev and S. V. Morozov, et al., Micrometer-Scale Ballistic Transport in Encapsulated Graphene at Room Temperature, Nano Lett., 2011, 11, 2396–2399 CrossRef CAS PubMed.
- C. Lee, X. Wei and J. W. Kysar, et al., Measurement of the Elastic Properties and Intrinsic Strength of Monolayer Graphene, Science, 2008, 321, 385–388 CrossRef CAS PubMed.
- A. A. Balandin, S. Ghosh and W. Bao, et al., Superior Thermal Conductivity of Single-Layer Graphene, Nano Lett., 2008, 8, 902–907 CrossRef CAS PubMed.
- P. Wick, A. E. Louw-Gaume and M. Kucki, et al., Classification framework for graphene-based materials, Angew. Chem., Int. Ed., 2014, 53, 7714–7718 CrossRef CAS PubMed.
- R. J. J. Williams and N. Giacalone, Epoxy Polymers, Wiley, Weinheim, Germany, 2010, DOI:10.1002/9783527628704, Epub ahead of print January 13.
- A. C. Garg and Y.-W. Mai, Failure mechanisms in toughened epoxy resins—A review, Compos. Sci. Technol., 1988, 31, 179–223 CrossRef CAS.
- A. S. Wajid, H. S. T. Ahmed and S. Das, et al., High-performance pristine graphene/epoxy composites with enhanced mechanical and electrical properties, Macromol. Mater. Eng., 2013, 298, 339–347 CrossRef CAS.
- Y. Wang, J. Yu and W. Dai, et al., Enhanced thermal and electrical properties of epoxy composites reinforced with graphene nanoplatelets, Polym. Compos., 2015, 36, 556–565 CrossRef CAS.
- S. Chatterjee, J. W. Wang and W. S. Kuo, et al., Mechanical reinforcement and thermal conductivity in expanded graphene nanoplatelets reinforced epoxy composites, Chem. Phys. Lett., 2012, 531, 6–10 CrossRef CAS.
- S. Chandrasekaran, C. Seidel and K. Schulte, Preparation and characterization of graphite nano-platelet (GNP)/epoxy nano-composite: Mechanical, electrical and thermal properties, Eur. Polym. J., 2013, 49, 3878–3888 CrossRef CAS.
- P. Bari, S. Khan and J. Njuguna, et al., Elaboration of properties of graphene oxide reinforced epoxy nanocomposites, Int. J. Plast. Technol., 2017, 21, 194–208 CrossRef CAS.
- R. Ciardiello, L. T. Drzal and G. Belingardi, Effects of carbon black and graphene nano-platelet fillers on the mechanical properties of syntactic foam, Compos. Struct., 2017, 178, 9–19 CrossRef.
- Y. Ni, L. Chen and K. Teng, et al., Superior Mechanical Properties of Epoxy Composites Reinforced by 3D Interconnected Graphene Skeleton, ACS Appl. Mater. Interfaces, 2015, 7, 11583–11591 CrossRef CAS PubMed.
- S. Yang, J. Wang and S. Huo, et al., Synergistic flame-retardant effect of expandable graphite and phosphorus-containing compounds for epoxy resin: Strong bonding of different carbon residues, Polym. Degrad. Stab., 2016, 128, 89–98 CrossRef CAS.
- S. Liu, Z. Fang and H. Yan, et al., Superior flame retardancy of epoxy resin by the combined addition of graphene nanosheets and DOPO, RSC Adv., 2016, 6, 5288–5295 RSC.
- Y. Shi, B. Yu and Y. Zheng, et al., Design of reduced graphene oxide decorated with DOPO-phosphanomidate for enhanced fire safety of epoxy resin, J. Colloid Interface Sci., 2018, 521, 160–171 CrossRef CAS PubMed.
- S. Liu, H. Yan and Z. Fang, et al., Effect of graphene nanosheets on morphology, thermal stability and flame retardancy of epoxy resin, Compos. Sci. Technol., 2014, 90, 40–47 CrossRef CAS.
- B. Sang, Z. Li and X. Li, et al., Graphene-based flame retardants: a review, J. Mater. Sci., 2016, 51, 8271–8295 CrossRef CAS.
- Y. Liu, Y. Luo and J. Wu, et al., Graphene oxide can induce in vitro and in vivo mutagenesis, Sci. Rep., 2013, 3, 3469 CrossRef PubMed.
- O. Akhavan, E. Ghaderi and A. Akhavan, Size-dependent genotoxicity of graphene nanoplatelets in human stem cells, Biomaterials, 2012, 33, 8017–8025 CrossRef CAS PubMed.
- A. Schinwald, F. A. Murphy and A. Jones, et al., Graphene-based nanoplatelets: A new risk to the respiratory system as a consequence of their unusual aerodynamic properties, ACS Nano, 2012, 6, 736–746 CrossRef CAS PubMed.
- R. G. Mendes, A. Mandarino and B. Koch, et al., Size and time dependent internalization of label-free nano-graphene oxide in human macrophages, Nano Res., 2017, 10, 1980–1995 CrossRef CAS.
- B. Drasler, M. Kucki and F. Delhaes, et al., Single exposure to aerosolized graphene oxide and graphene nanoplatelets did not initiate an acute biological response in a 3D human lung model, Carbon, 2018, 137, 125–135 CrossRef CAS.
- L. Ou, B. Song and H. Liang, et al., Toxicity of graphene-family nanoparticles: a general review of the origins and mechanisms, Part. Fibre Toxicol., 2016, 13, 57 CrossRef PubMed.
- Y. Chang, S. T. Yang and J. H. Liu, et al., In vitro toxicity evaluation of graphene oxide on A549 cells, Toxicol. Lett., 2011, 200, 201–210 CrossRef CAS PubMed.
- M. Kucki, P. Rupper and C. Sarrieu, et al., Interaction of graphene-related materials with human intestinal cells: an in vitro approach, Nanoscale, 2016, 8, 8749–8760 RSC.
- S. Mittal, V. Kumar and N. Dhiman, et al., Physico-chemical properties based differential toxicity of graphene oxide/reduced graphene oxide in human lung cells mediated through oxidative stress, Sci. Rep., 2016, 6, 39548 CrossRef CAS PubMed.
- H. Yue, W. Wei and Z. Yue, et al., The role of the lateral dimension of graphene oxide in the regulation of cellular responses, Biomaterials, 2012, 33, 4013–4021 CrossRef CAS PubMed.
- W. Hu, C. Peng and W. Luo, et al., Graphene-Based Antibacterial Paper, ACS Nano, 2010, 4, 4317–4323 CrossRef CAS PubMed.
- W. Hu, C. Peng and M. Lv, et al., Protein Corona-Mediated Mitigation of Cytotoxicity of Graphene Oxide, ACS Nano, 2011, 5, 3693–3700 CrossRef CAS PubMed.
- K.-H. Liao, Y.-S. Lin and C. W. Macosko, et al., Cytotoxicity of Graphene Oxide and Graphene in Human Erythrocytes and Skin Fibroblasts, ACS Appl. Mater. Interfaces, 2011, 3, 2607–2615 CrossRef CAS PubMed.
- S. J. Froggett, S. F. Clancy and D. R. Boverhof, et al., A review and perspective of existing research on the release of nanomaterials from solid nanocomposites, Part. Fibre Toxicol., 2014, 11, 17 CrossRef PubMed.
- T. V. Duncan and K. Pillai, Release of Engineered Nanomaterials from Polymer Nanocomposites: Diffusion, Dissolution, and Desorption, ACS Appl. Mater. Interfaces, 2015, 7, 2–19 CrossRef CAS PubMed.
- European Committee for Standardization (CEN), Workplace atmospheres-size fraction definitions for measurement of airborne particles, London, England, 1993, http://legacy.library.ucsf.edu:8080/i/e/m/iem52d00/Siem52d00.pdf Search PubMed.
- W.-C. Su, B. K. Ku and P. Kulkarni, et al., Deposition of graphene nanomaterial aerosols in human upper airways, J. Occup. Environ. Hyg., 2016, 13, 48–59 CrossRef CAS PubMed.
- T. R. Martin, S. W. Meyer and D. R. Luchtel, An evaluation of the toxicity of carbon fiber composites for lung cells in vitro and in vivo, Environ. Res., 1989, 49, 246–261 CrossRef CAS PubMed.
- A. T. Saber, I. K. Koponen and K. A. Jensen, et al., Inflammatory and genotoxic effects of sanding dust generated from nanoparticle-containing paints and lacquers, Nanotoxicology, 2012, 6, 776–788 CrossRef CAS PubMed.
- W. Wohlleben, S. Brill and M. W. Meier, et al., On the Lifecycle of Nanocomposites: Comparing Released Fragments and their In vivo Hazards from Three Release Mechanisms and Four Nanocomposites, Small, 2011, 7, 2384–2395 CrossRef CAS PubMed.
- L. Schlagenhauf, T. Buerki-Thurnherr and Y. Y. Kuo, et al., Carbon Nanotubes Released from an Epoxy-Based Nanocomposite: Quantification and Particle Toxicity, Environ. Sci. Technol., 2015, 49, 10616–10623 CrossRef CAS PubMed.
- C. Pang, N. Neubauer and M. Boyles, et al., Releases from transparent blue automobile coatings containing nanoscale copper phthalocyanine and their effects on J774 A1 macrophages, NanoImpact, 2017, 7, 75–83 CrossRef.
- C. Han, A. Zhao and E. Varughese, et al., Evaluating weathering of food packaging polyethylene-nano-clay composites: Release of nanoparticles and their impacts, NanoImpact, 2018, 9, 61–71 CrossRef PubMed.
- L. Schlagenhauf, B. T. T. Chu and J. Buha, et al., Release of Carbon Nanotubes from an Epoxy-Based Nanocomposite during an Abrasion Process, Environ. Sci. Technol., 2012, 46, 7366–7372 CrossRef CAS PubMed.
- S. May, C. Hirsch and A. Rippl, et al., Transient DNA damage following exposure to gold nanoparticles, Nanoscale, 2018, 10, 15723–15735 RSC.
- M. Roesslein, C. Hirsch and J. P. Kaiser, et al., Comparability of in vitro tests for bioactive nanoparticles: a common assay to detect reactive oxygen species as an example, Int. J. Mol. Sci., 2013, 14, 24320–24337 CrossRef PubMed.
- A. C. Ferrari and D. M. Basko, Raman spectroscopy as a versatile tool for studying the properties of graphene, Nat. Nanotechnol., 2013, 8, 235–246 CrossRef CAS PubMed.
- L. Chen, X. Hu and J. Wang, et al., Impacts of Alternative Fuels on Morphological and Nanostructural Characteristics of Soot Emissions from an Aviation Piston Engine, Environ. Sci. Technol., 2019, 53, 4667–4674 CrossRef CAS PubMed.
- A. Eckmann, A. Felten and A. Mishchenko, et al., Probing the Nature of Defects in Graphene by Raman Spectroscopy, Nano Lett., 2012, 12, 3925–3930 CrossRef CAS PubMed.
- S. Stankovich, R. D. Piner and S. T. Nguyen, et al., Synthesis and exfoliation of isocyanate-treated graphene oxide nanoplatelets, Carbon, 2006, 44, 3342–3347 CrossRef CAS.
- N. Sharma, V. Sharma and Y. Jain, et al., Synthesis and Characterization of Graphene Oxide (GO) and Reduced Graphene Oxide (rGO) for Gas Sensing Application, Macromol. Symp., 2017, 376, 1700006 CrossRef.
- E. Andrijanto, S. Shoelarta, G. Subiyanto and S. Rifki, Facile synthesis of graphene from graphite using ascorbic acid as reducing agent, AIP Conf. Proc., 2016, 1725, 020003 CrossRef.
- F. V. Ferreira, L. D. S. Cividanes and F. S. Brito, et al., Functionalization of Graphene and Applications, 2016, pp. 1–29 Search PubMed.
- T. Thurnherr, K. Fischer, L. Diener, P. Manser, X. Maeder-Althaus, J. P. Kaiser, H. F. Krug, B. Rothen-Rutishauser and P. B. C. Wick, A comparison of acute and long-term effects of industrial multiwalled carbon nanotubes on human lung and immune cells in vitro, Toxicol. Lett., 2011, 200, 176–186 CrossRef CAS PubMed.
- T. Thurnherr, D. S. Su and L. Diener, et al., Comprehensive evaluation of in vitro toxicity of three large-scale produced carbon nanotubes on human Jurkat T cells and a comparison to crocidolite asbestos, Nanotoxicology, 2009, 3, 319–338 CrossRef CAS.
- G. Oberdörster, A. Maynard and K. Donaldson, et al., Principles for characterizing the potential human health effects from exposure to nanomaterials: elements of a screening strategy, Part. Fibre Toxicol., 2005, 2(8) DOI:10.1186/1743-8977-2-8.
- M.-S. Park, S. Lee and Y.-S. Lee, Mechanical properties of epoxy composites reinforced with ammonia-treated graphene oxides, Carbon Lett., 2017, 21, 1–7 CrossRef.
- S. Chandrasekaran, N. Sato and F. Tölle, et al., Fracture toughness and failure mechanism of graphene based epoxy composites, Compos. Sci. Technol., 2014, 97, 90–99 CrossRef CAS.
- F. W. Zok and A. Miserez, Property maps for abrasion resistance of materials, Acta Mater., 2007, 55, 6365–6371 CrossRef CAS PubMed.
- R. Hollertz, S. Chatterjee and H. Gutmann, et al., Improvement of toughness and electrical properties of epoxy composites with carbon nanotubes prepared by industrially relevant processes, Nanotechnology, 2011, 22, 125702 CrossRef CAS PubMed.
- Y. Cao and X. Li, Adsorption of graphene for the removal of inorganic pollutants in water purification: A review, Adsorption, 2014, 20, 713–727 CrossRef CAS.
- A. C. Ferrari, Raman spectroscopy of graphene and graphite: Disorder, electron–phonon coupling, doping and nonadiabatic effects, Solid State Commun., 2007, 143, 47–57 CrossRef CAS.
- Y. Bian, Z. Y. Bian and J. X. Zhang, et al., Effect of the oxygen-containing functional group of graphene oxide on the aqueous cadmium ions removal, Appl. Surf. Sci., 2015, 329, 269–275 CrossRef CAS.
- W. Peng, H. Li and Y. Liu, et al., A review on heavy metal ions adsorption from water by graphene oxide and its composites, J. Mol. Liq., 2017, 230, 496–504 CrossRef CAS.
- Z. Li, F. Chen and L. Yuan, et al., Uranium(VI) adsorption on graphene oxide nanosheets from aqueous solutions, Chem. Eng. J., 2012, 210, 539–546 CrossRef CAS.
- I. Zaman, H.-C. Kuan and J. Dai, et al., From carbon nanotubes and silicate layers to graphene platelets for polymer nanocomposites, Nanoscale, 2012, 4, 4578 RSC.
- W. Zheng, W. G. Chen and Q. Zhao, et al., Interfacial structures and mechanisms for strengthening and enhanced conductivity of graphene/epoxy nanocomposites, Polymer, 2019, 163, 171–177 CrossRef CAS.
- Q. Meng, S. Araby and J. Ma, Toughening mechanisms in epoxy/graphene platelets composites, 2015, DOI:10.1016/B978-1-78242-279-2.00003-2, Epub ahead of print 2015.
- L. Gong, R. J. Young and I. A. Kinloch, et al., Optimizing the reinforcement of polymer-based nanocomposites by graphene, ACS Nano, 2012, 6, 2086–2095 CrossRef CAS PubMed.
- R. Hollertz, S. Chatterjee and H. Gutmann, et al., Improvement of toughness and electrical properties of epoxy composites with carbon nanotubes prepared by industrially relevant processes, Nanotechnology, 2011, 22, 125702 CrossRef CAS PubMed.
- K. Donaldson, L. Tran and L. A. Jimenez, et al., Combustion-derived nanoparticles: A review of their toxicology following inhalation exposure, Part. Fibre Toxicol., 2005, 2, 10 CrossRef PubMed.
- S. Gangwal, J. S. Brown and A. Wang, et al., Informing selection of nanomaterial concentrations for ToxCast in vitro testing based on occupational exposure potential, Environ. Health Perspect., 2011, 119, 1539–1546 CrossRef CAS PubMed.
- L. Horváth, A. Magrez and M. Burghard, et al., Evaluation of the toxicity of graphene derivatives on cells of the lung luminal surface, Carbon, 2013, 64, 45–60 CrossRef.
- U. M. Graham, G. Jacobs and R. A. Yokel, et al., From Dose to Response: In Vivo Nanoparticle Processing and Potential Toxicity, Adv. Exp. Med. Biol., 2017, 947, 71–100 CrossRef CAS PubMed.
- N. Li, C. Sioutas and A. Cho, et al., Ultrafine particulate pollutants induce oxidative stress and mitochondrial damage, Environ. Health Perspect., 2003, 111, 455–460 CrossRef CAS PubMed.
- M. Orecchioni, D. A. Jasim and M. Pescatori, et al., Molecular and Genomic Impact of Large and Small Lateral Dimension Graphene Oxide Sheets on Human Immune Cells from Healthy Donors, Adv. Healthcare Mater., 2016, 5, 276–287 CrossRef CAS PubMed.
- M. Ochs and E. R. Weibel, Chapter 2: Functional Design of the Human Lung for Gas Exchange, in Fishman's Pulmonary Diseases and Disorders, 2015 Search PubMed.
- L. Ma-Hock, V. Strauss and S. Treumann, et al., Comparative inhalation toxicity of multi-wall carbon nanotubes, graphene, graphite nanoplatelets and low surface carbon black, Part. Fibre Toxicol., 2013, 10, 23 CrossRef CAS PubMed.
- W. Wohlleben, M. W. Meier and S. Vogel, et al., Elastic CNT-polyurethane nanocomposite: synthesis, performance and assessment of fragments released during use, Nanoscale, 2013, 5, 369–380 RSC.
- L. Schlagenhauf, B. Kianfar and T. Buerki-Thurnherr, et al., Weathering of a carbon nanotube/epoxy nanocomposite under UV light and in water bath: Impact on abraded particles, Nanoscale, 2015, 7, 18524–18536 RSC.
- L. Schlagenhauf, T. Buerki-Thurnherr and Y.-Y. Kuo, et al., Carbon Nanotubes Released from an Epoxy-Based Nanocomposite: Quantification and Particle Toxicity, Environ. Sci. Technol., 2015, 49, 10616–10623 CrossRef CAS PubMed.
- L. Schlagenhauf, B. Kianfar and T. Buerki-Thurnherr, et al., Weathering of a carbon nanotube/epoxy nanocomposite under UV light and in water bath: impact on abraded particles, Nanoscale, 2015, 7, 18524–18536 RSC.
Footnotes |
| † Electronic supplementary information (ESI) available. See DOI: 10.1039/c9nr10245k |
| ‡ Shared first author contribution. |
| § Shared corresponding author contribution. |
| This journal is © The Royal Society of Chemistry 2020 |