 Open Access Article
Quantitative analysis of time-resolved RHEED during growth of vertical nanowires†
Julian
Jakob
 *ab,
Philipp
Schroth
abc,
Ludwig
Feigl
b,
Daniel
Hauck
 b,
Ullrich
Pietsch
c and
Tilo
Baumbach
ab
aLaboratory for Applications of Synchrotron Radiation, Karlsruhe Institute of Technology, Kaiserstraße 12, D-76131 Karlsruhe, Germany. E-mail: julian.jakob@kit.edu
bInstitute for Photon Science and Synchrotron Radiation, Karlsruhe Institute of Technology, Hermann-von-Helmholtz-Platz 1, D-76344 Eggenstein-Leopoldshafen, Germany
cSolid State Physics, Emmy-Noether Campus, Walter-Flex Straße 3, D-57068 Siegen, Germany
First published on 17th February 2020
Abstract
We present an approach for quantitative evaluation of time-resolved reflection high-energy electron diffraction (RHEED) intensity patterns measured during the growth of vertical, free-standing nanowires (NWs). The approach considers shadowing due to attenuation by absorption and extinction within the individual nanowires and estimates the time dependence of its influence on the RHEED signal of the nanowire ensemble as a function of instrumental RHEED parameters and the growth dynamics averaged over the nanowire ensemble. The developed RHEED simulation model takes into account the nanowire structure evolution related to essential growth aspects, such as axial growth, radial growth with tapering and facet growth, as well as so-called parasitic intergrowth on the substrate. It also considers the influence of the NW density, which turns out to be a sensitive parameter for the time-dependent interpretation of the intensity patterns. Finally, the application potential is demonstrated by evaluating experimental data obtained during molecular beam epitaxy (MBE) of self-catalysed GaAs nanowires. We demonstrate, how electron shadowing enables a time-resolved analysis of the crystal structure evolution at the top part of the growing NWs. The approach offers direct access to study growth dynamics of polytypism in nanowire ensembles at the growth front region under standard growth conditions.
1 Introduction
Semiconductor nanowires (NWs) are promising building blocks for future devices like transistors,1,2 light-emitting diodes (LEDs),3 lasers,4 solar cells5,6 or sensors.7,8 The synthesis of semiconductor NWs is often realized by the vapour–liquid–solid (VLS) growth, which involves a liquid metal droplet on top of the growing NWs. In various material systems, like e.g. the III–V semiconductors, different crystal phases can occur inside NWs and change randomly along the growth axis (so-called polytypism).9 This is in contrast to the bulk material, where only one crystal phase is stable. For practical applications NWs with uniform crystal phase are demanded, because an increasing number of phase boundaries deteriorates the electronic and optical properties.10In situ characterization techniques allow for direct observation of phase evolution which can help to achieve a high degree of understanding and control of the crystal structure. Reflection high-energy electron diffraction (RHEED) is a standardtool for in situ characterization of the crystal structure in molecular beam epitaxy (MBE) systems, its main purpose being the immediate feedback to control thin-film growth. For non-planar structures, like NWs, the scattering geometry of RHEED changes from reflection to transmission geometry (diffraction during transmission of the electrons through the NWs).11 Until now interpretations of NW RHEED patterns of literature restrict themselves to rather qualitative considerations, e.g., of the onset of nucleation of NWs, of parasitic intergrowth or the transition between growth modes.12–16
The aim of the present study is to substantially refine the evaluation of time-resolved RHEED intensity patterns to enable quantitative conclusions, which would be a great progress for RHEED as a laboratory-based in situ analysis technique of NW growth dynamics. The ability to follow quantitatively the evolution of NW crystal structure opens deeper insight into growth processes such as nucleation processes or the evolution of polytypism of crystal phases during growth. For better quantitative interpretation of time-resolved RHEED patterns, we include the estimations of (a) the interaction of high-energy electrons with the NW in dependence on their crystal structures, mean radius and shape; (b) the mean interaction with the nanowire ensemble as a function of the NW density and positional distribution and on instrumental parameters, (c) the temporal development of both as a function of the growth dynamics. Aiming towards height selective information, we make targeted use of electron shadowing effects, which were observed in recent publications,12,14,17 but there without further discussion.
The electrons impinge on the NWs nearly perpendicular to the growth axis, and because of the high absorption of electrons within the NWs, the NW ensemble might partially shadow the incident electron beam, i.e. shadowed individual NWs will be illuminated by a locally varying lower electron flux density as compared to NWs hit by an unshadowed electron beam. In particular, the shadowing causes that not the full NW height might contribute uniformly to the scattering signal. Due to the slightly inclined incidence of the electron beam with respect to the mean substrate, usually there remains a non-shadowed part next to the apex of the NWs, which will accordingly always be fully illuminated.
The ability to height selectively characterize the structure and growth dynamics of the particular region at the apex of the NWs was so far reserved to in situ transmission electron microscopy (TEM) NW-studies.18–20In situ TEM offers a unrivaled high spatial resolution, in particular, of the interface between the liquid droplet and the NW, allowing for a detailed investigation of correlation between crystal structure and the shape of the liquid droplet on top of the NW.18–21 But usually growth of individual NWs instead of statistical ensembles is characterized within a special growth environment. Complementary, in situ X-ray diffraction (XRD) offered the possibility for investigating NW ensembles with epitaxial contact to the substrate, and under standard growth conditions. XRD gives access to all stages of NW growth starting from the nucleation to the final shape of the NWs.22–26 The technique is sensitive to the crystal structure and shape of the scattering objects via the fine structure of the Bragg diffraction peaks,26 but always integrates structural information over the full NW height. Whole NW ensembles but also single NWs can be investigated, providing time-resolved information either averaged over complete NW ensembles or over an individual NW, respectively.
In contrast to both in situ XRD and in situ TEM, in situ RHEED is practically available at all MBE-chambers. The quantitative approach developed in this paper allows to combine the advantages of NW ensemble measurements under standard growth conditions, to a certain degree with height selectivity for the top of the growing NWs. In the next chapter we will introduce into underlying aspects of the RHEED simulation model, exemplifying in a subsequent chapter the application potential of the quantitative RHEED approach for NW growth experiments.
2 Simulation of RHEED during growth of statistical NW ensembles
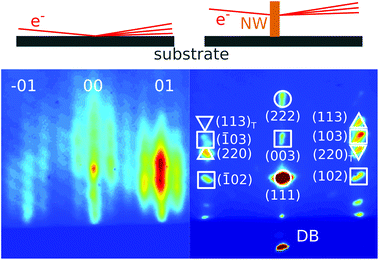
In this chapter we develop an approach for the quantitative simulation of RHEED intensities integrated over the diffraction spots from statistical NW ensembles corresponding to chosen reciprocal lattice points. Fig. 1 illustrates two typical experimental RHEED patterns,11 on the left side a diffraction pattern in reflection geometry taken from a clean GaAs(100) surface in vacuum, showing a crystal-truncation-rod behavior which mainly probes the surface reconstruction during layer by layer growth, on the right side a diffraction pattern in transmission geometry from GaAs NWs grown on Si(111). In the latter, in the [![[1 with combining macron]](https://www.rsc.org/images/entities/char_0031_0304.gif) 10] azimuth, the reciprocal lattice points for different crystalline phases are well separated. This crystal-phase selectivity of the RHEED diffraction patterns permits the detailed in situ investigation of the evolution of polytypism during growth.
10] azimuth, the reciprocal lattice points for different crystalline phases are well separated. This crystal-phase selectivity of the RHEED diffraction patterns permits the detailed in situ investigation of the evolution of polytypism during growth.
The following sections of the chapter roughly describe RHEED by single NWs, from which we conclude on self-shadowing of the electron beam within each NW and on shadowing caused by the NW ensemble (ensemble-shadowing). We will estimate the effect of both on the individual diffraction contribution of partially shadowed NWs, and deduce consequences for the RHEED-signals averaged over stationary statistical NW ensembles. In order to simulate the time evolution of the RHEED signal from dynamical statistical ensembles, we extract from realistic models of NW growth dynamics the most important parameters for the mean structure evolution of the NW ensemble as input parameter for a RHEED simulation model to quantitatively describe the temporal development of Bragg reflection intensities in the time-resolved NW RHEED patterns. The RHEED simulation model is tested by comparing results of simulations with experimental data taken during the MBE growth of self-catalysed GaAs NWs on Si(111) covered with native oxide, which we report in section 4.
2.1 Electron beam diffraction by a single (static) NW
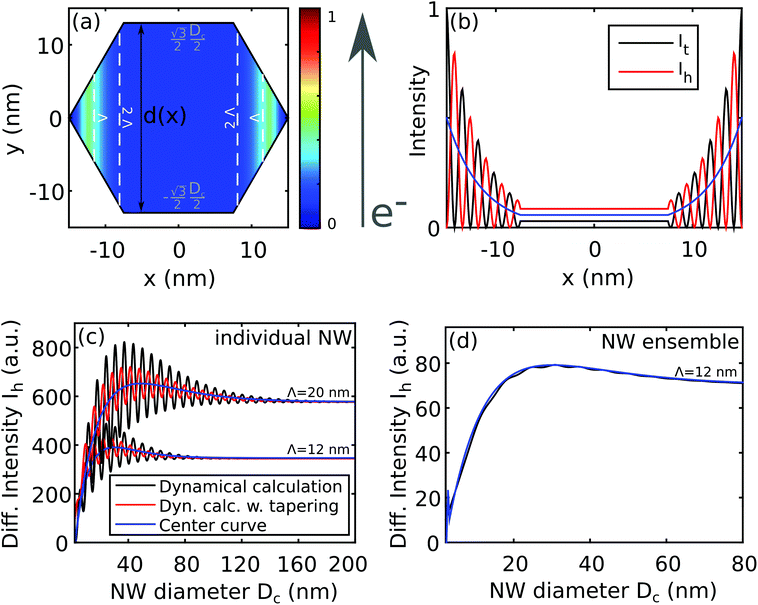
For the description of the diffraction of high-energy electrons by the quite perfect crystalline nanowires we need to consider the influences of absorption and multiple scattering. Within the dynamical diffraction theory in the conventional two-beam Laue case (diffraction in transmission geometry), the intensities of the forward-transmitted and diffracted beams of a crystal of thickness d, It and Ih, can be written in the diffraction maximum as27 | (1) |
 | (2) |
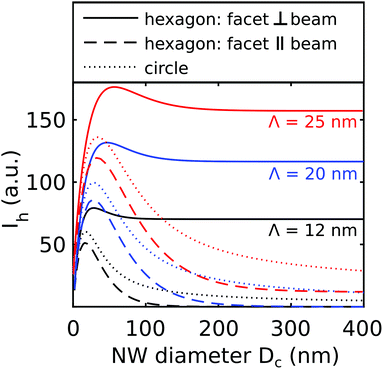 | ||
| Fig. 4 Diffracted intensity Ih integrated over the NW for different NW cross sections and different mean free path lengths Λ. | ||
2.2 RHEED by stationary NW ensembles
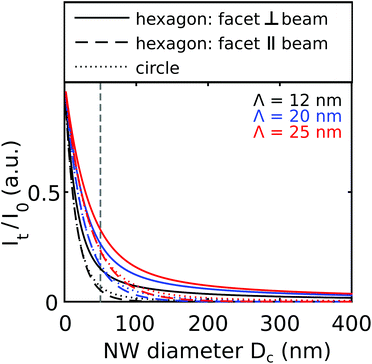
The typical dimension of the electron beam cross section in RHEED is such that several thousand individual NWs are probed at the same time. Considering all NWs of the ensemble to contribute incoherently to the diffracted signal, the diffracted intensity of the ensemble is equal to the sum of all individual intensity contributions. Assuming a statistically homogeneous ensemble with a slight fluctuation of NW diameters this also results in rapidly vanishing ‘Pendellösung’ oscillations so that practically only the first part in the parenthesis of eqn (1) and (2) remains to be considered, as has been illustrated in Fig. 2(d). Here the overall intensity of the diffracted beam is calculated by use of the complete eqn (1) and (2), but assuming an exemplary Gaussian radius distribution with a standard deviation of 2 nm, in comparison to the mean center curve of Fig. 2(c). The assumed mean diameter deviation is justified for all samples under study in this publication. Moreover, quantitative RHEED analysis employes the intensity integrated over the whole RHEED spot of a given reciprocal lattice point (RLP). This corresponds to integration over the angular divergence and the energy spread of the electron beam, further attenuating the Pendellösung fringes. Performing purely radial growth experiments we have found no evidence for radius dependent intensity fluctuations even for small NW diameters. On the basis of these arguments we omit the Pendellösung terms in the following.In Fig. 3 we illustrated the averaged attenuation of the electron flux due to absorption during transmission in GaAs for different values of the electron mean free path length Λ. For beam energies of 20–30 keV in GaAs, we expect Λ values of approx. 10 nm–25 nm.29,30 Let us consider NWs with circumference diameters of 50 nm. For the previously mentioned Λ values of approx. 10–25 nm, in average 15%–30% of the incident intensity hitting one single NW remains in the forward-transmitted beam, which may then hit a subsequent NW on its path, but with a strongly reduced mean flux density. In other words, beside the self-shadowing effect described in section 1, which limits the diffraction contribution of a single NW, each individual NW additionally causes a shadow on the geometrical electron beam path behind the NW. The precise shadowing conditions behind the NW depend beside Dc on the shape and the azimuthal NW orientation. Within reasonable precision, this situation can be accounted for by introducing an effective shadow diameter Dshad, which takes the related local variation of transmission sufficiently into account. In such a way the incomplete shadowing of a NW of given Dc, shape and orientation (e.g., due to the remaining transmission at the wedge tips) equals a complete electron shadow corresponding to an effective diameter Dshad.
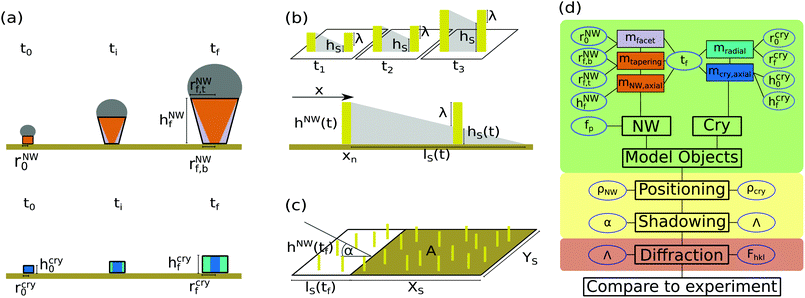
A small but non-zero inclined angle of incidence of the electron beam α with respect to the substrate surface results in a decreasing height of the NW shadow hS with increasing next-neighbor-distance of the NWs (see Fig. 5(b)). A bottom part of a NW may become shadowed while a top part will still remain illuminated by the full primary flux density. In the following, the height of this fully illuminated upper part will be called illumination height λ, and the mutual shadowing of the NWs ensemble-shadowing.
2.3 Structure dynamics during NW growth
Aiming to conclude from quantitative RHEED on temporal changes of the crystalline properties of the NW ensemble the underlying RHEED simulation model needs to relate the dynamics of the RHEED signals to suitable growth models. This allows simulation of the evolution of the individual NWs or crystallites (CRYs) during growth and estimation of the evolution of the intensities from the complete NW and CRY ensembles. In contrast to the NW ensemble, the CRY ensemble consists of small multifaceted GaAs objects typically growing in vapor–solid mode.31In the literature, established growth models attempt to describe axial and radial evolution of the objects (NWs and CRYs) on the substrate as a function of the global and local growth conditions, the variation of NW height, shape and size during growth, in particular in relation to the NW droplet properties, as well as the unintended growth of parasitic CRYs. Starting from some NW and CRY nucleation on the prepared substrates, the growth dynamics acts on the evolution of the NW and CRY size and shape and crystal phases, which can be described by axial and radial growth rates, whereby the latter distinguishes tapering and facet growth in case of NWs. Accordingly we incorporate both type of objects and the structural dynamics of their ensembles. During deposition, NWs and CRYs can increase in height, characterized by respective axial rates maxial(t) averaged over the ensembles, and their radial dimensions with corresponding radial growth rates (mradial(t)). In case of the NWs, radial growth has to distinguish facet growth and tapering by the corresponding rates mfacet(t) and mtapering(t). If all these growth rates can be supposed to be linear, such a linear model manages with a few parameters only, namely the growth time t, the initial object shape, and three constant growth rates, or equivalently, with the initial and final object shapes (mainly the initial and final circumference radii r0,rf, object heights h0,hf, and growth times t0,tf. Fig. 5(a) illustrates the essential structure parameters. The intensity evolution of our samples could already be modeled sufficiently with this simple model. However, the RHEED simulation model could be easily extended to incorporate more accurate growth models as presented elsewhere.26,32,33
2.4 Dynamics of ensemble-shadowing
The strength of ensemble-shadowing will vary during growth, its dynamics will essentially depend on the dynamics of the mean height and averaged size of the NWs, on the (stationary) positional distribution, in particular the NW-number density of the statistical NW ensemble, and on the illumination geometry of RHEED with respect to the ensemble. We treat the positional distribution of the ensembles by Monte Carlo simuations. In our examples we assume uniformly distributed random NW positions over the substrate, but also other appropriate statistical distribution can be easily implemented into Monte Carlo simulation procedures. In the model (see Fig. 5(c)), a total number N of NWs inside an area A (of size XS in beam direction times YS perpendicular to the beam), is positioned randomly at (xn,yn), n ∈ [1,N] leading to a mean number density ρNW. An individual NW casts a shadow with a footprint on the substrate surface of DshadlS(t), with the shadow length lS(t) | (3) |
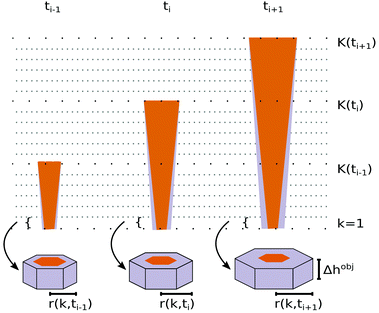
For calculating the extent of shadowing for the statistical ensemble we use the Monte-Carlo approach to position the NWs in the illuminated area and further to calculate hS(n)(t) respective λ(n)(t) for the various NWs. Since with increasing growth time each NW casts a growing shadow lS(t), more and more NWs will become increasingly shadowed. Their individual shadowed height hS(n)(xn,yn,t), n ∈ N, changes as a function of their relative position and distance with respect to the surrounding shadowing NWs and the mean axial NW growth dynamics of hNW(t) of the ensemble. In Fig. 5(b) the situation is sketched for three different times during one growth run. In order to reduce the computing time we make the following simplification: all NWs are assumed to have similar shape and are vertically aligned. We also neglect tapering for the shadow calculations, instead we use the mean effective shadow diameter ![[D with combining macron]](https://www.rsc.org/images/entities/i_char_0044_0304.gif) shad averaged over the ensemble. In principle, tapering can easily be included into the treatment of ensemble-shadowing, but such more thorough calculations would only give a difference of a few % of the shadowed area for realistic tapering of the NWs, which in our example is 2% for rNWf,t/rNWf,b = 1.2. Thus, the NWs, in this approximation, cast rectangular and total shadows on the surface, the width of the shadows along y equals
shad averaged over the ensemble. In principle, tapering can easily be included into the treatment of ensemble-shadowing, but such more thorough calculations would only give a difference of a few % of the shadowed area for realistic tapering of the NWs, which in our example is 2% for rNWf,t/rNWf,b = 1.2. Thus, the NWs, in this approximation, cast rectangular and total shadows on the surface, the width of the shadows along y equals ![[D with combining macron]](https://www.rsc.org/images/entities/i_char_0044_0304.gif) shad originating at the NW position (yn ±
shad originating at the NW position (yn ± ![[D with combining macron]](https://www.rsc.org/images/entities/i_char_0044_0304.gif) shad/2), the length along x follows eqn (3). The related shadowing height at a given position and growth time is
shad/2), the length along x follows eqn (3). The related shadowing height at a given position and growth time is
 | (4) |
At any point (x,y) inside A the shadows of NWs worthy of consideration contribute with different shadow heights as a function of their relative positions. Accordingly, each individual NW localized at position (xm,ym), m ∈ N becomes shadowed by the NW ensemble, up to the shadowed height hS(m)(xm,ym,t) being the maximum value of all shadowing heights of the surrounding NWs evaluated by eqn (4). As a further reasonable approximation the NW m is assumed to be shadowed from the bottom up to hS(m) over its whole cross section. Evaluating hS(m)(t) for all N NWs inside A, we can determine the ensemble fraction s(h,t) of wires which are shadowed up to a certain height h(t). Unintentional statistical fluctuations in the results from Monte Carlo simulations decrease for larger ρNW. Aiming to simulate statistically homogeneous ensembles, the Monte Carlo simulations might be repeated j times, (for our samples in the order of 1–10 times) depending on A and ρNW. Similarly, we can determine the individual illumination heights for all NWs, λ(m)(xm,ym,t) = h(t) − hS(m)(xm,ym,t), and for any height and time the corresponding ensemble-fraction of wires being completely illuminated from the top down to this height, (1 − s(h,t)). Further, we determine the mean shadowed height  and the corresponding mean illumination height
  by averaging over all hS(m) or respectively λ(m) of the whole ensemble.
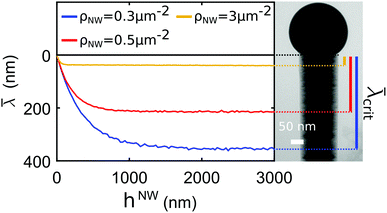
The specific dependence of  as a function of the NW height hNW(t) and therefore of the axial growth rate and time is illustrated in Fig. 6 for three different NW number densities of the ensemble ρNW (number of NWs per area) and given (constant) NW radius. During the initial phase of growth almost no shadowing occurs, since the shadows mostly do not reach the neighboring NWs. Consequently,
  increases nearly linearly with hNW(t). At later time, the shadowing increases, till at the point tcrit when the NWs become sufficiently long, the mean ensemble illumination height reaches a critical value
  , which during further growth remains constant (since the further increase in NW height hNW(t) results in a proportional increase in mean ensemble shadow height
  ). The exact value of
  strongly depends, beside the angle of electron incidence, on Dshad and the NW number density.
For pure axial growth and absence of polytypism or parasitic crystal growth, the RHEED intensity develops linearly with  . Consequently it starts growing linearly with time, with increasing shadowing the intensity increase slows down till the saturation of the illumination height at
  would lead to saturation of the time dependent RHEED signal (see Fig. 9). More generally, after tcrit, at which the mean illuminated height stays constant, observed RHEED intensity variations can be more easily attributed to other structural changes only. Those can be caused, either by changing polytypism rates and/or by radial growth effects (see Fig. 10 and 11).
The magnitude of  defines the character of RHEED, either (for large
  ) – to be rather a volume method for NW examination (just similar to in situ XRD), or (for decreasing
  ) rather to become increasingly height selective. For very small
  , the RHEED signals can be attributed to an accordingly narrow illuminated part just below the axial growth front. The latter holds for sufficiently large and therefore more efficiently shadowing NW number densities. This is desired in order to effectively probe the dynamics of that small part on top of the NW, where the catalytic crystal growth happens.
As described in section 2, the NW radius has an impact by increasing ![[D with combining macron]](https://www.rsc.org/images/entities/i_char_0044_0304.gif) shad on the mean shadow footprint (and related shadowed volume) per NW. Together with the number density of wires it leads to an increasing mean shadow coverage of the NW ensemble. It influences the shadowed ensemble fraction s(h,t), which for larger NW density undergoes a sharper height transition Δh from a complete shadowed bottom part (with s(h,t) = 1) to a completely illuminated top part (with s(h + Δh,t) = 0). Further, an increase of the incidence angle α of the electron beam has a strong influence: for given mean NW density the shadow coverage reduces and consequently (due to eqn (3) and (4)) a larger upper part of the NWs
shad on the mean shadow footprint (and related shadowed volume) per NW. Together with the number density of wires it leads to an increasing mean shadow coverage of the NW ensemble. It influences the shadowed ensemble fraction s(h,t), which for larger NW density undergoes a sharper height transition Δh from a complete shadowed bottom part (with s(h,t) = 1) to a completely illuminated top part (with s(h + Δh,t) = 0). Further, an increase of the incidence angle α of the electron beam has a strong influence: for given mean NW density the shadow coverage reduces and consequently (due to eqn (3) and (4)) a larger upper part of the NWs  becomes illuminated, corresponding to a reduction of
  . A detailed investigation of shadowing effect as a function of NW radius, density and illumination angle, as well as an empirical equation for
  is given in the ESI.† Concluding, similarly to planar RHEED, also RHEED in transmission geometry could become extremely sensitive towards changes in the crystal structure at the growth front.
2.5 RHEED intensity evolution for dynamical statistical ensembles
Finally, in order to simulate the RHEED intensity evolution of the two statistical ensembles of NWs and CRYs during growth, we assume homogeneous growth conditions. All objects of an ensemble are supposed to undergo more or less identical structure evolution. A slight variation of NW or CRY diameters around their respective mean ensemble values is allowed (and indirectly considered by omitting the Pendellösung terms – see section 2). The positional distribution of the objects in the ensemble arrangements shall be random. For simulation, at arbitrary time, all objects of an respective ensemble are treated to have the same height hobj(t) = mobjaxial·t. As illustrated in Fig. 7, the objects can be subdivided along the axial growth axis into slices of even thicknesses Δhobj. Figuratively speaking, starting with an initial slice k = 1 at the object bottom determined by its shape and the initial circumference radius r0 the model generates the objects by stacking slice per slice with growing number index k on top of another. The objects are finalized by one last slice k = Kobj(t) + 1 with thickness Δhk=Kobj(t)+1 = mobjaxial·t − (Kobj(t)·Δhobj) to fit the total height of the stack to the total object height hobj(t) – but this last slice does not play any significant role for sufficiently small Δhobj.
Each object slice k is characterized by its radius robj(k,t) temporally developing as a function of the radial facet and tapering growth rates. In our case the NWs have a hexagonal cross section with (1![[1 with combining macron]](https://www.rsc.org/images/entities/char_0031_0304.gif) 0) side facets. We can introduce a corresponding time-dependent effective scattering cross section of a slice Ω(r(k,t), Λ) by taking self-shadowing in the objects into account. In our example the NW azimuth is in the [
0) side facets. We can introduce a corresponding time-dependent effective scattering cross section of a slice Ω(r(k,t), Λ) by taking self-shadowing in the objects into account. In our example the NW azimuth is in the [![[1 with combining macron]](https://www.rsc.org/images/entities/char_0031_0304.gif) 10] orientation, thus the electrons impinge at a side facet, and we obtain
10] orientation, thus the electrons impinge at a side facet, and we obtain
 | (5) |
 , where ρcry is the number density of crystallites.
In the experimental examples we study ensembles of GaAs NWs, with polytypism of wurtzite (WZ), zinc blende (ZB) and the rotational twin of zinc blende (TZB). However, ZB and TZB are occuring equally frequent, thus we distinguish between the cubic (ZB and TZB) and the hexagonal (WZ) phases and the respective phase fractions are fZB(h) and fWZ(h). The crystallites grow in zinc blende phase only. As shown in Fig. 1, there are phase-insensitive and phase-sensitive Bragg reflections. In the former case, the contributions of different phases are experimentally not distinguishable, and the total integrated diffraction intensity of a RHEED spot becomes
 | (6) |
In the latter case, we can record several oppositely phase-sensitive Bragg reflections (which correspond either to one or the other crystal phase) and determine the temporal behavior of their respective proportion of the sum of the intensities ĨNWp(t) of all considered Bragg reflections corrected by the respective structure factors and by the contribution of parasitic crystallites
 | (7) |
3 Discussion and comparison of simulation and experiments
Summarizing, the RHEED simulation model developed here takes into account the nanowire structure evolution related to intrinsic aspects of nanowire growth such as axial growth, radial growth with tapering and facet growth, as well as so-called parasitic intergrowth on the substrate. It considers the occurrence of polytypism in the nanowires, self-shadowing within the NWs and mutual shadowing within the NW ensemble and includes the influence of the NW density as a sensitive parameter for the time-dependent interpretation of the intensity patterns.In case of NW diameters smaller than or equal to the mean free path length Λ, the dynamics of the RHEED signal is still quite sensitive to temporal changes of NW diameter and therefore able to detect radial growth rates. But for larger NW diameters, due to increasing self-shadowing within the NW, the signal becomes progressively insensitive to further radial growth. In our above discussed azimuthal geometry of Fig. 2 the diffraction signal saturates at intensity values corresponding to illuminated volume of the semi-transparent wedge tip regions, whereas the growing central part of the NW, with transmission path length increasingly beyond Λ, does NOT essentially contribute to the RHEED diffraction signal.
Further, we included the mutual shadowing within the wire ensemble, this ensemble-shadowing affects the dynamics of the effectively illuminated height proportion of the NW. It also affects the diffraction signal of the crystallite ensemble. Therefore, the NW density, by influencing the ensemble-shadowing, turns out to be a crucial parameter in the time-dependent interpretation of the intensity patterns. The strength of the shadowing impact is also affected by the diffraction geometry, mainly by the angles of incidence (and diffraction) with respect to the mean substrate surface and by the azimuthal orientation with respect to the facet orientation. In the following we illustrate the possibilities and limitations by evaluating experimental data obtained during MBE growth of self-catalysed GaAs nanowires, finally demonstrating the potential application of quantitative RHEED for the characterization of NW growth dynamics.
3.1 Experimental refinement of the electron mean free path length Λ
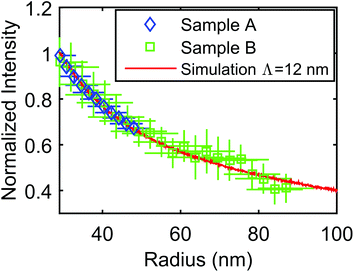
For a realistic estimation of self-shadowing and ensemble-shadowing in the RHEED simulation model we need a reliable input value for the mean free electron path length Λ of our electron beam. In the literature, values for Λ show a large variation and uncertainties.29,30 Therefore we first consider possibilities to calibrate Λ for our purpose experimentally. By increasing NW thickness in a controlled manner, while all other parameters are kept constant, the detected RHEED intensity should decrease in a well-defined way due to increasing self-shadowing caused by electron absorption in accordance with the mean free path length. Experimentally, such conditions can be achieved by growing homo-epitaxial shells around NW cores. To determine Λ for our RHEED system and chosen beam energy (20 keV), we grew two such homo-epitaxial GaAs shell samples with two different shell growth rates. Each shell was grown for 60 min around NW cores with an initial radius of circumference of the NW hexagonal cross section at the apex of rNWreference,f,t = (31 ± 2) nm (measured at a reference sample by post-growth scanning electron microscopy (SEM)). During this deposition time RHEED patterns were taken. After growth, sample A has a final radius of rNWA,f,t = (47 ± 7) nm and sample B a final radius of rNWB,f,t = (77 ± 10) nm (the mean shell growth rates are mA,shell = (0.27 ± 0.03) nm min−1 and mB,shell = (0.77 ± 0.18) nm min−1). In Fig. 8 the integrated intensity of the GaAs(111) peak normalized to the value at rNWreference,f,t is plotted as a function of NW radius for sample A (depicted in blue) and sample B (depicted in green). We simulate the intensity decay for the two shell growth rates with different Λ ∈ [5,25] nm. To compare the simulations and the experiment, we determined the root-mean-square deviation (RMSD) for each Λ. In agreement for both samples, the lowest RMSD is at Λ = 12 nm, illustrated by the red curve. We used this value in the following analysis.4 Quantitative RHEED during growth for various NW densities
By way of four examples, we demonstrate the impact of the number density on the shadowing on the RHEED signal, the two of higher density focusing additionally on the sensitivity of RHEED for the study of polytypism dynamics of growing NW ensembles. All examples demonstrate the time dependent influence of ensemble-shadowing on the relation between the growth dynamics and the RHEED signal dynamics and allow us to test the simulation model for treating such influence. The examples deal with the growth of self-catalysed GaAs NWs on Si(111) substrates covered with native oxide. First, we study the temporal behaviour of symmetrical, phase-insensitive Bragg reflections, which suppress any influence of polytypism. This emphasises the strong impact of the NW number density (via its influence on and on 1 − s(h,t)) as being directly reflected in the diffraction intensity evolution of time-resolved in situ RHEED (eqn (5)).
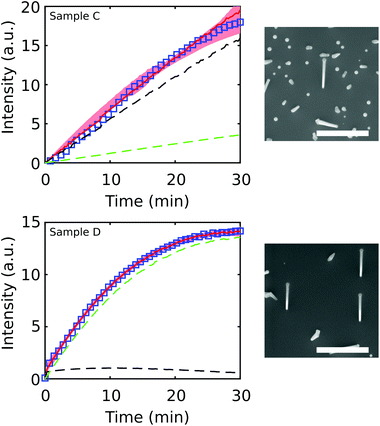
In Fig. 9 we compare results of samples of two different, relatively low NW densities, but comparable NW shape. We collected in situ RHEED data and determined the time-resolved integrated intensity of the symmetric GaAs(111) reflection after a background correction. For data evaluation, we examined simulated RHEED intensity evolutions for a large sample parameter space (see Table 2.2 in the ESI†). Since RHEED experiments give precise relative data of intensity variation with time but less precise absolute intensity values, all simulated curves were normalized to an equal area under the curves (equal time-integrated values) before being compared to the experimental data sets. We further calculated the RMSD to the experiment for every simulation. In Fig. 9 the experimental curves are depicted in blue and the simulated intensity evolution with the lowest RMSD value (giving the best description of the experimental data) in red. The red shaded area marks all other simulated curves, which result in a two times larger RMSD value compared to the best simulation. The simulated curves of our model are in very good agreement with the experimental data and also in reasonable agreement with the post-growth SEM analysis (see Table 2.2 in the ESI†). Considering radial growth, there is a competition between the initially dominating increase of the diffraction volume and the later dominating increase of shadowing efficiency. Following the results of section 2.1, even in the theoretical case of large radial growth rates and hypothetically non-shadowed (free standing) NWs, the diffracted signal would not increase above a maximum value which is limited by self-shadowing. Consequently, the RHEED signal becomes less sensitive to radial growth (see Table 2.2 in the ESI†).
The contribution of NWs to the signal is depicted as a dashed green line and the contribution of the crystallites as a dashed black line. SEM images of the samples are shown on the right side of the respective plot. Sample C has a very low ρNW, but a large ρcry, thus the signal is dominated by the crystallites (dashed black line). In contrast, sample D has a much higher ρNW, the signal is dominated by the NW contribution. In accordance with our discussion in section 2.4, initially we observe an approximately linear increase of the NW intensity corresponding to the axial growth rate. At later time the signal increase slows down, and approximately at t = 25 min the integrated intensity starts to saturate because hNW(t) becomes larger than  (compare to Fig. 6). Such a signal saturation was observed also by other authors, however, without any interpretation.15,16
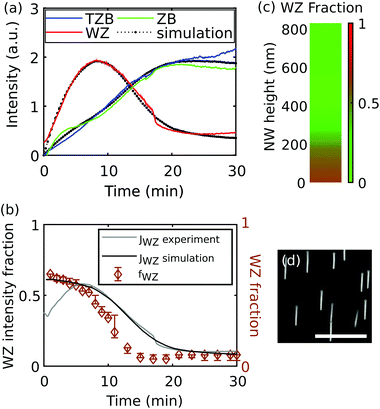
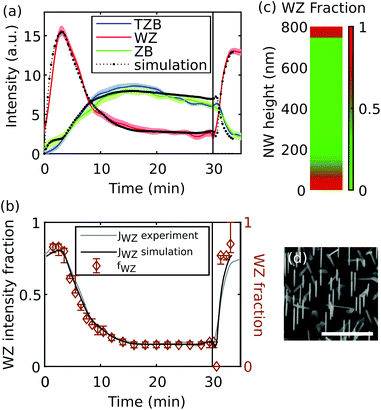
The saturation intensity is defined by the NW density and the effective diameter Dshad, and independent of the positional distribution function. For increasing NW densities, the illumination height  decreases, leading to improved height selectivity of the RHEED signal. Therefore, in combination with sufficiently large NW densities, our approach can provide quantitative information on the growth dynamics of nanowire ensembles near the growth front under standard conditions, and is particularly sensitive for the dynamics of polytypism. Fig. 10(a) and 11(a) show the experimental and simulated evolution of the RHEED intensity of the wurtzite, zinc blende and twin zinc blende phase-sensitive Bragg reflections from two samples, E of medium and F of high NW densities. The simulated intensity curves have been obtained by eqn (5) based on temporal support points of the wurtzite share fWZ of the growth rate given in the Fig. 10(b) and 11(b). We find remarkable agreement between the experimental and simulated RHEED intensity data. By applying eqn (7) to the experimental and calculated curves of Fig. 10(a) and 11(a), we obtain the corresponding experimental and calculated wurtzite intensity fraction JWZ, also plotted in Fig. 10(b) and 11(b). It is interesting to directly compare the temporal curve progressions of the wurtzite intensity fractions with the wurtzite fractions of the growth rate underlying the simulations. We observe a high similarity for the sample of higher NW density (sample F), for which shadowing is strong and sharp and the critical illumination height is small (
 ≈ 19 nm). Here, the RHEED signal fraction corresponds nearly directly to the phase fraction at the growing NW top (Fig. 11(c)). Whereas the ten times lower NW number density of sample E leads to a larger critical illumination height (
 ≈ 125 nm) and a less sharp transition from the shadowed to the illuminated part within the ensemble. This explains the larger difference between the dynamics of the WZ intensity fraction and the corresponding WZ fraction (Fig. 10(b)). This means that for sufficiently large NW densities and respectively low illumination height (as in sample F) the measured RHEED intensity fraction for a given phase can serve as a direct measure for the phase fraction on the NW top. But also for lower NW densities (as in sample E), based on simulations it is possible to determine the dynamics of the phase fraction of the growth rates. Finally, supposing that phase switching can only occur at the axial growth front, we can reconstruct from the temporal RHEED data the final vertical variation of WZ fraction along the NWs as given in Fig. 10(c) and 11(c).
5 Conclusions
Studying the RHEED from statistical NW ensembles during MBE growth, we have presented an approach which allows quantitative analysis based on simulation of in situ time-resolved integrated intensities of NW diffraction peaks. The simulation model accounts for the size and shape evolution of NW and parasitic crystallites during growth, as well as the shadowing of electrons. Distinguishing between self-shadowing and ensemble-shadowing, the former limits the radius dependence of the RHEED signal, both effects together leading to a saturation of RHEED intensity even for progressing axial growth. The simulation model allows a detailed and quantitative interpretation of the RHEED data and good quantitative agreement between simulated and experimental results. Efficient ensemble-shadowing of ensembles with larger NW number density results in electron illumination of only a small part of the NWs directly at the apex. Thus, the recorded intensity contains local information on the crystal structure at the growth front of the NWs, resulting in height-dependent information. The approach paves the way for a laboratory-based quantitative analysis of the crystal structure via the intensity dynamics of phase-selective reflections in the RHEED pattern. Furthermore we propose a way to determine the absorption length Λ in different NW materials systems and for different beam energies. The quantification of RHEED in transmission geometry by NWs provides complementary information to other characterization methods such as XRD or TEM. This can in the future be used for even more fundamental studies of nucleation processes, polytypism and defects in NWs, as well as their temporal evolution.Conflicts of interest
There are no conflicts to declare.Acknowledgements
The authors thank B. Krause, A. Weisshardt, S. Stankov and T. Farago for their support at KIT, as well as the INT for access to the SEM. This work was funded by BMBF project 05K16PSA.Notes and references
- O.-P. Kilpi, J. Svensson, J. Wu, A. R. Persson, R. Wallenberg, E. Lind and L.-E. Wernersson, Nano Lett., 2017, 17, 6006–6010 CrossRef CAS PubMed.
- L. Chen, F. Cai, U. Otuonye and W. D. Lu, Nano Lett., 2016, 16, 420–426 CrossRef CAS PubMed.
- J. Valente, T. Godde, Y. Zhang, D. J. Mowbray and H. Liu, Nano Lett., 2018, 18, 4206–4213 CrossRef CAS PubMed.
- H. Kim, W.-J. Lee, A. C. Farrell, J. S. D. Morales, P. Senanayake, S. V. Prikhodko, T. J. Ochalski and D. L. Huffaker, Nano Lett., 2017, 17, 3465–3470 CrossRef PubMed.
- M. Yao, S. Cong, S. Arab, N. Huang, M. L. Povinelli, S. B. Cronin, P. D. Dapkus and C. Zhou, Nano Lett., 2015, 15, 7217–7224 CrossRef CAS PubMed.
- Y. Guerfi and G. Larrieu, Nanoscale Res. Lett., 2016, 11, 210 CrossRef PubMed.
- D. Verardo, F. W. Lindberg, N. Anttu, C. S. Niman, M. Lard, A. P. Dabkowska, T. Nylander, A. Månsson, C. N. Prinz and H. Linke, Nano Lett., 2018, 18, 4796–4802 CrossRef CAS PubMed.
- P. K. Sahoo, R. Janissen, M. P. Monteiro, A. Cavalli, D. M. Murillo, M. V. Merfa, C. L. Cesar, H. F. Carvalho, A. A. de Souza, E. P. A. M. Bakkers and M. A. Cotta, Nano Lett., 2016, 16, 4656–4664 CrossRef CAS PubMed.
- K. A. Dick, P. Caroff, J. Bolinsson, M. E. Messing, J. Johansson, K. Deppert, L. R. Wallenberg and L. Samuelson, Semicond. Sci. Technol., 2010, 25, 024009 CrossRef.
- D. Spirkoska, J. Arbiol, A. Gustafsson, S. Conesa-Boj, F. Glas, I. Zardo, M. Heigoldt, M. H. Gass, A. L. Bleloch, S. Estrade, M. Kaniber, J. Rossler, F. Peiro, J. R. Morante, G. Abstreiter, L. Samuelson and A. Fontcuberta i Morral, Phys. Rev. B: Solid State, 2009, 80, 245325 CrossRef.
- G. Wang and T. Lu, RHEED Transmission Mode and Pole Figures: Thin Film and Nanostructure Texture Analysis, Springer, 2013 Search PubMed.
- S. Breuer, M. Hilse, A. Trampert, L. Geelhaar and H. Riechert, Phys. Rev. B: Solid State, 2010, 82, 075406 CrossRef.
- C. Chèze, L. Geelhaar, A. Trampert and H. Riechert, Appl. Phys. Lett., 2010, 97, 043101 CrossRef.
- D. Rudolph, S. Hertenberger, S. Bolte, W. Paosangthong, D. Spirkoska, M. Döblinger, M. Bichler, J. J. Finley, G. Abstreiter and G. Koblmüller, Nano Lett., 2011, 11, 3848–3854 CrossRef CAS PubMed.
- S. Hertenberger, D. Rudolph, S. Bolte, M. Döblinger, M. Bichler, D. Spirkoska, J. J. Finley, G. Abstreiter and G. Koblmüller, Appl. Phys. Lett., 2011, 98, 123114 CrossRef.
- V. Consonni, M. Hanke, M. Knelangen, L. Geelhaar, A. Trampert and H. Riechert, Phys. Rev. B: Solid State, 2011, 83, 035310 CrossRef.
- J. Jo, Y. Tchoe, G.-C. Yi and M. Kim, Sci. Rep., 2018, 8, 1694 CrossRef PubMed.
- S. H. Oh, M. F. Chisholm, Y. Kauffmann, W. D. Kaplan, W. Luo, M. Rühle and C. Scheu, Science, 2010, 330, 489–493 CrossRef CAS PubMed.
- C.-Y. Wen, J. Tersoff, K. Hillerich, M. C. Reuter, J. H. Park, S. Kodambaka, E. A. Stach and F. M. Ross, Phys. Rev. Lett., 2011, 107, 025503 CrossRef PubMed.
- D. Jacobsson, F. Panciera, J. Tersoff, M. C. Reuter, S. Lehmann, S. Hofmann, K. A. Dick and F. M. Ross, Nature, 2016, 531, 317 CrossRef CAS PubMed.
- H. Zheng, J. Wang, J. Y. Huang, J. Wang, Z. Zhang and S. X. Mao, Nano Lett., 2013, 13, 6023–6027 CrossRef CAS PubMed.
- P. Krogstrup, M. Hannibal Madsen, W. Hu, M. Kozu, Y. Nakata, J. Nygård, M. Takahasi and R. Feidenhans'l, Appl. Phys. Lett., 2012, 100, 093103 CrossRef.
- A. Biermanns, E. Dimakis, A. Davydok, T. Sasaki, L. Geelhaar, M. Takahasi and U. Pietsch, Nano Lett., 2014, 14, 6878–6883 CrossRef CAS PubMed.
- M. Takahasi, M. Kozu, T. Sasaki and W. Hu, Cryst. Growth Des., 2015, 15, 4979–4985 CrossRef CAS.
- P. Schroth, M. Köhl, J.-W. Hornung, E. Dimakis, C. Somaschini, L. Geelhaar, A. Biermanns, S. Bauer, S. Lazarev, U. Pietsch and T. Baumbach, Phys. Rev. Lett., 2015, 114, 055504 CrossRef PubMed.
- P. Schroth, J. Jakob, L. Feigl, S. M. Mostafavi Kashani, J. Vogel, J. Strempfer, T. F. Keller, U. Pietsch and T. Baumbach, Nano Lett., 2018, 18, 101–108 CrossRef CAS PubMed.
- J. Cowley, Diffraction Physics, Elsevier Science B.V., 1995 Search PubMed.
- F. Tang, G.-C. Wang and T.-M. Lu, J. Appl. Phys., 2007, 102, 014306 CrossRef.
- A. F. Akkerman and G. Y. Chernov, Phys. Status Solidi B, 1978, 89, 329–333 CrossRef CAS.
- R. Mayol and F. Salvat, At. Data Nucl. Data Tables, 1997, 65, 55–154 CrossRef CAS.
- M. Köhl, P. Schroth, A. A. Minkevich, J.-W. Hornung, E. Dimakis, C. Somaschini, L. Geelhaar, T. Aschenbrenner, S. Lazarev, D. Grigoriev, U. Pietsch and T. Baumbach, J. Synchrotron Radiat., 2015, 22, 67–75 CrossRef PubMed.
- J. Tersoff, Nano Lett., 2015, 15, 6609–6613 CrossRef CAS PubMed.
- H. Küpers, R. B. Lewis, A. Tahraoui, M. Matalla, O. Krüger, F. Bastiman, H. Riechert and L. Geelhaar, Nano Res., 2018, 11, 2885–2893 CrossRef.
Footnote |
| † Electronic supplementary information (ESI) available. See DOI: 10.1039/C9NR09621C |
| This journal is © The Royal Society of Chemistry 2020 |

