
A methodology for characterising nanoparticle size and shape using nanopores†
R.
Maugi
a,
P.
Hauer
b,
J.
Bowen
c,
E.
Ashman
d,
E.
Hunsicker
*e and
M.
Platt
 *a
*a
aDepartment of Chemistry, Loughborough University, Loughborough, Leicestershire LE11 3TU, UK. E-mail: m.platt@lboro.ac.uk
bSchool of Chemical and Physical Sciences, Victoria University of Wellington, Wellington 6140, New Zealand
cSchool of Pharmacy and Pharmaceutical Sciences, Cardiff University, Cardiff, CF10 3NB, UK
dCMD Ltd, Cardiff, CF15 7AB, UK
eDepartment of Mathematical Sciences, Centre for Imaging Science, Loughborough University, Loughborough, Leicestershire LE11 3TU, UK. E-mail: e.hunsicker@lboro.ac.uk
First published on 26th November 2019
Abstract
The discovery and characterisation of nanomaterials represents a multidisciplinary problem. Their properties and applications within biological, physical and medicinal sciences depend on their size, shape, concentration and surface charge. No single technology can currently measure all characteristics. Here we combine resistive pulse sensing with predictive logistic regression models, termed RPS-LRM, to rapidly characterise a nanomaterial's size, aspect ratio, shape and concentration when mixtures of nanorods and nanospheres are present in the same solution. We demonstrate that RPS-LRM can be applied to the characterisation of nanoparticles over a wide size range, and varying aspect ratios, and can distinguish between nanorods over nanospheres when they possess an aspect ratio grater then two. The RPS-LRM can rapidly measure the ratios of nanospheres to nanorods in solution within mixtures, regardless of their relative sizes and ratios i.e. many large nanospherical particles do not interfere with the characterisation of smaller nanorods. This was done with a 91% correct classification of nanospherical particles and 72% correct classification of nanorods even when the fraction of nanorods in solution is as low as 20%. The methodology here will enable the classification of nanomedicines, new nanomaterials and biological analytes in solution.
1. Introduction
The discovery and deployment of nanomaterials require their detailed characterisation in terms of size, shape, and charge. Rapid, onsite or in situ analysis techniques for individual particles are currently limited; state of the art shape characterisation relies on microscopy (electron, optical or scanning probe), which is costly, low throughput and provides limited information about the materials in their natural environment.1,2Over the last two decades, Resistive Pulse Sensing (RPS) has emerged as a promising technology for the analysis of individual nanoparticles. The translocation of a nanoparticle or analyte through a nanopore can be monitored by measuring ionic current.3–7 Each translocation event causes a change to the conductance of the channel known as a Resistive Pulse, Fig. 1a, which is related to the physical properties of the analyte.8,9 RPS is a highly attractive sensing platform with single particle/analyte resolution, providing information on the analyte size, concentration and charge.5,10 They perform the analysis quickly, reliably and to a high level of sensitivity.11–14 Indeed, RPS has exhibited high resolution for the monitoring of various analytes, from metal ions to whole cells15–19
 | ||
| Fig. 1 (a) Schematic of the RPS setup and signal. Nanoparticles pass through the pore and produce a current–time signal. The signal can be characterised based upon its magnitude, Δip, the width across the pulse e.g. full width half maximum (FWHM), or its shape. (bi) TEM image of carboxyl coated Iron oxide nanorods (bii) SEM image of CPC200 polystyrene particles. Scale bar is 1 μm. | ||
Recent advances in RPS methodologies have focused upon improving the analysis, fabrication and signal to noise ratio,3,20–22 and have started to advance RPS as a method to identify particle shape.23–28 In these, the dimensions of the nanopores used have been similar those of the particles studied. Although these results are promising, the requirement for pore sizes to be similar in size as the particles being analysed has drawbacks. First, requiring knowledge about expected particle sizes limits the technique for the study of unknown or complex mixtures of particles. Second, the low pore-to-particle size ratios are prone to blockages. By contrast, larger pores are less likely to block and have the added benefit of a higher flow rate of liquid through the pore, which reduces the time required to scan particles.29–31 In previous studies, we have used RPS sensors to study aggregates of nanorods and nanospheres,31,32 illustrating that the signal can be used to follow the mean behaviour of the sample under a change in solution properties. We have not, however, previously been able to attribute a specific shape to each individual nanoparticle recorded.
Here we show how high aspect ratio polyurethane (PU) nanopores can be used to identify the shape of individual nanoparticles in solution. We illustrate that the signals recorded by nanospheres and nanorods are sufficiently different to permit their classification on an individual basis. The analysis is quick, analysing hundreds of particles within seconds. Further, the differences we observe experimentally between nanorod and nanosphere pulse shape corresponds to computational models of predicted pulse shapes, opening the possibility of characterising nanoparticle shape more broadly using large pore RPS coupled to statistical methods. Calibrating the response of the nanopore method makes the process reproducible across several nanopores and days and allows us to accurately measure the ratio of nanospheres and nanorods in solution.
2. Experimental section
2.1 Materials
Three types of nanoparticles were used in this study: carboxylated polystyrene particles (200 nm in diameter, denoted CPC200, from Izon Science, Christchurch, NZ), carboxylated polystyrene particles (158 nm in diameter denoted PS150, purchased from Bangs Laboratories, Inc., Indiana, USA), nanorods purchased from CMD Ltd. Iron oxide nanorods were supplied by CMD Ltd, Cardiff, UK.2.2 Particle preparation
Carboxyl groups were added to the iron oxide nanorods using PEI and PAAMA (poly(ethylenimine) (PEI), Mw 750![[thin space (1/6-em)]](https://www.rsc.org/images/entities/char_2009.gif) 000 g mol−1, analytical standard, 50 wt%, P3143, poly(acrylic acid-co-maleic acid) (PAAMA), Mw ∼ 3000 g mol−1 50 wt%, 416053, purchased from SigmaAldrich, UK. Reagents were prepared in purified water with a resistance of 18.2 MΩ cm. Particles were taken from stock (50 μL) and suspended in PEI (1 mL, 5% in H2O). The solution was placed on the rotary wheel for 30 min. The solution was centrifuged for 5 min at 10000 rpm, and the PEI solution removed from the particles and replaced with water. The sample was vortexed and sonicated until the particles were fully dispersed. This wash step was repeated twice to ensure all excess PEI had been removed. The PEI-coated particles were suspended in PAAMA (5% in 50 mM NaCl) for 30 min and placed on the rotary wheel. The same process for removing the excess PEI was used. The particles were then stored at 2–4 °C in water. The carboxyl polystyrene particles (158 nm) from Bangs Laboratories, US and the CPC200 (200 nm) from Izon Science, NZ were used without modification. The particles were diluted using 50 mM potassium chloride solution (KCl, >99%, P/4240/60 purchased from Fisher Scientific, UK).
000 g mol−1, analytical standard, 50 wt%, P3143, poly(acrylic acid-co-maleic acid) (PAAMA), Mw ∼ 3000 g mol−1 50 wt%, 416053, purchased from SigmaAldrich, UK. Reagents were prepared in purified water with a resistance of 18.2 MΩ cm. Particles were taken from stock (50 μL) and suspended in PEI (1 mL, 5% in H2O). The solution was placed on the rotary wheel for 30 min. The solution was centrifuged for 5 min at 10000 rpm, and the PEI solution removed from the particles and replaced with water. The sample was vortexed and sonicated until the particles were fully dispersed. This wash step was repeated twice to ensure all excess PEI had been removed. The PEI-coated particles were suspended in PAAMA (5% in 50 mM NaCl) for 30 min and placed on the rotary wheel. The same process for removing the excess PEI was used. The particles were then stored at 2–4 °C in water. The carboxyl polystyrene particles (158 nm) from Bangs Laboratories, US and the CPC200 (200 nm) from Izon Science, NZ were used without modification. The particles were diluted using 50 mM potassium chloride solution (KCl, >99%, P/4240/60 purchased from Fisher Scientific, UK).
2.3 Method validation
To develop the models we used particles of comparable volume, i.e. PS150 and carboxyl coated nanorods. For the mixtures we calibrated the model with a sample of pure nanorods and (small, PS150) nanospheres. We then recorded >500 events where the solution contained mixture of nanorods to (large CPC200) nanospheres. To create the mixtures, we first diluted the nanorod and nanosphere particle solutions so that each sample had a comparable particle count rate, i.e. number of pulses per unit time. Thus when mixed in equal amounts the signal ratio of nanorods to nanospheres is equal to 1. We do not here make the assumption that the concentrations of nanorods to nanospheres is equal, just that the number of translocations from each type of particles are comparable. Mixing different volumes of these stock solutions then results in a known ratio of pulses.2.4 RPS setup
All measurements were conducted using the qNano (Izon Science, NZ) combing tunable nanopores (NP150s) with data capture and analysis software, Izon Control Suite v.3.1. The lower fluid cell contains the electrolyte (75 μL). The particle is suspended in the same electrolyte and placed in the upper fluid cell (40 μL). Prior to analysis, all samples were vortexed and sonicated for 30 s. After each sample run, the system was washed by placing 40 μL of electrolyte into the upper fluid cell several times with various pressures applied to ensure there were no residual particles remaining and therefore no cross contamination between samples. As multiple pores were required throughout the set of experiments, we ensured where possible that they had comparable pore dimensions. To do this, we used the same dimensions of pores as supplied by the manufacturer. Due to the polyurethane material and manufacturing process, some variance is expected in the size. To compensate for this, we matched the baseline current within 5% of 110 nA, as well as running control samples, blanks, and calibrations beads, to allow for comparison between data sets. In the absence of information on the exact dimensions of the PU pore, the response of the nanopore can be calibrated using a particle of known size and volume.6,29 Here we used polystyrene particles with a mean diameter of 235 nm, shown in Fig. S1.† As the RPS blockade magnitude, Δip, signal has a linear relationship with particle volume, a one-point calibration is enough.33Within the PU setup, two main modes of transport exist. The first is electrophoresis. As all particles have a carboxyl surface chemistry they travel towards the anode on the side of the membrane opposite to the sample. The second is convection, caused by fluid flow under the influence of gravity. Here the pores have a vertical orientation and the sample is placed at the top of the membrane.
2.5 Electron microscopy setup
Polystyrene nanospherical nanoparticles and iron oxide nanorods were diluted in DI-water and 5 μl of sample was dropped onto a copper plate and allowed to evaporate at room temperature.2.6 Mathematical model method
Data obtained from instrument software, including both the resistance data for the entire run and the blockade output file, were analysed in R 3.4.134 using the RStudio interface. First a method was developed to reproducibly extract each pulse. This involved extracting 1001 time points containing a detected blockade event, identifying the blockade minimum, then extracting 301 time points with the pulse minimum at point 151. This resulted in 150 data points before and after the pulse magnitude. To account for any base line drift, and variation in noise, each pulse was detrended using the first 50 and last 50 time points.
A file consisting of all extracted pulses was created from each run, as well as a file of extracted pulses normalised to depth 1. Finally, the extracted pulses and normalised extracted pulses were each approximated by quadratic b-splines with fixed knots (using the R package cobs) and the coefficients saved in two additional datasets.
Models were built in both the R base package (glm) and in the package glmnet (for lasso penalised regression). Two calibration runs were used to train the models using solutions of either nanospheres or nanorods alone. Following the calibration data two test solutions were run, again containing just nanorods or just nanospheres. This process was repeated for each nanopore, and in total 5 PU nanopores were tested and in terms of their ability to predict the shape of each nanoparticle recorded within the run using the R package pROC.
2.7 Simulation method
The Finite Element Method (FEM) was used to predict the pulse shape caused by a nanosphere and a nanorod traversing a conical pore on an on-axis trajectory. The commercial software Comsol Multiphysics 5.2 was used to solve the underlying electrostatic problem, governed by the Laplace equation Δϕ = 0. The boundary condition for the channel walls and the particle were assumed to be insulating, meaning that the component of the electric field normal to the boundary has to vanish at the surface. The pore was assumed to be of conical form with a pore length of 250 μm, a diameter of the large pore opening of 52 μm and the small opening of 666 nm. The values for the pore length and the large pore opening were extracted from SEM data, while the small pore opening was calculated from the baseline current (applied voltage 1.46 V, conductivity of the solution of 0.667 S m−1) using a model described elsewhere.35 The length and the width of the nanorod was 450 nm length and 90 nm respectively, both extracted from SEM data. The nanospheres of 158 nm was chosen so that it matches the volume of the nanorod. The simulations for both nanorod and nanosphere were repeated for a sufficient number of points along the pore axis so that the current as a function of the particle's centre position could be extracted. As the main transport mechanism for the parameters used in the experiments is hydrodynamic flow resulting from the pressure head applied and it can be assumed that the particles follow with the fluid flow, the position–current relationship can be directly be scaled into a time–current relationship.3. Results and discussion
We have developed a method for the analysis of nanoparticles that permits us to categorise individual particles by shape allowing us to determine the ratio of different shaped particles in solution. This method termed resistive pulse sensing logistic regression models RPS-LRM, links resistive-pulse data to a signal processing and shape prediction statistical algorithm to classify individual particles by shape as they pass through the pore. Two sets of experiments were carried out.3.1 Using the RPS signal to identify the particle shape
The first experiment involved two types of nanoparticles, a nanorod Fig. 1bi, and a nanosphere, Fig. 1bii. To develop the method we chose materials to have roughly equal volumes (Fig. S1†). Whilst efforts to match the exact the volume of nanorod and nanosphere were made, it should be noted that they are not equal. Its interesting to note the excellent agreement between RPS and S/TEM data (Fig. S1†). This simple observation is important as previous RPS studies into nanorod analysis have shown that tumbling rates of smaller nanorods can influence the blockade magnitude, resulting in an over estimation of nanorod size.36 Here we don't exclude the ability of the nanorods to tumble in solution, but the calculated number of rotations as they transit the sensing zone of the nanopore was calculated to be <0.5 rotation per pulse.37 Thus the orientation that they approach the pore is likely to the same one as they exit the sensing zone.A computational model was built to determine the theoretical pulse shapes for the nanospheres and the nanorods as a function of particle position within the pore. Fig. 2a shows the simulated normalised pulse shape for a nanorod and nanosphere as they translocate the nanopore. A clear difference in current-position relationship for nanorods and nanospheres is observed as the particle approaches the sensing zone, left hand side. Whilst a smaller difference is predicted as the particle exists the sensing zone, right hand side. Note that whilst we have modelled the nanorod aligned to the axis of the nanopore (see Experimental section), there is no way to predict that the nanorods have a preferred orientation as they approach the opening. For comparison, Fig. 2b shows the average measured pulse shape for >500 nanospherical and nanorod particles. Note that the difference in pulse sharpness between the predicted and observed pulses is due to the difference between horizontal axes—and number of data points. However in terms of a comparison between pulses for the two particles, the average measured pulse show a similar trend to the simulations, which suggests that it should be possible to determine which type of particle has been detected by using information about the pulse shape. To further illustrate the sensitivity of this technique nanorods of different aspect ratios were run through the setup. Fig. 2c shows the average measured pulse shape for >500 particles for varying aspect ratios. In the current setup nanorods with an aspect ratio below 2 are indistinguishable from nanospheres.
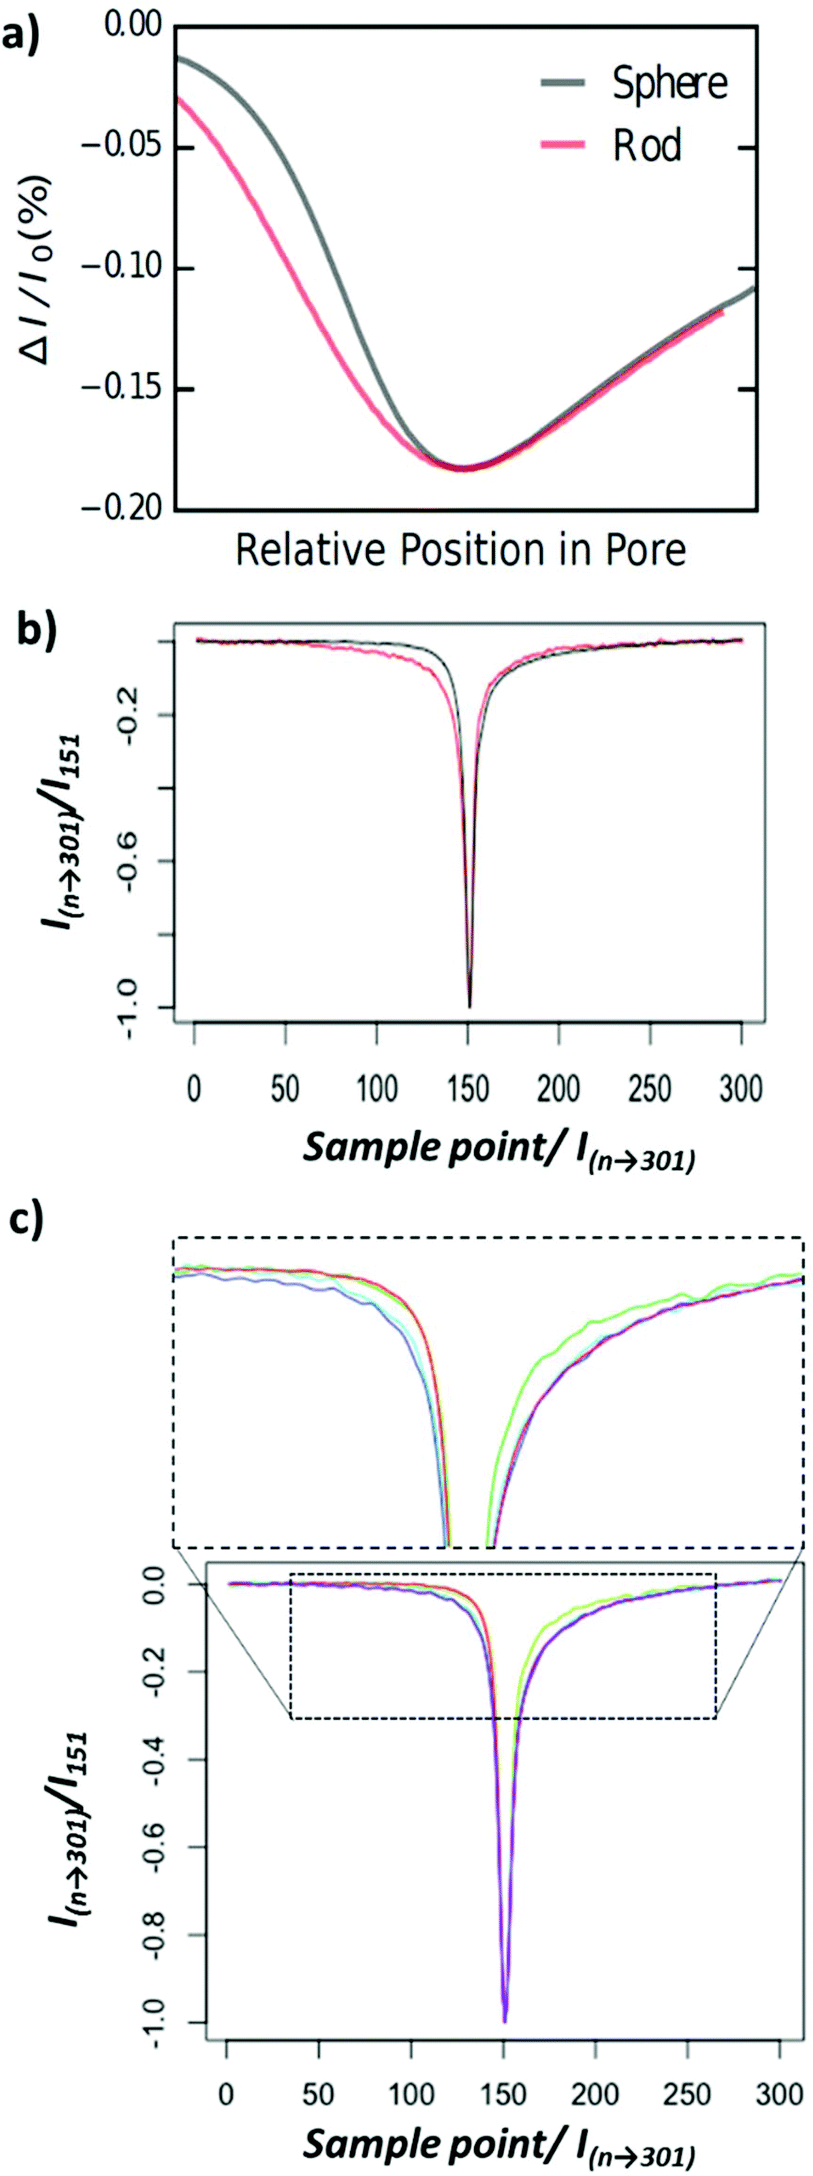 | ||
| Fig. 2 (a) Predicted normalised pulse shape for nanorod and nanosphere. (b) Average normalised resistive pulse recorded for nanospheres and nanorods. (c) Average normalised pulse recorded for NanoRods of aspect ratio 5 (blue), 2.8 (teal), 1.8 (green) and NanoSphere (red). | ||
3.2 Measuring the proportion of nanorods in a mixed solution
RPS is however a single particle analysis technique, capable of size and concentration analysis,38–43 and this also hold for nanorods (see Fig. S1 and S2†). Each nanoparticle as it traverses the pore records a signal. Thus taking an average of hundreds of pulses to enable a shape classification may be misleading. If a sample contained both nanospherical and nanorod shaped particles, then depending upon the ratio of nanorods to nanospheres the average signal may cause a misclassification or false positive for the material. Having shown that the PU pores can detect average differences between nanorods and nanospheres the next step was to apply an analysis and classification process to each pulse and particle moving through the nanopore. For each experiment two runs of each type of nanomaterial were performed. Using the analysis package described below individual pulses of 301 time points centred on the pulse minimum were then extracted from the raw data file, Fig. 3. Each pulse was then aligned and detrended. The choice of 301 time points was to balance between the desire to have a stable baseline at either end of the pulse in order to detrend and align signals, but to avoid in most cases capturing two pulses in the same time period. Whilst the particles had comparable volumes, and thus similar pulse magnitudes, in some models the pulses were then normalised to depth 1 in order to separate size information from shape information. This helped illustrate the versatility of the technique as particles of any size/volume can be shape classified in future applications. | ||
| Fig. 3 Example of raw data as recorded. Each pulse containing 301 data points is isolated. The analysis of the pulse was done by one of five models. (A) Pulse magnitude, (B) blockade width, at fractions 0.75, 0.5, 0.25 of the pulse heights. (C) Non-normalised spline fitting and (D and E) spline fitting on normalised pulse magnitudes. | ||
Shape data in the form of spline coefficients for the normalised pulses were obtained using quadratic splines with 25 fixed knots and three fixed points (24 coefficients). The spline coefficients provide a mathematical description of the shape of the denoised pulse, standard Fourier methods of denoising are not suitable as pulse lengths are on the same length scale as noise oscillations. A schematic of this is shown in Fig. 3, but it should be noted that the knots were not evenly spaced as represented, more knots were used along the areas of rapid change in current than in the mostly stable regions at the ends.
Five different types of logistic regression models were then fit to the data. Each used one pair of nanorod and nanosphere runs (the training data) and tested for particle classification on data from the remaining pair of runs (the testing data). The first model, A, used only the maximal depth of the pulse, which is has been shown to be approximately proportional to particle volume.29 The second model, B, used the vector (pulse width) of the blockade data described elsewhere.6 The third model, C, used spline coefficients for the extracted signals. This also includes the size data from model A. The fourth model, D, used spline coefficients for b-splines fit to the extracted signals after they were all normalised to have depth 1. This model only examines the shape of the resistive pulse as the size (depth) data has been removed. Models B, C and D were fit for each pore using lasso penalised regression (glmnet package in R). This means that the variables selected (i.e., with non-zero coefficients) for these models were different for different pores. The final model, E, used a fixed set of spline coefficients from the normalised signal data based on the results of the multiple t-tests (coefficients 9, 10, 16, 17, 18 and 19), and fit the model using standard logistic regression. The signal processing and modelling methods are illustrated in Fig. 3.
The performance of the models was compared using the maximum of sensitivity + specificity along the ROC curve on the testing data for each model. Here sensitivity is the percent of correctly classified nanospheres and specificity is the percent of correctly classified nanorods, and thus a perfect score would be 200. For each set of data (two runs of each particle type), there were four choices (two choices of nanosphere run and two of nanorod run) of training and testing data. We refer to the models built and tested in these four different ways as replicates. The model scores for these four replicates across 5 nanopores are recorded in Table 1. Important to note that for all models, each pore had to be calibrated before it could characterise particle shape, i.e. a sample of pure nanorods or nanospheres were passed through each pore first. It should also be noted that the calibration on one pore would not predict particle shape on another, data not shown. We attribute this to differences in pore structure and reproducibility of the manufacturing process, as well as its stability over the course of the experiment (Fig. S3†).44
| Model A | Model B | Model C | Model D | Model E | |
|---|---|---|---|---|---|
| Pore 1 | |||||
| Replicate 1 | 162 | 108 | 168 | 135 | 161 |
| Replicate 2 | 167 | 112 | 174 | 151 | 162 |
| Replicate 3 | 140 | 106 | 144 | 120 | 149 |
| Replicate 4 | 139 | 104 | 141 | 115 | 152 |
| Pore 2 | |||||
| Replicate 1 | 148 | 121 | 145 | 119 | 150 |
| Replicate 2 | 140 | 119 | 137 | 118 | 147 |
| Replicate 3 | 148 | 116 | 149 | 127 | 144 |
| Replicate 4 | 137 | 127 | 143 | 124 | 137 |
| Pore 3 | |||||
| Replicate 1 | 163 | 164 | 159 | 142 | 135 |
| Replicate 2 | 159 | 142 | 155 | 121 | 114 |
| Replicate 3 | 160 | 158 | 161 | 137 | 127 |
| Replicate 4 | 161 | 162 | 153 | 148 | 143 |
| Pore 4 | |||||
| Replicate 1 | 128 | 136 | 167 | 163 | 162 |
| Replicate 2 | 117 | 146 | 155 | 148 | 153 |
| Replicate 3 | 142 | 156 | 156 | 142 | 136 |
| Replicate 4 | 149 | 135 | 145 | 128 | 131 |
| Pore 5 | |||||
| Replicate 1 | 122 | 131 | 134 | 135 | 133 |
| Replicate 2 | 129 | 108 | 125 | 123 | 124 |
| Replicate 3 | 129 | 129 | 136 | 134 | 136 |
| Replicate 4 | 135 | 107 | 127 | 123 | 121 |
| Mean pores 1–5 | 144 | 129 | 149 | 133 | 141 |
| Standard deviation | 15 | 20 | 13 | 13 | 14 |
For model A (depth data only), the overall mean score was 144 ± 15 with a standard deviation of 15, with approximately 74% of nanospherical particles identified as nanospheres, and 70% of nanorod particles identified as nanorods. As mentioned above, particle volume is approximately proportional to pulse magnitude, so particles of different sizes can be easy identified. However (see Fig. 1S†), whilst the nanospherical particles are on average bigger, there is considerable overlap between the sizes, which we see reflected in scores less than 200.
Model B had an average score of 129 ± 20. Interestingly, this performed worse on average than the model using only depth, indicating that pulse width data is not an effective way to capture shape data, and that the extra width data can in fact lead to model overfitting rather than improved predictive performance. This is also indicated by the high standard deviation, which shows that instrument collected width data is not a reliable measure of shape.
The average score of Model C at the optimal classification point was 149 ± 13. Thus we see that on average the inclusion of the pulse shape yields a somewhat better classification model for nanomaterial shape then depth alone, and also with a marginally lower standard deviation, indicating a somewhat more reliable method of model building. Model C also has the powerful advantage that it removes the need for any pre-knowledge of the particle size for the materials analysis.
Model D had an average score of 133 ± 13. Whilst this score is lower than for models A and C (both of which contain depth data), the reproducibility, as measured by standard deviation, is the same as that for the full spline model, and better than for the model of depth only or the model with depth plus width.
To ascertain which parts of the spline model were key in identifying the particle shape, we performed multiple t-tests with a Bonferroni correction on each spline coefficient over all pairs of nanorod and nanosphere data taken for each pore (4 pairs per pore). Fig. 4 visualises the key spline segments i.e. the parts of the curve whose shape shows a significant difference between nanospheres and nanorods. For all pores, the fall in current, i.e. as the particle enters the pore, has splines that show significant features for particle shape (green segments). This corresponds to the theoretical pulse shapes shown in Fig. 2. In some cases, pores 2, 3 and 4, the second part of the pulse i.e. the part that is recorded as it traverses the pore also shows a significant ability to measure particle shape. This most likely reflects the variation in pore-to-pore structure and lack of reproducibility of the manufacturing process. It also suggests that pores of different shapes may have overall better ability than conical pores to distinguish particle shape.
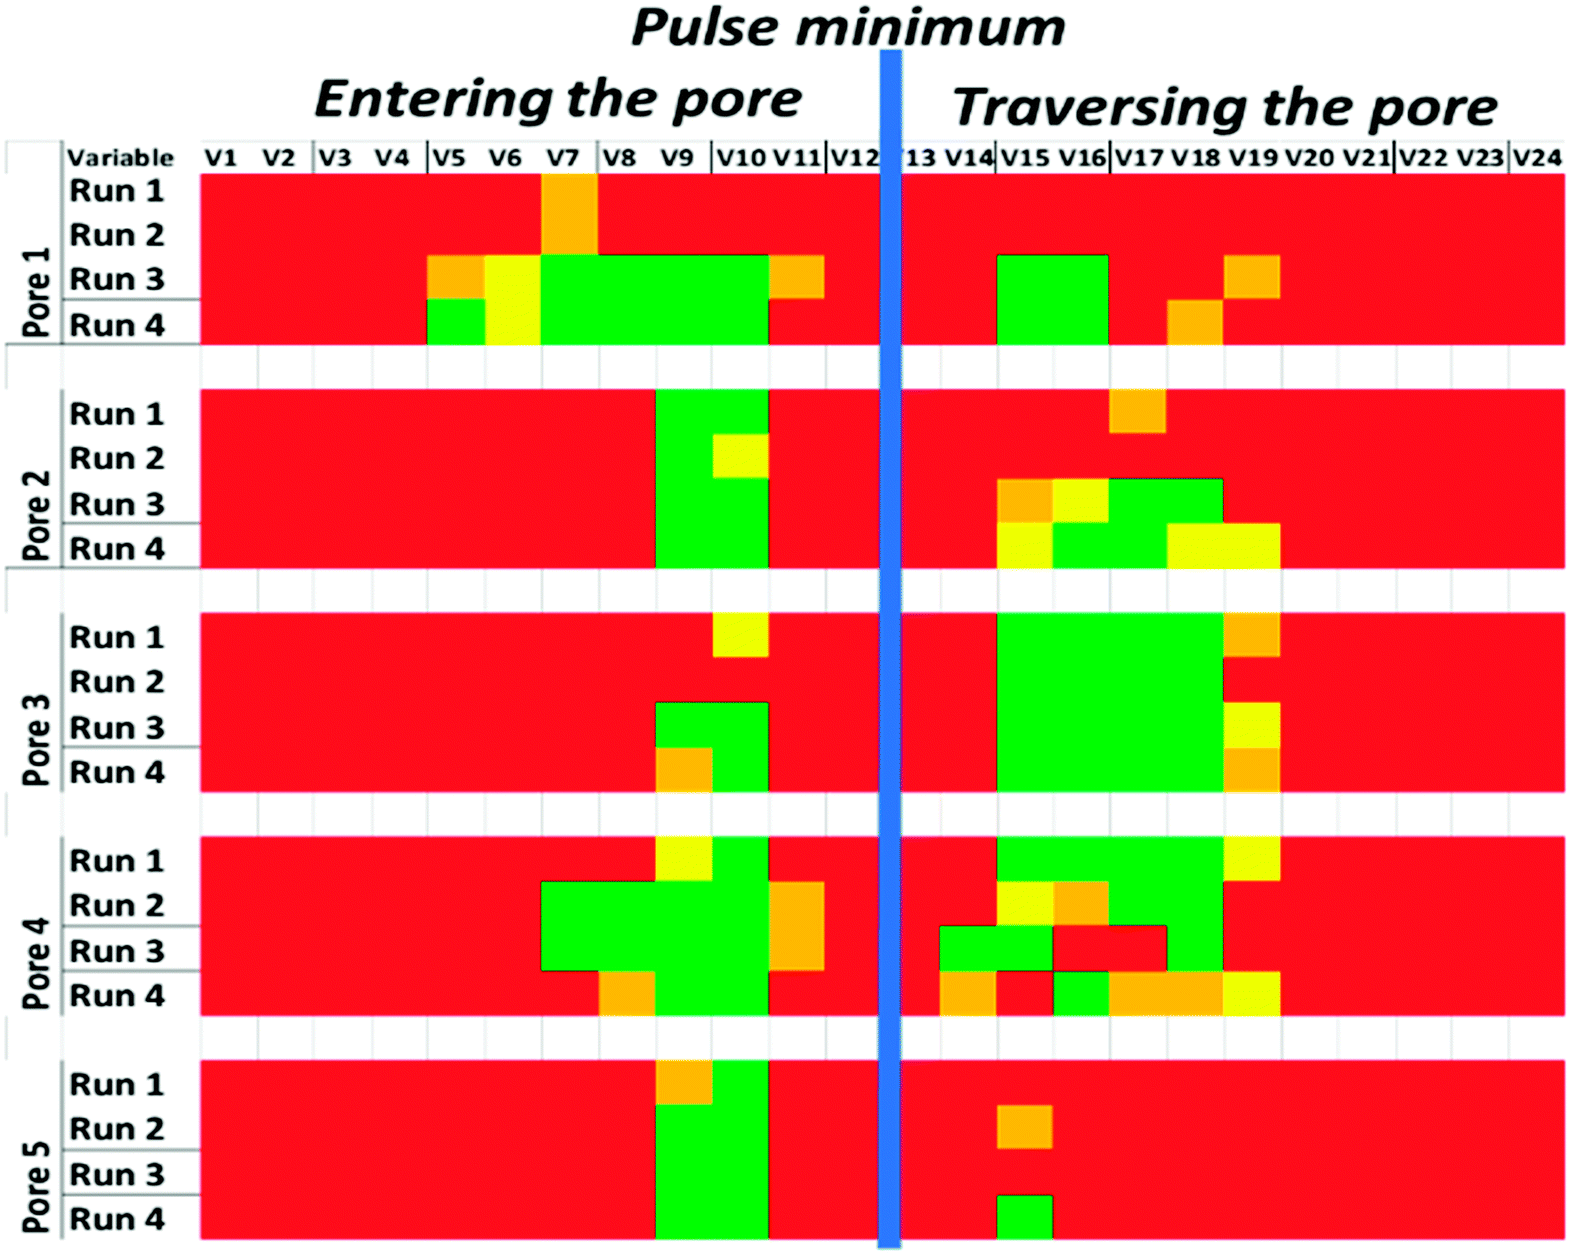 | ||
| Fig. 4 Visualisation of the key spline segments that identify particle shape as determined by multiple t-tests with a Bonferroni correction, red – p > 0.5, orange – p < 0.05, yellow – p < 0.005 green – p < 0.0005. | ||
For a model that used shape only data, the best performance was for the model with fixed normalised spline coefficients, model E, which had an average score of 141 ± 14, corresponding to about 75% sensitivity (correct nanosphere classification) and 66% specificity (correct nanorod classification). In general, specificity was below sensitivity at the maximum of the sum in all cases, which we attribute to the effect of variation in nanorod orientation creating a wider range of possible pulse shapes, which are thus more difficult than nanospheres to characterise with a dichotomous model.
Whilst the identification of particle shape for a pure sample is powerful, a final demonstration of the power of the RPS-LRM was to mix different ratios of nanospheres and nanorods together and ask the model to predict the ratio. For this test we used Model D, tested on mixtures of large nanospherical particles 235 nm in diameter and nanorods shown in Fig. 1. Model D was used here instead of model E, to illustrate that with no knowledge of the key splines vectors any user can download the R code here and apply it to their RPS experiments. Particles of different sizes were chosen for this experiment for two reasons. First, this allowed us to use size to determine if each given pulse corresponded to a nanorod or a nanosphere, thus giving us access to ground truth about particle shape. Recall that model D uses only shape data from depth normalised pulses, thus we can compare the performance of this model for shape detection of particles in solution with the ground truth as given by size. Thus our predicted ratio of particles using size and the Model D classification ratio should be comparable. A second reason was to demonstrate that a model fit using nanospheres of one size could be used to determine the shape of nanospheres of a different size, thus further demonstrating that shape can be studied independent of size.
These samples were analysed and the results shown in Fig. 5a. Model D gave a linear response, that is, as the ratio of nanorods increased the model identified an increase, with an impressive linear relationship (R squared value of 0.9264). The gradient here is greater than 1, due the imperfect specificity and sensitivity reported earlier. It is important to note that the presence of both particles in solution does not affect the model's ability to predict particle shape. This data can also be used to estimate the optimal sensitivity and specificity possible with this current experimental setup when the run conditions for all particles in the testing and training sets are identical. Using model D we get a model with sensitivity of 72% and specificity of 91%. I.e., 91% of nanospherical (large) particles are identified by just their shape data as nanospheres, and 72% of nanorod (small) particles are identified by just their shape data as nanorods (blue curve in Fig. 5c).
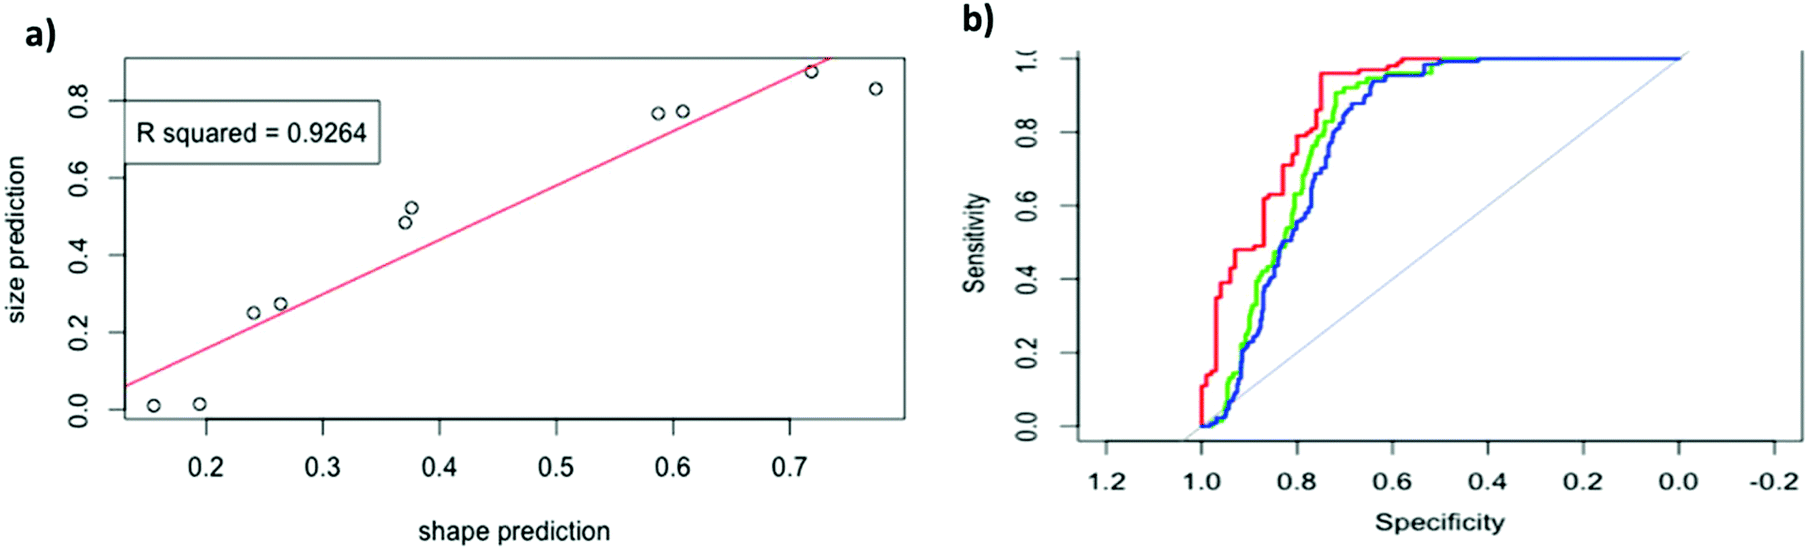 | ||
| Fig. 5 (a) Plot of predicted ratio of nanorods to nanospheres versus known ratio, using model D (b) ROC curves for a model trained on a subset of the normalised spline data from large vs. small particles in a single run. Red is the performance on the training data from that first run. Green is the performance on the testing data from that run. Blue is the performance on a repeat data set. | ||
4. Conclusion
To conclude, we present here a high throughput method of determining the size and shape of nanoparticle solution using commercially available nanopores. Using logistic regression models built on spline coefficients for pulses, we can classify each resistive pulse to a particular shape i.e. nanorod or nanosphere in both pure and mixed solutions. This was done with in approximately 91% correct classification of nanospherical particles and 72% correct classification of nanorods. Further, the shape of pulses observed corresponds with the shapes anticipated from a computational model. Whilst the experimental nor modelling methods were completely optimised the technique could be improved through more consistent pore manufacturing and experimentation with different pore materials and shapes. Its also important to note that every pulse and data point found by the model was included, see Fig. S4.† By peak picking, and removing the poor quality signals the accuracy can be increased, but to illustrate the ease, simplicity and pore of RPS/LMS we have included all the raw data.We expect that future variations of this work will push the RPS-LRM method further towards a rudimentary individual particle imaging system.
Conflicts of interest
The authors declare to competing interests.References
- S. Mourdikoudis, R. M. Pallares and N. T. K. Thanh, Characterization Techniques for Nanoparticles: Comparison and Complementarity upon Studying Nanoparticle Properties, Nanoscale, 2018, 10(27), 12871–12934 RSC.
- C. N. R. Rao and K. Biswas, Characterization of Nanomaterials by Physical Methods, Annu. Rev. Anal. Chem., 2009, 2(1), 435–462 CrossRef CAS PubMed.
- P. Hinkle, T. M. Westerhof, Y. Qiu, D. J. Mallin, M. L. Wallace, E. L. Nelson, P. Taborek and Z. S. Siwy, A Hybrid Resistive Pulse-Optical Detection Platform for Microfluidic Experiments, Sci. Rep., 2017, 7(1), 10173 CrossRef PubMed.
- J. Menestrina, C. Yang, M. Schiel, I. Vlassiouk and Z. S. Siwy, Charged Particles Modulate Local Ionic Concentrations and Cause Formation of Positive Peaks in Resistive-Pulse-Based Detection, J. Phys. Chem. C, 2014, 118(5), 2391–2398 CrossRef CAS.
- E. L. C. J. Blundell, L. J. Mayne, E. R. Billinge and M. Platt, Emergence of Tunable Resistive Pulse Sensing as a Biosensor, Anal. Methods, 2015, 7, 7055–7066 RSC.
- E. L. C. J. Blundell, R. Vogel and M. Platt, Particle-by-Particle Charge Analysis of DNA-Modified Nanoparticles Using Tunable Resistive Pulse Sensing, Langmuir, 2016, 32(4), 1082–1090 CrossRef CAS PubMed.
- H. Bayley and C. R. Martin, Resistive-Pulse Sensing - from Microbes to Molecules, Chem. Rev., 2000, 100(7), 2575–2594 CrossRef CAS PubMed.
- T. Ito, L. Sun, R. R. Henriquez and R. M. Crooks, A Carbon Nanotube-Based Coulter Nanoparticle Counter, Acc. Chem. Res., 2004, 37(12), 937–945 CrossRef CAS PubMed.
- Y. Qiu, C. Yang, P. Hinkle, I. V. Vlassiouk and Z. S. Siwy, Anomalous Mobility of Highly Charged Particles in Pores, Anal. Chem., 2015, 87(16), 8517–8523 CrossRef CAS PubMed.
- E. Weatherall and G. R. Willmott, Applications of Tunable Resistive Pulse Sensing, Analyst, 2015, 140(10), 3318–3334 RSC.
- G. S. Roberts, S. Yu, Q. Zeng, L. C. L. Chan, W. Anderson, A. H. Colby, M. W. Grinstaff, S. Reid and R. Vogel, Tunable Pores for Measuring Concentrations of Synthetic and Biological Nanoparticle Dispersions, Biosens. Bioelectron., 2012, 31(1), 17–25 CrossRef CAS PubMed.
- L. Luo, S. R. German, W.-J. Lan, D. a. Holden, T. L. Mega and H. S. White, Resistive-Pulse Analysis of Nanoparticles, Annu. Rev. Anal. Chem., 2014, 7(1), 513–535 CrossRef CAS PubMed.
- M. Ali, P. Ramirez, M. N. Tahir, S. Mafe, Z. Siwy, R. Neumann, W. Tremel and W. Ensinger, Biomolecular Conjugation inside Synthetic Polymer Nanopores Viaglycoprotein-Lectin Interactions, Nanoscale, 2011, 3(4), 1894–1903 RSC.
- S. F. Buchsbaum, G. Nguyen, S. Howorka and Z. S. Siwy, DNA-Modified Polymer Pores Allow pH- and Voltage-Gated Control of Channel Flux, J. Am. Chem. Soc., 2014, 136(28), 9902–9905 CrossRef CAS PubMed.
- H. Bayley and P. S. Cremer, Stochastic Sensors Inspired by Biology, Nature, 2001, 413(6852), 226–230 CrossRef CAS PubMed.
- L. T. Sexton, L. P. Horne and C. R. Martin, Developing Synthetic Conical Nanopores for Biosensing Applications, Mol. Biosyst., 2007, 3(10), 667–685 RSC.
- A. C. S. Yu, J. F. C. Loo, S. Yu, S. K. Kong and T. F. Chan, Monitoring Bacterial Growth Using Tunable Resistive Pulse Sensing with a Pore-Based Technique, Appl. Microbiol. Biotechnol., 2014, 98(2), 855–862 CrossRef CAS PubMed.
- I. Heaton and M. Platt, Peptide Nanocarriers for Detection of Heavy Metal Ions Using Resistive Pulse Sensing, Anal. Chem., 2019, 91(17), 11291–11296 CrossRef CAS PubMed.
- L. Mayne, C.-Y. Lin, S. D. R. Christie, Z. S. Siwy and M. Platt, The Design and Characterization of Multifunctional Aptamer Nanopore Sensors, ACS Nano, 2018, 12(5), 4844–4852 CrossRef CAS PubMed.
- R. Peng and D. Li, Particle Detection on Microfluidic Chips by Differential Resistive Pulse Sensing (RPS) Method, Talanta, 2018, 184, 418–428 CrossRef CAS PubMed.
- H. Yasaki, T. Yasui, T. Yanagida, N. Kaji, M. Kanai, K. Nagashima, T. Kawai and Y. Baba, Substantial Expansion of Detectable Size Range in Ionic Current Sensing through Pores by Using a Microfluidic Bridge Circuit, J. Am. Chem. Soc., 2017, 139(40), 14137–14142 CrossRef CAS PubMed.
- S. M. Hampson, M. Pollard, P. Hauer, H. Salway, S. D. R. Christie and M. Platt, Additively Manufactured Flow-Resistive Pulse Sensors, Anal. Chem., 2019, 91(4), 2947–2954 CrossRef CAS PubMed.
- Y. Qiu, P. Hinkle, C. Yang, H. E. Bakker, M. Schiel, H. Wang, D. Melnikov, M. Gracheva, M. E. Toimil-Molares and A. Imhof, et al. Pores with Longitudinal Irregularities Distinguish Objects by Shape, ACS Nano, 2015, 9(4), 4390–4397 CrossRef CAS PubMed.
- M. Tsutsui, T. Yoshida, K. Yokota, H. Yasaki, T. Yasui, A. Arima, W. Tonomura, K. Nagashima, T. Yanagida and N. Kaji, et al. Discriminating Single-Bacterial Shape Using Low-Aspect-Ratio Pores, Sci. Rep., 2017, 7(1), 17371 CrossRef PubMed.
- Y. Zhang, M. A. Edwards, S. R. German and H. S. White, Multipass Resistive-Pulse Observations of the Rotational Tumbling of Individual Nanorods, J. Phys. Chem. C, 2016, 120(37), 20781–20788 CrossRef CAS.
- K. E. Venta, M. B. Zanjani, X. Ye, G. Danda, C. B. Murray, J. R. Lukes and M. Drndić, Gold Nanorod Translocations and Charge Measurement through Solid-State Nanopores, Nano Lett., 2014, 14(9), 5358–5364 CrossRef CAS PubMed.
- S. Y. Park, H. Handa and A. Sandhu, Magneto-Optical Biosensing Platform Based on Light Scattering from Self-Assembled Chains of Functionalized Rotating Magnetic Beads, Nano Lett., 2009, 10(2), 446–451 CrossRef PubMed.
- S. W. Joo and S. Qian, Electrophoretic Motion of a Nanorod along the Axis of a Nanopore under a Salt Gradient, J. Colloid Interface Sci., 2011, 356(1), 331–340 CrossRef CAS PubMed.
- R. Vogel, G. Willmott, D. Kozak, G. S. Roberts, W. Anderson, L. Groenewegen, B. Glossop, A. Barnett, A. Turner and M. Trau, Quantitative Sizing of Nano/Microparticles with a Tunable Elastomeric Pore Sensor, Anal. Chem., 2011, 83(9), 3499–3506 CrossRef CAS PubMed.
- G. R. Willmott, R. Vogel, S. S. C. Yu, L. G. Groenewegen, G. S. Roberts, D. Kozak, W. Anderson and M. Trau, Use of Tunable Nanopore Blockade Rates to Investigate Colloidal Dispersions, J. Phys.: Condens. Matter, 2010, 22(45), 454116 CrossRef CAS PubMed.
- G. R. Willmott, M. Platt and G. U. Lee, Resistive Pulse Sensing of Magnetic Beads and Supraparticle Structures Using Tunable Pores, Biomicrofluidics, 2012, 6(1), 14103–1410315 CrossRef PubMed.
- M. Platt, G. R. Willmott and G. U. Lee, Resistive Pulse Sensing of Analyte-Induced Multicomponent Rod Aggregation Using Tunable Pores, Small, 2012, 8(15), 2436–2444 CrossRef CAS PubMed.
- E. R. Billinge and M. Platt, Multiplexed, Label-Free Detection of Biomarkers Using Aptamers and Tunable Resistive Pulse Sensing (AptaTRPS), Biosens. Bioelectron., 2015, 68, 741–748 CrossRef CAS PubMed.
- R Core Team, R: A Language and Environment for Statistical Computing, R Foundation for Statistical Computing, Vienna, Austria, 2013 Search PubMed.
- G. R. Willmott and P. W. Moore, Reversible Mechanical Actuation of Elastomeric Nanopores, Nanotechnology, 2008, 19(47), 475504 CrossRef CAS PubMed.
- Y. Qiu, P. Hinkle, C. Yang, H. E. Bakker, M. Schiel, H. Wang, D. Melnikov, M. Gracheva, M. E. Toimil-Molares and A. Imhof, et al. Pores with Longitudinal Irregularities Distinguish Objects by Shape, ACS Nano, 2015, 9(4), 4390–4397 CrossRef CAS PubMed.
- Y. Zhang, M. A. Edwards, S. R. German and H. S. White, Multipass Resistive-Pulse Observations of the Rotational Tumbling of Individual Nanorods, J. Phys. Chem. C, 2016, 120(37), 20781–20788 CrossRef CAS.
- E. R. Billinge, M. Broom and M. Platt, Monitoring Aptamer-Protein Interactions Using Tunable Resistive Pulse Sensing, Anal. Chem., 2014, 86(2), 1030–1037 CrossRef CAS PubMed.
- E. L. C. J. Blundell, M. J. Healey, E. Holton, M. Sivakumaran, S. Manstana and M. Platt, Characterisation of the Protein Corona Using Tunable Resistive Pulse Sensing: Determining the Change and Distribution of a Particle's Surface Charge, Anal. Bioanal. Chem., 2016, 408(21), 5757–5768 CrossRef CAS PubMed.
- S. R. Hanney, S. Castle-Clarke, J. Grant, S. Guthrie, C. Henshall, J. Mestre-Ferrandiz, M. Pistollato, A. Pollitt, J. Sussex and S. Wooding, How Long Does Biomedical Research Take? Studying the Time Taken between Biomedical and Health Research and Its Translation into Products, Policy, and Practice, Heal. Res. Policy Syst., 2015, 13(1), 1 CrossRef PubMed.
- M. J. Healey, W. Rowe, S. Siati, M. Sivakumaran and M. Platt, Rapid Assessment of Site Specific DNA Methylation through Resistive Pulse Sensing, ACS Sens., 2018, 3(3), 655–660 CrossRef CAS PubMed.
- L. J. Mayne, S. D. R. Christie and M. Platt, A Tunable Nanopore Sensor for the Detection of Metal Ions Using Translocation Velocity and Biphasic Pulses, Nanoscale, 2016, 8, 19139–19147 RSC.
- E. L. C. J. Blundell, L. J. Mayne, E. R. Billinge and M. Platt, Emergence of Tunable Resistive Pulse Sensing as a Biosensor, Anal. Methods, 2015, 7(17), 7055–7066 RSC.
- D. Kozak, W. Anderson, M. Grevett and M. Trau, Modeling Elastic Pore Sensors for Quantitative Single Particle Sizing, J. Phys. Chem. C, 2012, 116(15), 8554–8561 CrossRef CAS PubMed.
Footnote |
| † Electronic supplementary information (ESI) available. See DOI: 10.1039/c9nr09100a |
| This journal is © The Royal Society of Chemistry 2020 |