
 Open Access Article
 This Open Access Article is licensed under a Creative Commons Attribution-Non Commercial 3.0 Unported Licence
Amphiphilic anthanthrene trimers that exfoliate graphite and individualize single wall carbon nanotubes†
Peter W.
Münich‡
a,
Matthias
Pfäffli‡
b,
Michel
Volland‡
a,
Shi-Xia
Liu
 *b,
Robert
Häner
*b and
Dirk M.
Guldi
*a
*b,
Robert
Häner
*b and
Dirk M.
Guldi
*a
aDepartment of Chemistry and Pharmacy and Interdisciplinary Center for Molecular Materials, Friedrich-Alexander-Universität Erlangen-Nürnberg, Egerlandstr. 3, 91058 Erlangen, Germany. E-mail: dirk.guldi@fau.de
bDepartment of Chemistry and Biochemistry, University of Bern, Freiestrasse 3, CH-3012 Bern, Switzerland. E-mail: liu@dcb.unibe.ch; robert.haener@dcb.unibe.ch
First published on 5th December 2019
Abstract
A phosphodiester-linked dialkynyl substituted anthanthrene trimer (1) has been designed and synthesized. Its graphene ribbon like structure is expected to facilitate interactions with nanographene (NG) and single wall carbon nanotubes (SWCNT) to yield novel and stable carbon-based nanomaterials. Interactions with trimer 1 lead to exfoliation of NG and to the individualization of SWCNTs. Phosphate groups, in general, and their negative charges, in particular, render the resulting nanomaterials soluble in ethanol, which is ecologically favourable over DMF required for the processing of pristine NG or SWCNTs. The newly formed nanomaterials were probed by complementary spectroscopic and microscopic techniques. Of particular importance were transient absorption and fluorescence excitation measurements, which revealed an efficient energy transfer within the carbon-based nanomaterials.
Introduction
Both nanographene (NG) and single wall carbon nanotubes (SWCNT) are emerging nanomaterials in applications such as molecular electronics, catalysis, solar cells, or as probes for optical imaging of biomolecules.1–5 Despite rapid progress in the chemical functionalization of NGs and SWCNTs, preserving the spectroscopic and transport characteristics of the pristine materials in nanostructured devices with advanced functions, still remains one of the greatest challenges in the field. For example, NG and SWCNT functionalization has been realized by means of forming covalent bonds or employing non-covalent interactions with planar, π-conjugated chromophores and polymers.2,6–9 As expected, the transformation of sp2 to sp3 hybridized carbons, which typically results from the covalent modification, affects the electronic structures of NG and SWCNTs and leads to a partial/complete loss of their intrinsic properties. In light of the aforementioned, self-assembled nanocarbon materials are becoming the centre of attention in terms of increased processability and dispersability. They are, for example, formed by interactions with a variety of organic chromophores, which feature strong affinities towards NG and/or SWCNTs. Notable is also the fact that the physico-chemical properties of NG and SWCNTs are susceptible to π–π, hydrophobic, and charge transfer interactions with the organic chromophores eventually leading to functional materials with advanced electronic properties.2,7,10–13In this context, graphene-like molecules, such as pyrene, perylene and porphyrins stand out due to their high extinction coefficients in the visible range of the electromagnetic spectrum.14–19 Another example, anthanthrene (Fig. 1), has an intrinsic structural rigidity with extended π-conjugation, which promotes intermolecular aggregations and reduces reorganization energy.20,21 These features are beneficial for self-assembly processes and tunable optical properties, which are of high interest in material science. Starting from the commercially available 4,10-dibromoanthanthrone, a large range of different functional groups can be readily introduced, both at the 4,10-positions via well-established C–C cross-coupling reactions and at the 6,12-positions via nucleophilic substitution. Consequently, tailor-made anthanthrene derivatives with diverse substitution patterns and different electronic and optical properties for potential applications in organic field-effect transistors and organic solar cells have been reported.20–29 Thus so far, however, their importance in the exfoliation of graphite and individualization of SWCNTs has not been investigated.
 | ||
| Fig. 1 Structure of target molecule 1. | ||
In the present work, we report on the synthesis and the properties of a phosphodiester-linked, dialkynyl-substituted anthanthrene trimer (1, Fig. 1). 1 facilitiates, on one hand, the exfoliation of graphite and, on the other hand, the individualization of SWCNTs in polar solvents. A detailed description of the interactions between 1 and individualized SWCNTs or exfoliated NG in the ground and excited states obtained by comprehensive spectroscopic and analytical techniques is reported.
Results and discussion
As illustrated in Scheme 1, synthesis of 1 was accomplished quantitatively by deprotection of the key precursor 5 under basic conditions with methanolic ammonia. Inspired by the solid-phase phosphoramidite chemistry, which has been widely employed in the synthesis of DNA sequences30 or other oligomers,31–375 was readily prepared in a 30% yield via a dual coupling reaction of bis-phosphoramidite 3 and the mono-acetylated derivative 4 using 5-(ethylthio)-1H-tetrazole as activator and tert-butyl hydroperoxide as oxidant. Both 3 and 4 were obtained from the corresponding anthanthrene-diol 2, which was formed through the Sonogashira cross-coupling reaction of 3-butyn-1-ol and 4,10-dibromo-6,12-bis(octyloxy)anthanthrene in 71% yield. The former was obtained via phosphitylation in 73% yield, the latter via treatment with one equivalent of acetic anhydride in 38% yield. The mono-acetylated intermediate 4 was used to prevent undesired polymerization during the subsequent solution-phase coupling with 3. All new compounds were characterized by NMR and MS analysis. | ||
| Scheme 1 Synthesis of target molecule 1. | ||
Characterization of 1
Turning to steady state spectroscopy (Fig. 2), the absorption spectrum of 1 in dimethylformamide (DMF) resembles that of monomeric anthanthrene substituted at the 4,10- and 6,12-positions.38,39 In terms of absorption, the most prominent maxima of 1 are found at 315, 328, 439, and 465 nm. The fluorescence is, however, more complex, as it comprises features of non-aggregated 1 with fluorescence maxima at 470 and 496 nm, and a broad, excimer-like fluorescence that maximizes at around 600 nm. To gain insights into the origin of the fluorescence, excitation spectra were recorded (Fig. S1†). On one hand, excitation of the non-aggregated fluorescence leads to an excitation spectrum that is characteristic for absorption of non-aggregated 1. On the other hand, excitation of the excimer-like fluorescence results in a spectrum that is similar to that of the non-aggregated species, but with differing relative intensities and broadening of the maxima. For example, the intensities of the 328 and 465 nm maxima are lower than those at 315 and 439 nm. At this point we conclude the presence of excimer-like species. In the current context, namely a covalent trimer of anthanthrene, formation of intramolecular aggregates is very likely.40 Considering, however, that an excimer implies dimers and that formation of excited trimers etc. cannot be ruled out, we prefer to refer to excimer-like species rather than excimers.41 Consequently, non-aggregated as well as aggregated 1 coexist in solution. Dissolving 1 in ethanol (Fig. 2 and Fig. S2†) leads to similar conclusions with the exception that significantly larger amounts of aggregated 1 are present when compared to DMF. In ethanol, the absorption maxima are 314, 326, 437, and 463 nm, while fluorescence maxima appear at 345 and 488 nm for non-aggregated and around 600 nm for excimer-like 1. | ||
| Fig. 2 Absorption spectra (a) and fluorescence spectra (b) of 1 recorded in DMF (blue) and ethanol (red); 440 nm was used to photoexcite 1. | ||
The lifetimes of the two emissive states were determined using time correlated single photon counting (TCSPC) following photoexcitation at 440 nm. As a matter of fact, the emission stemming from non-aggregated 1 was analyzed in the region of around 480 nm, while that of excimer-like species at around 580 nm (Fig. S3†). In DMF, the lifetimes of non-aggregated 1 were found to be 1.0 and 4.2 ns, whereas in ethanol the lifetimes are 2.7 and 5.0 ns. Examining the region characteristic for excimer-like species, lifetimes of 1.9, 9.8, and 39 ns and of 1.1, 12, and 46 ns were found in the cases of DMF and ethanol, respectively. In summary, the lifetimes of 4.2 or 5.0 ns relate to the fluorescent decay of non-aggregated 1, while the shorter lifetimes of 1.0 and 2.7 ns to the decay in 1 aggregates. Regarding the excimer-like emission, only the longer lifetimes are attributed to an emissive decay of excimer-like species.
To round up the characterization of 1, transient absorption spectroscopy (fs-TAS and ns-TAS) measurements were conducted. To evaluate the data, global analysis with a five component kinetic model was used. The resulting raw data as well as the deconvoluted evolution associated spectra (EAS) and their concentration time profiles are shown in Fig. S4† and Fig. 3. The longest-lived component used to fit the HELIOS data comes from EOS measurements. It was fixed during global analysis of the HELIOS data, since it exceeds the time of the measurement. The differential absorption spectra in DMF (Fig. S4†) reveal ground state bleaching at 443 nm, maxima at 556 and 600 nm as well as shoulders at 640 to 840 nm. A weak and very broad maximum was also seen in the near infrared, namely at 1055 nm. The resulting lifetimes are 3.9 and 79 ps as well as 1.4, 6.4, and 22 ns. The short-lived component of 3.9 ps is attributed to solvent rearrangement, while that of 79 ps correlates with internal relaxation processes. EASs of the longer-lived components, that is, 1.4, 6.4, and 22 ns, feature a similar peak pattern with maxima at 556 and 600 nm. The only notable difference is their relative amplitudes. Remarkable is the fact that the lifetimes fit nicely to those determined by means of TCSPC. As such, the short- and intermediate-lived components of 1.4 and 6.4 ns stem from the decay of aggregated and non-aggregated 1, respectively, while the longest-lived component of 22 ns relates to the decay of excimer-like species. For 1 in ethanol (Fig. 3) a similar picture evolved. Here, ground state bleaching is seen at 442 nm, while maxima at 596 and 1055 nm and shoulders at 460, 556, and 840 nm are additional characteristics. The corresponding lifetimes are 4.2 and 80 ps as well as 1.2, 5.4, and 19 ns and their assignment is in line with that in DMF.
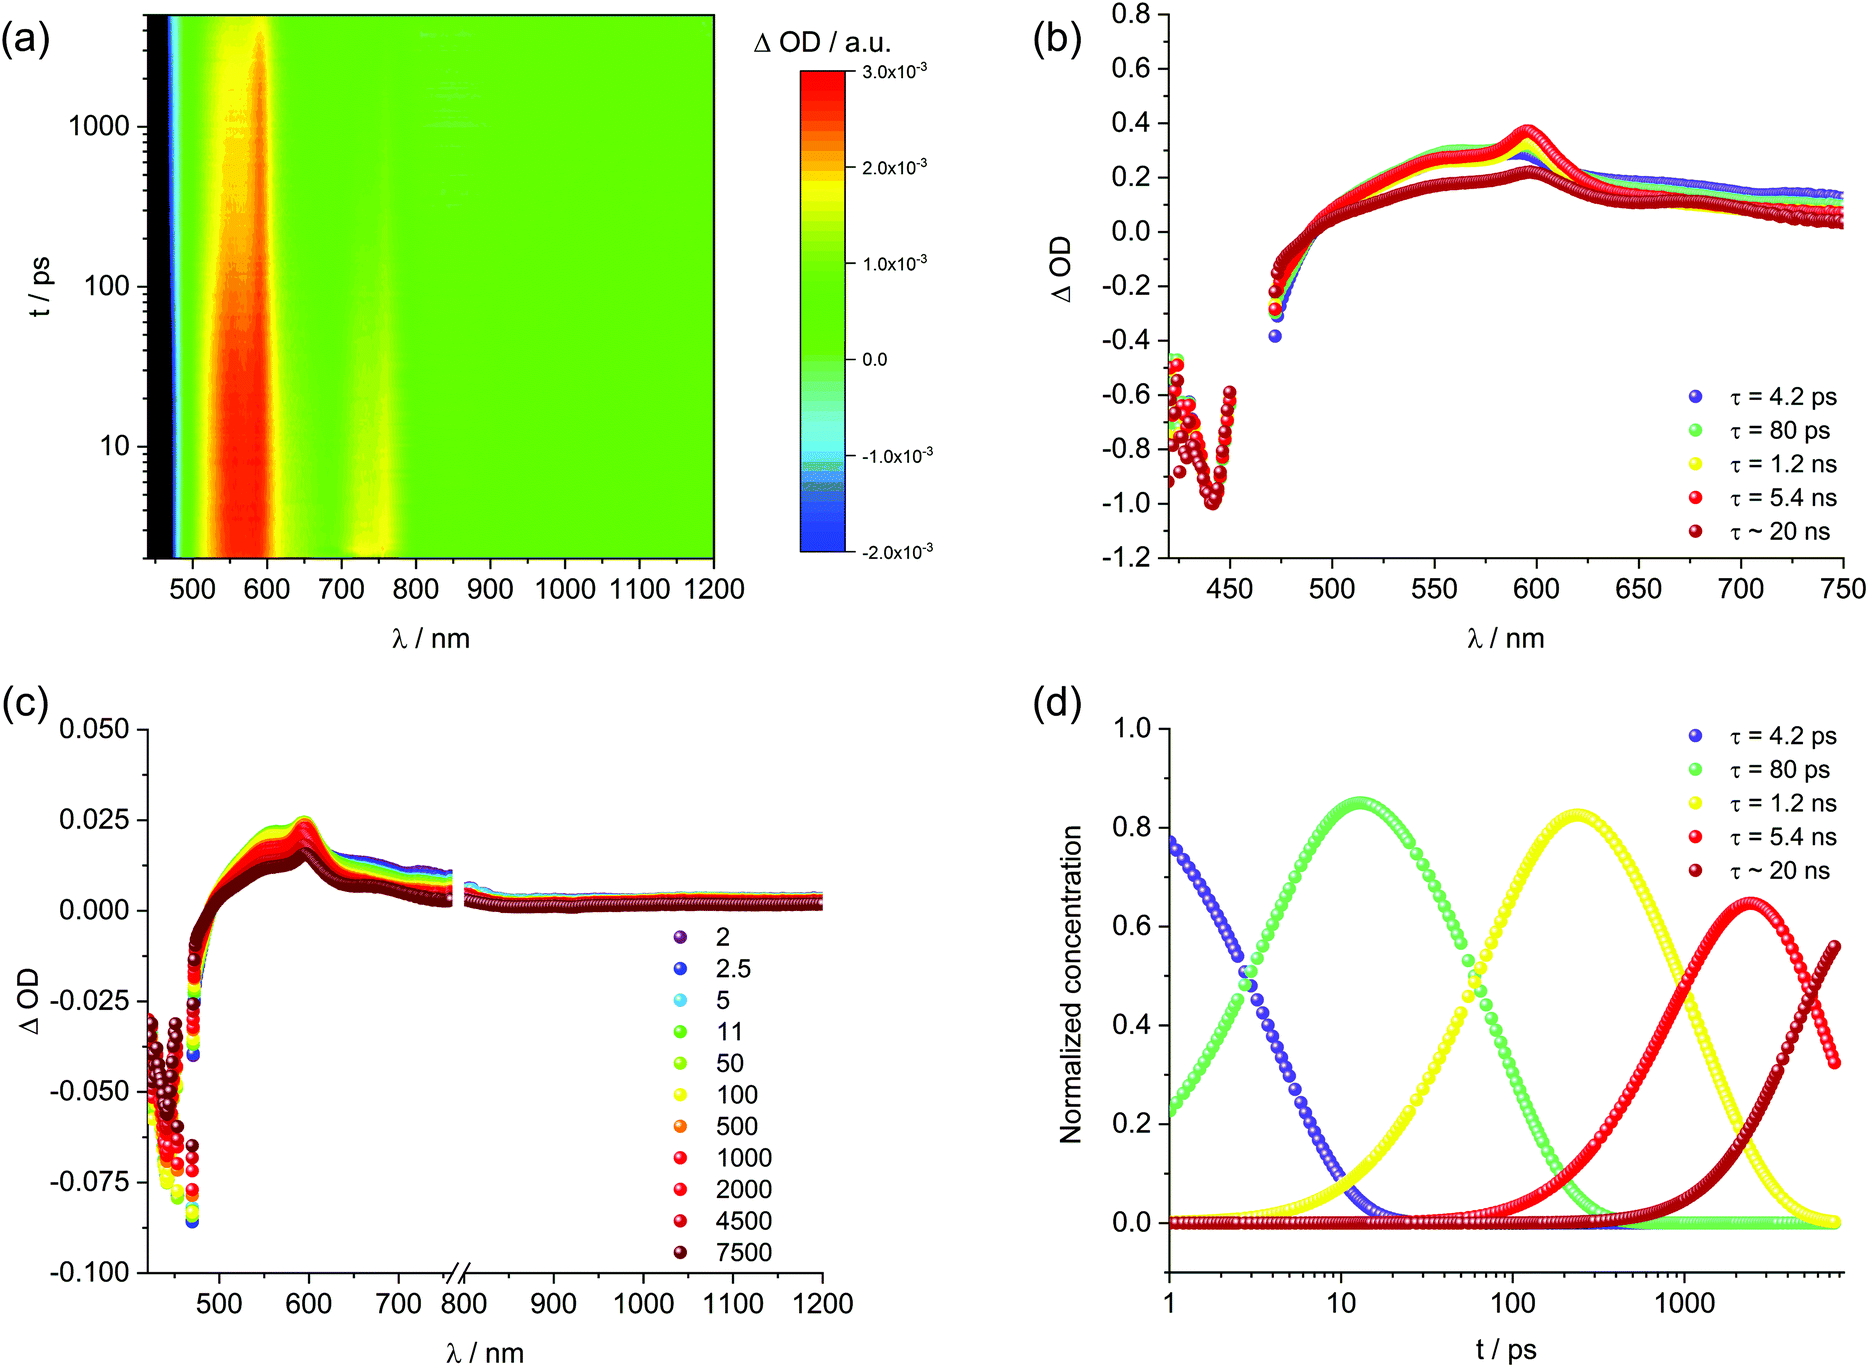 | ||
| Fig. 3 Differential absorption changes obtained upon femtosecond pump–probe experiments (460 nm) of 1 in ethanol at room temperature with time delays between 2 and 5000 ps (a). Exemplary time evolution spectra of 1 in ethanol at room temperature with time delays between 1.7 and 7500 ps (c) Corresponding evolution associated spectra of 1 in ethanol obtained by global analysis (b). Corresponding concentration profiles (d). | ||
Characterization of 1/SWCNT
Next, solid SWCNTs were stepwise added to solutions containing 1 and sonicated. The resulting absorption and fluorescence spectra are shown in Fig. 4. For DMF, at first glance, increasing concentrations of SWCNT go hand in hand with a decrease in absorption of 1 accompanied by bathochromic shifts. At the same time, the fluorescence is quantitatively quenched. Regardless of inner filter effects, the newly formed 1/SWCNT lacks any fluorescence of 1. Normalization of the fluorescence spectra to that of non-aggregated 1 (Fig. 4) reveals that the stepwise SWCNT addition changes the relative intensities of the fluorescence of non-aggregated versus excimer-like 1. Following the first addition of 1, the excimer-like fluorescence slightly increases. We rationalize this finding with the immobilization of non-aggregated 1 onto SWCNTs. In turn, fluorescing non-aggregated 1 is faster depleted than excimer-like 1. In the following, the equilibrium of free 1 shifts towards the non-aggregated form. This continues until the excimer-like fluorescence is quantitatively quenched. In a closer look at the absorption features, the 1/SWCNT dispersions and similarly treated dispersions of pristine SWCNTs were twice centrifuged and sonicated after each centrifugation.42 Fig. S5† shows a comparison of 1/SWCNT and pristine SWCNT dispersions. Focusing on the S11 transitions in DMF, the absorption maxima of (6,5), (7,5), and (7,6) at 1012, 1054, and 1160 nm,43 respectively, in pristine SWCNTs are hypsochromically shifted in the respective 1/SWCNTs to 999, 1050, and 1150 nm. Hypsochromic shifting of SWCNT absorptions stands for effectively debundled or even individualized SWCNTs.44 Changes in 1 absorption include a bathochromic shifting and an overall broadening: from 439 and 465 nm to 450 and 476 nm (Fig. 5). Furthermore, the relative absorption intensity of the lowest energy absorption maximum increases, which indicates effective deaggregation and immobilization of non-aggregated 1 onto SWCNTs. In ethanol, dispersions of pristine SWCNTs are very unstable and typically SWCNT precipitation sets in after a few minutes. On the contrary, 1/SWCNT in ethanol is stable over the course of days. Therefore, 1 stabilizes SWCNT dispersions in ethanol. Overall, the spectral changes are similar albeit stronger to those registered in DMF. Focusing on the lowest energy absorption of 1, 1/SWCNT formation results in maxima at 448 and 474 nm. S11 absorptions of SWCNTs, that is, (6,5), (7,5), and (7,6) at 1013, 1053, and 1157 nm, respectively, shift hypsochromically to 997, 1046, and 1142 nm in the presence of 1. Monitoring the fluorescence changes during 1/SWCNT formation in ethanol leads to the same results as in DMF with stronger contributions of excimer-like 1.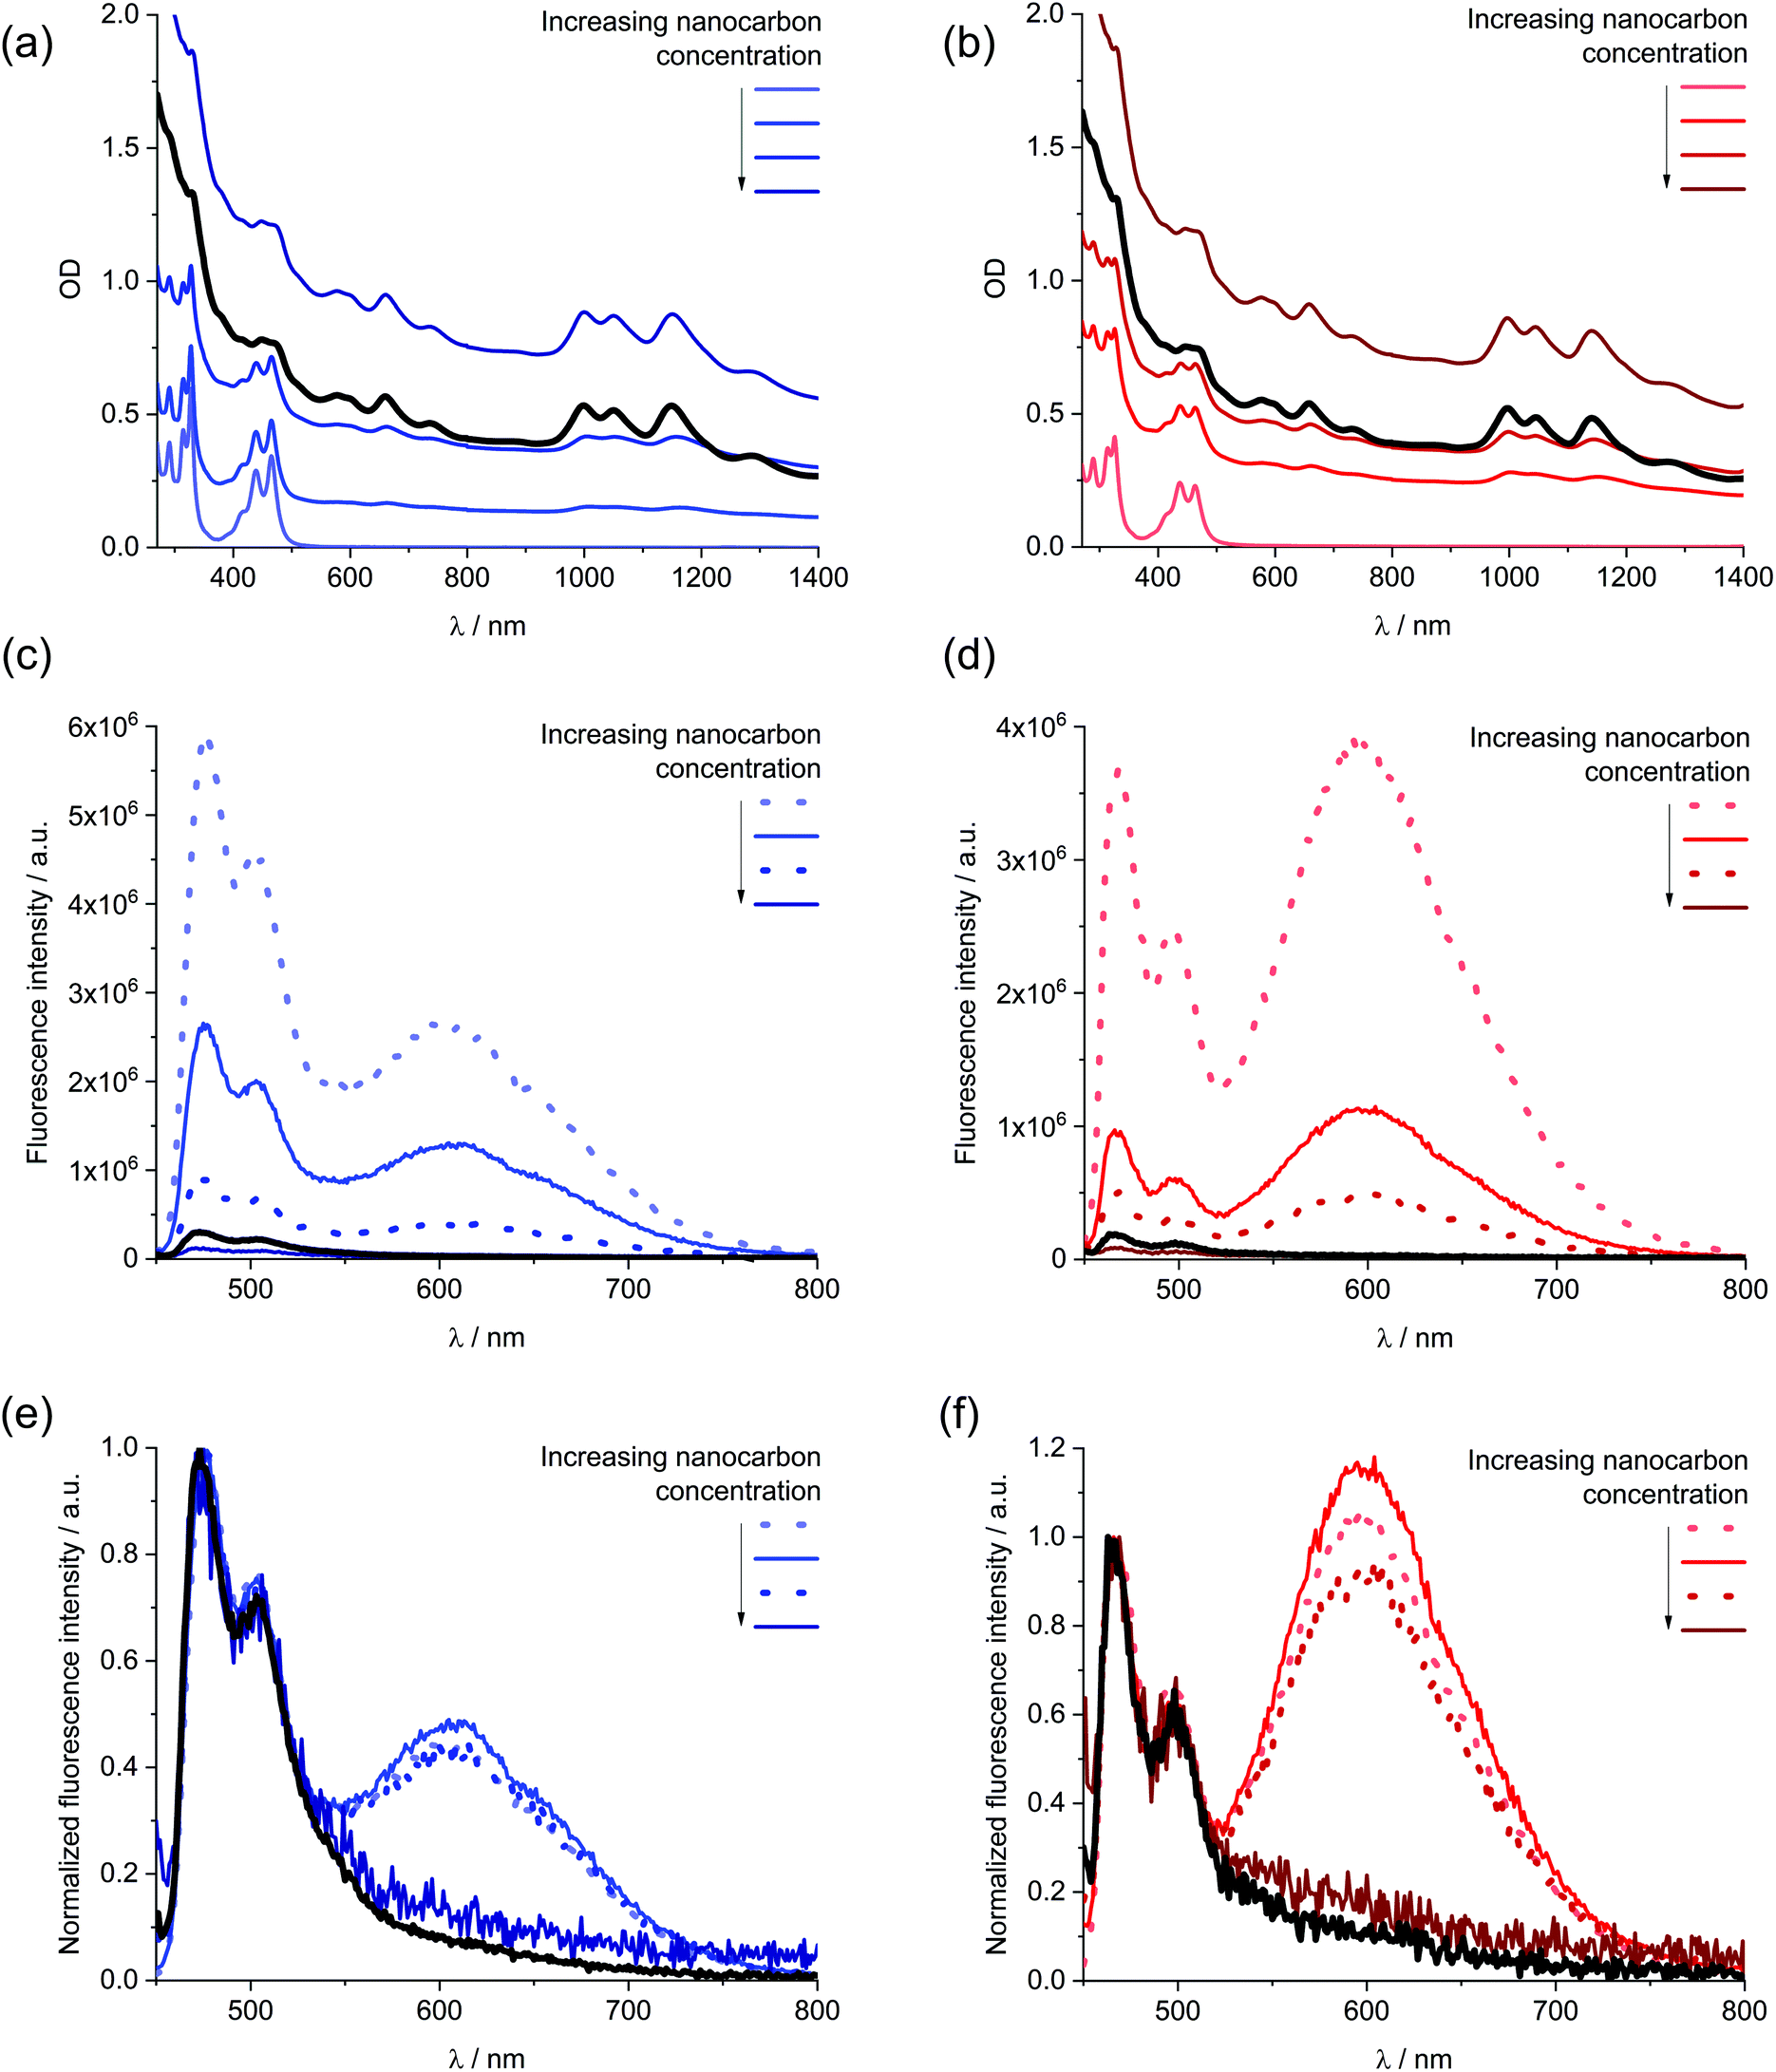 | ||
| Fig. 4 Absorption (a and b), fluorescence (c and d), and normalized fluorescence (e and f) spectra of 1 in DMF (left) and ethanol (right) with increasing SWCNT concentration and the resulting 1/SWCNT after two centrifugation steps (black). | ||
 | ||
| Fig. 5 Comparison of the normalized absorption spectra of 1 in DMF (blue) and ethanol (red) and the normalized absorption of 1/SWCNT after subtraction of the scattering background and SWCNT centred absorption features (Fig. S6†) in DMF (green) and ethanol (orange). | ||
To shed light on the debundling and individualization of SWCNTs, transmission electron microscopy (TEM) and atomic force microscopy (AFM) were employed. TEM experiments were conducted with the objective to obtain an overview (Fig. S6†), while AFM serves to determine height profiles (Fig. S7†). Notably, pristine SWCNTs are well dispersible in DMF. As a result, debundled SWCNTs are discernable in the TEM micrographs even in the absence of 1. High contrasts, however, point towards smaller SWCNT bundles rather than individualized SWCNTs. Validation of this assumption came from AFM, which assists in determining heights in the range from 2 to 3 nm. In contrast to just SWCNTs, TEM micrographs upon immobilization of 1 reveal weaker contrast and thinner SWCNTs. As a matter of fact, AFM corroborates the presence of individualized SWCNTs, which coexist with smaller SWCNT bundles. Relative heights are on the order of 1 nm. In contrast to DMF, SWCNTs are not well dispersible in ethanol. TEM micrographs reveal the presence of rather large SWCNT bundles with diameters exceeding 2.5 nm. In line with our absorption measurements, 1 enables the dispersability of SWCNT in ethanol. Debundling/individualization is confirmed in TEM and AFM measurements. From the TEM micrographs we conclude very thin SWCNTs, which are of very low contrast. In terms of heights, AFM images point to 0.7 to 1 nm, which is in close agreement with diameters of individualized SWCNTs.
Individualized SWCNTs are a prerequisite for fluorescence detection of semiconducting SWCNTs.45 Representative 3D fluorescence maps are illustrated in Fig. S8.† In DMF, the fluorescence of 1/SWCNTs is six times stronger than that of the SWCNT reference. Fluorescence maps reveal that the absorption assigned to (7,6)-SWCNTs is a superimposition of (8,4)- and (7,6)-SWCNTs.43 The fluorescence of (6,5)- and (8,4)-SWCNTs is observed upon 585 nm excitation, while that of (7,5)- and (7,6)-SWCNTs is detected at 657 nm excitation. In DMF, the fluorescence maxima of (6,5)-, (7,5)-, (8,4)-, and (7,6)-SWCNTs in 1/SWCNT are bathochromically shifted with respect to those of pristine SWCNTs; the respective maxima are 1008, 1052, 1148, and 1151 nm for pristine SWCNT and 1014, 1066, 1156, and 1160 nm for 1/SWCNT. Turning to SWCNT fluorescence in ethanol, maxima for the SWCNT reference appear at 1005, 1057, 1141, and 1147 nm, which are slightly shifted bathochromically to 1007, 1057, 1142, and 1151 nm in 1/SWCNT. Considering that the SWCNTs are well debundled and individualized in 1/SWCNT, the fluorescence signals are very intense and sharp. With respect to the chiral selectivity, no major differences are discernable between SWCNT reference and 1/SWCNT. If at all, the relative fluorescence intensity of larger-diameter SWCNTs is slightly lower in 1/SWCNT compared to the SWCNT reference in both solvents (Fig. S9†).
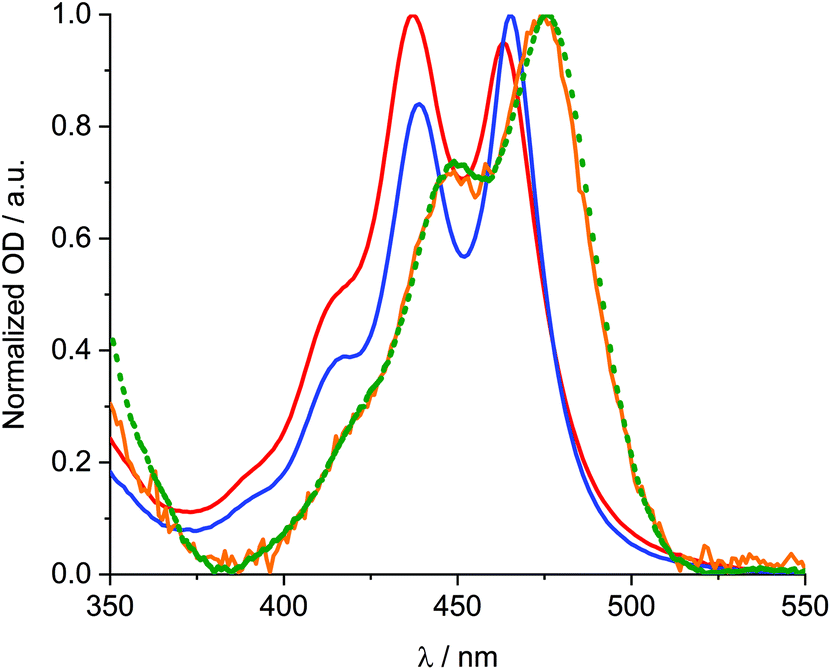
It is of interest to corroborate any energy transfer from 1 to SWCNTs in 1/SWCNT. To this end, 3D nIR fluorescence spectra upon excitation into the absorption of 1 are measured for 1/SWCNT. Notably, obtaining excitation spectra of 1/SWCNT is hampered, on one hand, by the high optical density of the dispersions and, on the other hand, by the low intensity of 1 centred absorptions in 1/SWCNT.46 For 1/SWCNT, features are visible, which are best described as a superimposition of fluorescence stemming from 1 and SWCNT (Fig. S10†). In stark contrast, the SWCNT reference is only weakly fluorescent. A plot of the fluorescence at a single wavelength as a function of excitation wavelength generates an excitation spectrum, which should reveal a good resemblance with the absorption spectrum, if any energy transfer takes place from 1 to SWCNT. A comparison of the 1 centred absorption features of 1/SWCNT in DMF and the respective excitation spectra of 1/SWCNT is documented in Fig. 6.47 It appears that the excitation spectra are well in line with the 1 centred absorption of 1/SWCNT, which corroborates the energy transfer from 1 to SWCNT.
 | ||
| Fig. 6 Comparison of normalized 1 centred absorption of 1/SWCNT in DMF (blue) and excitation spectra of 1/SWCNT in DMF recorded at 1014 (red), 1066 (green), and 1160 nm (black) and treated by subtraction of superposed fluorescence of unbound 1 fluorescence, of just SWCNTs, and baseline correction. | ||
Despite the energy transfer, immobilization of 1 onto SWCNT might also result in doping. Insights into doping came from statistical Raman spectroscopy in the form of more than a thousand spectra per drop-casted dispersions on silicon wafers, which were irradiated with 633 nm laser light in the case of SWCNTs. Fig. S11† summarizes the resulting histograms for SWCNT and 1/SWCNT, respectively. In the case of DMF, the Lorentzian fit yields G- and 2D-band positions of 1593.0 and 2604.7 cm−1 for the SWCNT reference and 1593.5 and 2604.6 cm−1 for 1/SWCNT. In ethanol, the respective values are 1593.3 and 2606.0 cm−1 for SWCNT and 1594.1 and 2605.7 cm−1 for 1/SWCNT. 1/SWCNT formation leads in both solvents to small up-shifts of the G-bands and a down-shifts of the 2D-band. Overall, small differences between SWCNT references and 1/SWCNT led us to conclude that no distinct SWCNT doping is present.
When turning to the radial breathing modes of SWCNTs, independent of the solvent or presence of 1 in the SWCNT dispersion, the same relative intensities of (7,6)-, (7,5)-, and (6,5)-SWCNTs at 260, 288, and 301 cm−1 are observed (Fig. S12†). As such, no selective SWCNT enrichment, that is, of specific chiralities, is realized during 1/SWCNT formation.
To investigate the excited state dynamics, femtosecond transient absorption measurements were performed (Fig. S13† and Fig. 7). For the SWCNT reference in DMF, minima of (6,5)-, (7,5)-, and (7,6)-SWCNTs evolve at 1010, 1059, and 1163 nm, respectively. We used a three-exponential fitting function to fit the time profiles at the corresponding wavelengths. The short-lived component of around 2 ps is present at all wavelengths and signifies internal conversion processes. For SWCNT in DMF, the lifetimes of intermediate-lived components for (6,5)-, (7,5)-, and (7,6)-SWCNTs are 4.3, 5.1, and 5.0 ps, respectively, while those for the corresponding long-lived components are 84.2, 109.0, and 97.2 ps. For 1/SWCNT in DMF, the intermediated-lived components have lifetimes of 8.3, 11.5, and 15.6 ps, while lifetimes of the long-lived components are 131.7, 285.6, and 258.9 ps. In ethanol, from minima at 1007, 1055, and 1153 nm for the SWCNT reference, intermediated lifetimes of 4.3, 3.8, and 3.2 ps and long lifetimes of 96.2, 98.9, and 92.5 ps were determined. For 1/SWCNT, none of the lifetimes change appreciably when contrasted to the SWCNT reference; 5.7, 5.1, and 5.0 ps versus 87.2, 91.8, and 83.0 ps. Having a closer look at the minima in the near infrared region, it becomes evident that the bleachings of the S11 transitions are – in line with steady state absorption – sharper in 1/SWCNT compared to the SWCNT reference, due to the debundling and individualization. In the visible part of the spectra, the lack of any 1 centred fingerprint is apparent in 1/SWCNT. On one hand, effective immobilization of 1 onto SWCNTs is confirmed. On the other hand, the lack of 1 centred transients points to relaxation of excited 1 in 1/SWCNT faster than the time-resolution of our experimental setup. In sound agreement with insights from nIR excitation spectra, we attribute the latter to energy transfer in 1/SWCNT from 1 to SWCNT.
 | ||
| Fig. 7 Differential absorption spectra obtained upon femtosecond pump–probe experiments (460 nm) of the SWCNT reference (a) and 1/SWCNT (b) in ethanol at room temperature with time delays between 2 and 5500 ps. | ||
Characterization of 1/NG
For the immobilization of 1 onto graphene we turned to liquid phase exfoliation. Here, graphite was added to solutions of 1 in either DMF or ethanol. Graphite-containing solutions were in the next step sonicated. After centrifugation, the supernatant was analysed by means of steady state absorption and fluorescence measurements. Fresh graphite was then added to the supernatant, sonicated once again, and centrifuged resulting in a stepwise enrichment (Fig. S14 and S15†).Upon enrichment, 1 related absorption and fluorescence decrease in intensity. Normalized fluorescence spectra reveal a similar trend to that described earlier for SWCNTs. In particular, excimer-like emission decreases faster in intensity than the non-aggregated fluorescence due to a change in the excimer-like versus non-aggregated equilibrium, that is, favouring the non-aggregated form. Interesting is the fact that SWCNTs gave rise to more pronounced changes.
To assess the quality of exfoliated graphite, TEM and AFM measurements were performed. As described for SWCNTs, TEM was used to gather an overview (Fig. S16†), while AFM was utilized to obtain direct insights into the quality (Fig. S17†). DMF is able to stabilize graphene based materials in dispersions without the needs to add any additives. Hence, the addition of 1 was expected to yield highly exfoliated materials. TEM micrographs indicate individualized graphene flakes, which backs up the aforementioned assumption. In addition, the high exfoliation degree was verified by AFM measurements, which nicely corroborated graphene flakes with heights in the range from 3 to 4 nm.
For ethanol, a different picture evolves. Ethanol without any additives does not secure any stability of graphene based materials in suspension. The presence of 1 induces, however, stability that lasts for hours up to days. For example, TEM revealed the existence of exfoliated graphene flakes. The quality of the latter was investigated by AFM measurements revealing flakes with heights of 3–4 nm.
Raman spectra of 1/NG drop-casted from DMF and irradiated with 532 nm laser light reveal no appreciable shift of the relevant G-band at 1588.1 cm−1 for the NG reference and at 1588.7 cm−1 for 1/NG as well as 2D-band at 2696 cm−1 for the NG reference and at 2698 cm−1 for 1/NG – Fig. S18.† The aforementioned leads to the assumption that sizable electronic communication in 1/NG is absent.48
For the analysis of the excited state dynamics in 1/NG femtosecond transient absorption measurements were conducted (Fig. S19† and Fig. 8). As the only NG related feature in this transient absorption measurement is the phonon bleach in the nIR region throughout the first few picoseconds of our experiments, we will focus on the 1 related signals. Evaluation by global analysis was performed with a kinetic model based on four species. The two species with lifetimes in the picosecond range, that is, 2.5 and 220 ps for ethanol and 4.6 and 108 ps for DMF, are in the same order of magnitude as the short-lived species found for the 1 reference and represent solvent rearrangement and internal relaxation. Turning to the ns-lived species, the short-lived species of 3.4 ns in ethanol and 3.2 ns in DMF relate to non-aggregated 1. Relative to the 1 reference with lifetimes of 5.4 and 6.4 ns the acceleration is ascribed to an energy transfer from the immobilized monomers of 1 to graphene.49
 | ||
| Fig. 8 Differential absorption changes obtained upon femtosecond pump–probe experiments (460 nm) of 1/NG in ethanol at room temperature with time delays between 2 and 5000 ps (a). Exemplary time evolution spectra of 1/NG in ethanol at room temperature with time delays between 1.7 and 4500 ps (c) Corresponding evolution associated spectra of 1/NG in ethanol obtained by global analysis (b). Corresponding concentration profiles (d). | ||
Conclusions
A phosphodiester-linked, dialkynyl-substituted anthanthrene trimer (1) was synthesized and used for the exfoliation of graphite and individualization of SWCNTs in DMF and ethanol. 1 showed fluorescence of non-aggregated species next to excimer-like fluorescence. Overall, the excited state dynamics were governed by solvent rearrangement and radiative as well as non-radiative decays. Upon interaction with SWCNT and NG, both fluorescence of non-aggregated species and excimer-like fluorescence were quenched. Importantly, quenching of the excimer-like fluorescence was stronger than that of the non-aggregated fluorescence due to intramolecular deaggregation of anthanthrene stacks. Individualization and/or exfoliation of the nanocarbon materials were demonstrated by steady state absorption and fluorescence spectroscopy as well as TEM and AFM. More importantly, the Raman measurements pointed towards the lack of doping. Fluorescence excitation spectra revealed an energy transfer scenario from 1 to SWCNTs and NG, which was independently confirmed in TAS. Overall the spectral changes of 1 are more pronounced in 1/SWCNT than in 1/NG. We attribute this to a possible wrapping of 1 around SWCNTs, which causes stronger interactions than immobilization on the planar NG surface. The fact that these carbon-based nanomaterials are also stable in ethanol, which is environmentally friendlier than DMF, opens the door to possible “green” applications. By virtue of the fact that anthanthrene is neither an intrinsic electron donor nor electron acceptor, doping or charge transfer in 1/SWCNT and 1/NG was neither expected nor observed. Nevertheless, their quality and stability render the current nanocarbon materials feasible as a backbone for further functionalization to enable doping and/or charge transfer in potential future work.Experimental
Materials and methods
All reagents and solvents were purchased from commercial suppliers and used without further purification. 4,10-Dibromoanthanthrone was a courtesy from Heubach GmbH as Monolite Red 316801 product. 4,10-Dibromo-6,12-bis(octyloxy)anthanthrene was synthesized according to the literature procedure.24 Air and/or water-sensitive reactions were conducted under Ar in dry, freshly distilled solvents. For monitoring a reaction, an analytical thin layer chromatography (TLC) was performed with (ALUGRAM Xtra SIL G/UV254, layer 0.2 mm silica gel). 1H, 13C and 31P-NMR experiments were carried out on a Bruker AVANCE-300 or a Bruker AVANCE-400 spectrometer at 25 °C or 80 °C. Chemical shifts are reported in parts per million (ppm) and referenced to the residual solvent peak (CDCl3, δH = 7.26 ppm and δC = 77.16 ppm; DMSO-d6, δH = 2.50 ppm and δC = 39.52 ppm; DMF-d7, δH = 8.03 ppm and δC = 163.15 ppm). Peak multiplicities are described in the following way: s (singlet), d (doublet), t (triplet) and m (multiplet). Coupling constants (J) are reported in hertz (Hz). High resolution mass spectra (HRMS) were recorded on a Thermo Fisher LTQ Orbitrap XL using Nano Electrospray Ionization (NSI) while other MS on a Bruker Daltonics Autoflex III in the MALDI-TOF mode.Synthesis of compound 2
4,10-Dibromo-6,12-bis(octyloxy)anthanthrene (1.5 g, 2.17 mmol) was dissolved in THF (45 mL) and Et3N (25 mL). In nitrogen atmosphere CuI (34 mg) and Pd(PPh3)2Cl2 (180 mg) were added, followed by the addition of 3-butyn-1-ol (1 mL, 13.2 mmol). The reaction mixture was refluxed at 80 °C for 24 h. TLC (CH2Cl2/ethyl acetate 9![[thin space (1/6-em)]](https://www.rsc.org/images/entities/char_2009.gif) :1) showed disappearance of starting material. The solvent was removed in vacuo and the residue was purified by chromatography on silica gel, eluting with a mixture of ethyl acetate and CH2Cl2 (gradient from 0:100 to 5:95). Compound 2 was isolated as a yellow solid (1.036 g, 71%). 1H NMR (300 MHz, CDCl3): δ 8.80 (d, J = 8.2 Hz, 2H), 8.69 (d, J = 7.6 Hz, 2H), 8.65 (s, 2H), 8.18 (t, J = 7.9 Hz, 2H), 4.38 (t, J = 6.7 Hz, 4H), 4.05 (q, J = 6.3 Hz, 4H), 3.00 (t, J = 6.3 Hz, 4H), 2.18 (m, 4H), 1.98 (t, J = 6.3 Hz, 2H), 1.77 (m, 4H), 1.58–1.22 (m, 16H), 0.97–0.89 (m, 6H) ppm. 1H NMR (300 MHz, DMSO-d6) δ 8.76 (d, J = 8.2 Hz, 2H), 8.69 (d, J = 7.4 Hz, 2H), 8.50 (s, 2H), 8.32 (t, J = 7.9 Hz, 2H), 5.10 (t, J = 5.5 Hz, 2H), 4.33 (t, J = 6.4 Hz, 4H), 3.82 (m, 4H), 2.86 (t, J = 6.7 Hz, 4H), 2.09 (m, 4H), 1.70 (m, 4H), 1.55–1.16 (m, 16H), 0.93–0.86 (m, 6H). 13C NMR (101 MHz, CDCl3): δ 149.62, 131.08, 127.19, 126.14, 125.75, 124.32, 123.34, 121.37, 121.31, 120.85, 91.50, 81.21, 61.57, 32.06, 30.93, 29.78, 29.54, 26.45, 24.51, 22.87, 14.29 ppm. MALDI-TOF (DCTB, m/z): calc. for C46H52O4, 668.39; found, 668.01.
:1) showed disappearance of starting material. The solvent was removed in vacuo and the residue was purified by chromatography on silica gel, eluting with a mixture of ethyl acetate and CH2Cl2 (gradient from 0:100 to 5:95). Compound 2 was isolated as a yellow solid (1.036 g, 71%). 1H NMR (300 MHz, CDCl3): δ 8.80 (d, J = 8.2 Hz, 2H), 8.69 (d, J = 7.6 Hz, 2H), 8.65 (s, 2H), 8.18 (t, J = 7.9 Hz, 2H), 4.38 (t, J = 6.7 Hz, 4H), 4.05 (q, J = 6.3 Hz, 4H), 3.00 (t, J = 6.3 Hz, 4H), 2.18 (m, 4H), 1.98 (t, J = 6.3 Hz, 2H), 1.77 (m, 4H), 1.58–1.22 (m, 16H), 0.97–0.89 (m, 6H) ppm. 1H NMR (300 MHz, DMSO-d6) δ 8.76 (d, J = 8.2 Hz, 2H), 8.69 (d, J = 7.4 Hz, 2H), 8.50 (s, 2H), 8.32 (t, J = 7.9 Hz, 2H), 5.10 (t, J = 5.5 Hz, 2H), 4.33 (t, J = 6.4 Hz, 4H), 3.82 (m, 4H), 2.86 (t, J = 6.7 Hz, 4H), 2.09 (m, 4H), 1.70 (m, 4H), 1.55–1.16 (m, 16H), 0.93–0.86 (m, 6H). 13C NMR (101 MHz, CDCl3): δ 149.62, 131.08, 127.19, 126.14, 125.75, 124.32, 123.34, 121.37, 121.31, 120.85, 91.50, 81.21, 61.57, 32.06, 30.93, 29.78, 29.54, 26.45, 24.51, 22.87, 14.29 ppm. MALDI-TOF (DCTB, m/z): calc. for C46H52O4, 668.39; found, 668.01.
Synthesis of compound 3
Compound 2 (105 mg, 0.15 mmol) was dissolved in anhydrous toluene (2.8 mL) and DIPEA (0.3 mL) under nitrogen. PAM-Cl (102 mg, 0.43 mmol) was added dropwise, and the reaction mixture was stirred at r.t. for 2.5 h. TLC (CH2Cl2/hexane 3:7 + 2% Et3N) showed disappearance of starting material. The intense, yellow reaction mixture was concentrated to dryness in vacuo. The residue was purified by flash column chromatography on silica gel (CH2Cl2/hexane 3:7 + 2% Et3N) to yield 4 as an intense orange oil (117 mg, 73%). 1H NMR (300 MHz, CDCl3): δ 8.79 (d, J = 7.9 Hz, 2H), 8.72 (d, J = 7.3 Hz, 2H), 8.63 (s, 2H), 8.20 (t, J = 7.9 Hz, 2H), 4.38 (t, J = 6.7 Hz, 4H), 4.25–3.81 (m, 8H), 3.70 (m 4H), 3.03 (t, J = 6.8 Hz, 4H), 2.66 (m, 4H), 2.18 (m, 4H), 1.76 (m, 4H), 1.57–1.33 (m, 16H), 1.26–1.18 (m, 24H), 0.96–0.91 (m, 6H) ppm. 13C NMR (75 MHz, CDCl3): δ 149.64, 131.24, 127.01, 126.18, 125.84, 124.41, 123.60, 121.51, 121.34, 121.23, 119.52, 117.79, 91.85, 80.56, 62.37, 62.12, 58.84, 58.59, 43.47, 43.30, 32.05, 30.95, 29.78, 29.52, 26.44, 24.88, 24.79, 23.14, 22.86, 20.62, 20.54, 14.29 ppm. 31P NMR (121 MHz, CDCl3): δ 148.33 (major peak), 8.47 ppm. HRMS-NSI (m/z): [M]+ calc. for C64H86O6N4P2, 1068.6023; found, 1068.6032.
Synthesis of compound 4
The compound 2 (400 mg, 0.6 mmol) was dissolved in anhydrous pyridine (6 mL) under nitrogen. A solution of acetic anhydride (0.2 M, 57 μL, 0.6 mmol) in pyridine (3 mL) was dropwise added at r.t. over a period of 20–30 min. The reaction mixture was stirred at r.t. for 3 h until TLC (hexane/ethyl acetate 6:4) showed mainly mono-acetylated product 4 and unreacted starting material 2. The reaction mixture was diluted with CH2Cl2 (10 mL) and the organic layer was washed three times with aqueous HCl (0.5 M, 50 mL), once with aqueous saturated NaHCO3 (60 mL), and once with brine (60 mL). The organic phase was dried over MgSO4, filtered and the solvent was removed in vacuo. The residue was purified by flash column chromatography on silica gel (hexane/ethyl acetate 6:4) to yield 4 as an orange solid (160 mg, 38%). 1H NMR (300 MHz, CDCl3): δ 8.80 (d, J = 8.2 Hz, 2H), 8.70 (d, J = 7.4 Hz, 2H), 8.65 (d, J = 3.8 Hz, 2H), 8.21 (t, J = 7.9 Hz, 2H), 4.48 (t, J = 6.9 Hz, 2H), 4.38 (t, J = 6.6 Hz, 4H), 4.05 (m, 2H), 3.03 (m, 4H), 2.24–2.13 (m, 7H), 1.97 (t, J = 6.3 Hz, 1H), 1.75 (m, 4H), 1.56–1.23 (m, 16H), 0.97–0.89 (m, 6H) ppm. HRMS-NSI (m/z): calc. for C48H54O5, 710.3971; found, 710.3971.
Synthesis of compound 5
Under nitrogen atmosphere, a solution of compound 3 (236 mg, 0.22 mmol) in 1,2-dichloroethane (9 mL) was added to a solution of 5-(ethylthio)-1H-tetrazole (96 mg, 0.74 mmol) in 1,2-dichloroethane (3 mL). The reaction mixture was stirred at r.t. for 10 min, until TLC (CH2Cl2/MeOH 98:2) showed disappearance of starting material 3. A solution of compound 4 (400 mg, 0.56 mmol) in 1,2-dichloroethane (5 mL) was then added and the reaction mixture was stirred at r.t. for 2 h. tert-Butyl hydroperoxide (70% wt in water, 100 μL) was added and the reaction mixture was stirred for 20 min. Chloroform (60 mL) was added, the organic layer was washed twice with saturated NaHCO3 and once with brine. The organic layer was collected, dried over MgSO4 and filtered. After removing all solvents under vacuum, the residue was purified by flash column chromatography on silica gel using a gradient of 0 to 2% MeOH in CH2Cl2 to yield 5 as a dark orange solid (153 mg, 30%). 1H NMR (300 MHz, CDCl3): δ 8.51 (d, J = 7.8 Hz, 2H), 8.46 (d, J = 8.2 Hz, 2H), 8.35 (d, J = 7.3 Hz, 2H), 8.32–8.22 (m, 6H), 8.17 (t, J = 7.8 Hz, 2H), 8.03 (d, J = 7.4 Hz, 2H), 7.98 (s, 2H), 7.96–7.88 (m, 4H), 7.76 (t, J = 7.8 Hz, 2H), 4.65–4.35 (m, 16H), 4.15 (m, 8H), 4.05 (t, J = 6.4 Hz, 4H), 3.14 (m, 8H), 3.03 (t, J = 7.0 Hz, 4H), 2.80 (t, J = 6.2 Hz, 4H), 2.19 (s, 6H), 2.12–1.92 (m, 12H), 1.76–1.58 (m, 12H), 1.56–1.22 (m, 48H), 1.01–0.89 (m, 18H) ppm. MALDI-TOF (DCTB, m/z): calcd for C148H164N2O18P2: 2319.15; found: 2319.58.
Synthesis of trimer 1
Compound 5 (223 mg, 0.096 mmol) was dissolved in a solution of NH3 in MeOH (2 M, 17 mL) under nitrogen atmosphere and the orange reaction mixture was stirred at r.t. for 24 h. The resultant solution was concentrated to dryness in vacuo, and the residue was washed with methanol, redissolved in THF, and then concentrated to dryness to afford the pure 1 as an orange solid (150 mg, 0.07 mmol, 70% yield). In the NMR of compound 1, the proton signals for the cyanoethyl group of the ammonium cation are observed similar to the previously reported result.361H NMR (400 MHz, DMF-d7, at 80 °C): δ 8.69–8.51 (m, 2H), 8.47–8.39 (m, 5H), 8.31 (s, 1H), 8.29–8.25 (m, 1H), 8.22 (s, 1H), 8.20–8.16 (m, 2H), 8.17–8.05 (m, 5H), 8.05 (m, 3H), 7.98 (t, J = 7.8 Hz, 2H), 7.90 (m, 1H), 7.73 (t, J = 7.8 Hz, 1H), 4.75 (s, 4H), 4.48 (t, J = 7.6 Hz, 8H), 4.14 (m, 8H), 4.02 (t, J = 7.0 Hz, 4H), 3.97–3.90 (m, 4H), 3.26–3.15 (m, 8H), 3.03–2.96 (m, 4H), 2.82–2.79 (m, 4H), 2.10–1.91 (m, 12H), 1.90–1.85 (m, 2H), 1.70–1.57 (m, 12H), 1.50–1.30 (m, 48H), 0.99–0.94 (m, 18H) ppm. 13C NMR (101 MHz, DMF-d7, at 80 °C): δ 120.79, 123.12, 120.78, 126.07, 125.86, 129.53, 125.87, 125.55, 63.31, 64.01, 76.16, 76.14, 61.03, 75.79, 22.25, 24.27, 26.10, 22.38, 31.61, 13.54 ppm. 31P NMR (162 MHz, DMF-d7 at 80 °C): δ −1.47 ppm. MALDI-TOF (DCTB, m/z): calcd for C138H152O16P22−: 1063.5283; found: 1063.5267.Nanocarbon assembly preparation
For the preparation of the assemblies, liquid phase exfoliation was the method of choice. In order to guarantee the ultrasound stability of 1 reference experiments were performed with sonication times up to 90 minutes. Steady state absorption and fluorescence spectroscopy validated the stability of 1 as no spectral changes appeared during this time period. For the preparation of assemblies containing SWCNTs, CoMoCAT SWCNTs were added to 4 ml of a 5 × 10⁶ M solution of 1 in either ethanol or DMF, sonicated for 10 min and analysed by steady state absorption and fluorescence measurements to follow the enrichment process. Again, CoMoCAT SWCNTs were added to the dispersion, sonicated for 10 min and analysed, resulting in a stepwise enrichment process. After the final enrichment step, the dispersion was centrifuged at 5000 G for 10 min and sonicated for 2 min. The latter procedure was repeated once and resulted in a stable dispersion. In the case of graphene, graphite was added to 4 ml of a 5 × 10⁶ M solution of 1 in either ethanol or DMF, and sonicated for 20 minutes. After centrifugation at 2000 G for 10 min, the obtained supernatant was used for analysis as well as a stepwise enrichment process with fresh graphite and the previously mentioned conditions.Conflicts of interest
There are no conflicts declared.Acknowledgements
Financial support by the Swiss National Foundation (grant 200020_169030) is gratefully acknowledged. This work was supported by the Deutsche Forschungsgemeinschaft as part of the Excellence Cluster Engineering of Advanced Materials and SFB 953 Synthetic Carbon Allotropes as well as by the Bavarian State Government as part of the Solar Technologies go Hybrid initiative.Notes and references
- Y. Chen and J. Zhang, Acc. Chem. Res., 2014, 47, 2273–2281 CrossRef CAS PubMed.
- A. Roth, C. Schierl, A. Ferrer-Ruiz, M. Minameyer, L. Rodriguez-Perez, C. Villegas, A. Herranz, N. Martin and D. M. Guldi, Chem, 2017, 3, 164–173 CAS.
- A. Cadranel, J. T. Margraf, V. Strauss, T. Clark and D. M. Guldi, Acc. Chem. Res., 2019, 52, 955–963 CrossRef CAS PubMed.
- M. Sireesha, V. Jagadeesh Babu, A. S. Kranthi Kiran and S. Ramakrishna, Nanocomposites, 2018, 4, 36–57 CrossRef CAS.
- J. Pan, F. Li and J. H. Choi, J. Mater. Chem. B, 2017, 5, 6511–6522 RSC.
- S. Campidelli, B. Ballesteros, A. Filoramo, D. Díaz Díaz, G. de la Torre, T. Torres, G. M. A. Rahman, C. Ehli, D. Kiessling, F. Werner, V. Sgobba, D. M. Guldi, C. Cioffi, M. Prato and J.-P. Bourgoin, J. Am. Chem. Soc., 2008, 130, 11503–11509 CrossRef CAS PubMed.
- Y. Tsarfati, V. Strauss, S. Kuhri, E. Krieg, H. Weissman, E. Shimoni, J. Baram, D. M. Guldi and B. Rybtchinski, J. Am. Chem. Soc., 2015, 137, 7429–7440 CrossRef CAS PubMed.
- P. Singh, S. Campidelli, S. Giordani, D. Bonifazi, A. Bianco and M. Prato, Chem. Soc. Rev., 2009, 38, 2214–2230 RSC.
- A. Thess, R. Lee, P. Nikolaev, H. Dai, P. Petit, J. Robert, C. Xu, Y. H. Lee, S. G. Kim, A. G. Rinzler, D. T. Colbert, G. E. Scuseria, D. Tománek, J. E. Fischer and R. E. Smalley, Science, 1996, 273, 483–487 CrossRef CAS PubMed.
- M. Volland, P. Zhou, L. Wibmer, R. Häner, S. Decurtins, S.-X. Liu and D. M. Guldi, Nanoscale, 2019, 11, 1437–1441 RSC.
- K. Dirian, S. Backes, C. Backes, V. Strauss, F. Rodler, F. Hauke, A. Hirsch and D. M. Guldi, Chem. Sci., 2015, 6, 6886–6895 RSC.
- E. Anaya-Plaza, M. M. Oliva, A. Kunzmann, C. Romero-Nieto, R. D. Costa, A. de la Escosura, D. M. Guldi and T. Torres, Adv. Funct. Mater., 2015, 25, 7418–7427 CrossRef CAS.
- M. Volland, A. Lennert, A. Roth, M. Ince, T. Torres and D. M. Guldi, Nanoscale, 2019, 11, 10709–10715 RSC.
- C.-H. Kim and I. Kymissis, J. Mater. Chem. C, 2017, 5, 4598–4613 RSC.
- K. P. Loh, S. W. Tong and J. Wu, J. Am. Chem. Soc., 2016, 138, 1095–1102 CrossRef CAS PubMed.
- C. Wang, H. Dong, W. Hu, Y. Liu and D. Zhu, Chem. Rev., 2012, 112, 2208–2267 CrossRef CAS PubMed.
- M. R. Ajayakumar, Y. Fu, J. Ma, F. Hennersdorf, H. Komber, J. J. Weigand, A. Alfonsov, A. A. Popov, R. Berger, J. Liu, K. Muellen and X. Feng, J. Am. Chem. Soc., 2018, 140, 6240–6244 CrossRef CAS PubMed.
- Y. Geng, S. Sangtarash, C. Huang, H. Sadeghi, Y. Fu, W. Hong, T. Wandlowski, S. Decurtins, C. J. Lambert and S.-X. Liu, J. Am. Chem. Soc., 2015, 137, 4469–4476 CrossRef CAS PubMed.
- S. Sangtarash, C. Huang, H. Sadeghi, G. Sorohhov, J. Hauser, T. Wandlowski, W. Hong, S. Decurtins, S.-X. Liu and C. J. Lambert, J. Am. Chem. Soc., 2015, 137, 11425–11431 CrossRef CAS.
- J.-B. Giguere, N. S. Sariciftci and J.-F. Morin, J. Mater. Chem. C, 2015, 3, 601–606 RSC.
- B. K. Shah, D. C. Neckers, J. Shi, E. W. Forsythe and D. Morton, Chem. Mater., 2006, 18, 603–608 CrossRef CAS.
- J.-B. Giguere and J.-F. Morin, J. Org. Chem., 2013, 78, 12769–12778 CrossRef CAS PubMed.
- J.-B. Giguere and J.-F. Morin, J. Org. Chem., 2015, 80, 6767–6775 CrossRef CAS PubMed.
- J.-B. Giguere, Q. Verolet and J.-F. Morin, Chem. – Eur. J., 2013, 19, 372–381 CrossRef CAS PubMed.
- S. Guha, F. S. Goodson, L. J. Corson and S. Saha, J. Am. Chem. Soc., 2012, 134, 13679–13691 CrossRef CAS PubMed.
- A. Lafleur-Lambert, J.-B. Giguere and J.-F. Morin, Macromolecules, 2015, 48, 8376–8381 CrossRef CAS.
- A. Lafleur-Lambert, J.-B. Giguere and J.-F. Morin, Polym. Chem., 2015, 6, 4859–4863 RSC.
- B. K. Shah, D. C. Neckers, J. Shi, E. W. Forsythe and D. Morton, J. Phys. Chem. A, 2005, 109, 7677–7681 CrossRef CAS PubMed.
- Y. Geng, C. Yi, M. P. Bircher, S. Decurtins, M. Cascella, M. Graetzel and S.-X. Liu, RSC Adv., 2015, 5, 98643–98652 RSC.
- M. H. Caruthers, Acc. Chem. Res., 1991, 24, 278–284 CrossRef CAS.
- C. D. Bösch, S. M. Langenegger and R. Häner, Angew. Chem., Int. Ed., 2016, 55, 9961–9964 CrossRef PubMed.
- M. Vybornyi, A. Rudnev and R. Häner, Chem. Mater., 2015, 27, 1426–1431 CrossRef CAS.
- C. B. Winiger, S. Li, G. R. Kumar, S. M. Langenegger and R. Häner, Angew. Chem., Int. Ed., 2014, 53, 13609–13613 CrossRef CAS PubMed.
- M. Kownacki, S. M. Langenegger, S.-X. Liu and R. Häner, Angew. Chem., Int. Ed., 2019, 58, 751–755 CrossRef CAS PubMed.
- H. Yu and R. Häner, Chem. Commun., 2016, 52, 14396–14399 RSC.
- S. Rothenbühler, C. D. Bösch, S. M. Langenegger, S.-X. Liu and R. Häner, Org. Biomol. Chem., 2018, 16, 6886–6889 RSC.
- M. Vybornyi, Y. Vyborna and R. Häner, Chem. Soc. Rev., 2019, 48, 4347–4360 RSC.
- B. K. Shah, D. C. Neckers, J. Shi, E. W. Forsythe and D. Morton, J. Phys. Chem. A, 2005, 109, 7677–7681 CrossRef CAS PubMed.
- D. J. Stewart, J. Shi, T. R. Naranjo, T. A. Grusenmeyer, J. M. Artz, C. L. McCleese, R. M. O'Donnell, T. M. Cooper, W. M. Shensky and J. E. Haley, Phys. Chem. Chem. Phys., 2018, 20, 28412–28418 RSC.
- C. D. Bösch, S. M. Langenegger and R. Häner, Angew. Chem., Int. Ed., 2016, 55, 9961–9964 CrossRef PubMed.
- J. B. Birks, Nature, 1967, 214, 1187–1190 CrossRef CAS.
- This procedure enables the removal of bigger SWCNT bundles as well as remaining catalyst from the dispersions.
- R. B. Weisman and S. M. Bachilo, Nano Lett., 2003, 3, 1235–1238 CrossRef CAS.
- T. Hasan, V. Scardaci, P. Tan, A. G. Rozhin, W. I. Milne and A. C. Ferrari, J. Phys. Chem. C, 2007, 111, 12594–12602 CrossRef CAS.
- L. J. Carlson, S. E. Maccagnano, M. Zheng, J. Silcox and T. D. Krauss, Nano Lett., 2007, 7, 3698–3703 CrossRef CAS PubMed.
- The high instability of SWCNT dispersions in ethanol renders obtaining excitation spectra impossible and, in turn, only DMF was considered for the measurements.
- The data of the latter is treated by subtraction of unbound 1 fluorescence and fluorescence of just SWCNTs as well as baseline correction.
- For 1/NG in ethanol, it was impossible to obtain suitable NG dispersions.
- The excimers related lifetime of 20 ns is also present in 1/NG, but has not been affected by the preceding energy transfer.
Footnotes |
| † Electronic supplementary information (ESI) available. See DOI: 10.1039/c9nr08062g |
| ‡ These authors contributed equally. |
| This journal is © The Royal Society of Chemistry 2020 |