
 Open Access Article
 This Open Access Article is licensed under a Creative Commons Attribution-Non Commercial 3.0 Unported Licence
Discrimination between target and non-target interactions on the viral surface by merging fluorescence emission into Rayleigh scattering†
Haemi
Lee
a,
Yejin
Jang
b,
Nam Hoon
Kim
c,
Lila
Kim
d,
Meehyein
Kim
 *b and
Yung Doug
Suh
*ae
*b and
Yung Doug
Suh
*ae
aLaboratory for Advanced Molecular Probing (LAMP), Bio Platform Technology Research Center, Korea Research Institute of Chemical Technology (KRICT), 141 Gajeong-ro, Yuseong-gu, Daejeon 34114, South Korea. E-mail: ydsuh@krict.re.kr
bVirus Research Group, Therapeutics and Biotechnology Division, Korea Research Institute of Chemical Technology (KRICT), 141 Gajeong-ro, Yuseong-gu, Daejeon 34114, South Korea. E-mail: mkim@krict.re.kr
cConvergent research of Emerging Virus Infection, Korea Research Institute of Chemical Technology (KRICT), 141 Gajeong-ro, Yuseong-gu, Daejeon 34114, South Korea
dGeneChem Inc., 187, Techno 2-ro, Yuseong-gu, Daejeon 34025, South Korea
eSchool of Chemical Engineering, Sungkyunkwan University (SKKU), Suwon 440-746, South Korea
First published on 13th March 2020
Abstract
Direct and quantitative determination of antibodies or cellular receptors dynamically binding to the surface of viral particles is the key issue for predicting the efficacy of therapeutic materials or host susceptibility to a new emerging pathogen. However, targeted visualization of infectious viruses is still highly challenging owing to their nanoscopic sizes and uncontrollable nonspecific interactions with loading molecules responsible for false signals. Here we present a multimodal single-molecule and single-particle (SMSP) visualization capable of simultaneously yet independently tracking Rayleigh scattering and fluorescence that, respectively, are generated from viruses (approximately 100 nm) and labeled interacting molecules. By analyzing real-time trajectories of fluorescent antibodies against a virus surface protein with reference to single virus-derived Rayleigh scattering, we determined heterogeneous binding stoichiometry of virus-antibody couplings irrespective of the nonspecific binder population. Therefore, our multimodal (or multi-level) SMSP assay visually identifies and selectively quantifies specific interactions between them with single binding event accuracy. As a ‘specific-binding quantifier’ to assess variable host susceptibility to a virus, it was further applied for distinguishing ratiometric bindings and spontaneous dissociation kinetics of synthesized isomeric receptors to influenza virus. The present framework could offer a solid analytical foundation for the development of a direct-acting antiviral agent inhibiting an integral viral enveloped protein and for nanobiological investigation for dissecting spatiotemporal nanoparticle–molecule interactions, which have been scarcely explored compared to those among plasmonic nanoparticles or among molecules only.
Introduction
Up-to-date imaging methods have achieved detection capability down to the single molecule level.1–3 Such technological accomplishments facilitated detection and counting of single viral particles.4–8 Beyond that, understanding the specific interactions taking place on the viral surface is highly required for evaluating the neutralizing efficacy of therapeutic antibodies or for predicting receptor-mediated host susceptibility to a newly emerging virus, as the viral envelope is composed of foreign substances that our immune system encounters first.9–11 However, the quantitative analysis of dynamic interactions between antibodies or cellular receptors and the infectious viral particles at the single event level still remains challenging. Regarding this issue, reliability of experimental assessments rests on the targeted detection of unlabeled, unmodified viruses with the stringent exclusion of background signals arising from nonspecific binding events. Specifically, undesirable physisorption of the sensing molecules frequently results in false positives, whereas their insufficient affinity to targets or the lack of readout signal intensities causes false negatives. Besides these false outcomes, most conventional immunoassays are focused on indirect detection of antigen markers such as pathogen-derived secretory proteins, rather than directly sensing the infectious viral particles.12,13 Therefore, to extract signals representing interactions between viral particles and counter molecules and correlate them with biological functions relevant to pathogenesis, it is necessary to establish an advanced analytical modality discriminating target and non-target interactions on the viral surface.Immunogold-labeling transmission electron microscopy (TEM) has been widely employed to visualize the presence of unlabeled viral particles and define their identity using antibodies.14 However, it has limitations in comparative or real-time analysis of physiological interactions and disadvantages associated with potential structural distortion of viral proteins during sample preparation. Alternatively, ingenious approaches including mechanical, electrochemical, optical and flow virometry methods have shown remarkable achievement in monitoring individual virions.5,8,15 These sensing assays regardless of being imaging- or nonimaging-based methods are, however, hardly reliable in the following situations in which the population of target events is less abundant than that of non-target events. This is one of the major obstacles preventing access to accurately targeting the unlabeled nanometer-sized infectious virions and revealing their heterogeneous binding behaviors with freely existing biomolecules, either antibodies or receptors.
Inspired by this challenge, we tried to develop multi-level real-time single-molecule and single-particle (SMSP) imaging that simultaneously yet independently chases Rayleigh scattering and fluorescence signals produced respectively by viral particles and labeled antibodies. It is reasonable to assume that the coincidence between these two irrelevant optical signals is equivalent to the occurrence of specific adsorption of loading molecules onto the viral surface. Importantly, without the need for mock control preparation, our imaging method easily filters out nonspecific events appearing in a sensing area, via classifying them into fluorescence-only or scattering-only singular optical signals. Through an extended feasibility study, we were able to compare the ratiometric bindings and dissociation dynamics of the synthetic isomeric cellular receptors to the influenza viral particles at a single virus and single receptor level, ultimately providing single binding event accuracy.
Methods and materials
Virus preparation and antibody labeling
The influenza virus, A/Puerto Rico/8/34 (PR8; H1N1), was amplified in 10-day-old embryonated chicken eggs at 37 °C for 3 days followed by purification by ultracentrifugation.16 To ensure biosafety, they were inactivated with 0.02% formalin at 4 °C for 24 h and subjected to ultracentrifugation again to remove formalin. Loss of infectivity was evaluated by a plaque assay and its protein concentration was estimated to be 440 μg mL−1, equivalent to 9.2 × 10⁹ plaque-forming units (pfu) mL−1. Anti-hemagglutinin (HA) antibody (cat. no. 86001-RM02; Sino Biological Inc., Beijing, China) was labeled using a Molecular Probe's Alexa Fluor 532 antibody labeling kit according to the manufacturer's instructions (Invitrogen, Eugene, OR).Multimodal SMSP implementation
The optical configuration for multimodal SMSP imaging is schematically presented in Fig. 1a. The output of a diode-pumped solid-state laser at a wavelength of 532 nm is magnified by a two-lens system with 1![[thin space (1/6-em)]](https://www.rsc.org/images/entities/char_2009.gif) :4 focal length ratio (i.e., ×4 beam expander) to produce a larger beam size before entering a microscope (Olympus IX71; Olympus, Tokyo, Japan) (Fig. S1†). The incidence is designed to be selected between 532 and 660 nm using a flip mirror. A focusing lens with a 500 mm focal length is installed to focus the incident light onto the back focal plane of the TIR objective (×100) with a numerical aperture of 1.49 to generate a wide-field illumination area at the sample surface, with the bottom of a microfluidic channel containing approximately 150 μL (Fig. S2†). The incident light passes through a broadband beamsplitter (Chroma Technology Corp., Brattleboro, VT) with 30% transmittance, which replaces the dichroic mirror installed originally inside the microscope, and simultaneously excites the Rayleigh scattering and fluorescence signals respectively emitted from viral particles and labeled antibodies (or cellular receptors). Both optical signals collected by the same objective for excitation then pass through a tube lens with 175 mm focal length. To collect these emitted lights without the TIR reflected light, we positioned lens 1 with a focal length of 185 mm such that the beam path and focus position of the reflected light are maximally separated from those of the emitted light. An iris was placed to control the size of field of view at the focal plane (focal plane 2) of the emission. After being collimated by lens 2, the emission was separated into a fluorescence channel (upper) and Rayleigh scattering channel (lower) in the homebuilt assembly and finally focused onto the image plane of the EM CCD through respective focusing lenses, lens 3 (for fluorescence) and lens 4 (for scattering). The dichroic pairs were optimized for use with different excitation wavelengths, 532 and 660 nm, without changing the beam path. Technically, these two incident lights sequentially excite the same illumination area for multiplex detection. Neutral density (ND) filters with an optical density of 2.8, which in principle led to a 1.6 × 10⁻³-fold reduction in intensity, were deployed in the Rayleigh scattering channel to adjust the scattering intensity to that of fluorescence. Bandpass (BP) filters are additionally employed to enhance the spectral selectivity of the collected signals. The overall magnification of our multimodal SMSP system was determined by imaging a standard grid with a 5 μm pitch and found to be approximately 210. Such a high magnification was intended for the detailed investigation of single binding events.
:4 focal length ratio (i.e., ×4 beam expander) to produce a larger beam size before entering a microscope (Olympus IX71; Olympus, Tokyo, Japan) (Fig. S1†). The incidence is designed to be selected between 532 and 660 nm using a flip mirror. A focusing lens with a 500 mm focal length is installed to focus the incident light onto the back focal plane of the TIR objective (×100) with a numerical aperture of 1.49 to generate a wide-field illumination area at the sample surface, with the bottom of a microfluidic channel containing approximately 150 μL (Fig. S2†). The incident light passes through a broadband beamsplitter (Chroma Technology Corp., Brattleboro, VT) with 30% transmittance, which replaces the dichroic mirror installed originally inside the microscope, and simultaneously excites the Rayleigh scattering and fluorescence signals respectively emitted from viral particles and labeled antibodies (or cellular receptors). Both optical signals collected by the same objective for excitation then pass through a tube lens with 175 mm focal length. To collect these emitted lights without the TIR reflected light, we positioned lens 1 with a focal length of 185 mm such that the beam path and focus position of the reflected light are maximally separated from those of the emitted light. An iris was placed to control the size of field of view at the focal plane (focal plane 2) of the emission. After being collimated by lens 2, the emission was separated into a fluorescence channel (upper) and Rayleigh scattering channel (lower) in the homebuilt assembly and finally focused onto the image plane of the EM CCD through respective focusing lenses, lens 3 (for fluorescence) and lens 4 (for scattering). The dichroic pairs were optimized for use with different excitation wavelengths, 532 and 660 nm, without changing the beam path. Technically, these two incident lights sequentially excite the same illumination area for multiplex detection. Neutral density (ND) filters with an optical density of 2.8, which in principle led to a 1.6 × 10⁻³-fold reduction in intensity, were deployed in the Rayleigh scattering channel to adjust the scattering intensity to that of fluorescence. Bandpass (BP) filters are additionally employed to enhance the spectral selectivity of the collected signals. The overall magnification of our multimodal SMSP system was determined by imaging a standard grid with a 5 μm pitch and found to be approximately 210. Such a high magnification was intended for the detailed investigation of single binding events.
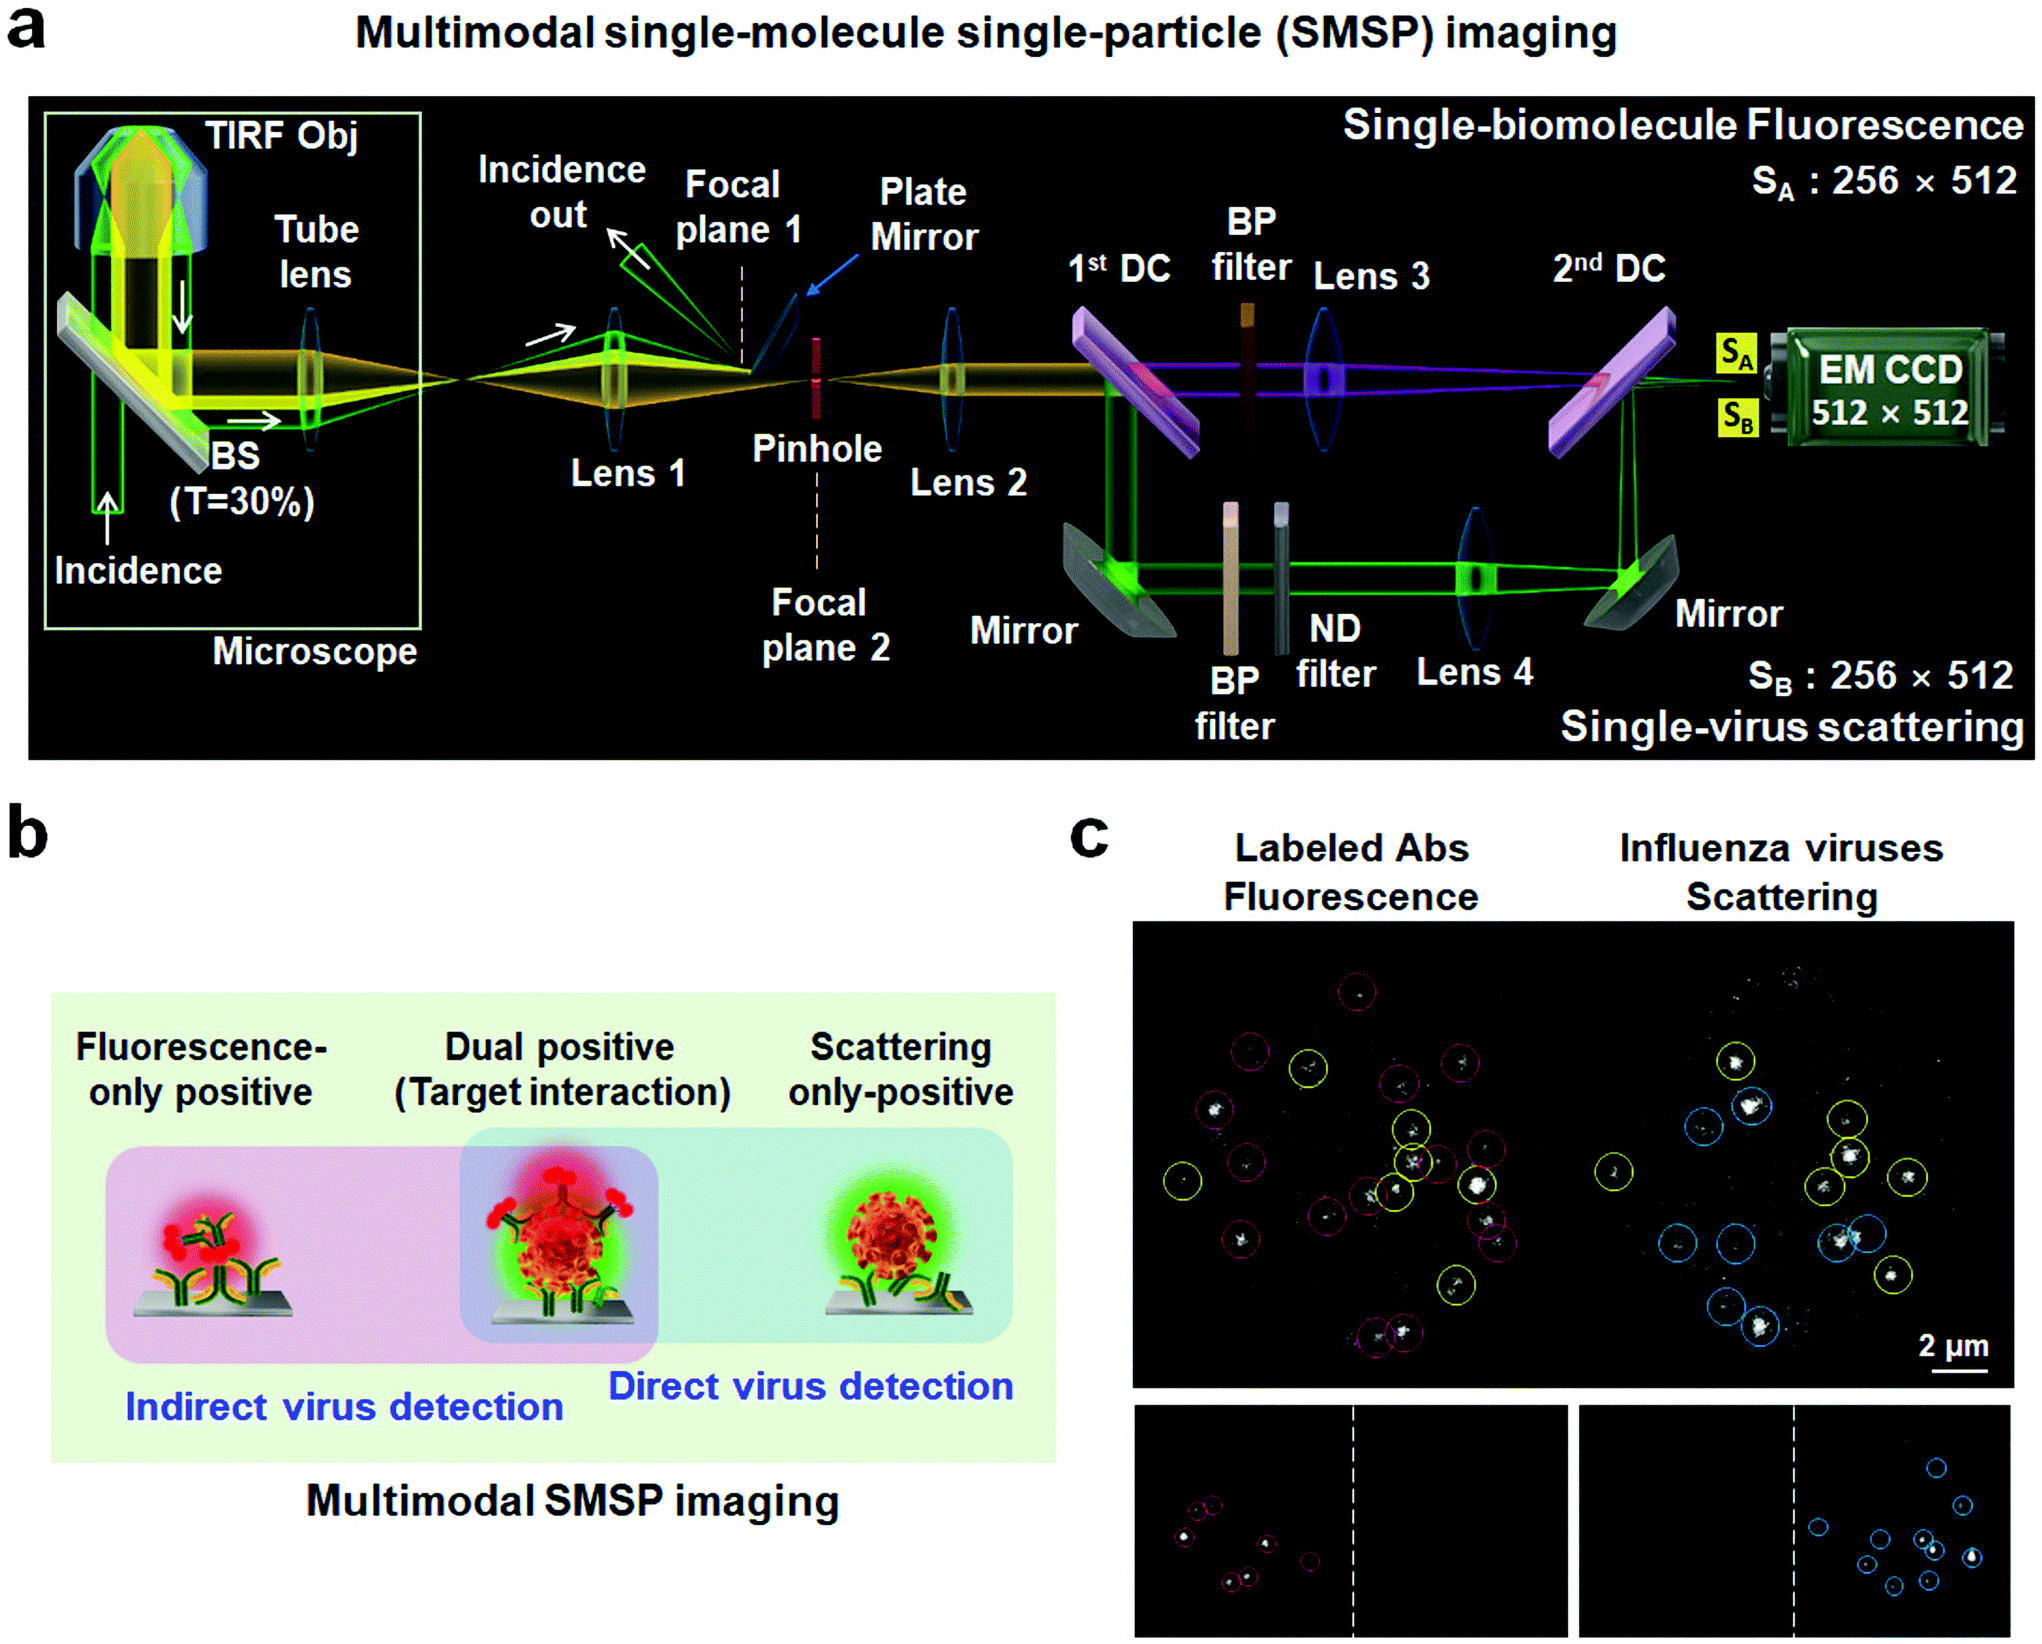 | ||
| Fig. 1 Real-time detection of unlabeled single viruses using multimodal single-molecule and single-particle (SMSP) visualization. (a) Optical diagram of the devised system. A 532 nm (or 660 nm) incident light was adopted to generate a wide illumination area using the total internal reflection (TIR) conditions. Rayleigh scattering from the viral particles and fluorescence from the labeled biomolecules residing in the illuminated area, depicted as yellow, were concurrently collected by an objective (×100, 1.49 N.A) and routed to a home-built assembly between the microscope and an electron multiplying charge coupled device (EM CCD). In contrast, a strong incident light that propagated parallel to the emission was efficiently removed by a plate mirror installed behind a focusing lens, lens 1. The optical path of the incidence was displayed as a white arrow. Meanwhile, the emission passing through the collimating lens (lens 2) was divided into a fluorescence channel (upper; pink) and a Rayleigh scattering channel (bottom; green) and finally positioned onto the image plane of the EM CCD using two dichroic mirrors and two focusing lenses, lens 3 and lens 4. (b) A schematic representation of the multimodal SMSP imaging as an integrated method combining direct and indirect virus detection. (c) Representative images from sample preparations in the absence of the viral particles (left bottom) and labeled detection antibodies (right bottom), respectively, and from a complete sample preparation (top). Fluorescence-only positives are marked in red circles, scattering-only positives in blue and dual positives in yellow. | ||
Detection of virus–antibody interactions
The entire assay protocol consisted of four steps: (1) coating of a HA-specific capture antibody at a concentration of 20 μg mL−1 on the surface of a liquid holder; (2) treatment of the blocking agent with 10 mg mL−1 of bovine serum albumin (BSA); (3) immobilization of the H1N1 virus, PR8, at a final titer of 4.6 × 10⁵ pfu per slide for 1 h; and (4) incubation of the fluorescent detection antibody (0.2 μg mL−1) prepared by labeling the same anti-HA antibody with Alexa 532 (Invitrogen). The loading concentration was chosen to achieve sufficient surface coverage of viral particles in the detection area. All experiments were performed at room temperature, i.e., ambient condition, with a reaction volume of 200 μL, and the incubation time was 10 min in each step. To remove the remnant reagents, the microfluidic holder was washed with phosphate buffered saline (PBS), twice, between the steps.Detection of virus–receptor interactions
The two glycan derivatives, α2,3-sialyllactose (3SL) and α2,6-sialyllactose (6SL) sodium salts (with a purity of >98%), were enzymatically synthesized.17,18 They were then chemically conjugated to have the aminohexyl linker for labeling with cyanine 5.5 (Cy5.5) according to a previous report.19 The purity of the final products, Cy5.5-labeled 3SL and 6SL, was assessed to be ≥95% via liquid chromatography–electrospray ionization mass spectroscopy. For detecting viral particles and their receptor binding, multimodal SMSP was operated the same as mentioned above, except for the incident light that was substituted with a wavelength of 660 nm.Calculation of a skin-depth correction factor for TIR excitation
The equation describing the behavior of the evanescent wave, Er = Eor·ei(k·r−ω·t), can be derived starting from a general representation of a propagating plane wave, where Eor is the amplitude of electric field at t = 0, k is the wave vector determining the propagation direction of the wave, r is the displacement vector, ω is the wave angular frequency, and c.c. stands for the complex conjugate. In particular, eik·r needs to be extended to investigate the characteristic of the electric field under TIR conditions. When k is (kx, ky, kz) and r is (rx, ry, rz), k·r should be kx·x + kz·z if the refracted electric field (Er) propagates in the zx plane. Then, eik·r becomes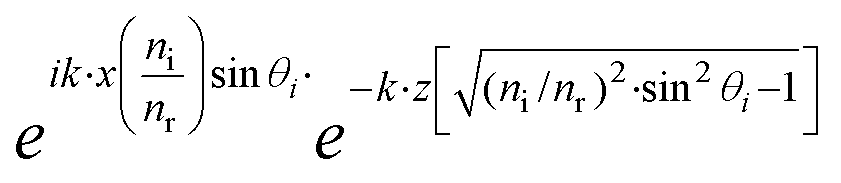 . The refracted field Er under TIR conditions can be expressed as
 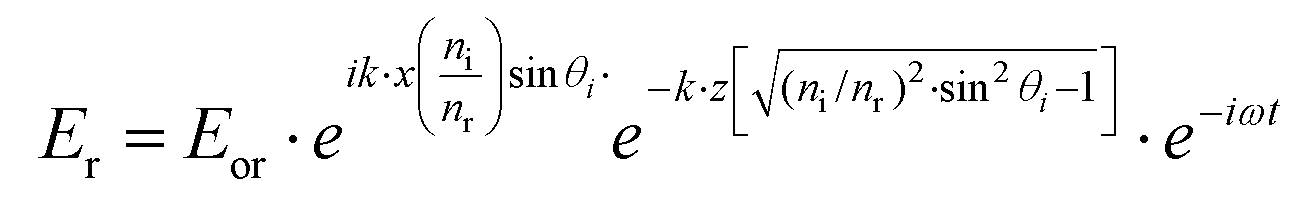 . The penetration depth of the evanescent field can thus be defined as
 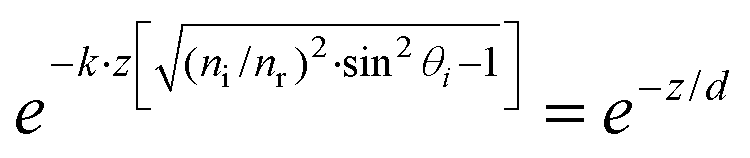 and
and  (using
  ). According to the above equation and our experimental conditions (the incident wavelength is 532 nm, ni and nr are 1.51 (oil-immersed lens with 1.49 NA) and 1.33 (1× PBS buffer), respectively), the skin depth d varies from ∼200 nm at the maximum incident angle (83°) to ∼1200 nm at the TIR critical angle (63°). Our experiments were performed at the maximum angle. The intensity (I) of the evanescent field under the TIR conditions exponentially decays along the z-axis perpendicular from the interface (z = 0) and is derived as follows: I = I0e−(z/d). The ratio of excitation power density (I1/I2) at different heights, z1 and z2, from the interface would thus become
 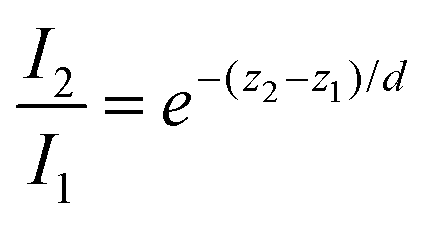 . Therefore, from the fact that the height difference of the virus is 100 nm and that the d is 200 nm, the labeled detection antibodies nonspecifically attached to the sensing surface were excited by an incident power density 1.8-fold higher than that of the antibodies bound specifically to the 100 nm viruses. That is, fluorescence of the dual positives, compared to that of the fluorescence-only positives, is generated with a lower incident power density that exponentially decreases from the surface of the sample under the TIR excitation conditions. Given the size of virus particles being 100 nm in diameter, the measured fluorescence intensities of the dual positives were scaled by a correction factor of 1.8 on employing the skin depth equation as described.
Results and discussion
Working principle and performance
In the devised multimodal SMSP configuration (Fig. 1a), incident light initiates travel under total internal reflection (TIR) conditions as shown in Fig. S1.† Meanwhile, an intense reflected light is removed at its focal plane 1; fluorescence and Rayleigh scattering signals residing in a wide-field illumination area, which were generated onto a microfluidic system (Fig. S2†), were collected by an objective and routed separately into a fluorescence channel (upper beam route) and Rayleigh scattering channel (lower beam route) shown in Fig. 1a. As a preliminary study, we examined the performance of the SMSP system by imaging fluorescent polystyrene latex nanospheres with a diameter of 200 nm and excitation and emission peaks emerging at 540 and 560 nm, respectively (Fig. S3†). The position difference between the Rayleigh scattering (xscat,i, yscat,i) and fluorescence (xflu,i, yflu,i) signals of thirty nanospheres i, i.e., Δxi = xscat,i − xflu,i and Δyi = yscat,i − yflu,i, was estimated to be 250 ± 1.0 pixels for the horizontal axis and 4.0 ± 0.6 pixels for the vertical axis on the CCD image plane, suggesting a two-dimensional coincidence of the separate images. To investigate the detection sensitivity of the fluorescence channel, we loaded 50 pM rhodamine 590 fluorescent dye molecules spin-coated on a cover glass, which verifies single-molecule fluorescence with irreversible photobleaching and irregular photoblinking behaviors (Fig. S4†).20,21 These results indicated that our multimodal SMSP system was well-designed and suitable for real-time monitoring of single-molecule fluorescence and single-nanobioparticle Rayleigh scattering signals. Particularly, in the latter case, it was successfully acquired by maximizing the difference in the beam path and the focus position between the weak Rayleigh scattering and hugely intense reflected light of the same photon energy which was subsequently removed by a plate mirror installed at its focal plane (Fig. 1a). From a pure technical point of view, it is non-trivial to spatially separate and selectively extract the Rayleigh scattering signals with a weak scattering cross-section from such an intense reflected light. This is one of the primary reasons why the direct visualization of dynamic interactions of bionanoparticle–molecule complexes has thus far been scarcely studied compared to molecule–molecule or plasmonic nanoparticle–nanoparticle interactions.22–24The underlying concept for targeted visualization of virus–biomolecule interactions is to analyze the dual positive spots that emit both the fluorescence of labeled molecules and Rayleigh scattering from individual viruses (Fig. 1b). Our imaging method is thereby an integrated system of affinity-based indirect and direct virus detection. The no-virus control showed fluorescent spots without the scattering signal, presumably originating from the nonspecific attachment of the labeled detection antibodies (left bottom, Fig. 1c). It implied that in our experiment, these spots could be readily excluded for interpretation of specific bindings as depicted in the left panel of Fig. 1b. In another parallel control without the labeled detection antibody, only Rayleigh-positive signals appeared (right bottom, Fig. 1c), also providing experimental rationale for their exclusion for further analysis due to the lack of binding molecules. Collectively, the conducted complementary controls verified neither signal crosstalk nor perturbation in our multimodal optical assembly. A full-fledged experiment through successive incubation with viral particles and fluorescent-labeled detection antibodies against influenza HA of subtype 1 (H1) finally displayed dual positive spots (top, Fig. 1c). These spots with different signal intensities resolve unsynchronized interactions of the detection antibodies to the viral particles. It can be suggested that the multimodal SMSP imaging successfully decodes all individual events occurring in a detection area in a way that the Rayleigh scattering signal plays a role as an ‘indicator’ pointing the target virus and the fluorescence signal serves as an ‘identifier’ selecting the interaction-of-interest. As a consequence of this sensing criterion, dual positives present specific interactions between fluorescence-labeled molecules and label-free viral particles.
Stoichiometric analysis based on the maximum fluorescence intensities
To investigate spatiotemporal interactions, we captured movies for 250 s at a time resolution of 500 ms. From a series of 500 consecutive frames, Fig. 2a shows a representative snapshot chosen at 2.5 s (Movie S1; S2, S3† for two other detection areas). The full width at half maxima (FWHMs) of the intensity profiles measured from the majority of the scattering and fluorescence signals were well correlated with the size of the diffraction-limit that occupies about 6 pixels each of which has 16 μm on the CCD image plane. A narrow size distribution of viruses centering on 92 nm was also obtained from a dynamic light scattering measurement (Fig. S5†), clarifying that the Rayleigh scattering mainly resulted from single viral particles, not from viral aggregates. According to our multimodal sensing criterion, spot 1 with both scattering and fluorescence signals is indicative of a specific binding (Fig. 2b). The fluorescence-only spot 2 denotes a false binder (Fig. 2c), whereas the scattering-only spot 3 presents an off-interaction (Fig. 2d). Independent of virus–antibody interaction, the scattering signals maintained almost stationary intensities within the region of interest, 7 pixels (Fig. 2b and d). By contrast, multistep discrete changes in fluorescence intensity were observed as a consequence of distinct photobleaching rates of dyes (Fig. 2b and c). Similar optical phenomena were observed for other detection areas (Fig. S6†). | ||
| Fig. 2 Single-binding event identification of individual viral interactions. (a) A snapshot of a movie at 2.5 s for a selected detection area. (b) The time trace of the dual positive spot 1 with both scattering and fluorescence signals. (c) The trace of the fluorescence-only positive spot 2. (d) The trace of the Rayleigh scattering-positive spot 3. (e) The overall histograms of the skin depth corrected (for only the dual positives) maximal fluorescence and scattering signals obtained from 809 dual positives, 711 fluorescence-only positives, and 787 scattering-only positives. (f) Linear regression analysis for the center values of subpopulations in the maximal fluorescence intensities from the fluorescence-only and dual positives as shown in (e). (g) No correlation result was observed between the fluorescence and scattering signals from 809 dual positives. | ||
For quantifying antibody-virus association events, the maximal fluorescence and scattering intensities were statistically analyzed from 809 dual positive spots, 711 fluorescence-only spots, and 787 scattering-only spots in ninety detection areas (Fig. 2e). It should primarily be considered that fluorescence from the dual positives, compared to that from the fluorescence-only positives, is generated with a lower incident power density that exponentially decreases from the surface of the sample under the TIR excitation conditions. Given the size of virus particles being approximately 100 nm in diameter, the measured fluorescence intensities of the dual positives were scaled with a correction factor of 1.8 on employing the skin depth equation as described in the Materials and Methods section. As a result, it was apparent that the corrected maximal fluorescence intensities are higher in the dual positives than the fluorescence-only positives, reflecting the larger number of antibodies specifically bound to the single viral particles (upper graph, Fig. 2e). Quantification was enabled by fitting Gaussian distributions to the acquired intensity populations and the resulting center values of the peaks were determined to be 598 AU for the fluorescence-only spots and 966 and 1561 AU for the dual positive spots. When hypothesized that the center value of the fluorescence-only spots corresponds to the magnitude of the fluorescence intensity emitted from one antibody unit, the R-squared value of 0.96 from the linear regression analysis suggested that 2 or 3 anti-HA antibodies were statistically attached to each influenza virus particle (Fig. 2f). In contrast, there appeared to be no substantial differences in the magnitude of the maximum Rayleigh scattering intensity distributions between the dual positive and scattering-only positive events (lower, Fig. 2e). In addition, no correlation was found between scattering and the corrected fluorescence intensities of 809 dual positives (Fig. 2g), indicating that the magnitude of the scattering intensity is predominantly determined by their own characteristics of the viral particles, such as the particle size or shape or the dielectric constant, irrelevant to their association status to the detection antibodies.
Stoichiometric analysis based on the stepwise photobleaching behaviors
In stark contrast to the scattering signals enabling prolonged observation, fluorescence signals showed a sequential decrease and eventual disappearance as shown in spots 1 and 2 which correspond to a dual positive and fluorescence-only positive, respectively (Fig. 3a). It has been accepted that the number of fluorescent dyes conjugated to biomolecules, such as enzymes and antibodies, can be estimated by counting the number of photobleaching steps.25,26 In our representative images, the two spots show stepwise transitions indicative of multiple photobleaching events in the trajectories as indicated in Fig. 3b. For statistical analysis, we compiled 97 dual positive and 94 fluorescence-only spots and, as a result, the dual positives yielded a broad distribution with 4.3 ± 0.2 average step transitions (upper panel, Fig. 3c), which is approximately two-fold higher than that of the fluorescence-only spots possessing 2.2 ± 0.1 step transitions (lower panel, Fig. 3c). According to the number of step transitions observed in the fluorescence-only positives, it was assumed that the two copies of the fluorophore were conjugated to one antibody. Therefore, we subsequently assessed that at least two anti-HA antibodies with a step transition of 4.3 are bound to a single virus particle, providing a consistent result obtained from the maximum fluorescence intensity-based calculation (Fig. 2f).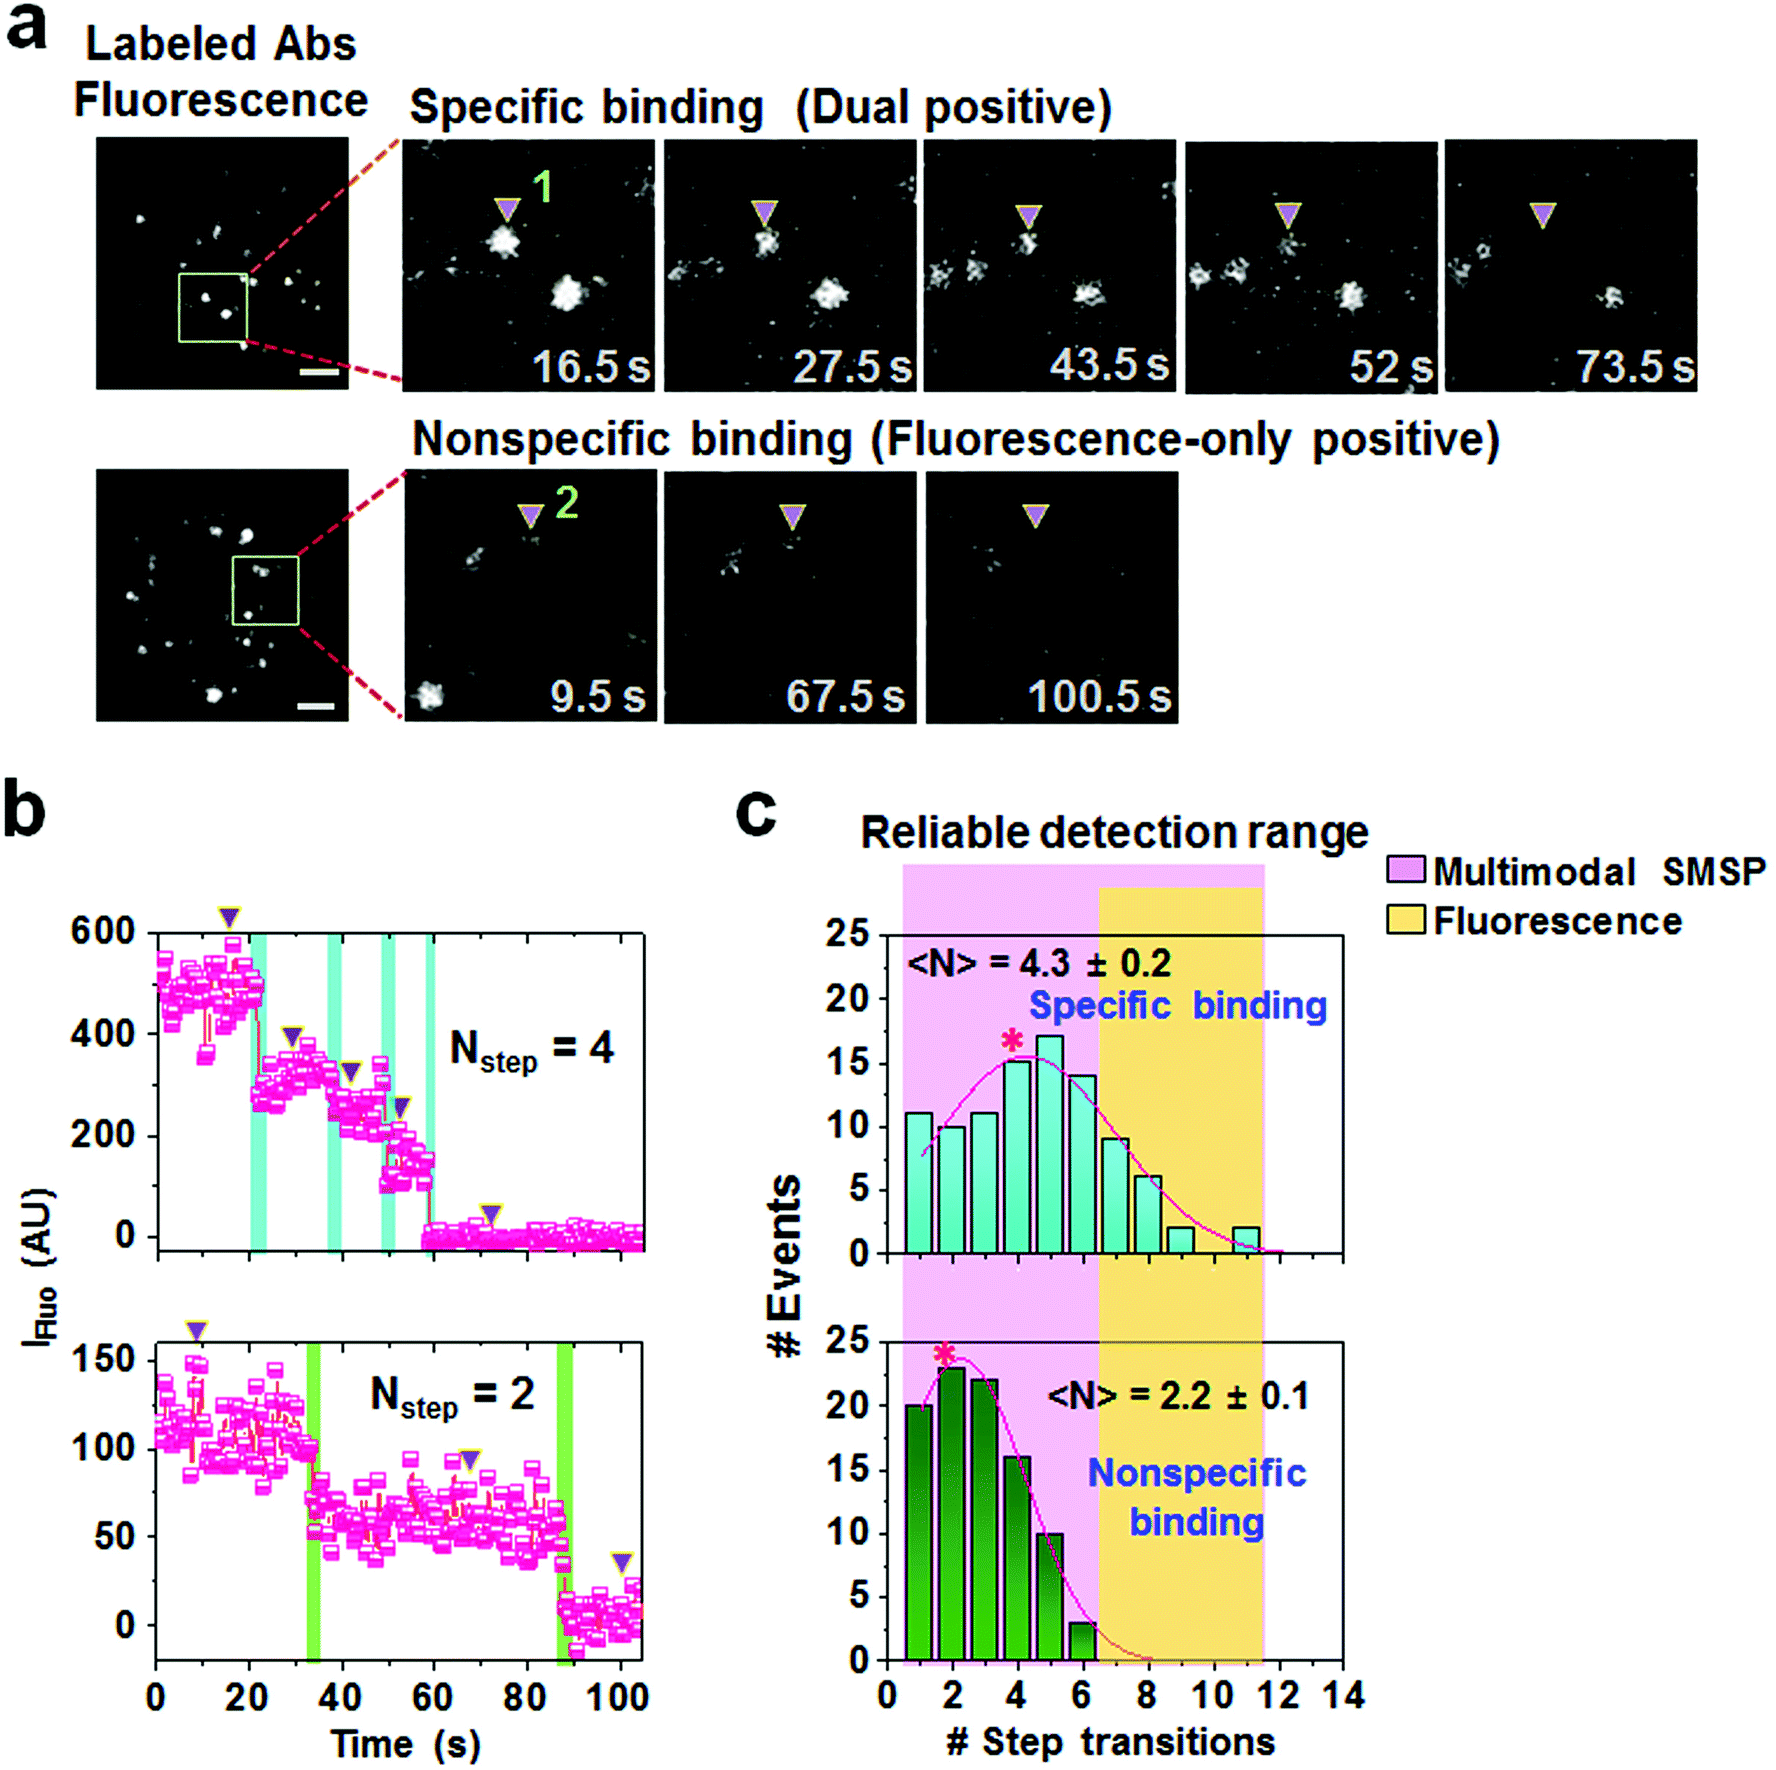 | ||
| Fig. 3 (a) Observation of the discrete photobleaching events of the labeled detection antibodies for a specific binding spot 1 (upper row) and a nonspecific binding spot 2 (lower row). The areas within the indicated rectangles in the fluorescence channels, shown in the left images, were enlarged and arrayed at selected acquisition times shown in the right parallel images. The scale bar presents 2 μm. (b) Corresponding time trajectories of the fluorescence intensities of the spots 1 (upper) and 2 (lower). The arrows in the trajectories represent the fluorescence intensities observed at the associated times in (a). (c) The statistical distribution of step transition numbers of the specific (upper) and nonspecific (lower) interactions as depicted in (b). The average values are highlighted with asterisks. | ||
Distinguishing interactions of isomeric cellular receptors to the viral particles
Practical utility of the multimodal SMSP was further applied to comparative binding analysis of low-affinity isomeric cellular receptors to the influenza virus. This approach is essential to predict viral infectivity as it has been known that cellular receptors, sialic acid α2-6-galactose β-1,4-N-acetyl glucosamine (SAα2,6-GalNAc) and sialic acid α2-3-galactose β-1,3-N-acetyl glucosamine (SAα2,3-GaNAc), preferentially bind HA of the influenza A virus isolated from humans and birds, respectively.27 Conventional studies, such as ELISA and carbohydrate microassays, utilize immobilized sialyl glycans to elucidate the receptor specificity of HA,28,29 but have an intrinsic difficulty in analyzing binding kinetics. Previously, Fei et al. reported that the two glycans, 3SL and 6SL, bind to PR8 comparably using the glycan microarray assay.30 To analyze their binding efficiency to the virus using the SMSP system, 3SL and 6SL were enzymatically synthesized and chemically labeled with Cy5.5 dye (Fig. 4a). The resulting Cy5.5-3SL and Cy5.5-6SL were independently treated with the immobilized virus. By counting the ratio of the number of dual positive spots to that of Rayleigh-positive spots, it was found that 30% or 28% of the overall virus population was bound to 3SL or 6SL, respectively (Fig. 4b), being similar to the previous report. Furthermore, the unique characteristic of SMSP microscopy allowed for selectively calculating the quantity of molecules bound specifically to single viruses. Maximal fluorescence intensities of the 170 (for 3SL) and 135 (for 6SL) dual positive spots were analyzed (upper and lower panels, in Fig. 4c). After fitting with a two-dimensional Gaussian distribution, the center values were found to be 1770 and 2840 AU for the 3SL, whereas they were 1860 and 3260 AU for the 6SL. In parallel, from the randomly chosen 170 and 135 fluorescence-only positives, we obtained single distributions centering on 1006 (for 3SL) and 1191 AU (for 6SL). Given their fold changes, it can be suggested that one PR8 virion is recognized by 2 or 3 copies of receptor molecules at an initial point, but with no preference for their isomeric structure.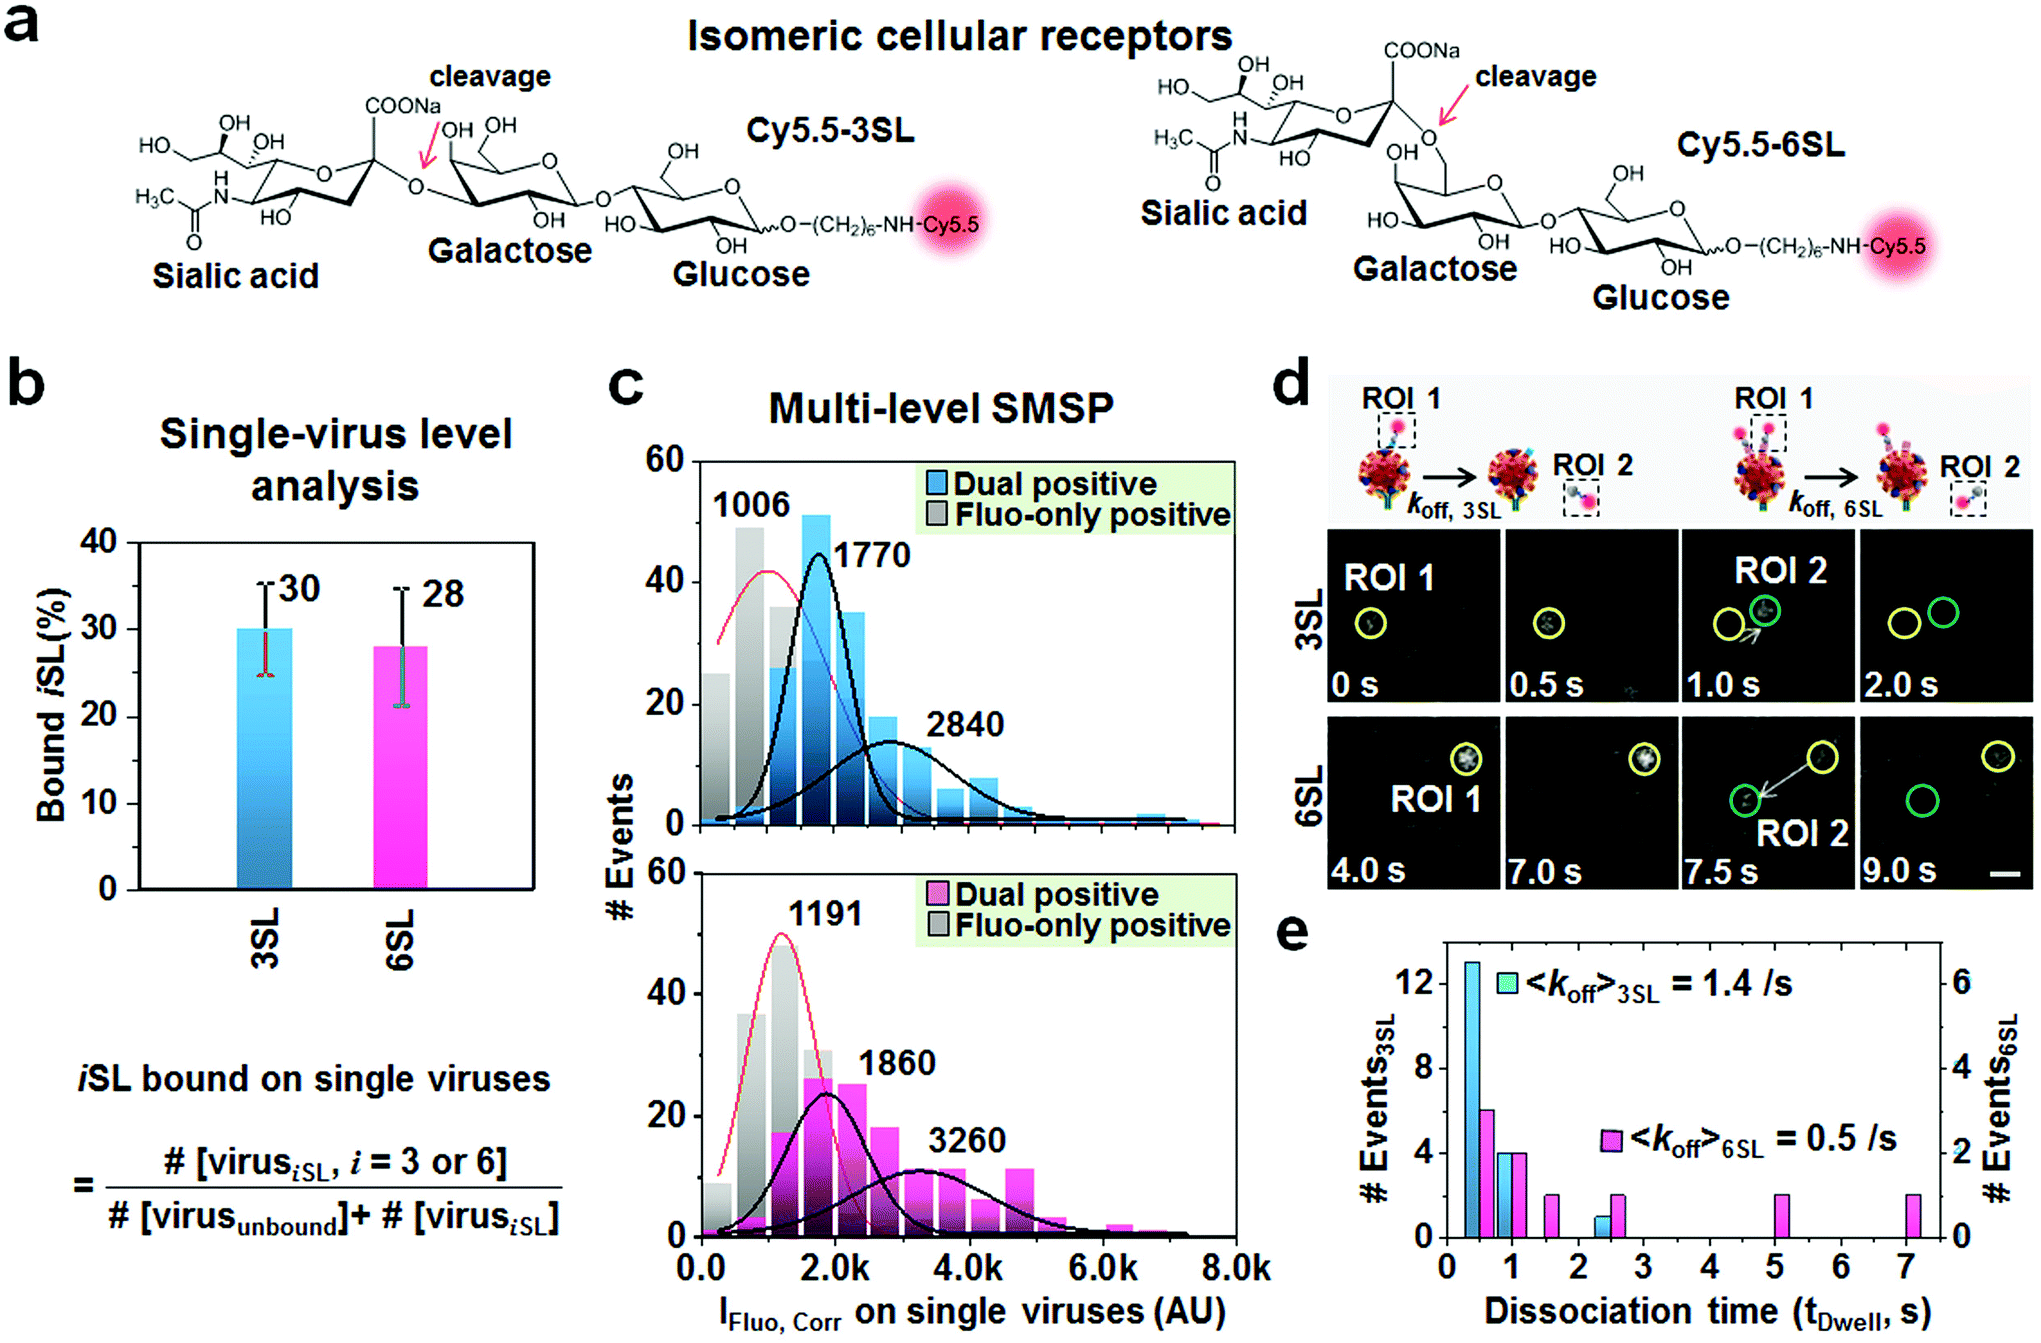 | ||
| Fig. 4 Discriminating the binding and dissociation of two sialyllactose cellular receptors to the H1N1 influenza virus. (a) Chemical structures of Cy5.5-labeled 3SL and 6SL. (b) Fractions of 3SL and 6SL receptors bound to single viruses. (c) Corrected maximal fluorescence intensity distributions of the 3SL (upper) and 6SL (lower) dual positive spots on singe viruses. (d) A schematic cartoon (upper) and two dual positive spots (yellow) demonstrating the spontaneous dissociation of 3SL and 6SL receptors after binding to the individual virions (lower). Newborn spots migrated from dual positives are marked in green circles. The scale bar presents approximately 300 nm. (e) Statistical distribution of the apparent dissociation events of 3SL (pale blue) and 6SL (pale red). | ||
Interestingly, according to the time traces of fluorescence signals from the dual positive spots above, 18 and 8 lateral movers were observed in the 3SL- and 6SL-treated samples. The representative spots displayed complete or partial departure of the fluorescent spots from the Rayleigh-positive sites (Fig. 4d and Fig. S7 and S8;† see also Movies S4 and S5† for respective areas captured with a 500 ms acquisition time). We measured their dwell times that are the duration period for which the fluorescent signals stay on the individual spots as shown in ESI Fig. S7b and S8b.† Subsequently, we found average dwell times of 0.7 and 2.2 s, respectively, implying that 3SL departs from the PR8 virus more rapidly with an apparent dissociation constant of 1.4 s−1 than 6SL with a rate of 0.5 s−1 (Fig. 4e). As a resultant, these values are approximate to the previous result from the AFM-based single-molecule force measurement combined with optical trapping and fluorescence spectroscopy that presented low interaction forces between the virus and receptor and deduced dissociation constants ranging from 0.2 to 1.2 s−1 through a combination of various influenza virus strains and cell types.31 Overall, without conducting combinatorial studies through several biophysical experiments, the multimodal SMSP enables us to uncover dynamic interactions of a cellular receptor on the viral surface by quantifying their binding preference as well as association/dissociation kinetics on single viruses.
More generally, single nanoparticle tracking studies have thus far mainly focused on the imaging of sole nanoparticles themselves to investigate biological activities, such as their intracellular penetration.8,32,33 However, the target-finding processes and interactions of nanobioparticles, such as viruses, with the cellular molecules, which play a pivotal role in cellular signal transduction or viral entry, could be unambiguously understood when multi-parametric information is collected from both interacting reactants. To the best of our knowledge, this is the first report presenting real-time imaging, at both the single molecule and single virus levels, to quantitatively rationalize kinetics of time-reversible association and dissociation. Therefore, our imaging assay can broadly contribute to related areas such as cell signaling studies and drug development involving immune regulation of antivirals or neutralizing activity of vaccinated serum against viruses.
Conclusion
In summary, we demonstrated a multi-level wide-field imaging modality that enables the simultaneous assignment of target and non-target binding events in the detection area. Its working principle is based on the ability for parallel imaging of single-nanoparticle scattering and single-molecule fluorescence emitted from viral particles and labeled antibodies (or receptors), respectively. Our microscopic methodology allows selective collection of target interactions of antibodies (proteins) or receptors (even chemicals) on the viral surface in the presence of abundant non-target events. Consequently, it was found that the surface of the influenza virus PR8 is recognized by 2 or 3 copies of anti-HA antibody or cellular receptors. Even though the virus has no binding preference for the structurally different isomeric receptors, its binding is stronger to 6SL compared to 3SL. In this regard, our work could also contribute to the optimization of conventional bulk-assays and nanobioplasmonic sensors for fundamental investigation of innate immune responses and for application to antiviral drug screening. Moreover, by diversifying detection channels combined with multiple excitation sources, selective binding of different kinds of antibodies or receptors to different subtypes of viruses can also be examined.Conflicts of interest
The authors declare no competing financial interests.Acknowledgements
Y. D. S. was supported by Bio Industrial Strategic Technology Development Program (no. 10077582) funded by the Ministry of Trade, Industry & Energy (MOTIE, Korea), and the Global Research Laboratory (GRL) Program through the National Research Foundation of Korea (NRF) funded by the Ministry of Science and ICT (no. 2016911815). M. K. was supported by the National Research Foundation of Korea (NRF) grants funded by the Korea government (MSIT) (no. NRF-2018M3A9H4089601). H. L. was supported by the NRF grant funded by MSIT (no. NRF-2019R1A2C1010514) and KRICT (no. KK2032-10). N. H. K. was supported by the National Research Council of Science & Technology (NST) grant by MSIT (no. CRC-16-01-KRICT).References
- D. K. Lim, K. S. Jeon, J. H. Hwang, H. Kim, S. Kwon, Y. D. Suh and J. M. Nam, Nat. Nanotechnol., 2011, 6, 452–460 CrossRef CAS PubMed.
- H. Lee, G. H. Kim, J. H. Lee, N. H. Kim, J. M. Nam and Y. D. Suh, Nano Lett., 2015, 15, 4628–4636 CrossRef CAS PubMed.
- K. Kim, J. W. Oh, Y. K. Lee, J. Son and J. M. Nam, Angew. Chem., Int. Ed., 2017, 56, 9877–9880 CrossRef CAS PubMed.
- P. Kukura, H. Ewers, C. Muller, A. Renn, A. Helenius and V. Sandoghdar, Nat. Methods, 2009, 6, 923–927 CrossRef CAS PubMed.
- G. G. Daaboul, A. Yurt, X. Zhang, G. M. Hwang, B. B. Goldberg and M. S. Unlu, Nano Lett., 2010, 10, 4727–4731 CrossRef CAS PubMed.
- P. Kang, P. Schein, X. Serey, D. O'Dell and D. Erickson, Sci. Rep., 2015, 5, 12087 CrossRef PubMed.
- D. Ozcelik, J. W. Parks, T. A. Wall, M. A. Stott, H. Cai, J. W. Parks, A. R. Hawkins and H. Schmidt, Proc. Natl. Acad. Sci. U. S. A., 2015, 112, 12933–12937 CrossRef CAS PubMed.
- S. M. Scherr, G. G. Daaboul, J. Trueb, D. Sevenler, H. Fawcett, B. Goldberg, J. H. Connor and M. S. Unlu, ACS Nano, 2016, 10, 2827–2833 CrossRef CAS PubMed.
- V. P. Mishin, D. Novikov, F. G. Hayden and L. V. Gubareva, J. Virol., 2005, 79, 12416–12424 CrossRef CAS PubMed.
- F. Krammer and P. Palese, Curr. Opin. Virol., 2013, 3, 521–530 CrossRef CAS PubMed.
- A. V. Cauldwell, J. S. Long, O. Moncorge and W. S. Barclay, J. Gen. Virol., 2014, 95, 1193–1210 CrossRef CAS PubMed.
- A. Weinberg and M. L. Walker, Clin. Diagn. Lab. Immunol., 2005, 12, 367–370 CAS.
- T. Ganzenmueller, J. Kluba, B. Hilfrich, W. Puppe, W. Verhagen, A. Heim, T. Schulz and C. Henke-Gendo, J. Med. Microbiol., 2010, 59, 713–717 CrossRef PubMed.
- P. Roingeard, Biol. Cell, 2008, 100, 491–501 CrossRef CAS PubMed.
- R. Vafabakhsh, K. Kondabagil, T. Earnest, K. S. Lee, Z. Zhang, L. Dai, K. A. Dahmen, V. B. Rao and T. Ha, Proc. Natl. Acad. Sci. U. S. A., 2014, 111, 15096–15101 CrossRef CAS PubMed.
- M. Kim, S. Y. Kim, H. W. Lee, J. S. Shin, P. Kim, Y. S. Jung, H. S. Jeong, J. K. Hyun and C. K. Lee, Antiviral Res., 2013, 100, 460–472 CrossRef CAS PubMed.
- R. B. Gurung, D. H. Kim, L. Kim, A. W. Lee, Z. Wang and Y. Gao, Regul. Toxicol. Pharmacol., 2018, 95, 182–189 CrossRef CAS PubMed.
- D. Kim, R. B. Gurung, W. Seo, A. W. Lee and J. Woo, Regul. Toxicol. Pharmacol., 2018, 94, 83–90 CrossRef CAS PubMed.
- Y. Ishibashi, Y. Nagamatsu, S. Meyer, A. Imamura, H. Ishida, M. Kiso, N. Okino, R. Geyer and M. Ito, Glycobiology, 2009, 19, 797–807 CrossRef CAS PubMed.
- J. C. Gadd, B. S. Fujimoto, S. M. Bajjalieh and D. T. Chiu, Anal. Chem., 2012, 84, 10522–10525 CrossRef CAS PubMed.
- Z. Zhao, J. Fu, S. Dhakal, A. Johnson-Buck, M. Liu, T. Zhang, N. W. Woodbury, Y. Liu, N. G. Walter and H. Yan, Nat. Commun., 2016, 7, 10619 CrossRef CAS PubMed.
- Y. W. Jun, S. Sheikholeslami, D. R. Hostetter, C. Tajon, C. S. Craik and A. P. Alivisatos, Proc. Natl. Acad. Sci. U. S. A., 2009, 106, 17735–17740 CrossRef CAS PubMed.
- G. L. Liu, Y. Yin, S. Kunchakarra, B. Mukherjee, D. Gerion, S. D. Jett, D. G. Bear, J. W. Gray, A. P. Alivisatos, L. P. Lee and F. F. Chen, Nat. Nanotechnol., 2006, 1, 47–52 CrossRef CAS PubMed.
- B. Hellenkamp, S. Schmid, O. Doroshenko, O. Opanasyuk, R. Kuhnemuth, S. R. Adariani, B. Ambrose, M. Aznauryan, A. Barth, V. Birkedal, M. E. Bowen, H. Chen, T. Cordes, T. Eilert, C. Fijen, C. Gebhardt, M. Gotz, G. Gouridis, E. Gratton, T. Ha, P. Hao, C. A. Hanke, A. Hartmann, J. Hendrix, L. L. Hildebrandt, V. Hirschfeld, J. Hohlbein, B. Hua, C. G. Hubner, E. Kallis, A. N. Kapanidis, J. Y. Kim, G. Krainer, D. C. Lamb, N. K. Lee, E. A. Lemke, B. Levesque, M. Levitus, J. J. McCann, N. Naredi-Rainer, D. Nettels, T. Ngo, R. Qiu, N. C. Robb, C. Rocker, H. Sanabria, M. Schlierf, T. Schroder, B. Schuler, H. Seidel, L. Streit, J. Thurn, P. Tinnefeld, S. Tyagi, N. Vandenberk, A. M. Vera, K. R. Weninger, B. Wunsch, I. S. Yanez-Orozco, J. Michaelis, C. A. M. Seidel, T. D. Craggs and T. Hugel, Nat. Methods, 2018, 15, 669–676 CrossRef CAS PubMed.
- H. Hwang, H. Kim and S. Myong, Proc. Natl. Acad. Sci. U. S. A., 2011, 108, 7414–7418 CrossRef CAS PubMed.
- H. Hwang and S. Myong, Chem. Soc. Rev., 2014, 43, 1221–1229 RSC.
- R. J. Connor, Y. Kawaoka, R. G. Webster and J. C. Paulson, Virology, 1994, 205, 17–23 CrossRef CAS PubMed.
- H. Guo, H. Rabouw, A. Slomp, M. Dai, F. van der Vegt, J. W. M. van Lent, R. McBride, J. C. Paulson, R. J. de Groot, F. J. M. van Kuppeveld, E. de Vries and C. A. M. de Haan, PLoS Pathog., 2018, 14, e1007233 CrossRef PubMed.
- L. J. Mitnaul, M. N. Matrosovich, M. R. Castrucci, A. B. Tuzikov, N. V. Bovin, D. Kobasa and Y. Kawaoka, J. Virol., 2000, 74, 6015–6020 CrossRef CAS PubMed.
- Y. Fei, Y. S. Sun, Y. Li, H. Yu, K. Lau, J. P. Landry, Z. Luo, N. Baumgarth, X. Chen and X. Zhu, Biomolecules, 2015, 5, 1480–1498 CrossRef CAS PubMed.
- C. Sieben, C. Kappel, R. Zhu, A. Wozniak, C. Rankl, P. Hinterdorfer, H. Grubmuller and A. Herrmann, Proc. Natl. Acad. Sci. U. S. A., 2012, 109, 13626–13631 CrossRef CAS PubMed.
- F. Wang, S. Wen, H. He, B. Wang, Z. Zhou, O. Shimoni and D. Jin, Light: Sci. Appl., 2018, 7, 18007 CrossRef CAS PubMed.
- E. Rothenberg, L. A. Sepulveda, S. O. Skinner, L. Zeng, P. R. Selvin and I. Golding, Biophys. J., 2011, 100, 2875–2882 CrossRef CAS PubMed.
Footnote |
| † Electronic supplementary information (ESI) available. See DOI: 10.1039/c9nr07415e |
| This journal is © The Royal Society of Chemistry 2020 |