
 Open Access Article
 This Open Access Article is licensed under a Creative Commons Attribution-Non Commercial 3.0 Unported Licence
A microfluidic double emulsion platform for spatiotemporal control of pH and particle synthesis†
Maheen
Rana
 a,
Raheel
Ahmad
b and
Annette F.
Taylor
*a
a,
Raheel
Ahmad
b and
Annette F.
Taylor
*a
aDepartment of Chemical and Biological Engineering, University of Sheffield, Sheffield S1 3JD, UK. E-mail: a.f.taylor@sheffield.ac.uk
bMassachusetts General Hospital Cancer Center and, Harvard Medical School, Boston, Massachusetts 02129, USA
First published on 15th September 2023
Abstract
The temporal control of pH in microreactors such as emulsion droplets plays a vital role in applications including biomineralisation and microparticle synthesis. Typically, pH changes are achieved either by passive diffusion of species into a droplet or by acid/base producing reactions. Here, we exploit an enzyme reaction combined with the properties of a water–oil–water (W/O/W) double emulsion to control the pH–time profile in the droplets. A microfluidic platform was used for production of ∼100–200 μm urease-encapsulated double emulsions with a tuneable mineral oil shell thickness of 10–40 μm. The reaction was initiated on-demand by addition of urea and a pulse in base (ammonia) up to pH 8 was observed in the droplets after a time lag of the order of minutes. The pH–time profile can be manipulated by the diffusion timescale of urea and ammonia through the oil layer, resulting in a steady state pH not observed in bulk reactive solutions. This approach may be used to regulate the formation of pH sensitive materials under mild conditions and, as a proof of concept, the reaction was coupled to calcium phosphate precipitation in the droplets. The oil shell thickness was varied to select for either brushite microplatelets or hydroxyapatite particles, compared to the mixture of different precipitates obtained in bulk.
Introduction
Droplet emulsion and synthetic vesicle systems have been widely employed as bioinspired micro- or nanoreactors for production of materials such as hydrogels, protein crystals and ceramic particles.1–6 They also provide a test platform for biomimetic cell-like behaviour, including motion, division and communication.7–16 One of the most important parameters for controlling chemical processes in cells or droplets is the pH.17,18 For initiating particle synthesis, changes in pH have been mainly achieved by passive diffusion of acidic or basic species into the droplets, for example ammonia and tetramethylethylenediamine (TEMDA).19,20 With larger molecules, these processes can be slow and result in an internal gradient in pH. Concentrated solutions result in faster transport but also have the potential for droplet-particle deformation.20 Changes in pH have also been achieved under relatively mild conditions in vesicles with encapsulated enzymes.21,22 Generally, these reactions are accompanied by changes in the pH in the external solution as a result of the fast transport of weak acids or bases out of the compartment, requiring additional methods for internal regulation of the pH.23 Other methods of pH control in microreactors involve external intervention, such as electrochemical stimulation.24,25Herein, we controlled the pH–time profile in microdroplets by exploitation of the properties of a water–oil–water (W/O/W) double emulsion with the enzyme urease encapsulated in the aqueous core. This enzyme catalyses the hydrolysis of urea to form ammonia and carbon dioxide and is widely found in plant seeds and cellular systems such as bacteria.26 The reaction can display feedback driven by base production and a switch from acid to base with pH ∼ 9 after an induction period (or clock time).27 Urease has been compartmentalised in liposomes, polymerosomes, hydrogels, etc. and the reaction has been triggered by addition of urea for bioinspired material applications.28–35 Encapsulating urease in W/O/W double emulsions resulted in a localised pulse in ammonia with a tuneable steady state pH, balanced by the rate of diffusion of urea in and ammonia out of the droplet. W/O/W emulsions are frequently used as templates for liposome formation by removal of the oil;36–38 however the oil shell can be used to control the diffusion time of neutral species and hence the pH change, in contrast to earlier studies with phospholipid membranes or polymer shells.
Double emulsion droplets have been prepared using microfluidics for easy manipulation of droplet size and the shell to core ratio.37,39,40 Droplet-based microfluidics provides a method for encapsulation of species resulting in higher encapsulation efficiencies compared to other methods with the added advantages of monodispersity, reproducibility, and high throughput.41,42 Microdroplets can give better control over conditions for synthesis of particles and crystals compared to bulk solutions43,44 and the reactive double emulsions with urease can be used to fine-tune the pH for material applications. The reaction is fast compared to internal mixing, thus ensuring a uniform pH change in 100 μm droplets, and the pH–time profile can be manipulated by parameters such as the oil shell thickness.
Urease plays an important role in biomineralisation, driving calcium carbonate formation both in natural environments and for engineering applications.45–48 Calcium phosphate particles have important uses in the medical and food industry,49,50 and the urease reaction may provide a benign route for particle formation; however in the presence of phosphates, typically a mixture of calcium phosphate and calcite are formed.49,51 Here, urease double emulsion droplets were used for selection of either brushite microplatelets which form at pH ∼ 6, or particles of hydroxyapatite at a higher pH of ∼ 7, depending on the oil shell to core ratio. No calcite was obtained as the steady state pH was maintained below 8. Thus, the pH-pulse in the double emulsions was tuned for the selection of one polymorph when typically multiple polymorphs are formed in bulk solution. This general approach may be used with other acid or base producing enzyme reactions to provide spatiotemporal control of pH for material formation under mild conditions.
Experimental section
Chemicals
The following stock solutions were prepared in distilled deionized water: urea (66612, Sigma) [urea] = 0.6 M, acetic acid (100% glacial acetic acid, Sigma-Aldrich) [CH3COOH] = 0.05 M, urease (type III Jack bean U1500-20KU, typically 25![[thin space (1/6-em)]](https://www.rsc.org/images/entities/char_2009.gif) 920 units per g solid, Sigma-Aldrich) [urease] = 350 units per mL (U mL−1), 8-hydroxypyrene-1,3,6-trisulfonic acid (pyranine, cat no. L11252.14, Alfa Aesar) [pyr] = 0.2 mM, glucose (G5400, D-(+)-glucose, minimum 99% GC, Sigma-Aldrich) [glucose] = 1 M, sucrose (≥99.5% GC, Sigma-Aldrich) [sucrose] = 1 M, Pluronic F-127 (Sigma-Aldrich) [PF-127] = 2%, glycerol (87%, Sigma-Aldrich) [glycerol] = 20%, polyvinyl alcohol (P8136, 87–90% hydrolyzed, avg. M.W. 30000–70000, Sigma-Aldrich) [PVA] = 1%, and calcium chloride (CAS. 10035-04-8, Sigma-Aldrich) [CaCl2·2H2O] = 0.3 M. 1-Palmitoyl-2-oleoyl-sn-glycero-3-phosphocholine (P516, Anatrace), [POPC] = 6.5 mM, was prepared in mineral oil (light oil, M5904, density 0.84 g mL−1 at 25°C, Sigma-Aldrich), sorbitan monooleate (Span-80, 85548, viscosity 1000–2000 mPa s at 20 °C), and Nile red (Sigma-Aldrich).
920 units per g solid, Sigma-Aldrich) [urease] = 350 units per mL (U mL−1), 8-hydroxypyrene-1,3,6-trisulfonic acid (pyranine, cat no. L11252.14, Alfa Aesar) [pyr] = 0.2 mM, glucose (G5400, D-(+)-glucose, minimum 99% GC, Sigma-Aldrich) [glucose] = 1 M, sucrose (≥99.5% GC, Sigma-Aldrich) [sucrose] = 1 M, Pluronic F-127 (Sigma-Aldrich) [PF-127] = 2%, glycerol (87%, Sigma-Aldrich) [glycerol] = 20%, polyvinyl alcohol (P8136, 87–90% hydrolyzed, avg. M.W. 30000–70000, Sigma-Aldrich) [PVA] = 1%, and calcium chloride (CAS. 10035-04-8, Sigma-Aldrich) [CaCl2·2H2O] = 0.3 M. 1-Palmitoyl-2-oleoyl-sn-glycero-3-phosphocholine (P516, Anatrace), [POPC] = 6.5 mM, was prepared in mineral oil (light oil, M5904, density 0.84 g mL−1 at 25°C, Sigma-Aldrich), sorbitan monooleate (Span-80, 85548, viscosity 1000–2000 mPa s at 20 °C), and Nile red (Sigma-Aldrich).
A urease type III (25920 U g−1) solution was prepared by addition of the powder to water to give a certain concentration U mL−1. To determine the concentration of the enzyme, urease was fluorescently labelled using an AnaTag™ HiLyte™ Fluor 488 microscale protein labeling kit (see the ESI† for further information). A 350 U mL−1 stock solution contained 1.04 ± 0.02 μM enzyme. The concentration of free orthophosphate in the urease type III (25920 U g−1) solution was determined using a phosphate assay kit (MAK308, Sigma-Aldrich). A solution of 0.02 U mL−1 had a total concentration of [phosphate]T = 32 ± 4 μM.
Preparation of microfluidic reservoir solutions
The lipid-oil solution (middle flow reservoir in the microchannel, MF) contained 6.5 mM POPC dissolved by sonication in mineral oil (MO) and 2% Span-80 for three hours at room temperature using an ultrasonic bath (FB15051, Fisherbrand). Phospholipids enhance W/O/W emulsion stability.52 The inner solution (IS) reservoir contained sucrose (0.2 M), pyranine (50 μM), urease (50 U mL−1), acetic acid (1 mM), and Pluronic F-127 (0.28%), unless otherwise stated. Calcium chloride (0.1 M and 0.15 M) was also added to the IS for the experiments involving mineral precipitation. The outer solution (OS) reservoir contained glucose (0.2 M), glycerol (20%), Pluronic F-127 (0.28%), and acetic acid (1 mM). Sucrose and glucose were added to the IS, OS and external solution (next section) to reduce osmotic imbalance during the enzyme reaction. Pluronic F-127 was used to act as a surfactant to avoid coalescence and to increase the stability of the double emulsions.53 Glycerol was incorporated in the OS to increase the viscosity of the aqueous phase to enhance the shearing of the oil by the continuous phase. To visualise the enzyme in the droplets, urease and pyranine in the inner solution were replaced with HiLyte™ Fluor 488 labelled-urease from a stock solution of 350 U mL−1 (1.04 ± 0.02 μM). The enzyme-dye was diluted to 50 U mL−1 (0.14 μM) in the inner solution and loaded into the emulsion droplets.On-chip generation of W/O/W double emulsions
We used a flow-focusing device with two droplet formation junctions to synthesize the double emulsion (see the ESI† and Fig. S1 and S2). The design of the PDMS-microfluidic device was based on the work of Teh et al.37 The polydimethylsiloxane (PDMS) microchannel was fabricated using conventional soft lithography.54,55 The first junction of the channel has a hydrophobic surface to allow the formation of W/O (water in oil) droplets while the second junction is hydrophilic (PVA coated, Fig. S1†) to preferentially make O/W (oil in water) droplets, thus forming W/O/W double emulsions at the end of the microfluidic device.56,57 A pressure-driven pump (OB1 MK3+, Elveflow, Paris, France) was used to transport both the aqueous inner and outer solutions (IS and OS) and the lipid-oil middle fluid (MF) at a persistent flow and a 2 mL Eppendorf tube was used as a collection vial for the double emulsions (Fig. S2†).The channel geometry and inlet flow rates of the solutions can be changed to control the size of the emulsion droplets; we manipulated the pressure flows of the IS, MF, and OS to obtain the desired size and the shell/core ratio. In a typical experiment, W/O droplets at the first junction were obtained with the IS at PIS = 36 mbar and the MF at PMF = 69 mbar, or, the flow pressures were varied with a fixed ratio of PMF/PIS ∼ 2, and the double emulsions were obtained by adding the OS at POS = 19 mbar. Larger droplets were obtained by varying the pressures and changing the ratio PMF/PIS, and thicker oil shells were obtained by increasing PMF/PIS.
Reaction observation, imaging, and analysis
For the reaction, the double emulsions were mixed with an equal volume of an external solution (ES) containing acetic acid (1 or 2 mM), glucose (0.2 M), and urea (0.04–0.07 M) and 1 μL of the mixed solution was immediately injected into a reaction chamber. We either used CoverWell™ perfusion chambers (800–900 μm diameter and 1200 μm depth) or assembled our own chambers from double-sided tape (source) with a circular hole (1000 μm diameter × 200 μm depth), and sealed with a coverslip (Fig. S3†).We used pyranine as a fluoroprobe to observe the increase in pH due to the formation of ammonia inside the microreactors. For determination of the apparent pH in the droplets, a calibration curve of pH vs. ratio of fluorescence intensities F458/F405 was used (Fig. S4†). Ratiometric measurements of fluorescence intensity were obtained with a Leica TCS SP8 confocal microscope using a 405 nm and 458 nm laser consecutively for excitation and the emission wavelength range of 485–555 nm. The reaction was also monitored using an inverted fluorescence microscope (Etaluma LS560). For the urease-driven precipitation, the calcium phosphate and calcium carbonate crystals were characterized using a Senterra II Raman confocal microscope (Bruker) with an excitation wavelength of 532 nm, and power of 25 mW (see the ESI†).
Analysis of images was performed with a combination of ImageJ and MATLAB (version R2020a). A MATLAB code was developed to track individual emulsions in the case of droplet motion and the sizes of the shell and aqueous core were determined from the brightfield images (Fig. S5†). The intensity in time was obtained from the average intensity of a droplet in fluorescence images and the induction time was determined as the time to reach the maximum rate of change of fluorescence intensity. The apparent area associated with the formation of calcium phosphate crystals was determined using ImageJ (see ESI† Fig. S12).
Results and discussion
Production of urease-encapsulated W/O/W double emulsions
The microfluidic device had three inlets for the inner solution (IS) phase, the lipid-oil (MF) phase, and the outer solution (OS) phase (Fig. 1A). Two successive flow-focusing (droplet formation) junctions were included on the chip. The IS (sucrose, urease, acetic acid, PF-127, and pyranine) was sheared with the MF (POPC, mineral oil (MO), and Span-80) into monodispersed droplets at the first droplet forming junction to form a single W/O emulsion (Fig. 1B). The single droplets were then sheared in the second flow-focusing junction with the ‘OS’ (glucose, glycerol, acetic acid, and PF-127), thus resulting in the formation of W/O/W double emulsions (Fig. 1C). The double emulsions were collected from the outlet Eppendorf tube and mixed with the external solution (ES) off-chip to initiate the reaction (Fig. 1D).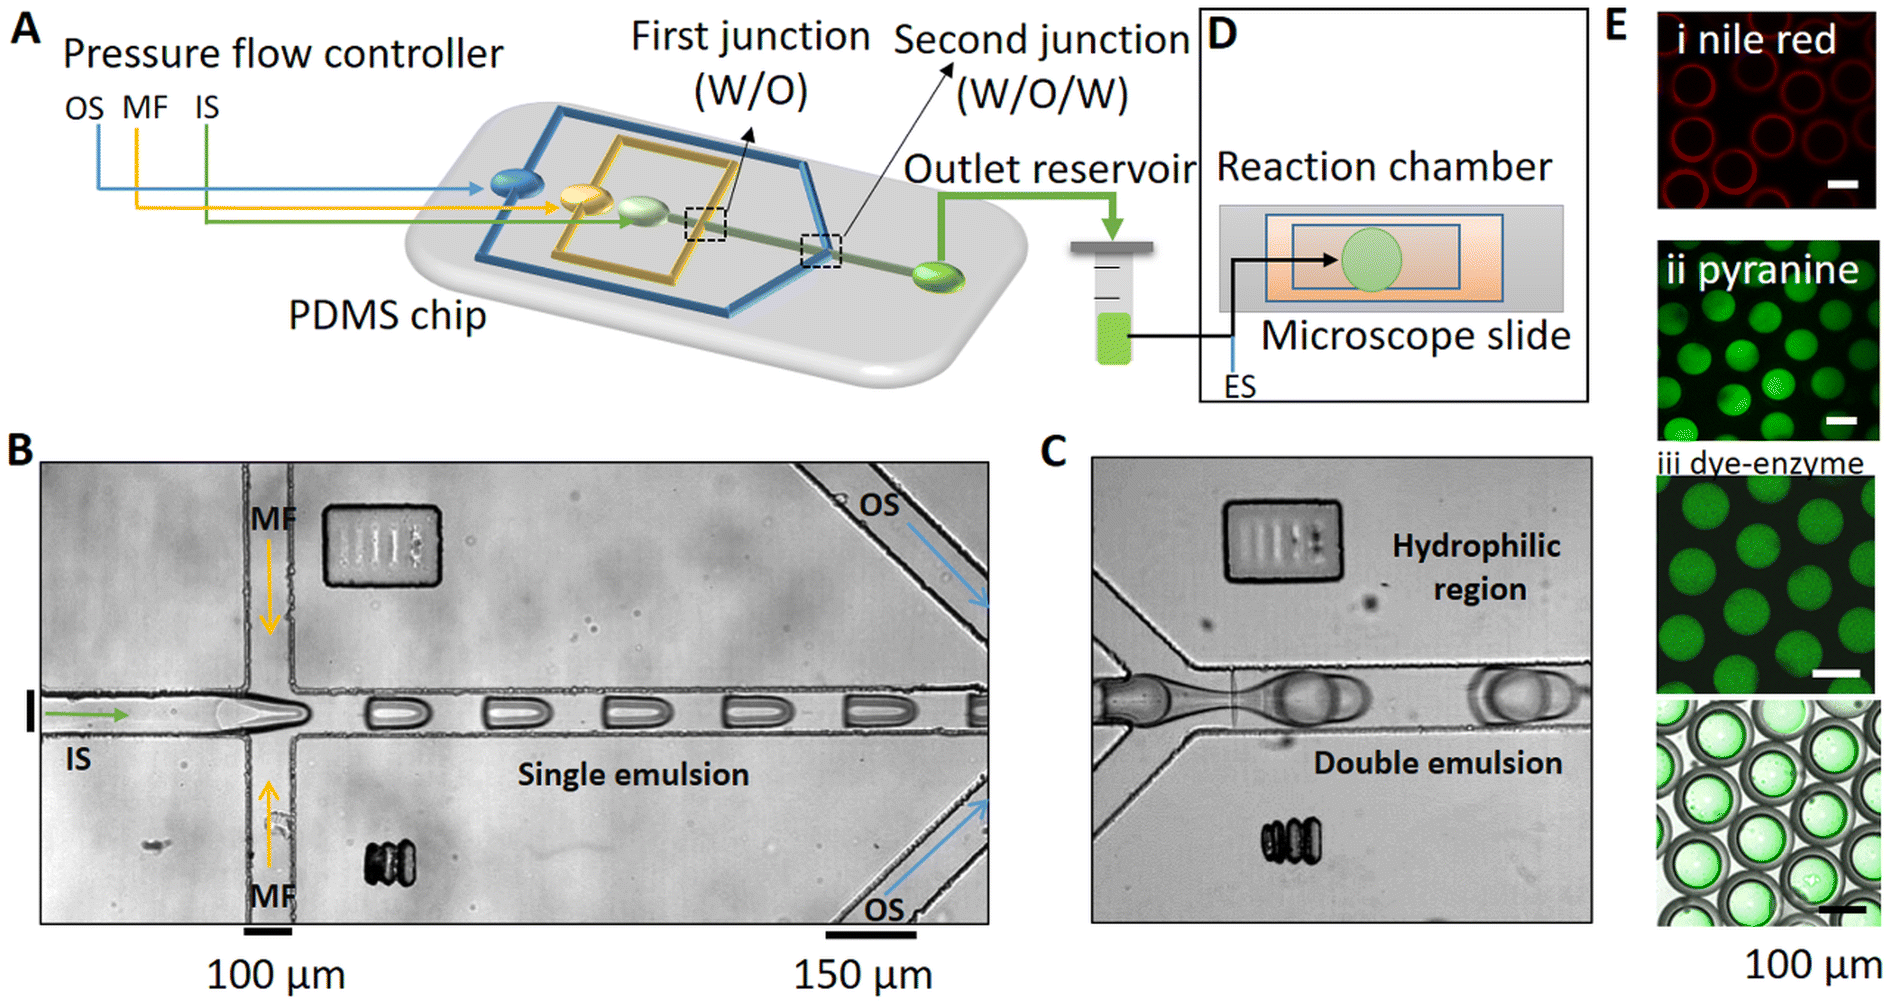 | ||
| Fig. 1 Synthesis of urease-encapsulated water–oil–water double emulsions. (A) Schematic representation of the microfluidic device with three inlets comprising the outer solution (OS) middle fluid (MF) and inner solution (IS), and two flow focussing junctions (first (W/O) and second (W/O/W) junctions). (B) and (C) Microscopy images of single droplets and double emulsions on-chip, captured using phase-contrast microscopy (Leica DMi8, 10× magnification): (B) water in oil (W/O) droplets are formed when the IS (urease, sucrose, acetic acid, PF-127, pyranine) is sheared by the MF (POPC, mineral oil, Span-80) at the first junction, (D) which then enters the second junction where droplets are sheared by the OS (glucose, glycerol, PF-127, acetic acid). (D) Off-chip imaging of the reaction after mixing of the double emulsions with the external solution (ES) containing urea and acid. (E) Confocal images of the double emulsions with (i) Nile red localized lipids in the MF, (ii) the fluoroprobe pyranine in the IS and (iii) HiLyte™ Fluor 488 labelled-urease in the IS (top) and superposition of fluorescence image and brightfield image (bottom). | ||
The distribution of species in the lipid-oil shell and inner aqueous core of the emulsion droplets can be observed in the confocal images shown in Fig. 1E. Nile red (0.01%) was added to the middle fluid to locate and visualize lipids in the oil layer (Fig. 1Ei) and the pH dependent fluorescent probe pyranine was visible in the aqueous core (λex = 405, λem = 490–500 nm, Fig. 1Eii). In separate experiments, the HiLyte™ Fluor 488 labelled-urease of 50 U mL−1 concentration (0.14 μM) was also observed to be uniformly distributed in the aqueous core of the droplets (Fig. 1Eiii). Both pyranine and the enzyme were confined to the aqueous core, as determined by superposition of the fluorescence and brightfield images.
A pH pulse in urease-encapsulated W/O/W double emulsions
The urease reaction has been well studied in batch reactors, and the rate depends on the initial concentration of urea, enzyme and acid.27 With relatively high concentrations of the enzyme, the pH increases rapidly to pH 7, and then more slowly to pH ∼ 9; the enzyme has a bell-shaped rate–pH curve with a maximum at pH 7 (Fig. 2A and S6†).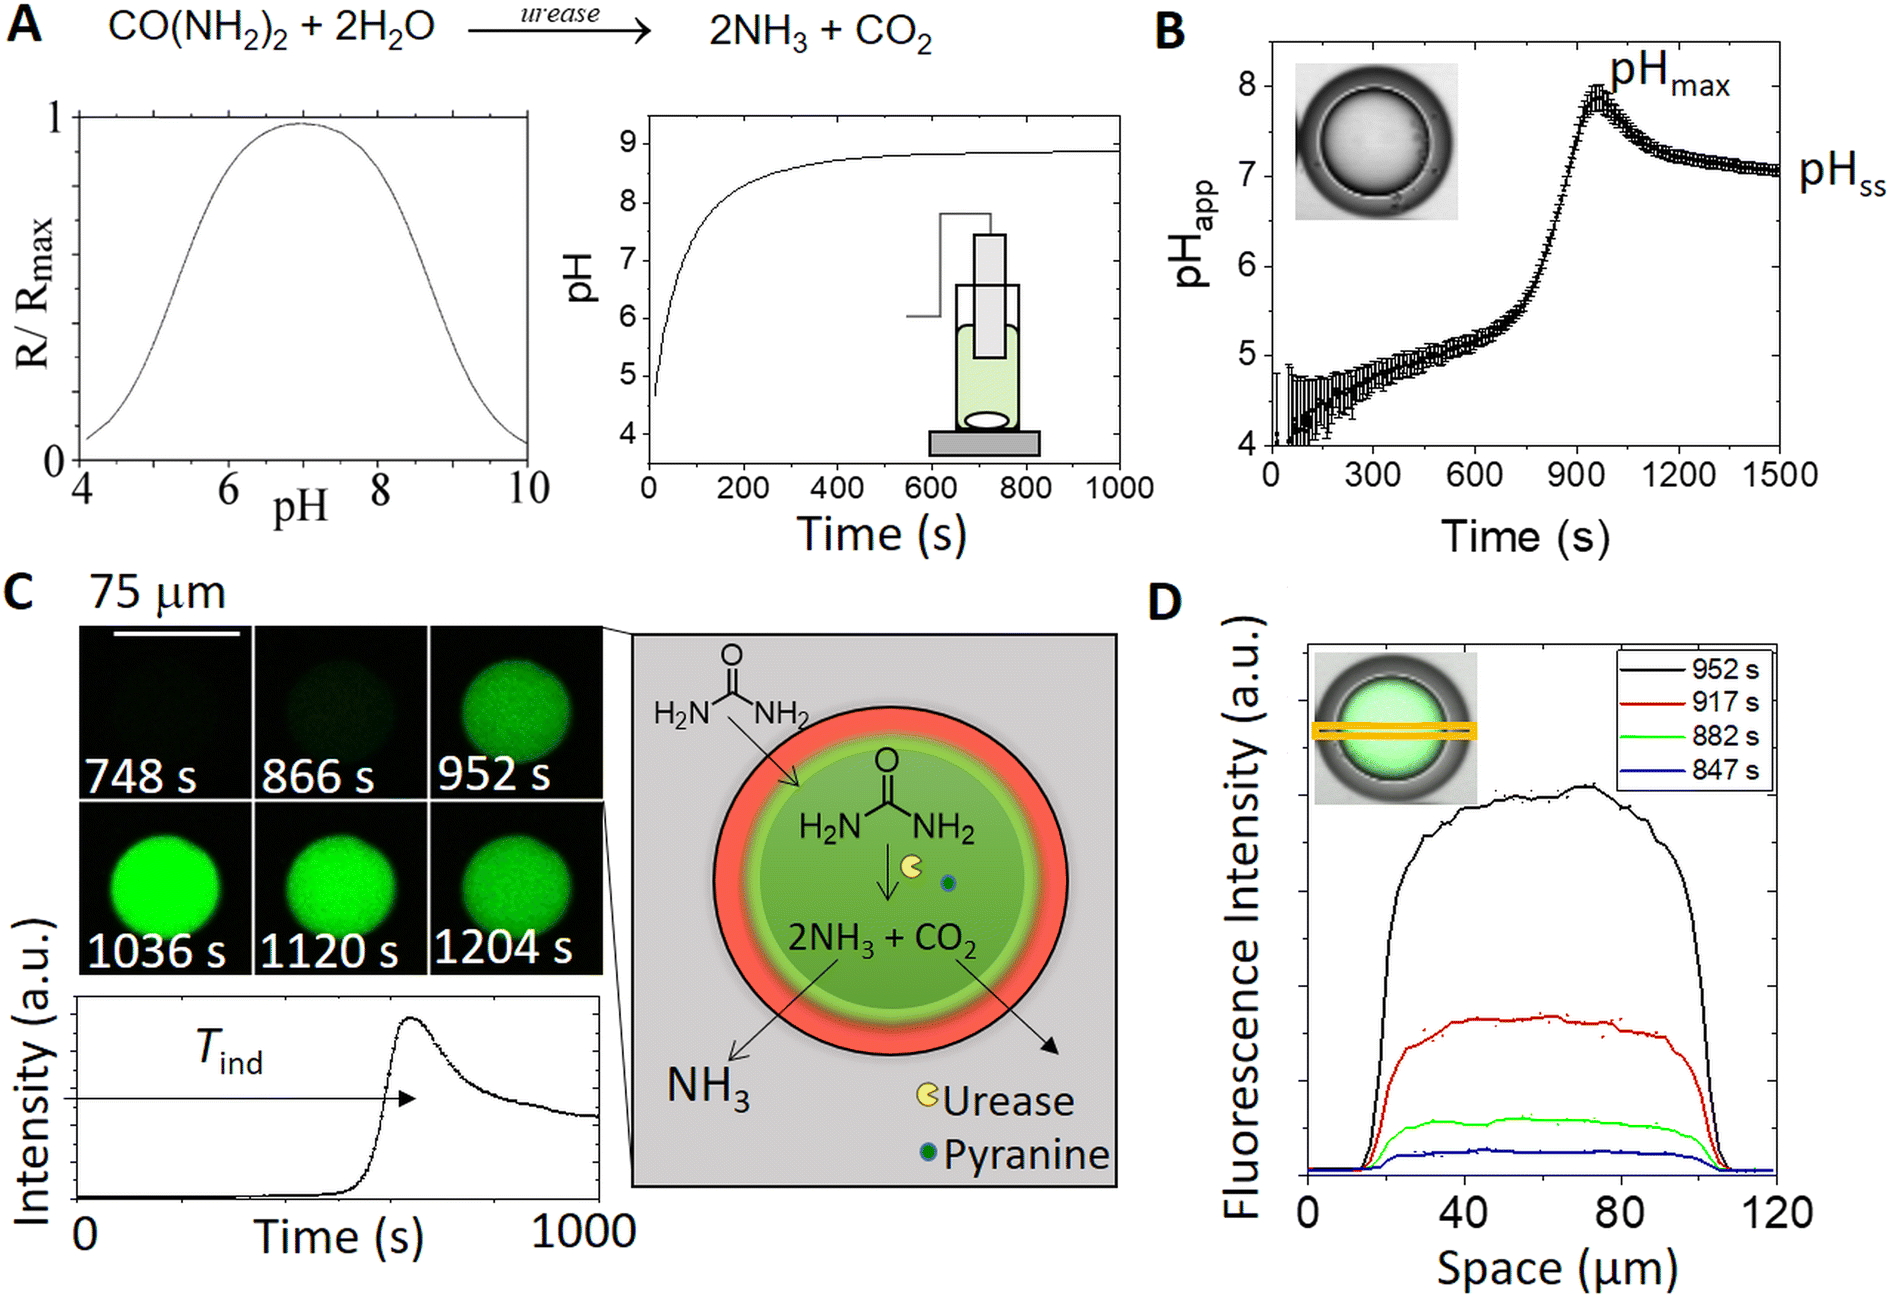 | ||
| Fig. 2 Comparison of typical pH time profiles in a batch reactor (2.8 ml) and in a urease-encapsulated double emulsion microreactor with concentrations of [urea] = 0.07 M; [acetic acid] = 2 mM; [urease] = 50 U mL−1; [pyranine] = 50 μM; [phosphate]T = 80 mM. (A) Rate–pH curve for urease (plotted from the relationship with experimentally-determined parameters, see the ESI†) and pH in time in a batch reactor. (B) Apparent pH in time in a double-emulsion droplet (from confocal images and calibration curve, Fig. S4†); induction time Tind = the time to reach the maximum rate of change of fluorescence; maximum pH = pHmax, and steady state pH = pHss. (C) A series of images obtained using confocal microscopy showing the increase in fluorescence (λex = 458 nm) in a droplet in time with the pH-dependent fluoroprobe pyranine. Schematic illustration of the process: urea permeates through the oil layer and is locally hydrolysed by urease, producing ammonia and carbon dioxide. (D) Average fluorescence intensity across the centre of the droplet (area indicated in the inset image) at different times. | ||
In the double emulsion droplets, there was a pulse in pH characterized by a lag time, or induction time Tind, before a sudden increase to the maximum pH (pHmax ∼ 8) and then a slow decrease to the steady state pH, pHss ∼ 7 (Fig. 2B). The apparent pH (calculated from a calibration plot, Fig. S4†) depends on the transport rate of species between the droplet and external solution, as well as the reaction rate. We assume here that transport involves diffusion of urea and ammonia through the oil; however, it may be facilitated by the surfactant and other mechanisms such as the formation of reverse micelles that may play a role.58
A series of images of the reaction in a double emulsion droplet and intensity in time are shown in Fig. 2C. Initially, droplets were at low pH (low intensity). Urea was transported across the oil layer from the solution and was hydrolyzed in the aqueous core of the droplet, forming ammonia. There was a rapid increase in the fluorescence, followed by a slight decrease to steady state in which the rate of reaction in the droplet matched the rate of loss of ammonia to the external solution. The fluorescence intensity increased uniformly across the whole droplet (Fig. 2D), indicating fast internal mixing relative to the reaction timescale.
Control of the pH–time profile in the W/O/W double emulsions
The characteristic features of the pH time profile, Tind and pHss, can be controlled by manipulation of the transport rates of urea and ammonia between the double emulsion droplets and external solution. In a typical experiment, 50–100 double emulsions were spatially distributed in the reaction chamber and the fluorescence in a group of droplets is shown in the series of images in Fig. 3A. In contrast to earlier studies with liposomes or polymerosomes, each microreactor behaved virtually independently and a distribution of induction times was obtained.23 The oil shell provided a barrier between the core and external solution, such that the diffusion of ammonia was greatly reduced and there was a slow increase in pH in the external solution (Fig. S7†); the induction time depended on the layer depth (Fig. 3B). Localised pH changes have only otherwise been achieved with photosynthetic membrane proteins or by external buffering.59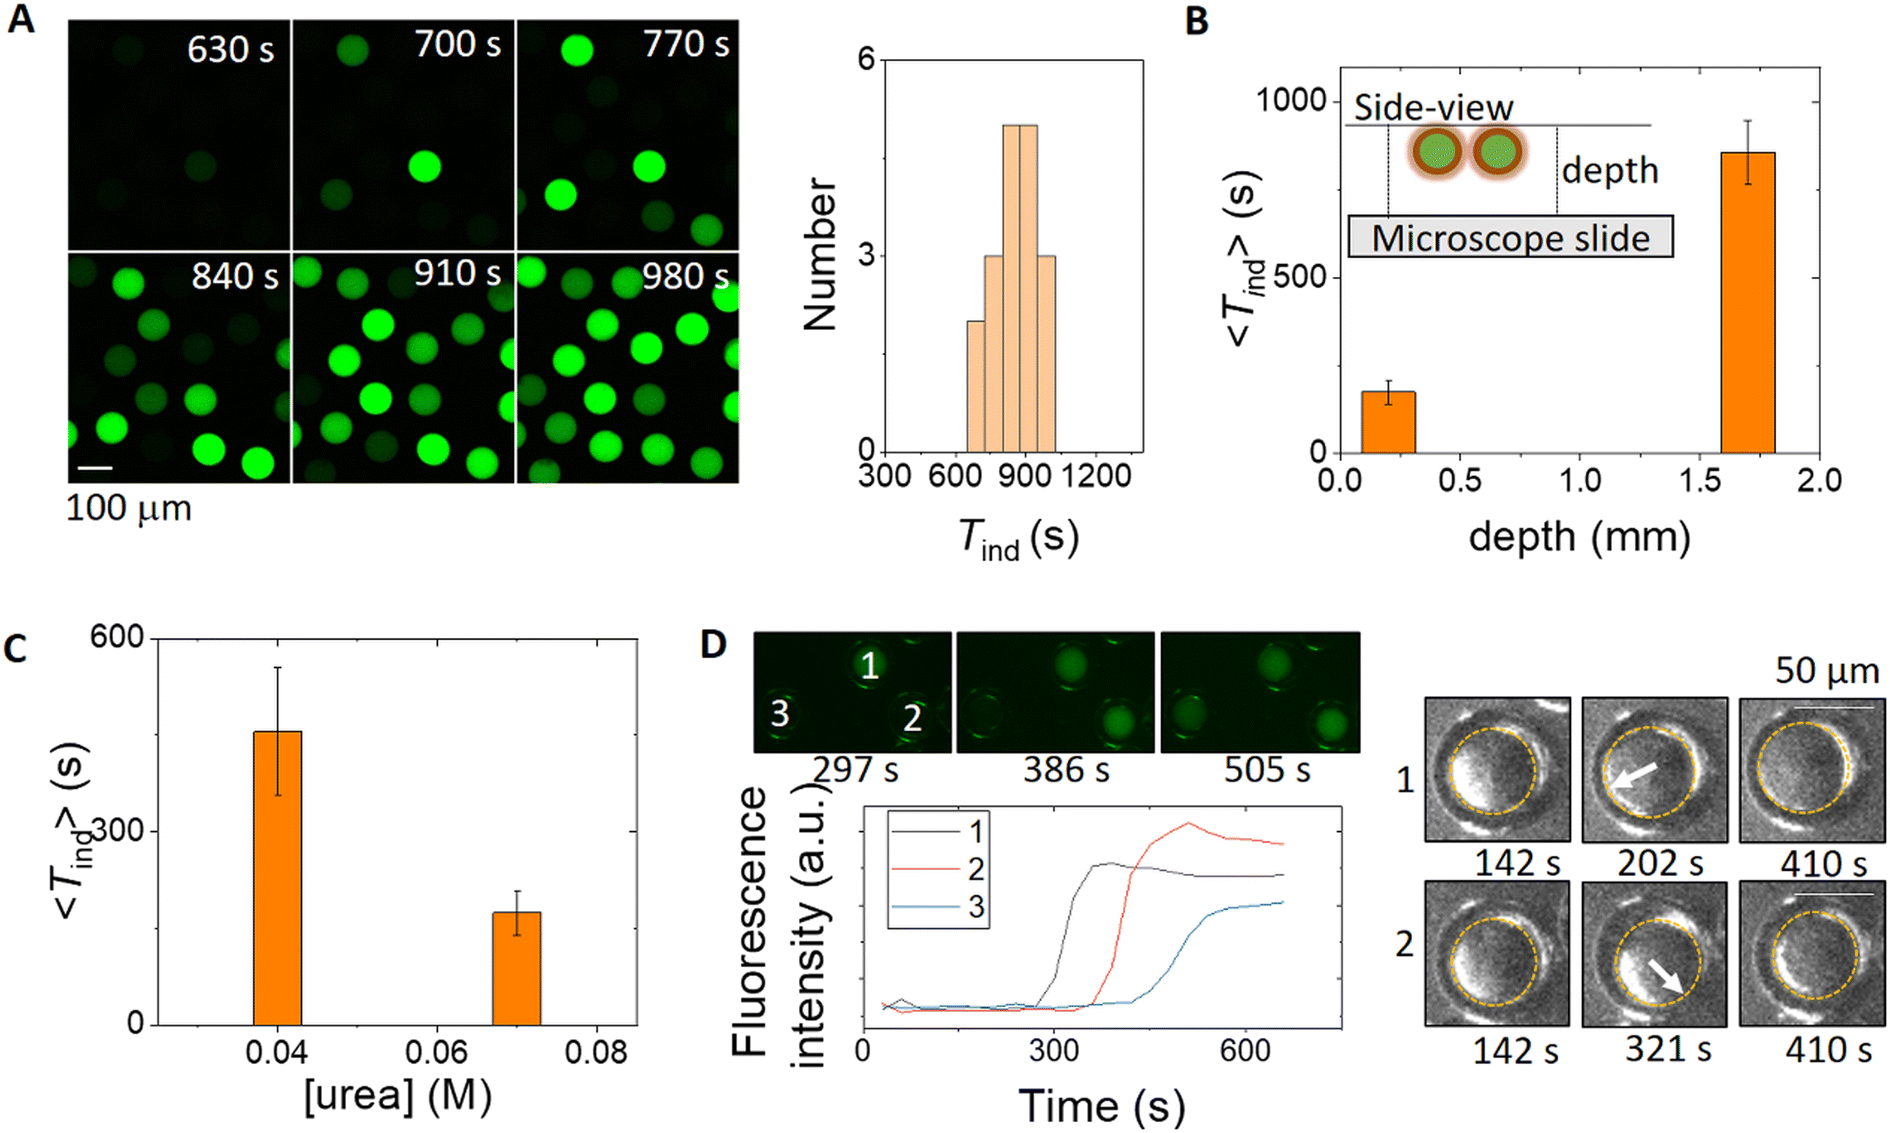 | ||
| Fig. 3 Factors affecting the induction time in the droplets. (A) Fluorescence images of 20 droplets in time and corresponding distribution of induction times at a reaction layer depth of 1700 μm (concentrations: [urea] = 0.07 M, [pyranine] = 50 μM, [AA] = 2 mM, and [urease] = 50 units per mL, [phosphate]T = 80 mM). (B) Average induction time as a function of solution depth; the same concentrations as those in A. (C) Average induction time as a function of urea concentration in reaction chamber of depth 200 μM. Standard deviations from 20 droplets. (D) Fluorescence images of the reaction in 3 droplets (concentrations: [urea] = 0.04 M, [pyranine] = 50 μM, [AA] = 2 mM, [urease] = 50 U mL−1, [phosphate]T = 80 mM) and the right part showing brightfield images with the inner motion of aqueous droplets in 1 and 2 resulting in thinning of the oil layer before the reaction occurs. | ||
The average induction time across a population was controlled by the bulk concentration of urea and decreased with an increase in urea concentration (Fig. 3C). It is unlikely that there is a variation in enzyme concentration in different droplets, but the distribution of induction times within a population may result from structural variations between droplets. In some experiments, the motion of the inner core was observed to contribute to the induction time, as illustrated in Fig. 3D; the reaction occurs first in droplet 1 after the core moved, followed by droplet 2 and finally droplet 3 with no core motion. The thinner shell during droplet motion resulted in a faster increase of urea in the droplet and therefore accelerated the reaction. We also note that some droplets were unstable, particularly in experiments with a lower PF-127 concentration or thinner shells, and both partial dewetting and bursting were observed (Fig. S8†). The reaction was faster in partially dewetted droplets (Fig. S9†).
A non-monotonic change in pH is difficult to achieve in the urease reaction and usually involves coupling the process with additional reactions or external processes such as light-driven proton production; here we used the emulsion properties to control the pH–time profile in the droplets. The rate of change of pH in the droplets depended on factors including the oil shell thickness relative to the core size. In general, an increase in the pressure ratio PMF/PIS results in an increase in S/C, with smaller cores and thicker shells (Fig. 4A). By manipulation of both the internal pressure PIS and PMF, samples could be obtained with a larger core size at fixed S/C. The clock time increased with increasing shell/core ratio (Fig. 4A and B) and the maximum rate of change of pH decreased (Fig. 4C) as a result of the longer time taken for urea to cross the oil layer. Unlike in bulk solutions, the reaction can approach the steady state pH with values below or above 7, and pHss increased with increasing S/C as the ammonia transport out of the droplet was reduced in emulsions with thicker shells (Fig. 4D).
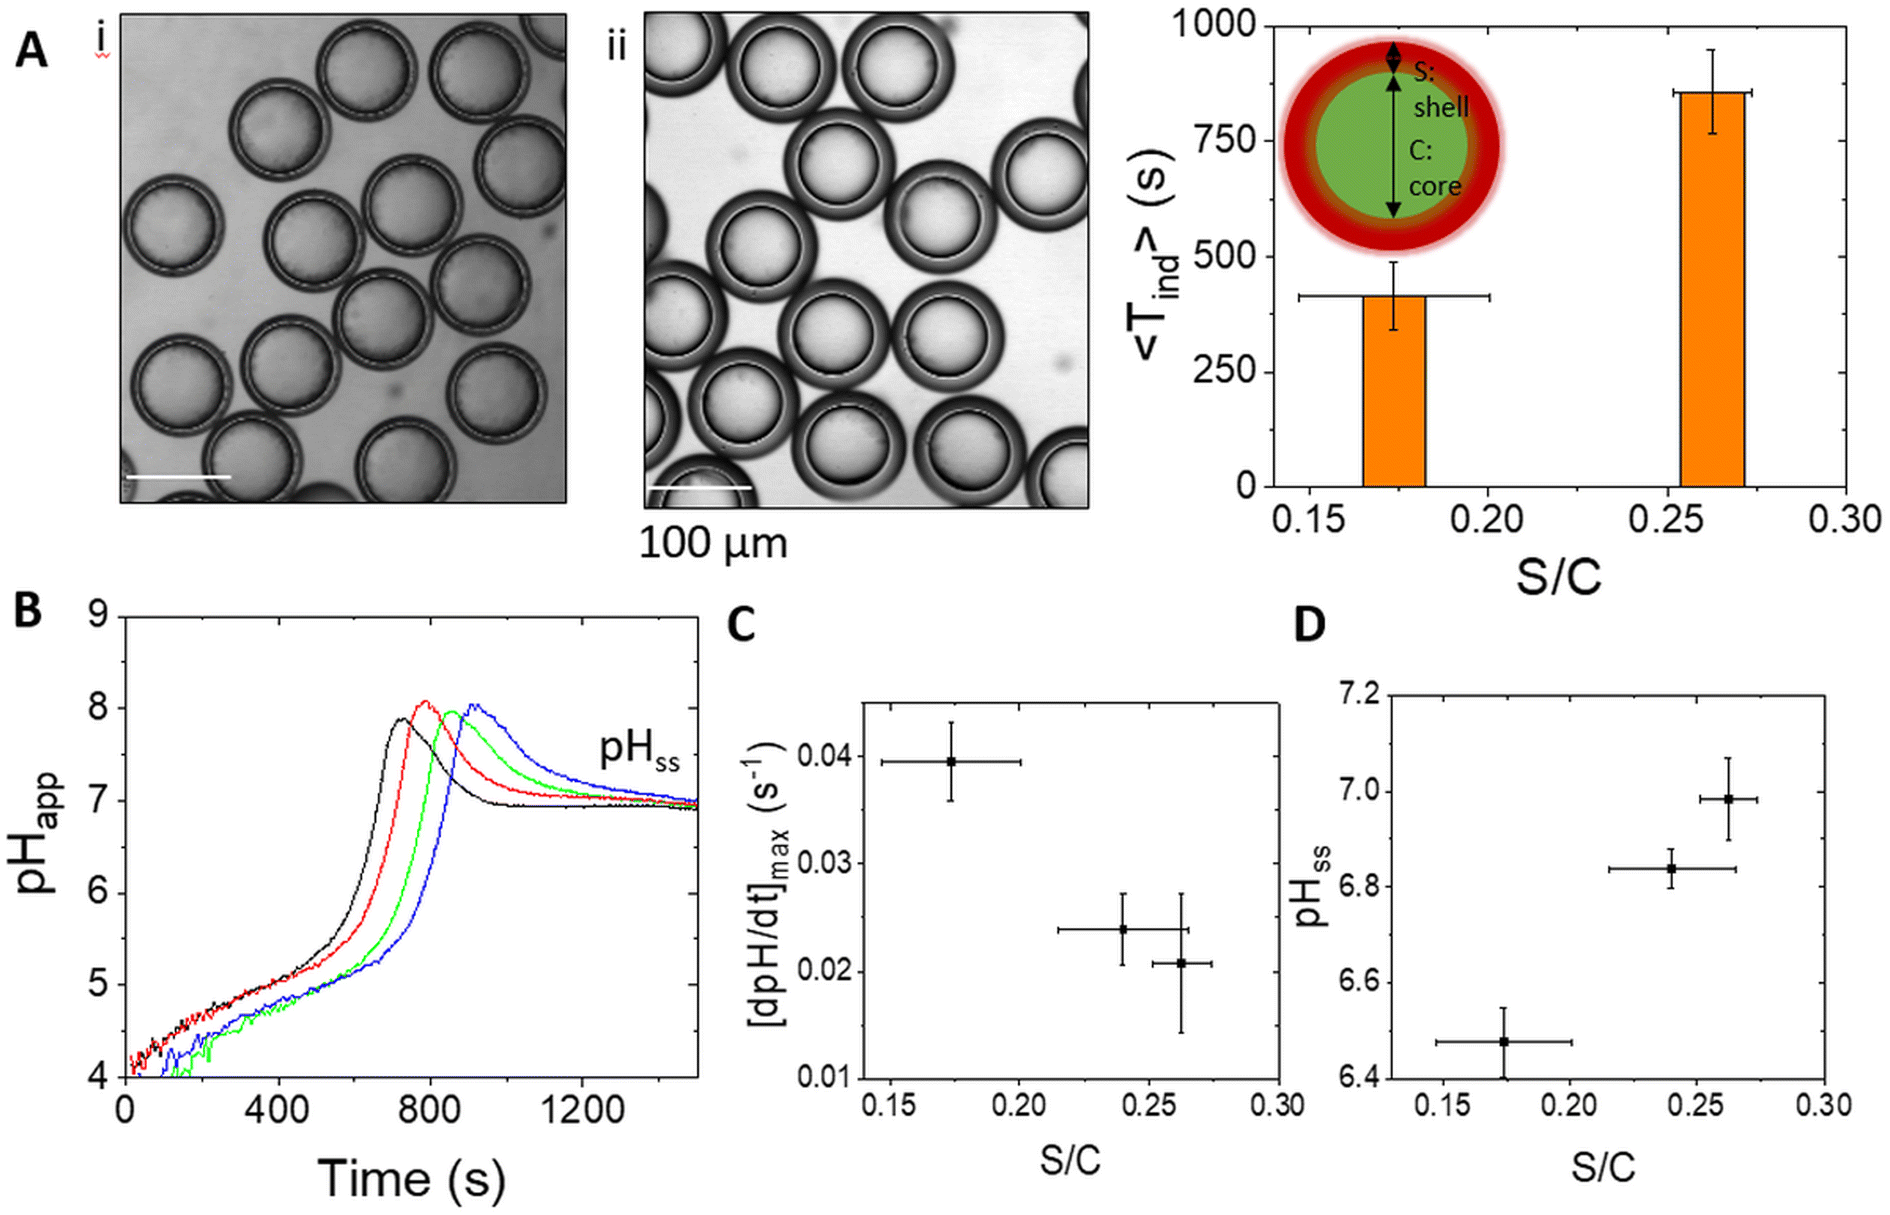 | ||
| Fig. 4 Control of the pH–time profile with different shell/core (S/C) ratios in the urease μ-reactor double emulsion in a reaction chamber of 1 mm depth. (A) Droplets produced with different S/C ratios ((i) 0.15 and (ii) 0.27) and corresponding average induction times. (B) Apparent pH in time in four droplets with S/C = 0.27. (C) Average rate of change of pH and (D) steady state pH as a function of S/C. Plots show the average and standard deviation from 20 droplets. The concentrations were [urea] = 0.07 M, [pyranine] = 50 μM, [AA] = 2 mM, [urease] = 50 U mL−1, and [phosphate]T = 80 mM. | ||
Double emulsion platform for pH-regulated production of minerals
The urease reaction is involved in biomineralisation, such as the formation of calcite and struvite in bacterial colonies, and has been exploited for environmentally benign production of minerals in various applications.45,60–62 Urease-aided calcium carbonate formation has been more thoroughly investigated than calcium phosphate precipitation; however, inorganic phosphates have wide ranging uses in the medical and food industries, including bone and dental implants, and as drug delivery carriers.63,64 These precipitates have multiple polymorphs and morphologies that depend sensitively on the conditions of synthesis including the solution pH.65 Typically, amorphous calcium phosphate (ACP) is observed as a precursor to hydroxyapatite (HAP, Ca10(PO4)6OH2) at high pH or brushite (dicalcium phosphate dihydrate DCPD, CaHPO4·2H2O) at lower pH.66,67 Methods for production of calcium phosphates include the use of batch, stirred crystallizers, sol–gel synthesis and double emulsions.19,68 Concentrated ammonium solutions have been frequently used to raise the pH resulting in spherical HAP particles composed of needle-like nanoparticles.19,69 The urease loaded water–oil–water (W/O/W) double emulsion may be used to regulate phosphate precipitation in the droplets, with control of the internal pH achieved by changes in droplet properties.In batch, stirred solutions with urease in sodium phosphate and calcium chloride, a mixture of precipitates was obtained (Fig. 5A); amorphous calcium phosphate or weakly crystalline hydroxyapatite particles of ∼100 nm size and micrometer-sized calcite dumbbells were identified using Raman spectroscopy (see ESI,† Fig. S10).51 The increase in pH from the net production of ammonia shifts the dihydrogen phosphate and carbon dioxide equilibria to phosphate and carbonate ions respectively, driving the increase in supersaturation and formation of precipitates:
 | (1) |
| H2PO4− ⇌ HPO42− + H+ ⇌ PO43− + H+ | (2) |
| CO2 + H2O ⇌ HCO3− + H+ ⇌ CO32− + H+ | (3) |
| 5Ca2+ + 6PO43− + 2OH− → Ca10(PO4)6OH2(s) | (4) |
| Ca2+ + CO32− → CaCO3(s) | (5) |
| Ca2+ + HPO42− ⇌ CaHPO4·H2O | (6) |
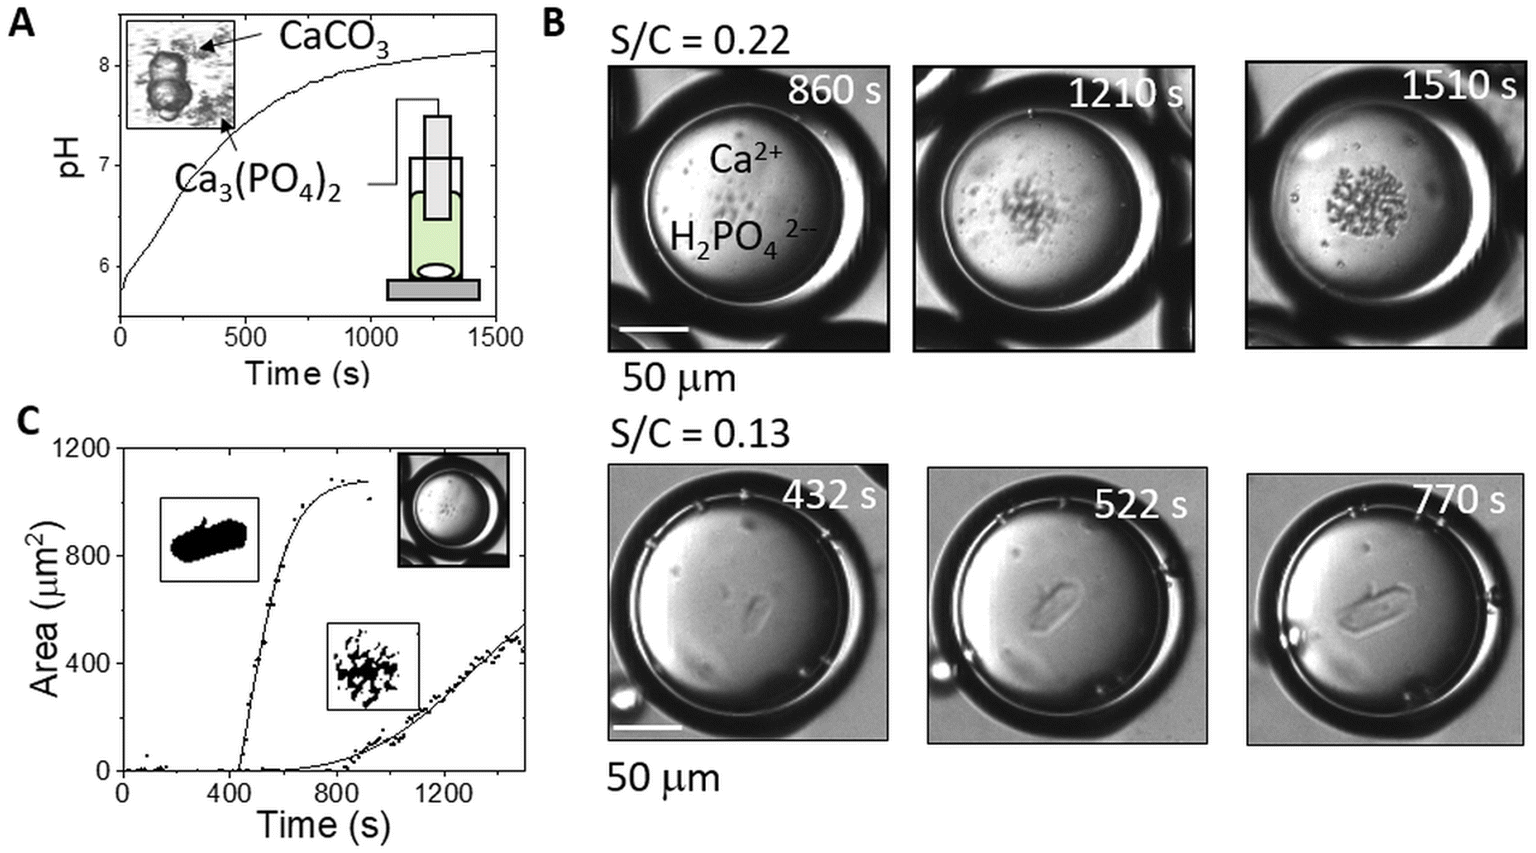 | ||
| Fig. 5 Urease-driven calcium phosphate precipitation; comparison of reaction in the batch reactor and in double emulsion droplets. The concentrations were: [urea] = 0.15 M, [AA] = 1 mM, [urease] = 50 U mL−1, [phosphate]T = 80 mM and [CaCl2] = 0.17 M. (A) Batch solution resulting in a mixture of calcium phosphate (hydroxyapatite nanoparticles) and calcite with increasing pH. (B) Calcium phosphate precipitation in the W/O/W microreactors of different shell thicknesses with the S/C indicated; hydroxyapatite particles (top) and brushite platelets (bottom). (C) Apparent area occupied by precipitates in time in the droplets (with the curve for platelets or nanoparticles indicated). | ||
In individual droplets, typically only one polymorph formed under these conditions. In a population of droplets, the probability of a particular polymorph depended on the average shell to core ratio and hence the steady state pH (we note that it was not possible to determine the pH in these experiments as the high calcium ion concentration quenches pyranine fluorescence). With thin shells, the pH in droplets approached pHss < 7 in experiments without calcium and brushite dominated with calcium added, whereas with thicker shells, pHss > 7 without calcium, thus favouring the formation of hydroxyapatite (Fig. 6). With higher concentrations of calcium, multiple platelets could be observed in some droplets (Fig. 6A and S13†). There was no evidence of calcite forming in any droplets under these conditions, unlike in bulk solutions, as the pHss was maintained at ∼7.51,69
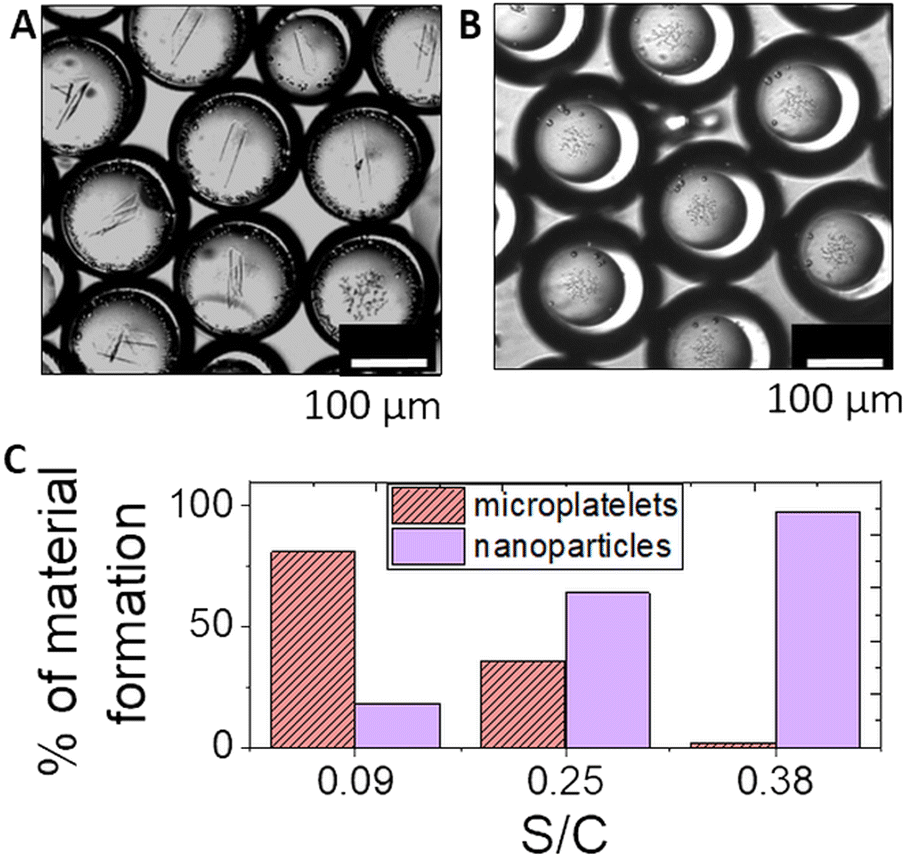 | ||
| Fig. 6 Precipitation of either calcium phosphate platelets (brushite) or particles (hydroxyapatite) as a function of the average shell to core ratio (S/C) in the double emulsion droplets. Images of (A) platelets with S/C = 0.09 ± 0.03 and (B) particles with S/C = 0.38 ± 0.02. (C) % of either platelets or nanoparticles in the droplets as a function of S/C. The concentrations were: [urea] = 0.15 M, [AA] = 1 mM, [urease] = 50 U mL−1, [phosphate]T = 80 mM and [CaCl2] = 0.15 M. | ||
Conclusion
In this paper, taking advantage of pressure-driven droplet microfluidics, we developed a system of enzyme-encapsulated double emulsion (W/O/W) droplets to obtain a localised pH pulse, with a controllable induction time and steady state pH. Urease-encapsulated double emulsion droplets of ∼100–200 μm with a mineral oil shell thickness of 10–40 μm were prepared using a flow focussing device and the reaction was initiated off-chip by addition of droplets to a solution of urea. The pH increased uniformly and rapidly across the droplets after a time lag controlled by the diffusion of urea and then decreased to a steady state value either above or below pH 7, regulated by the rate of transport of ammonia out of the droplet. A distribution of induction times was obtained in the droplets thus demonstrating their potential to act as individual (μ) micro-reactors, whereas in other encapsulated urease systems, the fast diffusion of ammonia resulted in an increase in the pH in the surrounding solution.23We demonstrated that this approach has potential applications in regulating pH changes for pH programmable material synthesis in confined environments. The steady state pH can be manipulated by varying the shell thickness of double emulsions, and here we triggered phosphate precipitation and showed that the polymorph that formed within the core of microfluidic double emulsions depended on the shell thickness, and hence the steady state pH. This demonstrated that compartmentalisation of the urease reaction may be exploited for selecting polymorphs through internal pH regulation, in contrast to bulk solutions where the pH continued to increase resulting in a mixture of precipitates.
In conclusion, compartmentalization of the urea–urease reaction in double emulsions generates new potential in the development of biocompatible feedback for pH-triggered processes and bioinspired applications in materials science. In the future, the microfluidics-based double emulsion platform could be used for fine tuning material properties, such as pH-triggered organic polymer–phosphate particles for medical applications.70
Author contributions
AFT conceived the study; MR and RA carried out the experiments; all authors contributed equally to the data analysis and preparation of the manuscript.Conflicts of interest
There are no conflicts to declare.Acknowledgements
This research has been supported by funding from the European Union's Horizon 2020 research and innovation programme under the Marie Skłodowska-Curie grant agreement no. 812868. We would like to thank Prof. Dr. Eberhard Bodenschatz and Dr. Azam Gholami for access to the microfluidic lab training of double emulsions and microscopy at the Max Planck Institute for Dynamics and Self-Organization (MPIDS), Germany. We would also like to acknowledge Dr. Marine Daïeff (Research and Innovation Engineer at Elveflow-Microfluidics innovation center, France) for useful discussions and assistance with the OB1 microfluidic setup.References
- L. Shang, Y. Cheng and Y. Zhao, Chem. Rev., 2017, 117, 7964–8040 CrossRef CAS PubMed.
- L. Li and R. F. Ismagilov, Annu. Rev. Biophys., 2010, 39, 139–158 CrossRef CAS PubMed.
- S. Marre and K. F. Jensen, Chem. Soc. Rev., 2010, 39, 1183–1202 RSC.
- F. M. Galogahi, Y. Zhu, H. An and N.-T. Nguyen, J. Sci.: Adv. Mater. Devices, 2020, 5, 417–435 CAS.
- O. J. Dressler, X. Casadevall i Solvas and A. J. deMello, Annu. Rev. Anal. Chem., 2017, 10, 1–24 CrossRef PubMed.
- J. Wang, S. Hahn, E. Amstad and N. Vogel, Adv. Mater., 2022, 34, 2107338 CrossRef CAS PubMed.
- K. Torbensen, F. Rossi, S. Ristori and A. Abou-Hassan, Lab Chip, 2017, 17, 1179–1189 RSC.
- B. C. Buddingh' and J. C. M. Van Hest, Acc. Chem. Res., 2017, 50, 769–777 CrossRef PubMed.
- K. K. Dey, X. Zhao, B. M. Tansi, W. J. Méndez-Ortiz, U. M. Córdova-Figueroa, R. Golestanian and A. Sen, Nano Lett., 2015, 15, 8311–8315 CrossRef CAS PubMed.
- O. Rifaie-Graham, J. Yeow, A. Najer, R. Wang, R. Sun, K. Zhou, T. N. Dell, C. Adrianus, C. Thanapongpibul, M. Chami, S. Mann, J. R. de Alaniz and M. M. Stevens, Nat. Chem., 2023, 15, 110–118 CrossRef CAS PubMed.
- R. Tomasi, J.-M. Noël, A. Zenati, S. Ristori, F. Rossi, V. Cabuil, F. Kanoufi and A. Abou-Hassan, Chem. Sci., 2014, 5, 1854–1859 RSC.
- P. Walde, K. Cosentino, H. Engel and P. Stano, ChemBioChem, 2010, 11, 848–865 CrossRef CAS PubMed.
- J. Guzowski, K. Gizynski, J. Gorecki and P. Garstecki, Lab Chip, 2016, 16, 764–772 RSC.
- S. Maiti, I. Fortunati, C. Ferrante, P. Scrimin and L. J. Prins, Nat. Chem., 2016, 8, 725–731 CrossRef CAS PubMed.
- Y. Miele, Z. Medveczky, G. Holló, B. Tegze, I. Derényi, Z. Hórvölgyi, E. Altamura, I. Lagzi and F. Rossi, Chem. Sci., 2020, 11, 3228–3235 RSC.
- T. Litschel, B. Ramm, R. Maas, M. Heymann and P. Schwille, Angew. Chem., Int. Ed., 2018, 57, 16286–16290 CrossRef CAS PubMed.
- J. R. Casey, S. Grinstein and J. Orlowski, Nat. Rev. Mol. Cell Biol., 2010, 11, 50–61 CrossRef CAS PubMed.
- D. Del Giudice, F. Frateloreto, C. Sappino and S. Di Stefano, Eur. J. Org. Chem., 2022, 2022, e202200407 CrossRef CAS.
- H. C. Shum, A. Bandyopadhyay, S. Bose and D. A. Weitz, Chem. Mater., 2009, 21, 5548–5555 CrossRef CAS.
- S. Liang, J. Li, X. Li, J. Man, J. K. Nunes and H. Chen, J. Am. Ceram. Soc., 2018, 101, 3787–3796 CrossRef CAS.
- H. Che, S. Cao and J. C. M. Van Hest, J. Am. Chem. Soc., 2018, 140, 5356–5359 CrossRef CAS PubMed.
- Y. Miele, T. Bánsági, Jr., A. F. Taylor, P. Stano and F. Rossi, Commun. Comput. Inf. Sci., 2016, 587, 197–208 Search PubMed.
- Y. Miele, S. J. Jones, F. Rossi, P. A. Beales and A. F. Taylor, J. Phys. Chem. Lett., 2022, 13, 1979–1984 CrossRef CAS PubMed.
- D. Welch and J. B. Christen, Lab Chip, 2014, 14, 1191–1197 RSC.
- N. Fomina, C. A. Johnson, A. Maruniak, S. Bahrampour, C. Lang, R. W. Davis, S. Kavusi and H. Ahmad, Lab Chip, 2016, 16, 2236–2244 RSC.
- B. Krajewska, J. Mol. Catal. B: Enzym., 2009, 59, 9–21 CrossRef CAS.
- G. Hu, J. A. Pojman, S. K. Scott, M. M. Wrobel and A. F. Taylor, J. Phys. Chem. B, 2010, 114, 14059–14063 CrossRef CAS PubMed.
- R. W. Jaggers and S. A. F. Bon, Mater. Horiz., 2017, 4, 402–407 RSC.
- S. Panja and D. J. Adams, Chem. – Eur. J., 2021, 27, 8928–8939 CrossRef CAS PubMed.
- I. Maity, C. Sharma, F. Lossada and A. Walther, Angew. Chem., Int. Ed., 2021, 60, 22537–22546 CrossRef CAS PubMed.
- W. P. van den Akker, H. Wu, P. L. W. Welzen, H. Friedrich, L. K. E. A. Abdelmohsen, R. A. T. M. van Benthem, I. K. Voets and J. C. M. van Hest, J. Am. Chem. Soc., 2023, 145, 8600–8608 CAS.
- X. Wang, S. Moreno, S. Boye, P. Wen, K. Zhang, P. Formanek, A. Lederer, B. Voit and D. Appelhans, Chem. Mater., 2021, 33, 6692–6700 CrossRef CAS.
- R. R. Mahato, Priyanka, E. Shandilya and S. Maiti, Chem. Sci., 2022, 13, 8557–8566 RSC.
- T. Zhao, Y. E, J. Cui, J. Hao and X. Wang, J. Colloid Interface Sci., 2022, 623, 674–684 CrossRef CAS.
- S. Panja, A. M. Fuentes-Caparrós, E. R. Cross, L. Cavalcanti and D. J. Adams, Chem. Mater., 2020, 32, 5264–5271 CrossRef CAS PubMed.
- L. R. Arriaga, S. S. Datta, S. H. Kim, E. Amstad, T. E. Kodger, F. Monroy and D. A. Weitz, Small, 2014, 10, 950–956 CrossRef CAS PubMed.
- S.-Y. Teh, R. Khnouf, H. Fan and A. P. Lee, Biomicrofluidics, 2011, 044113, 1–12 Search PubMed.
- K. Torbensen and A. Abou-Hassan, J. Flow Chem., 2015, 5, 234–240 CrossRef.
- S. Okushima, T. Nisisako, T. Torii and T. Higuchi, Langmuir, 2004, 20, 9905–9908 CrossRef CAS PubMed.
- S. Ding, C. A. Serra, T. F. Vandamme, W. Yu and N. Anton, J. Controlled Release, 2019, 295, 31–49 CrossRef CAS PubMed.
- W. Li, L. Zhang, X. Ge, B. Xu, W. Zhang, L. Qu, C.-H. Choi, J. Xu, A. Zhang, H. Lee and D. A. Weitz, Chem. Soc. Rev., 2018, 47, 5646–5683 RSC.
- A. Küchler, M. Yoshimoto, S. Luginbühl, F. Mavelli and P. Walde, Nat. Nanotechnol., 2016, 11, 409–420 CrossRef PubMed.
- A. Yashina, F. Meldrum and A. deMello, Biomicrofluidics, 2012, 6, 022001 CrossRef PubMed.
- M. Michel, M. Winterhalter, L. Darbois, J. Hemmerle, J. C. Voegel, P. Schaaf and V. Ball, Langmuir, 2004, 20, 6127–6133 CrossRef CAS PubMed.
- B. Krajewska, J. Adv. Res., 2018, 13, 59–67 CrossRef CAS PubMed.
- D. N. Cacace, A. T. Rowland, J. J. Stapleton, D. C. Dewey and C. D. Keating, Langmuir, 2015, 31, 11329–11338 CrossRef CAS PubMed.
- A. T. Rowland, D. N. Cacace, N. Pulati, M. L. Gulley and C. D. Keating, Chem. Mater., 2019, 31, 10243–10255 CrossRef CAS.
- A. Clarà Saracho, L. Lucherini, M. Hirsch, H. M. Peter, D. Terzis, E. Amstad and L. Laloui, J. Mater. Chem. A, 2021, 9, 24438–24451 RSC.
- V. P. Galván-Chacón, L. Costa, D. Barata and P. Habibovic, Acta Biomater., 2021, 128, 486–501 CrossRef PubMed.
- J. Enax, F. Meyer, E. Schulze Zur Wiesche and M. Epple, Nanomaterials, 2022, 12, 4075 CrossRef CAS PubMed.
- B. Bohner, T. Bánsági Jr, Á. Tóth, D. Horváth and A. F. Taylor, Angew. Chem., Int. Ed., 2020, 59, 2823–2828 CrossRef CAS PubMed.
- I. Clemente, K. Torbensen, E. Di Cola, F. Rossi, S. Ristori and A. Abou-Hassan, RSC Adv., 2019, 9, 33429–33435 RSC.
- H. Kim, S. M. Jo, F. Meng, Y. Guo, H. Thérien-Aubin, R. Golestanian, K. Landfester and E. Bodenschatz, Adv. Funct. Mater., 2020, 30, 2006019 CrossRef CAS.
- J. C. McDonald, D. C. Duffy, J. R. Anderson and D. T. Chiu, Electrophoresis, 2000, 21, 27–40 CrossRef CAS PubMed.
- Y. Xia and G. M. Whitesides, Angew. Chem., Int. Ed., 1998, 37, 550–575 CrossRef CAS PubMed.
- T. Trantidou, Y. Elani, E. Parsons and O. Ces, Microsyst. Nanoeng., 2017, 3, 16091 CrossRef CAS PubMed.
- D. Wu, Y. Luo, X. Zhou, Z. Dai and B. Lin, Electrophoresis, 2005, 26, 211–218 CrossRef CAS PubMed.
- I. V. Kopanichuk, E. A. Vedenchuk, A. S. Koneva and A. A. Vanin, J. Phys. Chem. B, 2018, 122, 8047–8055 CrossRef CAS PubMed.
- E. Altamura, F. Milano, R. R. Tangorra, M. Trotta, O. H. Omar, P. Stano and F. Mavelli, Proc. Natl. Acad. Sci. U. S. A., 2017, 114, 3837–3842 CrossRef CAS PubMed.
- S. Stocks-Fischer, J. K. Galinat and S. S. Bang, Soil Biol. Biochem., 1999, 31, 1563–1571 CrossRef CAS.
- T. Barkay and J. Schaefer, Curr. Opin. Microbiol., 2001, 4, 318–323 CrossRef CAS PubMed.
- N. K. Dhami, M. S. Reddy and M. S. Mukherjee, Front. Microbiol., 2013, 4, 314 Search PubMed.
- W. Habraken, P. Habibovic, M. Epple and M. Bohner, Mater. Today, 2016, 19, 69–87 CrossRef CAS.
- V. Sokolova and M. Epple, Chem. – Eur. J., 2021, 27, 7471–7488 CrossRef CAS PubMed.
- B. Han and M. Louhi-Kultanen, Cryst. Growth Des., 2018, 18, 1622–1628 CrossRef CAS.
- J. A. Stammeier, B. Purgstaller, D. Hippler, V. Mavromatis and M. Dietzel, MethodsX, 2018, 5, 1241–1250 CrossRef PubMed.
- G. Montes-Hernandez and F. Renard, J. Phys. Chem. C, 2020, 124, 15302–15311 CrossRef CAS.
- K. Ishikawa, E. Garskaite and A. Kareiva, J. Sol-Gel Sci. Technol., 2020, 94, 551–572 CrossRef CAS.
- G. B. Ramírez-Rodríguez, J. M. Delgado-López and J. Gómez-Morales, CrystEngComm, 2013, 15, 2206–2212 RSC.
- Y. S. Cho, M. Moon, G. Holló, I. Lagzi and S. H. Yang, Langmuir, 2022, 38, 2515–2524 CrossRef CAS PubMed.
Footnote |
| † Electronic supplementary information (ESI) available. See DOI: https://doi.org/10.1039/d3lc00711a |
| This journal is © The Royal Society of Chemistry 2023 |