
Ultra-fast synthesis of water soluble MoO3−x quantum dots with controlled oxygen vacancies and their near infrared fluorescence sensing to detect H2O2†
Shichuan
Zhong
,
Changchang
Xing
,
An
Cao
,
Tao
Zhang
,
Xuejiao
Li
,
Jie
Yu
,
Weiping
Cai
 and
Yue
Li
*
and
Yue
Li
*
Key Lab of Materials Physics, Anhui Key Lab of Nanomaterials and Nanotechnology, Institute of Solid State Physics, Hefei Institutes of Physical Science, Chinese Academy of Sciences, Hefei 230031, Anhui, P. R. China. E-mail: yueli@issp.ac.cn
First published on 27th August 2020
Abstract
We report a facile method for the synthesis of water soluble MoO3−x quantum dots (QDs) at room temperature by injecting hydrochloric acid and mercaptosuccinic acid into ammonium molybdate solution within 5 seconds. The optical properties and oxygen vacancy concentration of the QDs could be well controlled by the competitive absorption of a carboxyl group and sulfhydryl group of the ligand with QDs by coordination interaction. The obtained QDs could be used as near infrared region (NIR) fluorescence probes to detect hydrogen peroxide with a low detection limit (3 nM).
New conceptsOxygen vacancies are the key factor that influences the physical and chemical properties of oxide materials. Nevertheless, the immediate regulation of oxygen vacancies toward oxide materials by a facile method at room temperature remains a challenge. Herein, we propose a new concept of competitive absorption of –SH and –COOH from the ligands, which could usefully and rapidly regulate the oxygen vacancy concentration of MoO3−x quantum dots (QDs) by controlling the ligand amount at room temperature. The water soluble MoO3−x QDs could be synthesized by injecting hydrochloric acid and mercaptosuccinic acid into ammonium molybdate solution at room temperature within 5 seconds. The optical properties and oxygen vacancy concentration of the obtained QDs could be well controlled by changing the amount of ligand (mercaptosuccinic acid), which was caused by competitive adsorption of the carboxyl group and sulfhydryl group of the ligand with QDs by coordination interaction. Moreover, the QDs could be used as NIR fluorescence probes to detect H2O2 with a low detection limit (3 nM). This work provides a new idea for defect engineering and QD synthesis as well as efficient fluorescence probes. |
Introduction
Quantum dots, such as carbon dots,1–5 II–VI semiconductor quantum dots,6 and perovskite quantum dots,7–9 have been widely used in the fields of biosensors,10 new energy,11 luminescence and catalysis because of their unique characteristics including quantum size and quantum domain-limited effects.12,13 Among these QDs, carbon dots (CDs) used as biosensors have attracted much attention due to their advantages of unique luminescence and low toxicity.3,11,12 However, the complex synthesis processes, high energy consumption and low yield of CDs has seriously limited their further applications.14,15 Additionally, the visible fluorescence of CDs has low tissue penetration efficiency and it will also be affected by biomolecule fluorescence interference. Generally, the high-efficiency biological window exists in the near infrared region, and two fluorescent-emission sensing is also an effective way to avoid interference. On the other hand, some II–VI semiconductor quantum dots possess near-infrared fluorescence, but most of them are unsuitable for biosensors due to high toxicity from heavy metal components.16,17 Therefore, it is important to develop other novel and facilely obtained QDs in the infrared biological window with high fluorescence efficiency.Recently, molybdenum oxide QDs with oxygen vacancies have proved that they could be used as excellent biosensitive materials due to their good biocompatibility and NIR absorption properties.18,19 Generally, the oxygen vacancies present in molybdenum oxide nanomaterials are produced by hydrogenation, thus displaying strong localized surface plasmon resonance (LSPR).20–27 For instance, the molybdenum oxide QDs prepared using supercritical CO2 under 20 MPa pressure showed two near infrared absorption peaks, which could be applied to surface-enhanced Raman spectroscopy.18 The MoO3−x QDs synthesized by a hydrothermal method at 80 °C in 24 h showed a full spectrum absorption in the biological window, which could be used for photoacoustic imaging guided photothermal/photodynamic cancer treatment.19 Nevertheless, both the synthetic methods of molybdenum oxide QDs and the implant of an oxygen vacancy in them required complex processes, high energy consumption, and harsh synthetic conditions, which thus hindered their applications to some extent. Meanwhile, oxygen vacancies as the important factor affected the optical performance of molybdenum oxide QDs, but they could not be well regulated in the present preparation methods. Moreover, although the NIR fluorescence sensors possess a high tissue penetration efficiency and low interference, the NIR fluorescence sensitive properties of molybdenum oxide QDs have never been investigated. Therefore, it is urgent to develop a facile route to prepare near-infrared fluorescent molybdenum oxide QDs with tunable oxygen vacancies and extend their applications in biosensors.
In this work, we develop a facile method for ultra-fast synthesis of MoO3−x QDs in an aqueous phase at room temperature, which could be used as an effective fluorescence sensor. The MoO3−x QDs could be rapidly prepared by injecting hydrochloric acid and mercaptosuccinic acid into ammonium molybdate solution within 5 seconds. The obtained MoO3−x QDs displayed uniform size, ranging from 3 to 4 nm. The optical properties and oxygen vacancy concentration of the QDs could be well tuned by controlling the amount of ligands, which was caused by competitive adsorption of the carboxyl group and sulfhydryl group of the ligand with QDs by coordination interaction. The obtained QDs demonstrated two fluorescent emission peaks, and could be used as an effective NIR sensitive system to detect H2O2. They demonstrated the low detection limit of 3 nM, which is one order of magnitude lower than the current NIR fluorescent sensors based on other QDs or organic molecules. Such a H2O2 sensor is highly helpful to monitor redox balance in organisms. This work provides a facile and ultra-fast mass-production method of water-soluble MoO3−x QDs, which could be used as efficient fluorescence biosensors. Moreover, these MoO3−x QDs have also important potential applications in the fields of energy, catalysis and biomedical science.
Results and discussion
Characterization of MoO3−x quantum dots
The uniform sized MoO3−x QDs could be prepared by injecting hydrochloric acid and mercaptosuccinic acid into ammonium molybdate solution within 5 seconds (see a video in the ESI†). In order to better describe different molybdenum oxide QDs obtained at different experimental conditions, we defined the molybdenum oxide QDs synthesized using different amounts of ligands as A@QDs, where A is the amount of ligand. For example, the quantum dots synthesized with 0.2 g of ligand were referred to as 0.2g@QDs.The transmission electron microscopic (TEM) characterization of 0.2g@QDs, 0.6g@QDs, 1.0g@QDs and 1.4g@QDs is shown in Fig. 1. One can find that the QDs display uniform morphology with an average size of 3.28 nm, 3.16 nm, 3.90 nm and 3.37 nm, respectively. The HRTEM images show the obvious lattice fringes of the QDs, indicating the good crystallinity of MoO3−x.21 The structure of the obtained QDs was further explored by XRD (Fig. S1, ESI†), which is also consistent with MoO3−x.18,19
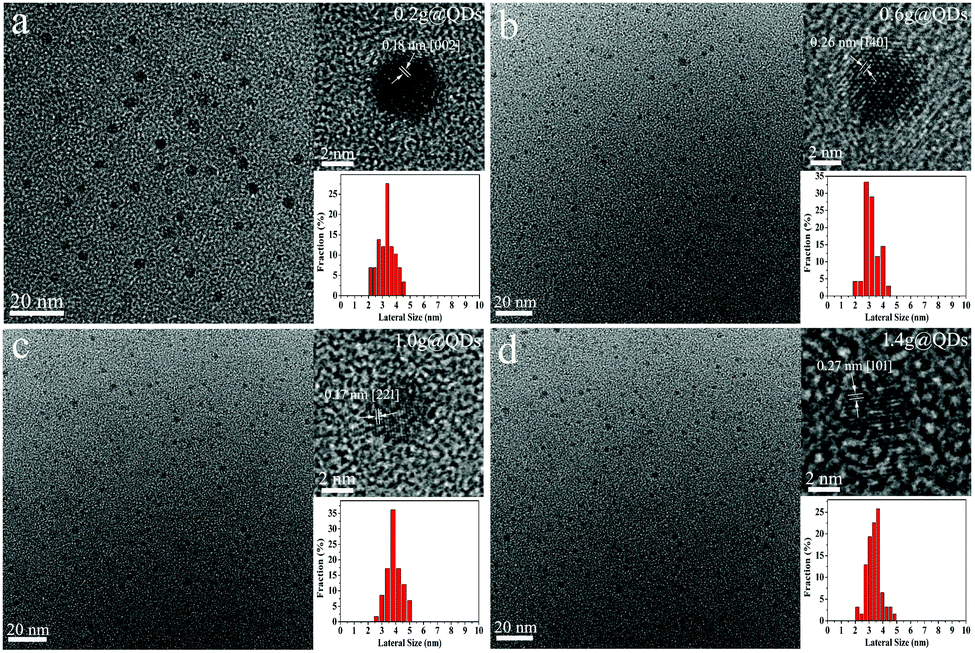 | ||
| Fig. 1 TEM and HRTEM images and size distribution diagram of different amounts of ligands of quantum dots. (a) 0.2g@QDs. (b) 0.6g@QDs. (c) 1.0g@QDs. (d) 1.4g@QDs. | ||
Meanwhile, the obtained QDs were also characterized by Raman spectra, as shown in Fig. S2 (ESI†). The Raman peaks located at 489 cm−1 and 733 cm−1 of 0.2g@QDs are assigned to the Mo![[double bond, length as m-dash]](https://www.rsc.org/images/entities/char_e001.gif) O stretching modes and Mo2–O bond of MoO3−x, respectively.20 However, when the ligand amount increased to 1.0 g, the peaks located at 489 cm−1 and 733 cm−1 disappeared, and clear peaks located at 280, 665, 816 and 991 cm−1 appeared, which are all in good agreement with the α-MoO3, indicating that the QDs cause phase transformation from MoO3−x to α-MoO3.20 More interestingly, the double peaks around 400 cm−1 appeared in the Raman spectrum of 1.4g@QDs, which is the characteristic peak of a Mo–S bond.28 Consequently, the Raman spectra reveal that the oxygen vacancy concentration of the QDs gradually decreases as the ligand content increases.
O stretching modes and Mo2–O bond of MoO3−x, respectively.20 However, when the ligand amount increased to 1.0 g, the peaks located at 489 cm−1 and 733 cm−1 disappeared, and clear peaks located at 280, 665, 816 and 991 cm−1 appeared, which are all in good agreement with the α-MoO3, indicating that the QDs cause phase transformation from MoO3−x to α-MoO3.20 More interestingly, the double peaks around 400 cm−1 appeared in the Raman spectrum of 1.4g@QDs, which is the characteristic peak of a Mo–S bond.28 Consequently, the Raman spectra reveal that the oxygen vacancy concentration of the QDs gradually decreases as the ligand content increases.
To confirm the composition of the synthesized QDs, the XPS survey spectrum of MoO3−x QDs (0.2g@QDs) was measured as shown in Fig. S3 (ESI†), which indicated that the QDs consist of S, Mo, C, and O; note that Mo is from the QDs, O is from both the QDs and the ligands on their surfaces, S and C are from the ligands, and Cl and N are from the impurity of ammonia chloride. The Mo 3d XPS spectra of the QDs were further characterized to investigate the influence toward the QDs of a ligand amount from 0.2 g to 1.6 g, as shown in Fig. 2. As a whole, the overall peak positons shift toward low energy level as the amount of ligands increases, which indicates that the QDs generate charge transfer and thus the electron cloud density increases.29 The doublet peaks located at 233.1 eV and 236.4 eV for 0.2–0.8g@QDs are attributed to the binding energies of the 3d5/2 and the 3d3/2 orbital electrons of Mo6+.30 Meanwhile, the doublet peaks located at 231.3 eV and 234.3 eV from 0.2–1.6g@QDs are attributed to the binding energies of the 3d5/2 and the 3d3/2 orbital electrons of Mo5+.18 The doublet peaks located at 229.5 eV and 232.8 eV from 1.2–1.6g@QDs are similar to the binding energies of the 3d5/2 and the 3d3/2 orbital electrons of Mo4+.31 Interestingly, it is noted that all the XPS spectra have a single peak around 228 eV, which is in accordance with S 2s, indicating the existence of Mo–S bonding from Mo coordination with S from the ligand.32 The S 2s peaks located at 226.5 eV for 1.2–1.6g@QDs also certify the interaction between Mo and S.31 Moreover, the O 1s XPS spectra were measured to investigate the coordination of Mo, and the XPS peak of O 1s could be divided into three peaks (Fig. S4, ESI†). The peak located at 530.9 eV is assigned to the Mo–O in molybdenum oxide.33 The peak located at 531.7 eV is attributed to the coordination interaction between Mo and carboxyl.34 The peak located at 533 eV is attributed to the O–H in carboxyl.35 From the O 1s XPS of different ligand contents, it could be found that the peak area located at 531.7 eV decreased as the ligand amount increased, which indicated that the coordination interaction between Mo and carboxyl decreased as the ligand content increased. Based on the results of XPS combined with HRTEM, XRD and Raman spectra, it indicated that the obtained quantum dots are MoO3−x QDs.
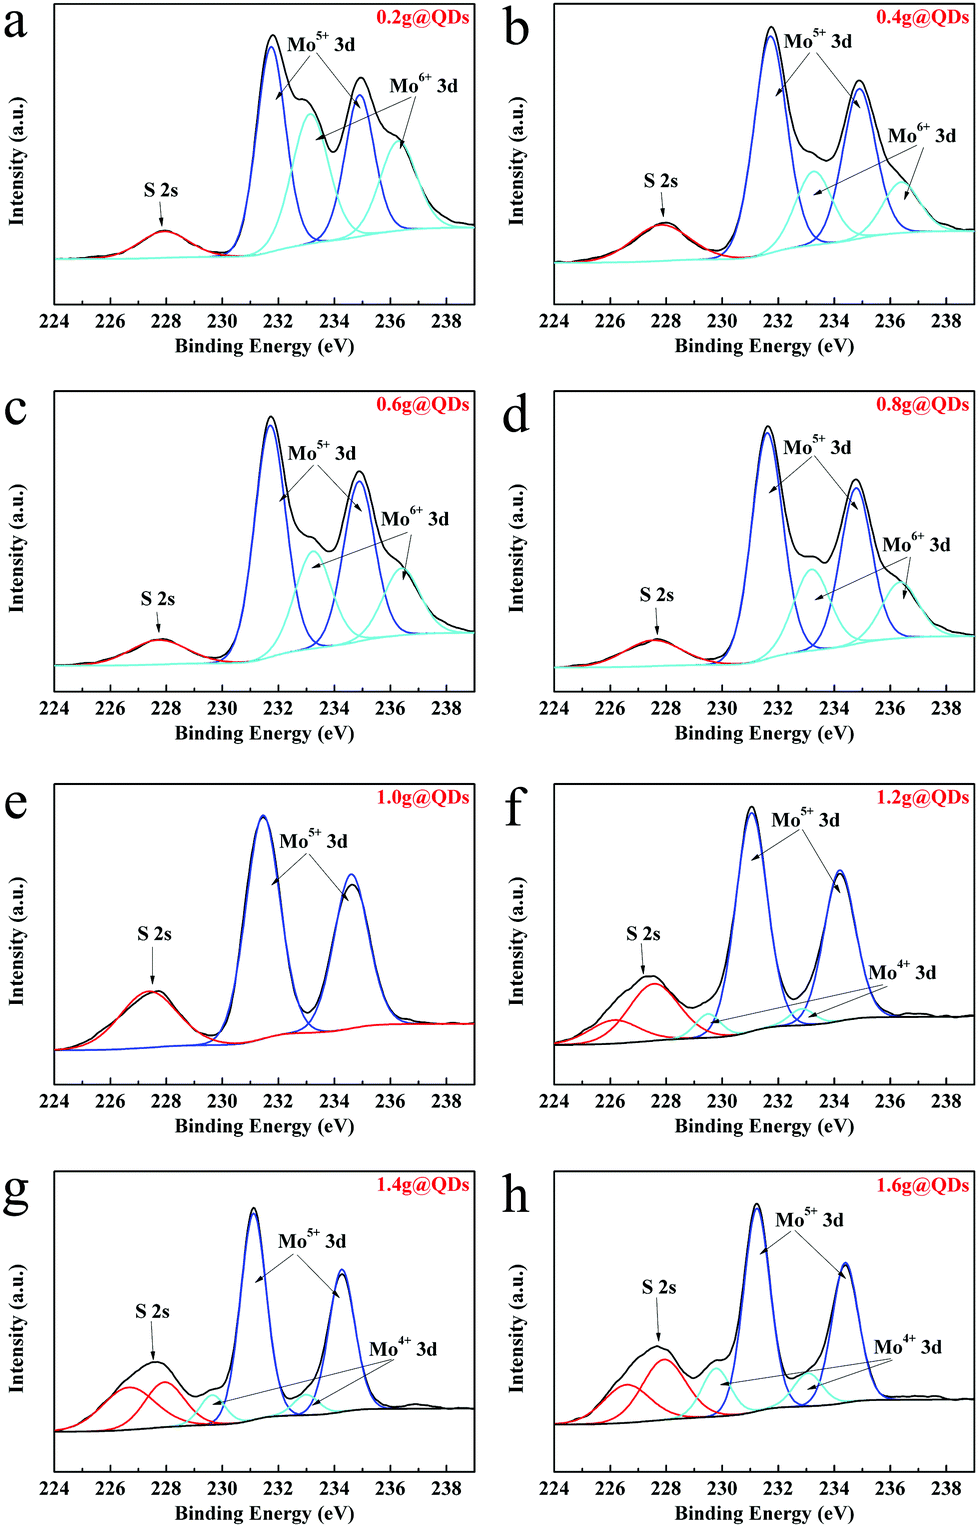 | ||
| Fig. 2 XPS spectra of Mo 3d core level peak regions for quantum dots with different amounts of ligand. (a) 0.2 g. (b) 0.4 g. (c) 0.6 g. (d) 0.8 g. (e) 1.0 g. (f) 1.2 g. (g) 1.4 g. (h) 1.6 g. | ||
Optical absorption of MoO3−x QDs
The optical absorption properties of the MoO3−x quantum dots synthesized using ligands in different amounts were investigated, as shown in Fig. 3a. One can see that, in the NIR range, the absorption intensity of the MoO3−x QDs decreased with increasing the amount of ligands from 0.2 g to 1.6 g. Interestingly, in the ultraviolet (UV) range, the intensity of optical absorption increased and an absorption peak near 355 nm gradually appeared with increase of the ligand content. Additionally, with increasing ligand content, the color of the QD aqueous solution changed from blue to green, and then to yellow (Fig. 3b), which well agrees with their optical absorption properties. From these results, we can determine that if the ligand content is lower, the intensity of optical absorption of the QDs is stronger in the near-infrared range with the amount of ligand from 0.2 g to 1.6 g.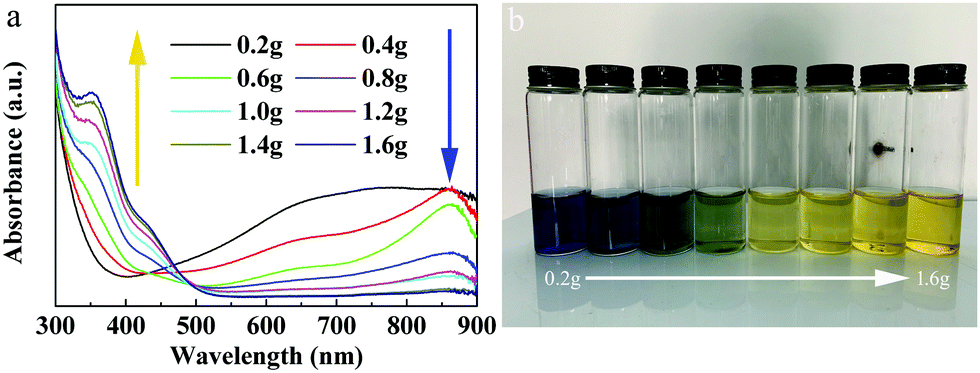 | ||
| Fig. 3 Optical properties of quantum dots with different amounts of ligands. (a) The optical absorption spectra. (b) The optical photos of QDs with different amounts of ligands. | ||
The key factor to regulate the optical absorption of MoO3−x QDs
We also investigated the key factor to regulate the optical properties of the MoO3−x QDs. The color of the pristine 0.2g@QDs solution kept blue. If 10 μL of ligand aqueous solution with a concentration of 1 M was added into 40 μL of pristine 0.2g@QDs, the color of the QD solution changed from blue to green, and if we further added the same content of ligands into it, it changed from green to yellow. Its intensity of optical absorption near 355 nm increased and the NIR absorption decreased as the ligand was added, as shown in Fig. 4a. These results indicate that mercaptosuccinic acid can act as not only a ligand but also an important reactant. We also measured the optical absorption of the ligand and the molybdenum oxide nanoparticles without ligand prepared by mixing ammonium molybdate and hydrochloric acid. We find that there is no obvious absorption in the range from 355 nm to NIR, as shown in Fig. 4b, this indicates that the UV absorption centered at 355 nm and near infrared optical absorption comes from the MoO3−x QDs with the ligand. Therefore, the ligand is the key factor to regulate the optical absorption of the MoO3−x QDs.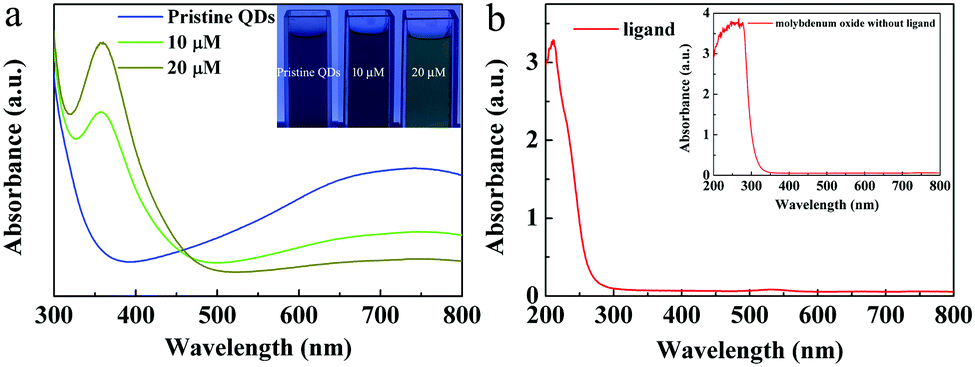 | ||
| Fig. 4 (a) The optical absorption and optical photos (top right-hand corner) of the below process. The 40 μL pristine 0.2g@QD solution was blue, and then 10 μM ligands were added, and the color changed from blue to green, and 10 μM ligands were added again, and the color finally changed to yellow. (b) The optical absorption of the ligand and the molybdenum oxide nanoparticles (top right-hand corner). | ||
The mechanism of competitive absorption
It has been reported that oxygen vacancies in molybdenum oxide, such as in MoO3−x QDs and MoO3−x nanosheets, will cause obvious near-infrared absorption.18,20,21,36,37 In molybdenum oxide, the formation of oxygen vacancies needs to have protons and certain reduction conditions according to the earlier report.20 The formation mechanism of oxygen vacancies in molybdenum oxide quantum dots might be described as follows: | (1) |
| –COOH → –COO− + H+ | (2) |
| Mo*O3 + xH+ → HxMo*O3 (abbreviated as MoO3−x) | (3) |
It should be noted that carboxyl is the main proton source and * means that Mo is the reduced valence. The ligands of mercaptosuccinic acid can supply the carboxyl and sulfhydryl groups. The reduction conditions provided by sulfhydryl and the coordination of carboxyl with MoO3−x QDs lead to the formation of oxygen vacancies. Therefore, NIR absorption is closely related to the coordination of carboxyl with MoO3−x QDs and the reduction conditions provided by sulfhydryl.
Furthermore, our XPS results demonstrate that QDs possess interaction with sulfhydryl, which comes from mercaptosuccinic acid (ligand), and the absorption intensity of the QDs near 355 nm increases as the ligand content increases. This implies that the absorption peak near 355 nm is closely related to the sulfhydryl coordination with MoO3−x QDs. Additionally, we performed a detailed investigation of the optical band gap and photoluminescence (PL) properties associated with the absorption near 355 nm of the MoO3−x QDs. Fig. 5a shows that the absorption coefficient of the obtained QD solution can be described by the equation α = (hν − Eg)0.5, which is generally applicable to a direct band semiconductor. The shift of the absorption curves to the long wavelength side reveals that the band gap of MoO3−x QDs decreases from 3.2 eV for 0.2g@QDs to about 2.6 eV for 1.6g@QDs. On the other hand, the gradual red-shift of the maximum fluorescence emission peak also indicates that the band gap decreases with increase of the ligand content, as shown in Fig. 5b. Because the sizes of the MoO3−x quantum dots change little with increase of the ligand content, the absorption and emission properties mentioned above indicate that the surface coordination of the QDs was changed.38 Generally, the oxygen vacancy caused by hydrogenation has little effect on the band gap.22 The only group that reacted with MoO3−x QDs in the ligand molecules is the sulfhydryl group in this work. Therefore, the absorption peak near 355 nm might be attributed to the sulfhydryl coordination with MoO3−x QDs.
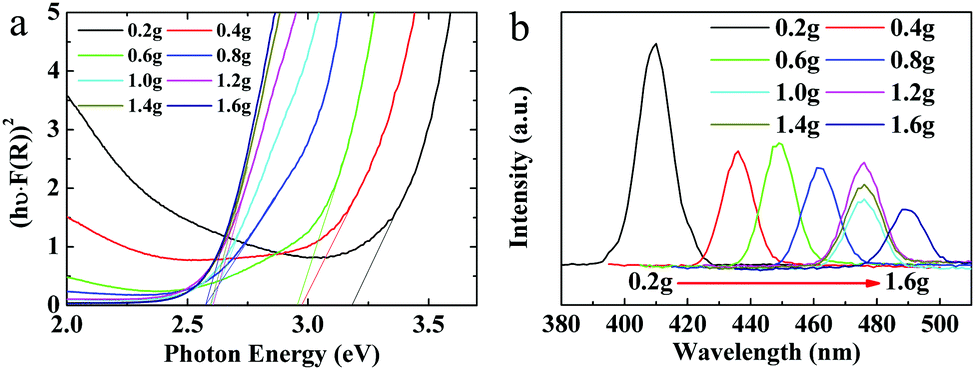 | ||
| Fig. 5 (a) The optical band gap of different amounts of ligands toward QDs. (b) The max fluorescence emission peaks of different amounts of ligands toward QDs. The excitation wavelengths are 360 nm (0.2 g), 370 nm (0.4 g), 380 nm (0.6 g), 390 (0.8 g), 400 nm (1.0 g, 1.2 g, 1.4 g) and 410 nm (1.6 g), respectively. | ||
We further propose the mechanism of optical absorption of MoO3−x QDs regulated by the ligands, which was caused by competitive adsorption of a carboxyl group and sulfhydryl group of the ligand with QDs by coordination interaction. When the amount of ligand is not so much, both the sulfhydryl groups and carboxyl groups of the ligands will coordinate with molybdenum oxide in the reaction. As the ligand amount exceeds a coordination saturation value, sulfhydryl groups will competitively occupy the previous sites of carboxyl groups because the coordination effect of sulfhydryl groups with QDs is much stronger than that of carboxyl groups.39 With gradual coordination between sulfhydryl and surfaces of QDs, the reaction of the protons provided by carboxyl with QDs will be retarded, leading to a decrease of oxygen vacancies, further leading to a decrease of the NIR absorption intensity. The proposed mechanism of optical absorption of MoO3−x QDs regulated by the ligands can be further verified by the optical absorption of MoO3−x QDs prepared using a lower ligand amount from 0 to 0.3 g (Fig. S5, ESI†), the XPS spectra, and the Raman spectra, respectively.
We also analyzed the synthesis process of MoO3−x QDs. The reaction of ammonium molybdate and hydrochloric acid is a classic one in which strong acid yields weak acid. In this reaction, hydrochloric acid, as a strong acid, reacts with ammonium molybdate solution to form molybdic acid, a water-insoluble weak acid. Molybdic acid will lose crystal water to become molybdenum oxide. Therefore, the effect of hydrochloric acid on the formation of MoO3−x QDs is to produce molybdic acid, the precursor of molybdenum oxide. The large amount of nucleation and short growth time leads to the formation of quantum dots due to the ultra-fast reaction speed. Meanwhile, the ligands coordinate with QDs quickly to avoid further growth of particles, and stable QDs are finally obtained. Moreover, the stability of the obtained QDs under different conditions was investigated, as shown in Fig. S6–S8 (ESI†). From the optical absorption of 0.2g@QDs under different pH values, temperatures and NIR irradiation time treatment, it could be found that the QDs are stable in acid and NIR irradiation conditions, and unstable in neutral, alkaline and heating conditions.
Fluorescence sensing of H2O2
The 0.2g@QDs demonstrated strong NIR absorption and weak absorption of near 355 nm and the 0.2g@QDs possessed obvious fluorescence emission peaks near 390 nm and 770 nm with an excitation wavelength of 340 nm. By utilizing this feature, we develop a fluorescent detection method of hydrogen peroxide (H2O2). As we know, as a reactive oxygen species, H2O2 plays a crucial role in oxidative stress and signal transduction of organisms, so it is important to quickly detect H2O2 in order to monitor redox balance in organisms. Fig. 6a depicts the fluorescence spectra of 0.2g@QDs solution with different concentrations of H2O2; we can see that both the intensities of the 390 nm peak and 770 nm peak regularly increase as the H2O2 concentration increases. However, we can clearly find that the peak at 770 nm is more sensitive than that at 390 nm. The NIR fluorescence spectra are further shown in Fig. 6b, the NIR fluorescence intensity of the 0.2g@QDs increases almost linearly with increase of the H2O2 concentration in the range of 10–1000 nM, as shown in Fig. 6c. The NIR detection limit of H2O2 using 0.2g@QDs was estimated to be as low as 3 nM (signal-to-noise ratio of S/N = 3), which is one order of magnitude lower than that of other H2O2 probes based on NIR fluorescence of other QDs or organic molecules (Table S1, ESI†).40–45 From our results, the optical properties of the QDs are closely related to the oxygen vacancy and sulfydryl coordination with the QDs. The defects and Mo–S coordination bond provide a path for photo-induced electron transfer (PET),46 which leads to weak fluorescence of the QDs. The PET path could be destroyed by H2O2 treatment to oxidize the oxygen vacancy and sulfydryl, leading to increase of fluorescence, which was further certified by their optical absorption, XPS, fluorescence lifetime spectroscopy, and electronic spin resonance spectroscopy, respectively (Fig. S9–S12, ESI†). Additionally, this MoO3−x QD fluorescence sensor displayed very good selectivity to detect H2O2. Compared to the addition of H2O2, the fluorescence intensity has little change by adding other common organisms or reactive oxygen species, such as cysteine (Cys), glutathione (GSH), ascorbic acid (AA), sodium nitrate and sodium hypochlorite. This indicated that the QD probe showed high selectivity toward H2O2, as shown in Fig. 6d. Therefore, their ultralow detection limit and good linear correlation demonstrate that the 0.2g@QDs can be used as excellent fluorescent probes for quantitatively sensing H2O2.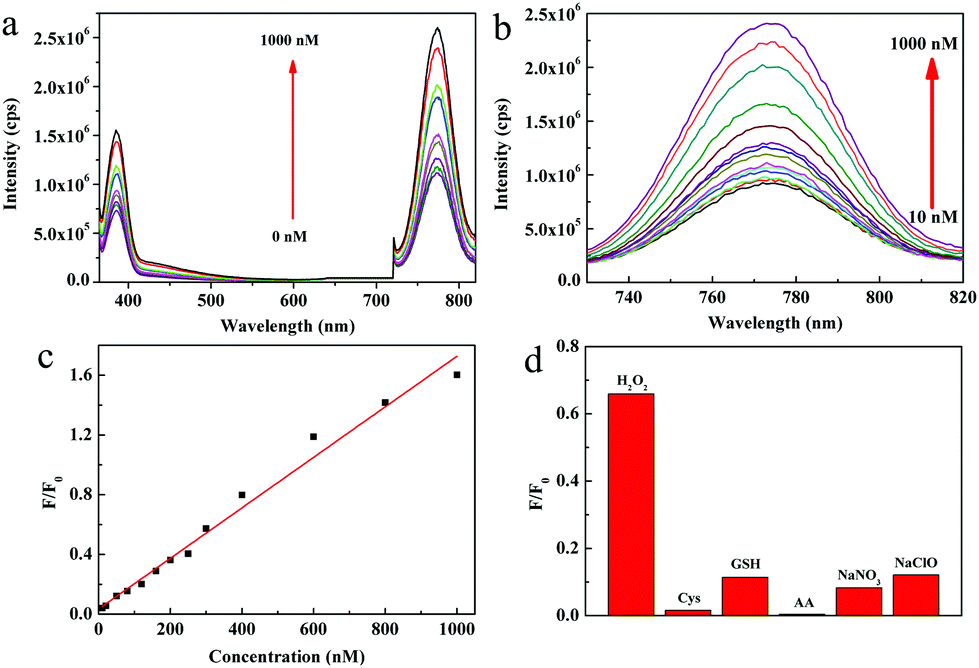 | ||
| Fig. 6 (a) Fluorescence emission spectra of 0.2@QDs with different H2O2 concentrations. (b) NIR fluorescence emission spectra centered at 770 nm of 0.2@QDs with different H2O2 concentrations. (c) The plot of NIR fluorescence intensity (F/F0) against the concentration of H2O2. F0 is the fluorescence intensity of the QD probe in the absence of H2O2, and F is the delta value of fluorescence in the presence of H2O2. (d) Fluorescence response of 40 μL of 0.2@QDs (diluted to 3 mL by added deionized water) after adding 1 μM of H2O2 and various interferents, respectively. The interferents include cysteine (Cys), glutathione (GSH), ascorbic acid (AA), sodium nitrate and sodium hypochlorite. | ||
Conclusions
In summary, we develop a facile method for ultra-fast synthesis of water soluble MoO3−x QDs by injecting hydrochloric acid and mercaptosuccinic acid into ammonium molybdate solution within 5 seconds at room temperature. The obtained QDs possess uniform size, ranging from 3 nm to 4 nm. Their optical properties and the oxygen vacancy concentration of the QDs could be well regulated by tuning the amount of ligand, which was caused by competitive adsorption of a carboxyl group and sulfhydryl group of the ligand with QDs by coordination interaction. The obtained QDs demonstrate two fluorescent emission peaks, which could be used for efficient NIR fluorescence probes to detect H2O2. The detection limit of H2O2 was 3 nm and it is one order of magnitude lower than that of the current NIR fluorescent sensors based on other QDs or organic molecules, which is highly helpful to monitor redox balance in organisms. This work provides a facile and ultra-fast method for mass synthesis of water soluble MoO3−x QDs, which could be used as efficient fluorescence biosensors. In addition, these MoO3−x QDs are also candidate materials for the fields of energy, catalysis and biomedical science.Conflicts of interest
There are no conflicts to declare.Acknowledgements
The authors acknowledge the financial support from the National Science Fund for Distinguished Young Scholars (Grant No. 51825103), the Natural Science Foundation of China (Grant No. 51771188), and the National Key Research and Development Program of China (Grant No. 2017YFA0207101). The electronic spin resonance spectra were obtained at the Steady High Magnetic Field Facilities, High Magnetic Field Laboratory, CAS.Notes and references
- L. Pan, S. Sun, A. Zhang, K. Jiang, L. Zhang, C. Dong, Q. Huang, A. Wu and H. Lin, Adv. Mater., 2015, 27, 7782–7787 Search PubMed.
- F. Li, T. Li, C. Sun, J. Xia, Y. Jiao and H. Xu, Angew. Chem., Int. Ed., 2017, 56, 9910–9914 Search PubMed.
- L. Jiang, H. Ding, S. Lu, T. Geng, G. Xiao, B. Zou and H. Bi, Angew. Chem., Int. Ed., 2020, 59, 9986–9991 Search PubMed.
- Z. Zhu, R. Cheng, L. Ling, Q. Li and S. Chen, Angew. Chem., Int. Ed., 2020, 59, 3099–3105 Search PubMed.
- K. Jiang, L. Zhang, J. Lu, C. Xu, C. Cai and H. Lin, Angew. Chem., Int. Ed., 2016, 55, 7231–7235 Search PubMed.
- A. Saha, E. Oleshkevich, C. Vinas and F. Teixidor, Adv. Mater., 2017, 29, 1704238 Search PubMed.
- Y. Wang, Y. Zhu, J. Huang, J. Cai, J. Zhu, X. Yang, J. Shen, H. Jiang and C. Li, J. Phys. Chem. Lett., 2016, 7, 4253–4258 Search PubMed.
- J. Song, J. Li, X. Li, L. Xu, Y. Dong and H. Zeng, Adv. Mater., 2015, 27, 7162–7167 Search PubMed.
- X. Li, Y. Wu, S. Zhang, B. Cai, Y. Gu, J. Song and H. Zeng, Adv. Funct. Mater., 2016, 26, 2435–2445 Search PubMed.
- A. Chowdhury, K. Takemura, T. Li, T. Suzuki and E. Park, Nat. Commun., 2019, 10, 3737 Search PubMed.
- Z. Xu, S. Lin, N. Onofrio, L. Zhou, F. Shi, W. Lu, K. Kang, Q. Zhang and S. Lau, Nat. Commun., 2018, 9, 4164 Search PubMed.
- J. Caputo, L. Frenette, N. Zhao, K. Sowers, T. Krauss and D. Weix, J. Am. Chem. Soc., 2017, 139, 4250–4253 Search PubMed.
- W. Li, Y. Liu, M. Wu, X. Feng, S. Redfern, Y. Shang, X. Yong, T. Feng, K. Wu, Z. Liu, B. Li, Z. Chen, J. Tse, S. Lu and B. Yang, Adv. Mater., 2018, 30, 1800676 Search PubMed.
- S. Zhu, Q. Meng, L. Wang, J. Zhang, Y. Song, H. Jin, K. Zhang, H. Sun, H. Wang and B. Yang, Angew. Chem., Int. Ed., 2013, 52, 3953–3957 Search PubMed.
- B. Chen, F. Li, S. Li, W. Weng, H. Guo, T. Guo, X. Zhang, Y. Chen, T. Huang, X. Hong, S. You, Y. Lin, K. Zeng and S. Chen, Nanoscale, 2013, 5, 1967–1971 Search PubMed.
- T. Pons, S. Bouccara, V. Loriette, N. Lequeux, S. Pezet and A. Fragola, ACS Nano, 2019, 13, 3125–3131 Search PubMed.
- G. Lv, W. Guo, W. Zhang, T. Zhang, S. Li, S. Chen, A. Eltahan, D. Wang, Y. Wang, J. Zhang, P. Wang, J. Chang and X. Liang, ACS Nano, 2016, 10, 9637–9645 Search PubMed.
- H. Li, Q. Xu, X. Wang and W. Liu, Small, 2018, 14, 1801523 Search PubMed.
- D. Ding, W. Guo, C. Guo, J. Sun, N. Zheng, F. Wang, M. Yan and S. Liu, Nanoscale, 2017, 9, 2020–2029 Search PubMed.
- M. Alsaif, K. Latham, M. Field, D. Yao, N. Medhekar, G. Beane, R. Kaner, S. Russo, J. Ou and K. Kalantar-zadeh, Adv. Mater., 2014, 26, 3931–3937 Search PubMed.
- H. Cheng, T. Kamegawa, K. Mori and H. Yamashita, Angew. Chem., Int. Ed., 2014, 53, 2910–2914 Search PubMed.
- M. Vasilopoulou, A. Douvas, D. Georgiadou, L. Palilis, S. Kennou, L. Sygellou, A. Soultati, I. Kostis, G. Papadimitropoulos, D. Davazoglou and P. Argitis, J. Am. Chem. Soc., 2012, 134, 16178–16187 Search PubMed.
- Q. Huang, S. Hu, J. Zhuang and X. Wang, Chem. – Eur. J., 2012, 18, 15283–15287 Search PubMed.
- I. Kostis, N. Vourdas, G. Papadimitropoulos, A. Douvas, M. Vasilopoulou, N. Boukos and D. Davazoglou, J. Phys. Chem. C, 2013, 117, 18013–18020 Search PubMed.
- G. Song, J. Hao, C. Liang, T. Liu, M. Gao, L. Cheng, J. Hu and Z. Liu, Angew. Chem., Int. Ed., 2016, 55, 2122–2126 Search PubMed.
- X. Hu, F. Li, F. Xia, X. Guo, N. Wang, L. Liang, B. Yang, K. Fan, X. Yan and D. Ling, J. Am. Chem. Soc., 2020, 142, 1636–1644 Search PubMed.
- S. Xiao, X. Zhao, P. Hu, Z. Chu, C. Huang and L. Zhang, ACS Appl. Mater. Interfaces, 2016, 8, 8184–8191 Search PubMed.
- H. Li, Q. Zhang, C. Yap, B. Tay, T. Edwin, A. Olivier and D. Baillargeat, Adv. Funct. Mater., 2012, 22, 1385–1390 Search PubMed.
- K. Artyushkova, B. Kiefer, B. Halevi, A. Knop-Gericke, R. Schlogl and P. Atanassov, Chem. Commun., 2013, 49, 2539–2541 Search PubMed.
- M. Smith and U. Ozkan, J. Catal., 1993, 141, 124–139 Search PubMed.
- D. Ganta, S. Sinha and R. Haasch, Surf. Sci. Spectra, 2014, 21, 19–27 Search PubMed.
- C. Zhang, W. Bu, D. Ni, C. Zuo, C. Cheng, Q. Li, L. Zhang, Z. Wang and J. Shi, J. Am. Chem. Soc., 2016, 138, 8156–8164 Search PubMed.
- Y. Okamoto, T. Imanaka and S. Teranishi, J. Catal., 1980, 65, 448–460 Search PubMed.
- P. Sundberg, C. Andersson, B. Folkesson and R. Larsson, J. Electron Spectrosc. Relat. Phenom., 1988, 46, 85–92 Search PubMed.
- F. Bournel, C. Laffon, P. Parent and G. Tourillon, Surf. Sci., 1996, 350, 60–78 Search PubMed.
- T. Gordon, M. Cargnello, T. Paik, F. Mangolini, R. Weber, P. Fornasiero and C. Murray, J. Am. Chem. Soc., 2012, 134, 6751–6761 Search PubMed.
- S. Cong, Y. Tian, Q. Li, Z. Zhao and F. Geng, Adv. Mater., 2014, 26, 4260–4267 Search PubMed.
- C. Gao, J. Wang, H. Xu and Y. Xiong, Chem. Soc. Rev., 2017, 46, 2799–2823 Search PubMed.
- J. Hühn, C. Carrillo-Carrion, M. Soliman, C. Pfeiffer, D. Valdeperez, A. Masood, I. Chakraborty, L. Zhu, M. Gallego, Z. Yue, M. Carril, N. Feliu, A. Escudero, A. Alkilany, B. Pelaz, P. del Pino and W. Parak, Chem. Mater., 2016, 29, 399–461 Search PubMed.
- P. Wang, K. Wang, D. Chen, Y. Mao and Y. Gu, RSC Adv., 2015, 5, 85957–85963 Search PubMed.
- B. Dong, X. Song, X. Kong, C. Wang, Y. Tang, Y. Liu and W. Lin, Adv. Mater., 2016, 28, 8755–8759 Search PubMed.
- X. Xie, X. Yang, T. Wu, Y. Li, M. Li, Q. Tan, X. Wang and B. Tang, Anal. Chem., 2016, 88, 8019–8025 Search PubMed.
- F. Xu, H. Li, Q. Yao, J. Fan, J. Wang and X. Peng, J. Mater. Chem. B, 2016, 4, 7363–7367 Search PubMed.
- H. Yang, F. Li, C. Zou, Q. Huang and D. Chen, Microchim. Acta, 2017, 184, 2055–2062 Search PubMed.
- H. Guo, G. Chen, M. Gao, R. Wang, Y. Liu and F. Yu, Anal. Chem., 2019, 91, 1203–1210 Search PubMed.
- N. Li, A. Than, C. Sun, J. Tian, J. Chen, K. Pu, X. Dong and P. Chen, ACS Nano, 2016, 10, 11475–11482 Search PubMed.
Footnote |
| † Electronic supplementary information (ESI) available. See DOI: 10.1039/d0nh00394h |
| This journal is © The Royal Society of Chemistry 2020 |