
Single-layer boron-doped graphene quantum dots for contrast-enhanced in vivo T1-weighted MRI†
Hui
Wang‡
 ab,
Richard
Revia‡
a,
Qingxin
Mu
a,
Guanyou
Lin
a,
Charles
Yen
a and
Miqin
Zhang
*a
ab,
Richard
Revia‡
a,
Qingxin
Mu
a,
Guanyou
Lin
a,
Charles
Yen
a and
Miqin
Zhang
*a
aDepartment of Materials Science and Engineering, University of Washington, Seattle, Washington 98195, USA. E-mail: mzhang@uw.edu
bThe Anhui Key Laboratory of Condensed Matter Physics at Extreme Conditions, High Magnetic Field Laboratory, Hefei Institutes of Physical Science, Chinese Academy of Sciences, Hefei, Anhui 230031, China
First published on 16th December 2019
Abstract
Gadolinium (Gd)-based chelates are used as clinical T1 contrast agents for magnetic resonance imaging (MRI) due to their demonstrated high sensitivity and positive contrast enhancement capability. However, there has been an increasing safety concern about their use in medicine because of the toxicity of the metal ions released from these contrast agents when used in vivo. Although significant effort has been made in developing metal-free MRI contrast agents, none have matched the magnetic properties achieved by the gold standard clinical contrast agent, Gd diethylene penta-acetic acid (Gd-DTPA). Here, we report the development of a single-layer, boron-doped graphene quantum dot (termed SL-BGQD) that demonstrates better T1 contrast enhancement than Gd-DTPA. The SL-BGQD is shown to provide significantly higher positive contrast enhancement than the Gd-DTPA contrast agent in imaging vital organs, including kidneys, liver, and spleen, and especially, vasculatures. Further, our results show that the SL-BQGD is able to bypass the blood–brain barrier and allows sustained imaging for at least one hour with a single injection. Hematological and histopathological analyses show that the SL-BGQD demonstrates a non-toxic profile in wild-type mice and may, therefore, serve as an improved, safer alternative to currently available clinical MRI contrast agents.
New conceptsClinical positive T1-weighted contrast agents used to improve the diagnostic capabilities of magnetic resonance imaging (MRI) are based on gadolinium chelates with known toxicity issues. Most experimental contrast agents also contain similar problematic metal atoms serving as their source of contrast enhancement. Alternatively, reported metal-free contrast agents fall far short of matching the contrast enhancement capabilities of clinical contrast agents. We report a completely metal-free MRI contrast agent developed upon single-layer boron-doped graphene quantum dots. Our graphene-based platform offers a biologically safe alternative to metal-based contrast agents while matching the contrast-enhancing abilities of a gold standard gadolinium-based contrast agent as demonstrated by measurements of the longitudinal and transverse relaxivity values, as well as in vivo MRI. This study provides new insight into the rational design of metal-free contrast agents for biomedical imaging and conceptual advancements in the development of graphene quantum dots for unique magnetic properties by elemental doping and structural engineering. |
1. Introduction
A variety of imaging technologies have been developed for disease diagnosis and its early detection and are used in the clinic, including magnetic resonance (MR) imaging, optical fluorescence imaging, X-ray computed tomography, positron-emission tomography, and ultrasound imaging.1,2 Among these imaging technologies, MR imaging is one of the most powerful non-invasive diagnostic modalities for the determination of locations and extents of diseased tissues. In MR imaging, contrast arises from the difference in the MR relaxivity of hydrogen nuclei in water molecules between different tissues; these disparities are caused by the unique local magnetic field properties in which the hydrogen nuclei reside.3,4 Although the diagnosis of major diseases by MR imaging has achieved significant progress, the ability to differentiate diseased tissue from healthy tissue remains to be improved, especially at the early stages of disease.5 The introduction of contrast agents to MR imaging has become increasingly important to the improvement in diagnostic imaging. More than half of MR imaging studies performed nowadays involve the use of contrast agents.6 Contrast enhancement is achieved by increasing the rate of transverse relaxation, R2, in T2-weighted imaging or by accelerating the recovery of the longitudinal relaxation rate, R1, in T1-weighted imaging.7 Contrast agents used for T1-weighted imaging produce hyperintense contrast; that is, images appear brighter due to the presence of the contrast agents. However, clinical T1-weighted contrast agents, primarily gadolinium (Gd)-based chelates or complexes, have their limitations including (i) low vascular permeation, (ii) poor sensitivity limiting their diagnostic efficacy, (iii) rapid renal clearance, (iv) the potential risk of causing nephrogenic systemic fibrosis in patients with declining renal function,8,9 and (v) potential harmful effects on the brain due to long-term Gd retention in neurological tissue.10,11Use of nanomaterials to develop T1 contrast agents may overcome the limitations of current Gd-based contrast agents.12–15 Paramagnetic metal-based nanoparticles (NPs) have been found to produce MR sensitivities greater than Gd-based complexes.16–20 However, the potential of metal leaching associated with these NPs poses safety concerns and leads to particle aggregation, therefore, hindering their use in long-term in vivo imaging applications. Although surface coating of metal-NP contrast agents may temporarily reduce the risk of toxicity by suppressing the release of metal atoms into the body, the eventual degradation of the nanomaterial, which is an intentional design consideration for most nanomaterials used for in vivo applications, would lead to the release of metal atoms.21,22 Additionally, the surface coating may hamper the diffusion of water molecules toward paramagnetic sites within the NPs, thus weakening the observed MR signal enhancement.21 Furthermore, the increased hydrodynamic size (>100 nm) due to the coating may compromise the NP's ability to cross the blood–brain barrier (BBB), thereby limiting their use in neurological MR imaging.23 These limitations prompt the incentive to develop small-size, metal-free MR contrast agents with minimal biological toxicity and higher imaging sensitivity.
Graphene quantum dots (GQDs) have attracted much attention in medicine due to their biologically-benign properties demonstrated both in vitro and in vivo.24 By doping GQDs with a non-metallic element (e.g., boron or fluorine), the non-magnetic GQDs become magnetic and are able to serve as contrast agents in T1-weighted MR imaging.25,26 The ability of a contrast agent to enhance the T1-weighted signal in an MR image is correlated to its longitudinal relaxivity, r1, value and the ratio of the transverse relaxivity, r2, to the longitudinal relaxivity (i.e., r2/r1). The greater the r1, the greater the observed T1-weighted signal enhancement; meanwhile, the r2 of the agent should be limited; otherwise, a large r2 would overshadow the agent's effect on the longitudinal MR properties.27 Practically, a T1 contrast agent is required to have r1 > 5 and r2/r1 < 5 for contrast enhancement.16,28 The GQD-based contrast agents reported thus far have yet to achieve the requisite low r2/r1 ratio; in other words, they have not demonstrated a T1 contrast enhancement ability comparable to those exhibited by clinically used Gd-based contrast agents. One possible factor that leads to the observed limited performance of these agents is their multi-layer structures (e.g., a GQD composed of many stacked sheets of graphene held together by electrostatic forces). The multi-layer structure inhibits the diffusion of water towards paramagnetic sites created by dopants or vacancy defects, which may weaken the contrast enhancement ability of the material. Metal-free NPs have less active paramagnetic centers than Gd complexes and thus have lower r1 values (i.e., low T1 contrast enhancement).
Here, we report on the construction of single-layer, boron-doped GQDs (SL-BGQDs) that circumvent the limitations discussed above and substantially improve MR contrast enhancement capabilities. The high MR T1 contrast enhancement is achieved by the creation of a large number of paramagnetic centers within the graphene lattice through boron doping that creates defects and by maximizing the interaction between water molecules and paramagnetic centers on both sides of the single material layer. SL-BGQDs are shown to have a higher longitudinal relaxivity (r1 = 8.5 mM−1 s−1) and a slightly lower r2/r1 ratio (= 1.08), as compared to the clinical T1 contrast agent Gd-DTPA with r1 = 4.3 mM−1 s−1 and r2/r1 = 1.17 at a magnetic field strength of 14 T. Significantly, SL-BGQDs exhibit no cytotoxicity to cells and tissues while Gd-DTPA was found to be toxic. T1-weighted MR images of mice intravenously injected with either SL-BGQDs or Gd-DTPA showed that the injection of SL-BGQDs demonstrated greater contrast enhancement than the injection of Gd-DTPA in vital organs including kidneys, liver, spleen, and vasculatures. Finally, confocal microscopy images of brain tissues acquired from wide-type mice after intravenous administration of SL-GBQDs revealed SL-BGQDs’ ability to cross the BBB.
2. Results and discussion
To synthesize boron-doped GQDs of only a single layer, we modified a one-step solvothermal process we established previously for the synthesis of multi-layered, boron-doped GQDs.26 The same precursors, 4-vinylphenylboronic acid (VPBA) and boric acid, and solution, acetone/hydrogen peroxide, were used here. The amount of hydrogen peroxide was doubled to create a larger liquid–gas interface upon which to decompose VPBA molecules, and thus form GQDs with a smaller size, a narrower size distribution, and fewer layers. The transmission electron microscopy (TEM) image in Fig. 1a shows that SL-BGQDs are well dispersed and have an average size of 4.6 ± 1.4 nm (Fig. S1, ESI†). The high-resolution TEM (HRTEM) image in Fig. 1b reveals that SL-BGQDs have a superlattice structure with an interplanar distance of ∼0.237 nm, corresponding to the (100) lattice planes of graphite.29 Vacancy defects in SL-BGQDs are also identifiable in Fig. 1b (red circles). The thickness of the SL-BGQDs was characterized by atomic force microscopy (AFM) to be around 0.8 nm (Fig. 1c and d), indicating a single-layer structure of SL-BGQDs.30 The single-layer structure eliminates the possibility of spin pairing of boron in adjacent graphene layers as occurs in multi-layer boron-doped GQD structures and facilitates the bidirectional interaction of water molecules with the boron atoms in SL-BGQDs, which improves their magnetic properties and their ability for contrast enhancement in MR imaging.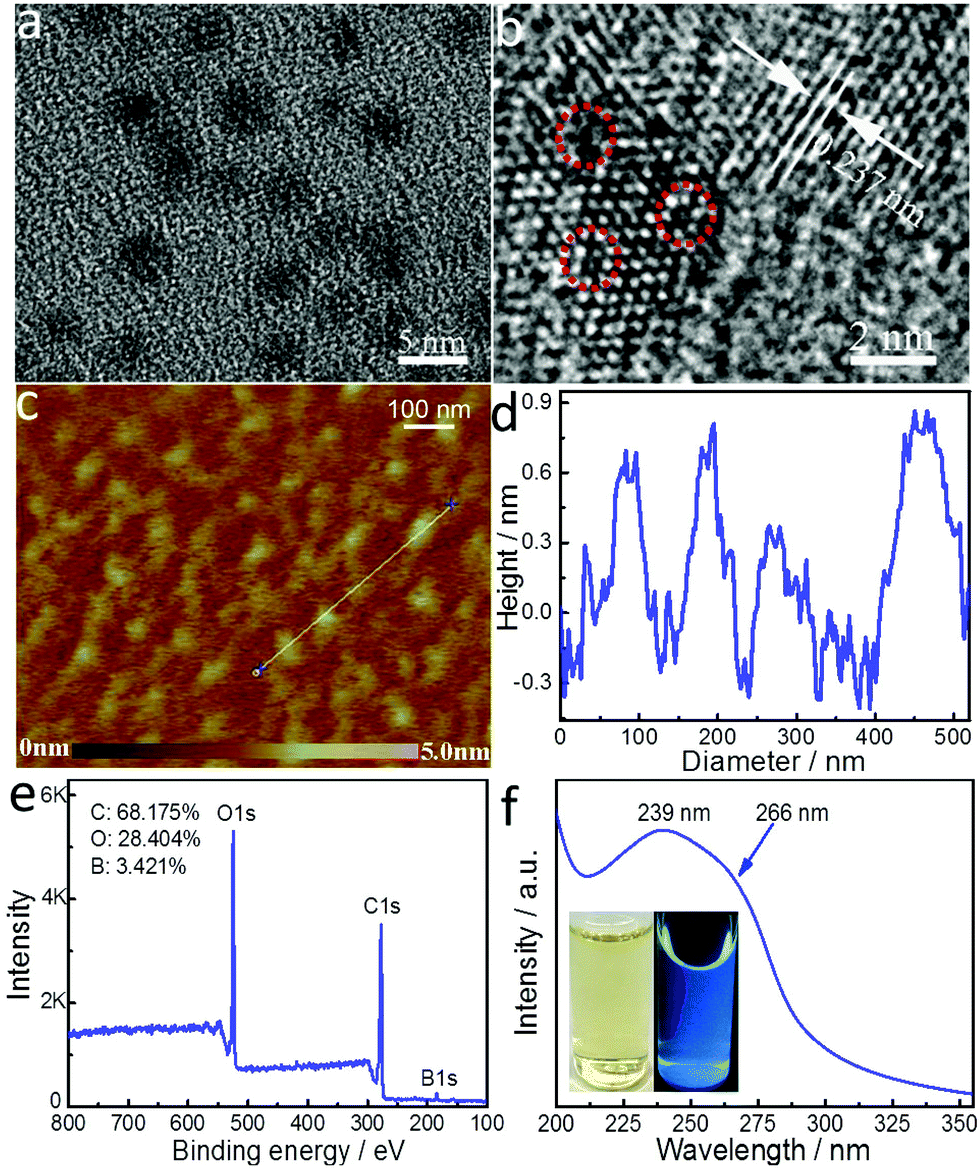 | ||
| Fig. 1 Physicochemical properties of SL-BGQDs. (a) TEM and (b) HRTEM images of SL-BGQDs. The red circles in (b) mark the locations of vacancy defects in SL-BGQDs. (c) AFM image and (d) the height profile corresponding to the white line segment shown in (c). (e) XPS and (f) UV absorption spectra of SL-BGQDs. The inset in (f) shows photographs of the aqueous dispersion of SL-BGQDs with (right bottle) and without (left bottle) UV light radiation (365 nm). | ||
Powder X-ray diffraction (XRD) and Raman spectroscopy were used to obtain further crystallographic structure and phase purity information about SL-BGQDs, respectively (Fig. S2 and S3, ESI†). The characteristic peak at ∼20° in the XRD pattern (Fig. S2, ESI†) can be indexed to bulk graphite.31 SL-BGQDs exhibited a large Raman peak at 1574 cm−1 (G band) (Fig. S3, ESI†). The intensity ratio of the G to D bands was determined to be 1.1, indicating a high degree of graphitization since the signal of the ordered G band is similar to or slightly greater than the signal of the disordered D band.32 A large number of defects are also present in SL-BGQDs evidenced by the Raman spectrum peak at 1345 cm−1 (D band); here, the D band is activated by the destruction of the sp2 hybridized graphene network due to sp3 hybridized C atoms bonded to boron.33
An analysis of the surface elemental characteristics of SL-BGQDs by X-ray photoelectron spectroscopy (XPS) shows that carbon (68.175%), oxygen (28.404%), and boron (3.421%) are present on the surface of SL-BGQDs (Fig. 1e). The XPS spectrum does not show the presence of any metal impurities, further confirming the metal-free nature of SL-BGQDs. In the expanded high-resolution XPS spectra (Fig. S4, ESI†), the C 1s peaks at 284.7, 286.2, and 288.6 eV are assigned to carbon atoms in the form of C–C (sp3)/C![[double bond, length as m-dash]](https://www.rsc.org/images/entities/char_e001.gif) C (sp2), C–O (sp3), and O–CO (sp2), respectively.34 The O 1s peaks at 532.1, 532.5, and 532.8 eV are associated with CO quinone-type groups, C–OH phenol groups, and C–O–C ether groups, respectively.35 The B 1s peaks at 191.2 and 191.6 eV are attributed to sp2 CB bonds.36,37 In addition, the B 1s peak at 192.4 eV is associated with B–O bonds.38 The peaks at 191.2 and 191.6 eV provide further evidence of boron doping in SL-BGQDs.
C (sp2), C–O (sp3), and O–CO (sp2), respectively.34 The O 1s peaks at 532.1, 532.5, and 532.8 eV are associated with CO quinone-type groups, C–OH phenol groups, and C–O–C ether groups, respectively.35 The B 1s peaks at 191.2 and 191.6 eV are attributed to sp2 CB bonds.36,37 In addition, the B 1s peak at 192.4 eV is associated with B–O bonds.38 The peaks at 191.2 and 191.6 eV provide further evidence of boron doping in SL-BGQDs.
The UV absorption spectrum (Fig. 1f) of SL-BGQDs shows an absorption peak at ∼239 nm resulting from the π–π* transition of aromatic domains in SL-BGQDs.39 A shoulder peak at 266 nm is also observed, which is attributed to the n–π* transition of carbonyl groups (CO bonds) and the characteristic absorption peak of GQDs, which confirms the presence of functional groups.40 When aqueous dispersions of SL-BGQDs were exposed to UV light (365 nm), blue light was emitted from the dispersions (inset in Fig. 1f). The excitation wavelength-tunable, upconverted fluorescence (Fig. S5, ESI†) from SL-BGQDs confirms their quantum confinement effect.41 Fourier transform infrared (FT-IR) spectroscopy was used to evaluate additional surface properties of SL-BGQDs (Fig. S6, ESI†). FT-IR absorption peaks at 3416 cm−1 and 1714 cm−1 correspond to –OH and CO stretching modes, respectively; these peaks indicate the presence of hydroxyl and carboxyl groups on SL-BGQDs, which endows them with good water-solubility.42
Magnetic properties of SL-BGQDs were assessed with a superconducting quantum interference device. Fig. 2a shows the magnetization hysteresis loop for SL-BGQDs measured at a temperature of 6 K in the field range of −10 kOe < H < +10 kOe, from which the saturation of magnetization is identified at Ms = 0.121 emu g−1 after subtracting the diamagnetic background. The saturation of magnetization at 300 K for SL-BGQDs was similarly identified to be Ms = 0.0197 emu g−1 (Fig. 2b), which also indicates that SL-BGQDs have a very weak ferromagnetic ordering at room temperature. The magnetic properties of SL-BGQDs result from the breaking of π-bonds in boron-doped GQDs due to missing C atoms, which induces unpaired electrons and partial spin polarization in SL-BGQDs.43 Importantly, the boron atoms in SL-BGQDs provide paramagnetic centers for T1-weighted MR imaging since localized doping produces local magnetic moments and spins of dangling bonds (B–C bond). To evaluate the applicability of using SL-BGQDs as contrast agents for MR imaging, quantitative T1 and T1-weighted MR imaging scan sequences were acquired of SL-BGQD samples in phosphate buffered saline (PBS) at a magnetic field strength of 14 T. As shown in Fig. 2c, the T1-weighted signal intensity increases with increasing SL-BGQD concentration (i.e., an increase in boron concentration). 1/T1 was then plotted against the boron molar concentration in SL-BGQDs (Fig. 2d). The relaxation rate R1 (= 1/T1) exhibits a linear relationship with boron molar concentration, and the longitudinal relaxivity, r1 (the slope of the best fit line in this linear relation) of SL-BGQDs, was evaluated to be 8.5 mM−1 s−1 (Fig. 2d). A concentration-dependent negative signal enhancement effect was clearly observed for a T2-weighted MR scan sequence (Fig. S7, ESI†), and the r2 value of SL-BGQDs was determined to be 9.2 mM−1 s−1 based on the linear relation between the transverse relaxation and boron molar concentrations (Fig. S8, ESI†). There are two design principles that regulate the development of T1 contrast agents: (i) r1 should be large (r1 > 5) and (ii) the ratio of r2 to r1 should be small (r2/r1 < 5).16,28,44,45 Throughout the development of SL-BGQDs as T1 contrast agents, we compared the relaxivity values and qualitative in vitro MR imaging results to the gold standard clinical T1 contrast agent: Gd-DTPA. As shown in Fig. S9 (ESI†), the r1 and r2 relaxivities of Gd-DTPA were measured to be 4.3 mM−1 s−1 and 5.03 mM−1 s−1, respectively, which yields r2/r1 = 1.17. The r1 of SL-BGQDs (Fig. 2d) is r1 = 8. 5 mM−1 s−1, about two times greater than that of Gd-DTPA, and the r2/r1 ratio of SL-BGQDs is 1.08, slightly smaller (i.e., better) than that of Gd-DTPA.
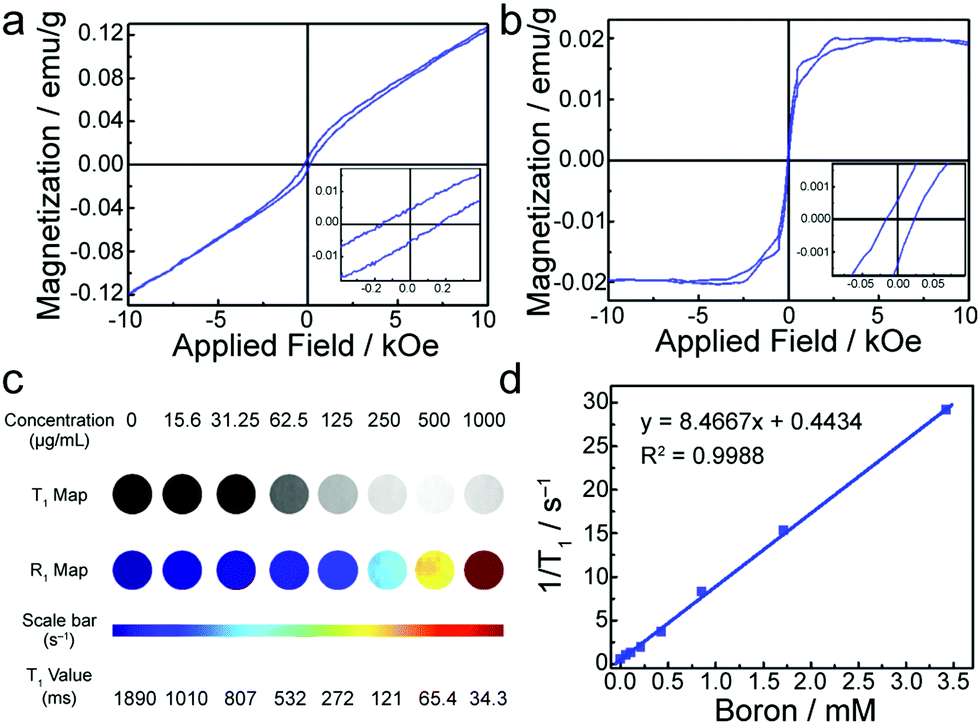 | ||
| Fig. 2 Magnetic properties and in vitro MR imaging of SL-BGQDs. (a and b) Magnetization hysteresis loops of SL-BGQDs at (a) 6 K and (b) 300 K in the range of −10 kOe < H < +10 kOe. The insets in a and b are the magnetization hysteresis loops expanded around 0 applied field. (c) T1-weighted MR images and quantitative R1 maps of SL-BGQDs at different SL-BGQD concentrations. (d) Plot of 1/T1 (R1) as a function of the boron concentration in SL-BGQDs. The slope of the curve is defined as the longitudinal relaxivity, r1. | ||
The ability of SL-BGQDs to serve as T1 contrast agents was assessed in vivo with a 14 T MR imaging system using a C57BL/6 wild-type mouse model. 200 μL of SL-BGQDs (1 mg mL−1) dispersed in PBS solution was administered via intravenous injection. As a reference, MR images were also acquired from mice similarly treated with Gd-DTPA (200 μL, 1 mg mL−1). T1-weighted MR images of the cross-sectional views of mice centered within the abdomen were acquired before and after contrast agent injection. As shown in Fig. 3a (showing the posterior abdomen) and Fig. S10 (showing the anterior abdomen, ESI†), both SL-BGQDs and Gd-DTPA demonstrated a substantial signal enhancement in the renal cortex (RC), renal pelvis (RP), and gall bladder (GB) as evidenced by comparing the post-injection images with the pre-injection images. In addition, SL-BGQDs demonstrated slightly better signal enhancement in the liver and spleen compared to Gd-DTPA. The contrast enhancement by Gd-DTPA peaked within the first 10 min post-injection, but quickly declined over a 20 to 30 min period, and the observed contrast enhancement faded out by 60 min post-injection. SL-BGQDs demonstrated greater T1-weighted contrast enhancement as well as a prolonged hyperintense T1-weighted signal in most of the organs analysed (e.g., kidneys, liver, and spleen). These observations were confirmed by quantitative analysis of MR signal strengths (Fig. 3b and c). The change in T1-weighted signal between pre- and post-injection images in the liver and spleen of mice treated with SL-BQGDs at 60 min post-injection increased by 232.8% and 207.6%, respectively. In contrast, no T1-weighted signal increase was detected in any organ in mice injected with Gd-DTPA at 60 min post-injection as compared to those acquired pre-injection.
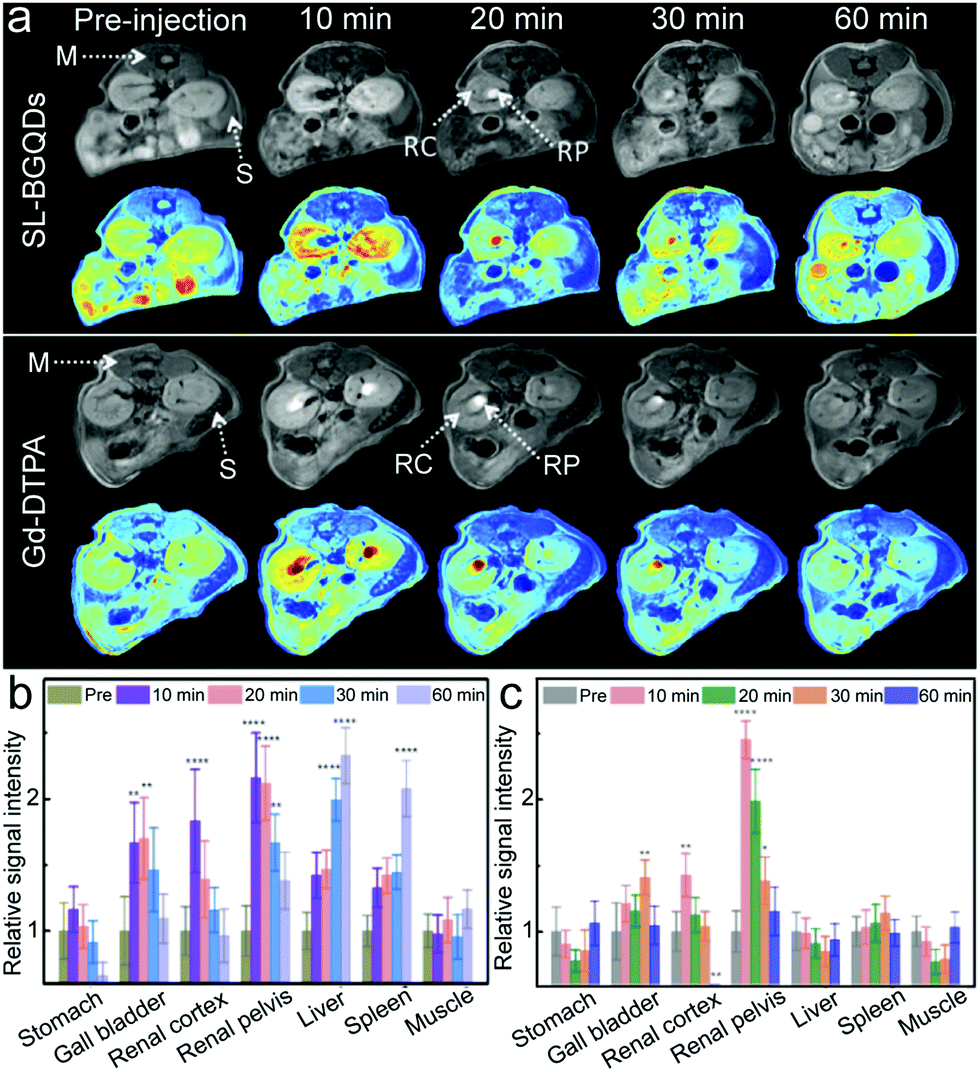 | ||
| Fig. 3 In vivo abdominal MR imaging of mice intravenously administered with SL-BGQDs or Gd-DTPA. (a) T1-weighted MR images of the cross-sections of mice receiving SL-BGQDs (upper panel) or Gd-DTPA (lower panel) treatments acquired using dynamic time-resolved MR imaging at various time points post-injection. Both grayscale and colorized images are displayed for each experimental group. The arrows point to various organs: muscle (M), spleen (S), renal cortex (RC), and renal pelvis (RP). (b and c) Relative T1-weighted signal intensity in mice injected intravenously with (b) SL-BGQDs or (c) Gd-DTPA, acquired with dynamic time-resolved MR imaging from organs of interest before and at different time points after the administration of contrast agents. One-way and two-way analyses of variance followed by Tukey's or Sidak's post hoc multiple comparison tests were used for comparisons of multiple groups. (*p < 0.05, **p < 0.01, ***p < 0.001, ****p < 0.0001). | ||
To further evaluate the efficacy of SL-BGQDs as an in vivo T1 contrast agent, we performed cranial MR imaging to acquire a map of the neurovasculature of mice. The entire heads of the mice were imaged using a T1-weighted scan sequence prior to and 10 min after injection of 200 μL, 5 mg mL−1 of either SL-BGQDs or Gd-DTPA. Fig. 4 shows the maximum intensity projections of representative pre- and post-injection images from mice receiving SL-BGQD (Fig. 4a and b) or Gd-DTPA (Fig. 4c and d). Cranial blood vessels could hardly be identified in pre-injection images for either group. Conversely, the vascular structures were clearly seen after SL-BGQD administration: the great cerebral vein was seen in the sagittal view (yellow arrow), and the superior sagittal sinus was evident in the coronal view (red arrow). Mice receiving Gd-DTPA with a dose identical to that of SL-BGQD showed no apparent change in contrast between pre- and post-injection images. The great positive contrast enhancement provided by SL-BGQDs is attributed to their high r1 value.
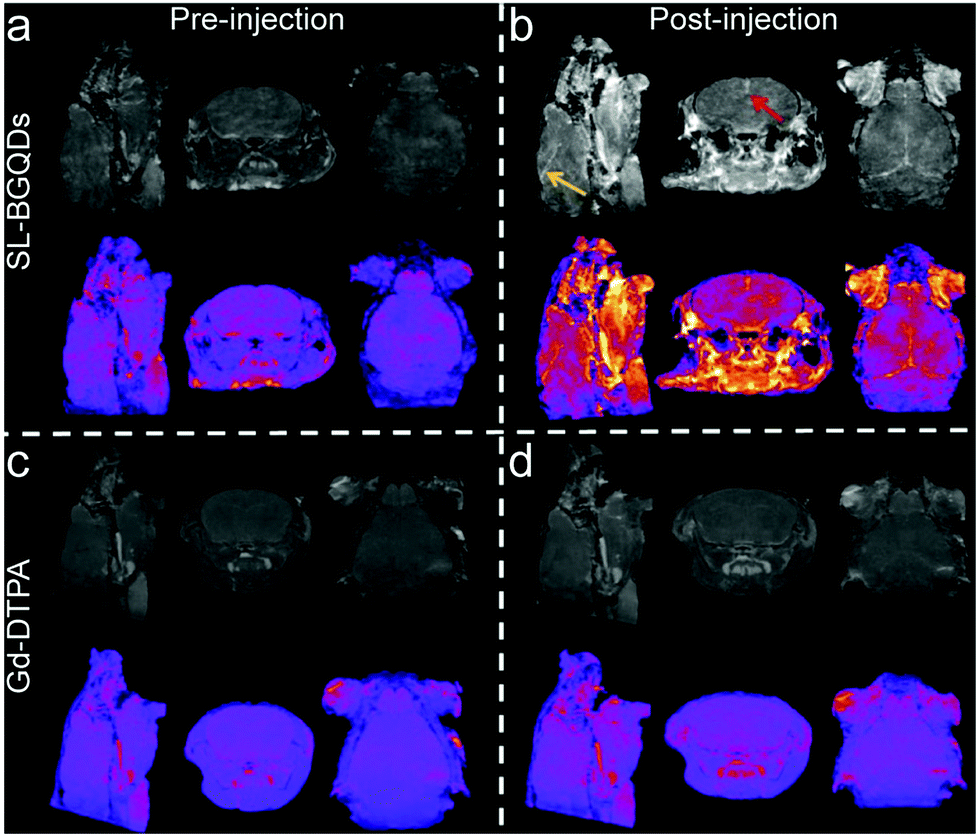 | ||
| Fig. 4 In vivo cranial MR imaging. T1-weighted MR images of the cross-sections of mice receiving either SL-BGQD (a and b) or Gd-DTPA (c and d) treatment prior to (left panels) and 10 min after (right panels) intravenous injection of contrast agent. The yellow arrow denotes the great cerebral vein, and the red arrow denotes the superior sagittal sinus. | ||
To evaluate the BBB permeability of SL-BGQDs, a property that is essential for neurological imaging, wild-type mice were intravenously injected with SL-BGQDs. Brain sections of the mice were histologically analyzed 1 h post-injection. Tissue sections were stained with anti-CD31 antibody for visualization of endothelial blood vessels and with DAPI for cell nuclei visualization. Brain tissues from PBS-treated mice as a control showed no fluorescence signal 1 h post-injection (Fig. 5a–d), whereas those from mice receiving SL-BGQDs exhibited red fluorescence (Fig. 5e–h), confirming that SL-BGQDs bypassed the BBB and accumulated in the brain tissues of live mice. We speculate that the nanoparticle-induced endothelial leakiness (NanoEL) effect46,47 may be the primary mechanism by which SL-BGQDs penetrated the BBB.
 | ||
| Fig. 5 Confocal fluorescence microscopic images of mouse brain tissue sections acquired 1 h after mice received injection of PBS (a–d) and SL-BGQDs (e–h). (a and e) Cell nuclei stained with DAPI (blue); (b and f) endothelial cells stained with anti-CD31 antibody (green); (c and g) SL-BGQDs fluoresced red (indicated with white arrows) when they were excited with a 650 nm laser; (d and h) overlaid images of mouse brain tissues from a–c and e–g, respectively. Blood vessels are encircled with white dashed lines. | ||
To assess the cytotoxicity of SL-BGQDs, three tumor cell lines (4T1, SF763, and B16F10) were treated with either SL-BGQD or Gd-DTPA for 72 h, and cell viability was assessed using the Alamar Blue assay. Cells treated with PBS were used as a reference. No cytotoxicity of SL-BGQDs or Gd-DTPA were found in any of the three tumor cell lines (Fig. S11, ESI†); more than 87% of cells from all cell lines survived 72 h after being treated with either SL-BGQDs or Gd-DTPA at concentrations up to 200 μg mL−1. These results were normalized as a percentage of cells treated with PBS for 72 h to determine the cell viability.
Tissue compatibility of SL-BGQDs was evaluated in vivo by histological analysis in wild-type mice. Various tissues (liver, spleen, lungs, and kidneys) were harvested from mice treated by intravascular injection of either SL-BGQDs, Gd-DTPA, or PBS solution (control) 72 h post-treatment and stained with hematoxylin and eosin (H&E) (Fig. S12, ESI†). The study found no sign of toxicity response in mice treated with either SL-BGQDs or Gd-DTPA agents, as healthy cell morphology was retained after treatment in all organs of interest and in all experimental groups. Further, tissue sections from the same organs were stained with DAPI and examined by fluorescence microscopy (Fig. S13, ESI†), and no abnormality in nuclear morphology was found for any of these experimental groups. These results confirm that both SL-BGQDs and Gd-DTPA have no acute toxicity to the organs and tissues examined.
Hematological toxicity was assessed for both SL-BGQDs and Gd-DTPA with PBS as a non-toxic reference control. As shown in Fig. 6a, the white blood cell (WBC) count of Gd-DTPA-treated mice was significantly lower than those from PBS-treated (control) and SL-BGQD-treated animals and are outside of the typical range for mice (reference range = 2–10 × 103 cells per μL);48 the drop in WBC count in Gd-DTPA treated mice is indicative of a stress-induced immune response.48 Two key liver enzymes associated with hepatoxicity, aspartate transaminase (AST) and alanine aminotransferase (ALT), were monitored in these mice (Fig. 6b). Only the Gd-DTPA treated mice exhibited a marked increase in the ALT-to-AST ratio, which is indicative of hepatic injury.49 In addition to histological and hematological analyses, quantitative reverse transcription polymerase chain reaction was used to detect alterations in transcription levels for genes associated with the endoplasmic reticulum stress response (bip, chop, IL-b, TNF-a, and xbp). Fig. 6c and d compare mRNA expression in the kidneys and liver between mice treated with SL-BGQDs and those treated with Gd-DTPA, assessed 24 h post-treatment; the gene expression levels from these two experimental groups were compared with gene expressions from mice injected with PBS. Gene expression levels were observed to be normal in mice treated with SL-BGQDs in the kidneys and liver. Conversely, mice treated with Gd-DTPA expressed abnormally high levels of bip in the kidneys and liver, and abnormally low levels of chop, TNF-a, and xbp in the liver. Thus, Gd-DTPA was observed to cause a significant endoplasmic reticulum stress response, while SL-BGQDs were benign in this regard. These results indicate that SL-BGQDs may be a better treatment option than Gd-DTPA in terms of biocompatibility when used as a contrast agent in MR imaging applications.
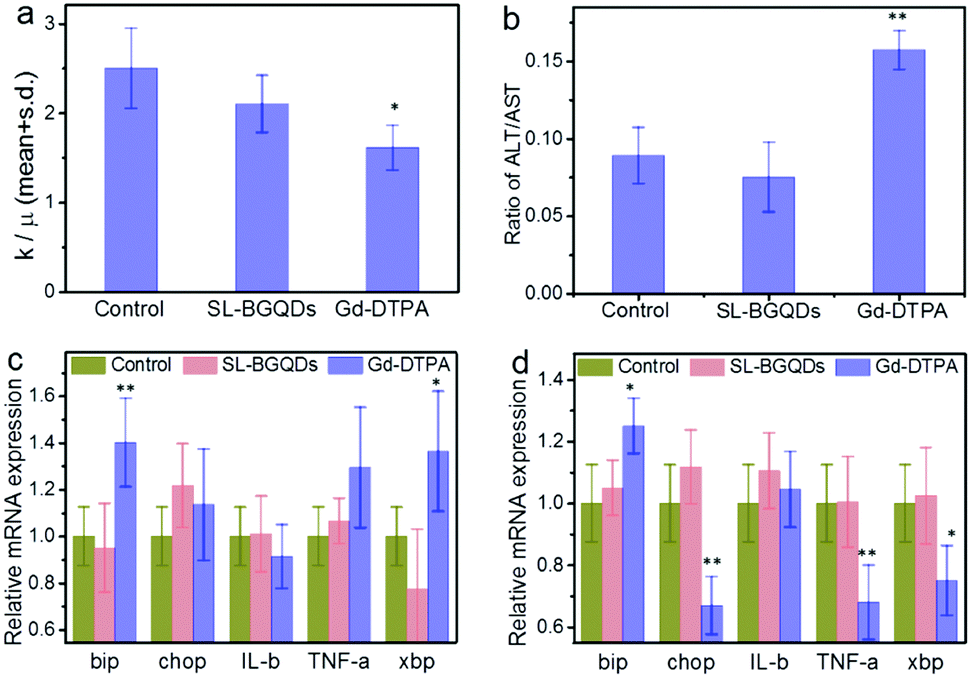 | ||
| Fig. 6 Assessment of toxic effects of SL-BGQDs and Gd-DTPA on key enzymes and genes of liver and kidneys. (a) WBC counts of mice receiving PBS (control), SL-BGQD, or Gd-DTPA injection, measured 24 h after administration. (b) Liver enzyme ratio of ALT to AST. (c and d) gene expressions of (c) kidney and (d) liver from mice treated with PBS (control), SL-BGQD, or Gd-DTPA. Data are presented as mean ± standard deviation of mean (n = 4 mice per treatment). One-way and two-way analyses of variance followed by Tukey's or Sidak's post hoc multiple comparison tests were used for comparisons of multiple groups. (*p < 0.05, **p < 0.01). | ||
3. Conclusions
We have developed single-layer, metal-free, ferromagnetic, boron-doped GQDs as a contrast agent for T1-weighted MR imaging. Compared to our previous efforts at synthesizing boron-doped GQDs for creating MR contrast agents,26 we have made significant improvements in this study in the contrast-enhancing capabilities of GQDs by fine-tuning the synthesis procedure to ensure a single-layered product as opposed to a multi-layered GQD ensemble. The single-layered nature of SL-BGQDs imbues them with improved magnetic properties for T1-weighted MR imaging compared to multi-layered boron-doped GQDs. SL-BGQDs demonstrated an excellent r2/r1 ratio (1.08). Furthermore, we have provided a more comprehensive experimental verification of the ability of SL-BGQDs to serve as an MR contrast agent in vivo. Significantly, our findings revealed that, at equivalent and relevant doses for MR imaging applications, SL-BGQDs exhibit a more stable safety profile than a clinically used Gd-based T1 contrast agent. Furthermore, we demonstrated that SL-BGQDs can pass the BBB and have a prolonged imaging time (∼60 min) as compared to Gd-DTPA (∼10 min), enabling the diagnosis of brain tumors and injuries. This well-characterized metal-free SL-BGQD contrast agent may serve as a safer, improved alternative to Gd-based contrast agents for T1-weighted MR imaging in clinical applications.Conflicts of interest
There are no conflicts to declare.Acknowledgements
The work is supported in part by NIH grants (R01CA161953, R01EB026890 and F31CA232546), and Kyocera Professorship Endowment. This work is also supported by the Biomedical Research Shared Instrumentation Grant (S10RR029021 to 14T HRIM Facility, NIH). Further, we acknowledge the use of the equipment on NP characterization in Nanoengineering & Science Institute and Molecular Engineering & Science Institute supported by NSF (grant NNCI-1542101). R. R. acknowledges the support provided by the National Cancer Institute of the National Institutes of Health under Award Number F31CA232546.References
- L. Fass, Mol. Oncol., 2008, 2, 115–152 CrossRef PubMed.
- J. P. B. O’Connor, E. O. Aboagye, J. E. Adams, H. J. W. L. Aerts, S. F. Barrington, A. J. Beer, R. Boellaard, S. E. Bohndiek, M. Brady, G. Brown, D. L. Buckley, T. L. Chenevert, L. P. Clarke, S. Collette, G. J. Cook, N. M. Desouza, J. C. Dickson, C. Dive, J. L. Evelhoch, C. Faivre-Finn, F. A. Gallagher, F. J. Gilbert, R. J. Gillies, V. Goh, J. R. Griffiths, A. M. Groves, S. Halligan, A. L. Harris, D. J. Hawkes, O. S. Hoekstra, E. P. Huang, B. F. Hutton, E. F. Jackson, G. C. Jayson, A. Jones, D. M. Koh, D. Lacombe, P. Lambin, N. Lassau, M. O. Leach, T. Y. Lee, E. L. Leen, J. S. Lewis, Y. Liu, M. F. Lythgoe, P. Manoharan, R. J. Maxwell, K. A. Miles, B. Morgan, S. Morris, T. Ng, A. R. Padhani, G. J. M. Parker, M. Partridge, A. P. Pathak, A. C. Peet, S. Punwani, A. R. Reynolds, S. P. Robinson, L. K. Shankar, R. A. Sharma, D. Soloviev, S. Stroobants, D. C. Sullivan, S. A. Taylor, P. S. Tofts, G. M. Tozer, M. V. Herk, S. Walker-Samuel, J. Wason, K. J. Williams, P. Workman, T. E. Yankeelov, K. M. Brindle, L. M. McShane, A. Jackson and J. C. Waterton, Nat. Rev. Clin. Oncol., 2017, 14, 169–186 Search PubMed.
- C. Enzinger, F. Barkhof, O. Ciccarelli, M. Filippi, L. Kappos, M. A. Rocca, S. Ropele, À. Rovira, T. Schneider, N. de Stefano, H. Vrenken, C. Wheeler-Kingshott, J. Wuerfel and F. Fazekas, Nat. Rev. Neurol., 2015, 11, 676–686 CrossRef PubMed.
- R. A. Revia and M. Zhang, Mater. Today, 2016, 19, 157–168 CrossRef CAS PubMed.
- J. Koikkalainen, H. Rhodius-Meester, A. Tolonen, F. Barkhof, B. Tijms, A. W. Lemstra, T. Tong, R. Guerrero, A. Schuh, C. Ledig, D. Rueckert, H. Soininen, A. M. Remes, G. Waldemar, S. Hasselbalch, P. Mecocci, W. Van Der Flier and J. Lötjönen, NeuroImage, 2016, 11, 435–449 CrossRef PubMed.
- Y. D. Xiao, R. Paudel, J. Liu, C. Ma, Z. S. Zhang and S. K. Zhou, Int. J. Mol. Med., 2016, 38, 1319–1326 CrossRef CAS PubMed.
- Z. Gao, T. Ma, E. Zhao, D. Docter, W. Yang, R. H. Stauber and M. Gao, Small, 2016, 12, 556–576 CrossRef CAS PubMed.
- P. Stratta, C. Canavese and S. Aime, Curr. Med. Chem., 2008, 15, 1229–1235 CrossRef CAS PubMed.
- H. S. Thomsen, S. K. Morcos and P. Dawson, Clin. Radiol., 2006, 61, 905–906 CrossRef CAS PubMed.
- M. Le Fur and P. Caravan, Metallomics, 2019, 11, 240–254 RSC.
- E. Vergauwen, A.-M. Vanbinst, C. Brussaard, P. Janssens, D. D. Clerck, M. Van Lint, A. C. Houtman, O. Michel, K. Keymolen, B. Lefevere, S. Bohler, D. Michielsen, A. C. Jansen, V. Van Velthoven and S. Gläsker, Hered. Cancer Clin. Pract., 2018, 16, 2 CrossRef PubMed.
- T. H. Shin, Y. Choi, S. Kim and J. Cheon, Chem. Soc. Rev., 2015, 44, 4501–4516 RSC.
- R. Romero-Aburto, T. N. Narayanan, Y. Nagaoka, T. Hasumura, T. M. Mitcham, T. Fukuda, P. J. Cox, R. R. Bouchard, T. Maekawa, D. S. Kumar, S. V. Torti, S. A. Mani and P. M. Ajayan, Adv. Mater., 2013, 25, 5632–5637 CrossRef CAS PubMed.
- S. H. Lee, B. H. Kim, H. B. Na and T. Hyeon, Wiley Interdiscip. Rev.: Nanomed. Nanobiotechnol., 2014, 6, 196–209 CAS.
- W. S. Seo, J. H. Lee, X. Sun, Y. Suzuki, D. Mann, Z. Liu, M. Terashima, P. C. Yang, M. V. McConnell, D. G. Nishimura and H. Dai, Nat. Mater., 2006, 5, 971–976 CrossRef CAS PubMed.
- B. H. Kim, N. Lee, H. Kim, K. An, Y. I. Park, Y. Choi, K. Shin, Y. Lee, S. G. Kwon, H. B. Na, J. G. Park, T. Y. Ahn, Y. W. Kim, W. K. Moon, S. H. Choi and T. Hyeon, J. Am. Chem. Soc., 2011, 133, 12624–12631 CrossRef CAS PubMed.
- Z. Zhen and J. Xie, Theranostics, 2012, 2, 45–54 CrossRef CAS PubMed.
- Z. Shen, A. Wu and X. Chen, Mol. Pharming, 2017, 14, 1352–1364 CrossRef CAS PubMed.
- Z. Zhou, D. Huang, J. Bao, Q. Chen, G. Liu, Z. Chen, X. Chen and J. Gao, Adv. Mater., 2012, 24, 6223–6228 CrossRef CAS PubMed.
- H. B. Na, J. H. Lee, K. An, Y. I. Park, M. Park, I. S. Lee, D.-H. Nam, S. T. Kim, S.-H. Kim, S.-W. Kim, K.-H. Lim, K.-S. Kim, S.-O. Kim and T. Hyeon, Angew. Chem., 2007, 119, 5493–5497 CrossRef.
- F. Chen, W. Bu, S. Zhang, J. Liu, W. Fan, L. Zhou, W. Peng and J. Shi, Adv. Funct. Mater., 2013, 23, 298–307 CrossRef CAS.
- H. Chen, G. D. Wang, W. Tang, T. Todd, Z. Zhen, C. Tsang, K. Hekmatyar, T. Cowger, R. B. Hubbard, W. Zhang, J. Stickney, B. Shen and J. Xie, Adv. Mater., 2014, 26, 6761–6766 CrossRef CAS PubMed.
- C. Saraiva, C. Praça, R. Ferreira, T. Santos, L. Ferreira and L. Bernardino, J. Controlled Release, 2016, 235, 34–47 CrossRef CAS PubMed.
- Y. Chong, Y. Ma, H. Shen, X. Tu, X. Zhou, J. Xu, J. Dai, S. Fan and Z. Zhang, Biomaterials, 2014, 35, 5041–5048 CrossRef CAS PubMed.
- S. Radhakrishnan, A. Samanta, P. M. Sudeep, K. L. Maldonado, S. A. Mani, G. Acharya, C. S. Tiwary, A. K. Singh and P. M. Ajayan, Part. Part. Syst. Charact., 2017, 34, 1600221 CrossRef.
- H. Wang, R. Revia, K. Wang, R. J. Kant, Q. Mu, Z. Gai, K. Hong and M. Zhang, Adv. Mater., 2017, 29, 1605416 CrossRef PubMed.
- K. E. Kellar, D. K. Fujii, W. H. H. Gunther, K. Briley-Sæbø, A. Bjørnerud, M. Spiller and S. H. Koenig, J. Magn. Reson. Imaging, 2000, 11, 488–494 CrossRef CAS PubMed.
- J. Gao, H. Gu and B. Xu, Acc. Chem. Res., 2009, 42, 1097–1107 CrossRef CAS PubMed.
- P. Shen and Y. Xia, Anal. Chem., 2014, 86, 5323–5329 CrossRef CAS PubMed.
- M. Matsumoto, Y. Saito, C. Park, T. Fukushima and T. Aida, Nat. Chem., 2015, 7, 730–736 CrossRef CAS PubMed.
- X. Wu, F. Tian, W. Wang, J. Chen, M. Wu and J. X. Zhao, J. Mater. Chem. C, 2013, 1, 4676–4684 RSC.
- Y. Hernandez, V. Nicolosi, M. Lotya, F. M. Blighe, Z. Sun, S. De, I. T. McGovern, B. Holland, M. Byrne, Y. K. Gun’ko, J. J. Boland, P. Niraj, G. Duesberg, S. Krishnamurthy, R. Goodhue, J. Hutchison, V. Scardaci, A. C. Ferrari and J. N. Coleman, Nat. Nanotechnol., 2008, 3, 563–568 CrossRef CAS PubMed.
- A. Eckmann, A. Felten, A. Mishchenko, L. Britnell, R. Krupke, K. S. Novoselov and C. Casiraghi, Nano Lett., 2012, 12, 3925–3930 CrossRef CAS PubMed.
- H. Wang, J. Zhuang, D. Velado, Z. Wei, H. Matsui and S. Zhou, ACS Appl. Mater. Interfaces, 2015, 7, 27703–27712 CrossRef CAS PubMed.
- D. Hulicova-Jurcakova, M. Seredych, G. Q. Lu and T. J. Bandosz, Adv. Funct. Mater., 2009, 19, 438–447 CrossRef CAS.
- H. Wang, Y. Zhou, D. Wu, L. Liao, S. Zhao, H. Peng and Z. Liu, Small, 2013, 9, 1316–1320 CrossRef CAS PubMed.
- S. Dey, A. Govindaraj, K. Biswas and C. N. R. Rao, Chem. Phys. Lett., 2014, 595–596, 203–208 CrossRef CAS.
- Z. Zuo, Z. Jiang and A. Manthiram, J. Mater. Chem. A, 2013, 1, 13476–13483 RSC.
- H. Wang, Y. Sun, J. Yi, J. Fu, J. Di, A. D. C. Alonso and S. Zhou, Biomaterials, 2015, 53, 117–126 CrossRef PubMed.
- G. Eda, Y. Y. Lin, C. Mattevi, H. Yamaguchi, H. A. Chen, I. S. Chen, C. W. Chen and M. Chhowalla, Adv. Mater., 2010, 22, 505–509 CrossRef CAS PubMed.
- X. Li, M. Rui, J. Song, Z. Shen and H. Zeng, Adv. Funct. Mater., 2015, 25, 4929–4947 CrossRef CAS.
- H. Wang, K. Wang, Q. Mu, Z. R. Stephen, Y. Yu, S. Zhou and M. Zhang, Nanoscale, 2017, 9, 1434–1442 RSC.
- A. M. Valencia and M. J. Caldas, Phys. Rev. B, 2017, 96, 125431 CrossRef.
- S. Laurent, D. Forge, M. Port, A. Roch, C. Robic, L. Vander Elst and R. N. Muller, Chem. Rev., 2008, 108, 2064–2110 CrossRef CAS PubMed.
- J. S. Choi, J. H. Lee, T. H. Shin, H. T. Song, E. Y. Kim and J. Cheon, J. Am. Chem. Soc., 2010, 132, 11015–11017 CrossRef CAS PubMed.
- J. Wang, L. Zhang, F. Peng, X. Shi and D. T. Leong, Chem. Mater., 2018, 30, 3759–3767 CrossRef CAS.
- F. Peng, M. I. Setyawati, J. K. Tee, X. Ding, J. Wang, M. E. Nga, H. K. Ho and D. T. Leong, Nat. Nanotechnol., 2019, 14, 279–286 CrossRef CAS PubMed.
- K. E. O’Connell, A. M. Mikkola, A. M. Stepanek, A. Vernet, C. D. Hall, C. C. Sun, E. Yildirim, J. F. Staropoli, J. T. Lee and D. E. Brown, Compens. Med., 2015, 65, 96–113 Search PubMed.
- J. Wang, G. Zhou, C. Chen, H. Yu, T. Wang, Y. Ma, G. Jia, Y. Gao, B. Li, J. Sun, Y. Li, F. Jiao, Y. Zhao and Z. Chai, Toxicol. Lett., 2007, 168, 176–185 CrossRef CAS PubMed.
Footnotes |
| † Electronic supplementary information (ESI) available: Experimental section. Fig. S1–S13. See DOI: 10.1039/c9nh00608g |
| ‡ These authors contributed equally to this work. |
| This journal is © The Royal Society of Chemistry 2020 |