 Open Access Article
Selectively enhanced Raman/fluorescence spectra in photonic–plasmonic hybrid structures†
Jisong
Qian
a,
Zebin
Zhu
a,
Jing
Yuan
a,
Ying
Liu
a,
Bing
Liu
b,
Xiangwei
Zhao
 b and
Liyong
Jiang
 *a
*a
aInstitute of Micro-nano Photonic & Beam Steering, School of Science, Nanjing University of Science and Technology, Nanjing 210094, China. E-mail: jly@njust.edu.cn
bState Key Laboratory of Bioelectronics, School of Biological Science and Medical Engineering, Southeast University, Nanjing 210009, China
First published on 15th September 2020
Abstract
The manipulation of the interaction between molecules and photonic–plasmonic hybrid structures is critical for the application of surface-enhanced spectroscopy (SES). Herein, we report a study on the mode coupling mechanism and SES performance in a typical optoplasmonic system constructed with a polystyrene microsphere (PS MS) resonator and gold nanoparticles (Au NPs). The mode coupling mechanism was found to be closely dependent on the relative positions of PS MS, Au NPs, and molecules in the optoplasmonic system, based on which selectively enhanced Raman and fluorescence signals of molecules can be realized via the collaboration of enhancement and quenching channels of the PS MS and Au NPs. We demonstrate two arrangements of the photonic–plasmonic hybrid structure, which can support fluorescence signals with sharp whispering-gallery modes and apparently enhanced Raman signals with relatively low detection limits and good robustness, respectively.
Introduction
Raman and fluorescence spectroscopies have been widely applied in medicine, biology, chemistry, information technology, and food safety. Generally, for mass molecule detection, it is not difficult to determine the safety threshold based on conventional Raman and fluorescence spectra. However, for the detection of trace amounts of molecules or even single molecules, surface-enhanced spectroscopy (SES) becomes more important.1 The physical enhancement of SES is usually based on plasmonic or photonic structures at the micro–nano scale,2–7 such as metallic films with rough surfaces,8 metallic nanoparticles,9–13 plasmonic arrays,14–18 metamaterials,19–21 photonic crystal fibers,22 and micro sphere/ring resonators.23–25 These structures can produce high-density photons or plasmons, which would significantly enhance the light–molecule interaction or increase the excitation/collection efficiency of Raman and fluorescence signals.Recently, as an emerging field, the photonic–plasmonic hybrid structure has drawn extensive attention in the SES study.26–35 The hybrid structure works as an optoplasmonic system to simultaneously benefit from high Q-factors of a photonic structure, as well as small modal volumes and extreme near-field enhancements of a plasmonic structure,36 which will be helpful to improve the enhancement ability, practicality, and versatility of an SES substrate. For example, Ahn et al. demonstrated enhanced fluorescence of dye molecules within a designed photonic–plasmonic structure constructed by putting a microsphere exactly into a plasmonic cavity.27 Lin et al. reported a reusable and reconfigurable surface-enhanced Raman scattering (SERS) platform by optically trapping Ag nanoparticles in a photonic crystal cavity integrated with a microfluidic chip.28 Liang et al. developed a single-molecule biosensor based on the hybrid photonic–plasmonic antenna in a photonic crystal nanobeam cavity to study DNA–protein dynamics without using fluorescent labels.32 Liu et al. proposed a photonic–plasmonic hybrid structure constructed with an inverse three-dimensional photonic crystal and Au nanoparticles, and demonstrated its SERS application for the multi-objective detection of biomolecules.33
Despite these achievements, there are still some challenges in the SES study based on photonic–plasmonic hybrid structures, which need urgent action. For example, the mechanism of SES in the optoplasmonic system is yet to be elucidated. As compared to most of the previous works related to SES in a pure photonic or plasmonic system, the enhancement mechanism in the optoplasmonic system is much complicated because mode coupling between molecules and photonic and plasmonic structures is sensitive to their relative positions in the hybrid structure.37 If their relative positions are improper, quenching of molecular fluorescence signals can be observed.34,35 Therefore, more theoretical and experimental works are highly required to investigate the relative position-dependent SES performance in the optoplasmonic system. Meanwhile, considering that many molecules have both Raman and fluorescence activities, how to realize selective or simultaneous enhancement of molecular fluorescence and Raman signals is becoming an important direction. Some groups have recently studied this issue in different pure plasmonic systems.38–43 However, to the best of our knowledge, this issue has been rarely studied in the optoplasmonic system.
In this paper, we study the mode coupling mechanism and selective SES performance in a typical optoplasmonic system constructed with a microsphere resonator and plasmonic nanoparticles,44–48 which are readily available commercially in a wide range of sizes. In order to clearly understand the mode coupling mechanism, we compare the Raman/fluorescence signals in pure molecules, nanoparticles, microspheres, and the combination of each two of them. On this basis, we propose three photonic–plasmonic hybrid structures with different structural arrangements of microspheres, nanoparticles, and molecules. We demonstrate that selective enhancement of molecular fluorescence and Raman signals can be realized by properly designing the relative positions of microspheres, nanoparticles, and molecules in the optoplasmonic system.
Results and discussion
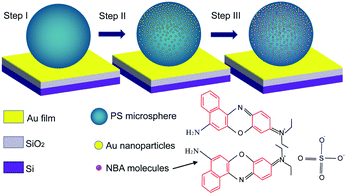
As an example, Fig. 1 illustrates the preparation process of one of the photonic–plasmonic samples by the drop-casting method. Step I corresponds to the initial polystyrene microsphere (PS MS) structure on the bare Au film/SiO2/Si substrate, step II corresponds to the hybrid structure when the PS MS is covered with gold nanoparticles (Au NPs), and step III corresponds to the final target sample when the Au NPs/PS MS hybrid structure is covered with Nile Blue A (NBA) molecules. The preparation process of other samples is similar to that shown in Fig. 1, but follows different dropping sequences. More details about the materials and preparation process are available in the Methods section.Fig. 2 shows the scanning electron microscopic (SEM) images of the samples during the preparation process from step I to step III. It can be observed from Fig. 2(a) that the shape of a pure PS MS is regular and the surface is smooth without defects. The diameter of the MS is about 5 μm. Meanwhile, the Au NPs with an average size of 45 nm are uniformly dispersed onto the PS MS without obvious agglomeration, as shown in Fig. 2(b). The estimated coverage density of Au NPs is about 400–500 NPs per μm2, as shown in Fig. 2(c). Fig. 2(d) corresponds to the SEM image of the final sample that contains uniformly dispersed NBA molecules on the surface of the Au NPs/PS MS structure.
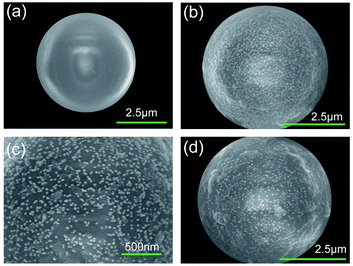 | ||
| Fig. 2 SEM images of (a) a pure PS MS, (b and c) the Au NPs/PS MS hybrid structure, and (d) NBA molecules on the Au NPs/PS MS hybrid structure. | ||
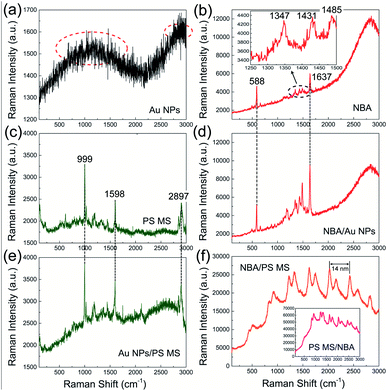
For comparison, we first measured the Raman spectra of pure Au NPs, pure NBA molecules, a pure PS MS, NBA molecules placed on the top surface of Au NPs, Au NPs placed on the top surface of a PS MS, and NBA molecules placed on the top surface of a PS MS. The measurement was done using a confocal Micro-Raman Spectrometer at an excitation wavelength of 532 nm (see Methods). As displayed in Fig. 3(a), pure Au NPs show two broad resonances near 1200 cm−1 (568 nm) and 2900 cm−1 (633 nm) (marked by red dotted ellipses), respectively. Since Au NPs are composed of atoms without Raman features, these two resonances actually correspond to the fluorescence peaks contributed by the localized surface plasmon (LSP) resonances of Au NPs. As displayed in Fig. 3(b), the spectrum of pure NBA molecules shows obvious Raman peaks accompanying an obvious fluorescence background. We can observe two main Raman peaks at 588 cm−1 (549 nm) and 1637 cm−1 (583 nm), as well as three minor Raman peaks at 1347 cm−1 (573 nm), 1431 cm−1 (575 nm), and 1485 cm−1 (578 nm) in the range of 1250–1500 cm−1. The NBA molecules also show a fluorescence peak near 2800 cm−1. In Fig. 3(c), a pure PS MS also shows obvious Raman peaks but the fluorescence background is weak. Three main Raman peaks occur at 999 cm−1 (562 nm), 1598 cm−1 (581 nm), and 2897 cm−1 (629 nm), respectively.
When compared with pure Au NPs, NBA molecules, and PS MSs, the combination of each two of them shows quite different spectral responses. For example, when the NBA molecules are placed on the top surface of Au NPs, we can observe enhanced Raman peaks of NBA molecules [Fig. 3(d)]. Particularly, in the range of 1250–1500 cm−1, the intensity of Raman peaks with background subtraction is increased about 3–5 times as compared to the pure NBA molecules, which is obviously due to the LSP resonance of Au NPs in this region. Meanwhile, we can observe slight quenching of the fluorescence background of NBA molecules, which is believed to be due to the non-radiative decay channel provided by the LSP resonance of Au NPs. As shown in Fig. 3(e), when the Au NPs are placed on the top surface of a PS MS, there is no enhancement of the Raman peaks of the PS MS, but the whole fluorescence background is obviously raised. Considering that the PS MS has a much larger specific surface area than the Au NPs, the Au NPs will bring less influence on the Raman signal of the PS MS, while the PS MS will obviously enhance the fluorescence signal of Au NPs, resulting in a raised fluorescence background. As shown in Fig. 3(f), when the NBA molecules are placed on the top surface of a PS MS, there is no Raman signal of the PS MS or NBA molecules. Instead, we can find obviously enhanced fluorescence signal of the NBA molecules, accompanied by periodic oscillations and double splitting peaks in the fluorescence background. The oscillation period of each sub-peak is about 14 nm. Similar periodic oscillations with a mode splitting phenomenon and a greatly enhanced fluorescence background can be found when the NBA molecules are placed on the bottom of a PS MS, as shown in the inset of Fig. 3(f).
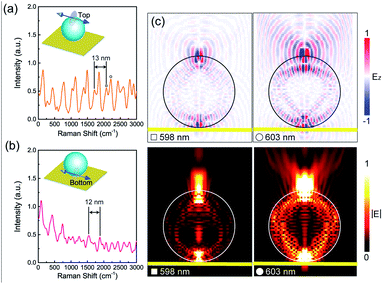
To gain more insight into the periodic oscillations and mode splitting phenomena shown in Fig. 3(f), we employed the finite-difference time-domain (FDTD) method to simulate the radiation spectrum of molecules considering an electric dipole source placed on the top or bottom of a PS MS (see Methods). As shown in Fig. 4(a) and (b), the simulated spectra match well with the experimental results. Periodic oscillations and mode splitting phenomena can be observed for both cases and the oscillation period is about 13 nm. Previous works have demonstrated that the microspheres can support the whispering gallery mode (WGM).49–52 The resonance wavelength of an angular WGM can be expressed as λ = 2πnR/l, where n is the refractive index, R is the radius, and l is the mode number. The free spectral range (FSR) of a particular angular WGM can be further expressed as Δλ = λ2/2πnR. In our study, the refractive index of the PS MS is about 1.6 and the radius of the PS MS is 2.5 μm. When the resonant wavelength is 600 nm, the calculated mode number and FSR are about 42 and 14 nm, respectively. As a result, the calculated FSR is consistent with the experimental and simulation results, which indicates that the periodic oscillations in Fig. 3(f) are angular WGMs. Meanwhile, we selected two sub-peaks near 600 nm, i.e., 598 nm and 603 nm, and simulated their corresponding spatial distributions of the z component and absolute amplitude of the electric field. In Fig. 4(c), we can observe that both peaks show typical angular WGM distributions with a mode number of about 41. As compared to the WGM at 598 nm, the mode at 603 nm shows stronger scattering ability, which agrees well with the simulated radiation spectrum in Fig. 4(a).
The mode splitting phenomenon can be explained by the excitation of a pair of WGMs in clockwise and anti-clockwise directions of propagation when a single scatter is placed on the center of the top or bottom surface of a microsphere.38–41 It should be noted that if a microsphere's shape is not regular or there are many defects on the surface, the periodic oscillations and mode splitting phenomena may disappear.
An individual microsphere resonator has three channels to enhance the Raman/fluorescence signal of the neighbouring atoms/molecules. Type-I is based on the microsphere's large specific surface area, which can improve the collection efficiency of Raman/fluorescence signals via Rayleigh scattering.53 Type-II is based on the microsphere's nano focusing function. When a plane wave is incident on the top surface of a microsphere, an ultra-narrow photon nanojet can be generated on the bottom surface.54,55 Such photon nanojet is also found when an electric dipole source is placed on the top or bottom of a PS MS, as shown in Fig. 4(c). The strong light–matter interaction in the photon nanojet will improve the excitation efficiency of the Raman/fluorescence signal. Type-III is based on the WGM as mentioned above.23–25,56 Among these three types, Type-I and Type-II usually work for the enhancement of both fluorescence and Raman signals without any strict limit, while Type-III that has the strongest enhancement ability should strictly satisfy the resonance condition of WGMs. As a result, the broadband fluorescence signal is easier to be amplified than the ultra-narrow Raman signal based on the Type-III channel.
Therefore, in Fig. 3(e), the raised fluorescence signal of Au NPs is believed to be due to the Type-I and Type-II channels. Type-III does not work well in this case because the Au NPs act as large surface defects, which can easily destroy the formation condition of WGMs. In Fig. 3(f), all three types of mechanism should contribute to the enhanced fluorescence signal of NBA molecules. In particular, the strong fluorescence background is mainly attributed to the contribution from Type-I and Type-II channels. However, we did not find any evidence to support the enhancement of the Raman signal of NBA molecules in this case. The possible reason is that the strong WGM signal can cover up the Raman signal of NBA molecules, which is enhanced via the Type-I and Type-II channels of the PS MS.
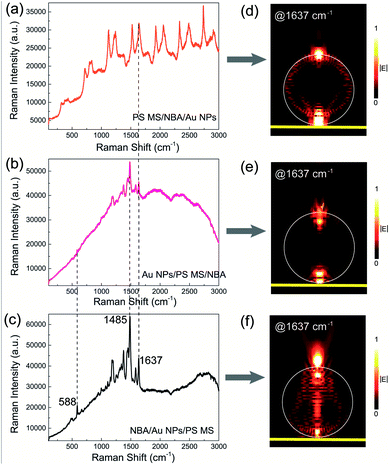
Based on the above-mentioned results, we then investigated the SES performance in three designed photonic–plasmonic hybrid structures with different structural arrangements of microspheres, nanoparticles, and molecules, i.e., NBA molecules between the PS MS and Au NPs (PS MS/NBA/Au NPs), NBA molecules on the bottom of Au NPs/PS MS (Au NPs/PS MS/NBA), and NBA molecules on the top surface of Au NPs/PS MS (NBA/Au NPs/PS MS). In Fig. 5(a), the PS MS/NBA/Au NP case shows sharper WGMs with a narrower linewidth than those shown in Fig. 3(f). The WGM at 1637 cm−1 is clearly verified in Fig. 5(d). One possible reason for the more apparent WGMs is the non-radiative LSP channel of Au NPs, which can result in slight quenching of the fluorescence background of NBA molecules. Another possible reason is that the radiative LSP channel of Au NPs enhances the coupling between NBA molecules and the PS MS, resulting in more efficient excitation of WGMs in the fluorescence background. In addition, although the Au NPs can enhance the Raman signal of NBA molecules, the enhanced Raman signal is still covered up by the strong fluorescence background and the WGMs.
In Fig. 5(b), the Au NPs/PS MS/NBA case shows a decreased fluorescence background and the WGMs almost disappeared [Fig. 5(e)] as compared to the PS MS/NBA case in Fig. 3(f). Meanwhile, we can observe a clear Raman signal in the range of 1250–1500 cm−1. Since the Au NPs placed on the top surface of a PS MS can quench the fluorescence background and destroy the formation condition of WGMs, the enhanced Raman signal which is covered up by the strong fluorescence background and the WGMs before can be partially recovered. The WGMs completely disappear in the case of NBA/Au NPs/PS MS [Fig. 5(c) and (f)], which also shows the clearest Raman signal among three hybrid structures with all Raman peaks recovered from the background. As compared to the pure NBA molecules on the bare Au film substrate, the Raman intensity in the NBA/Au NPs/PS MS system is increased about 10 times at 1485 cm−1. On the one hand, the selectively enhanced Raman signal in this case is attributed to the properly arranged Au NPs, which not only work as Raman amplifiers via the radiative LSP channel, but also act as surface defects to destroy the formation condition of WGMs and quench the fluorescence background via the non-radiative LSP channel. On the other hand, better Raman signal in the case of NBA/Au NPs/PS MS than in NBA/Au NPs may be due to the Type-I and Type-II enhancement channels of a microsphere. The calculated Raman enhancement factor of Au NPs/PS MS is about 2 × 10⁷, which is about one order higher than the case of Au NPs on Au film.
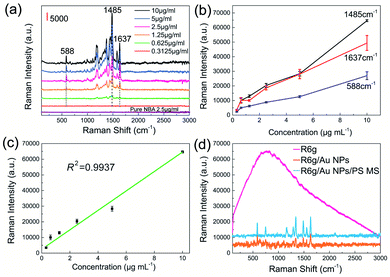
Finally, we investigated the detection limit (DL), linearity, and the robustness of the NBA/Au NPs/PS MS structure for potential SERS applications. It can be seen from Fig. 6(a) that the hybrid structure has a concentration DL of about 0.3125 μg ml−1 for NBA molecules, which is only 1/8 of that for pure NBA molecules on the bare Au film substrate. The Raman intensity at 588 cm−1/1485 cm−1/1637 cm−1 was found to be proportional to the NBA concentration [Fig. 6(b)]. Take 1485 cm−1 as an example, its linear correlation coefficient R2 reaches 0.9937 [Fig. 6(c)]. In order to verify the applicability of the hybrid structure, rhodamine 6G (R6G) molecules were used to replace the NBA molecules. As shown in Fig. 6(d), no Raman signal can be found for the case of pure R6G molecules on the bare Au film substrate due to the strong fluorescence background, while a clear Raman signal can be observed for the case of R6G molecules on the Au NP substrate. When the R6G molecules are placed on the Au NPs/PS MS substrate, the Raman signal is enhanced about 2–3 times compared with the case of Au NP substrate, which well demonstrates the robustness of the hybrid structure for SERS applications.
It is worthy to mention that there are two important factors that can influence the performance of the hybrid systems. The first factor is the substrate. In our design, the Au film is used to increase the reflectance of the substrate. Higher reflectance of the substrate can improve the performance of the NBA/Au NPs/PS MS structure for Raman enhancement, as well as the performance of the PS MS/NBA/Au NP structure for the generation of high-quality WGMs (see Fig. S1†). The second factor is the coverage density of Au NPs on the PS MS. It was found that even when the concentration of Au NPs is decreased down to half of the original value, the NBA/Au NPs/PS MS structure no longer works for Raman enhancement because the low coverage density of Au NPs cannot destroy the formation condition of WGMs (see Fig. S2†).
Conclusions
In summary, we have studied the mode coupling mechanism and SES performance in an optoplasmonic system constructed with a PS MS and Au NPs. The PS MS has three channels, i.e., large specific surface area, photon nanojet, and WGMs, to enhance the fluorescence/Raman signal of the neighbouring molecules. The Au NPs have a radiative LSP scattering channel to amplify the Raman and fluorescence scattering abilities of the neighbouring molecules, as well as a non-radiative LSP absorption channel to quench the fluorescence signal of the neighbouring molecules. The SES performance of the optoplasmonic system was found to be closely dependent on the relative positions of PS MS, Au NPs, and molecules in the system. For the case of PS MS/molecules/Au NPs, the radiative LSP scattering channel of Au NPs can facilitate mode coupling between molecules and the PS MS, resulting in sharper WGMs with a narrower linewidth in the fluorescence signal, which has potential applications in the comb-laser study and label-free detection of biomolecules.57 For the case of molecules/Au NPs/PS MS, the non-radiative LSP absorption channel of Au NPs can quench the background intensity and prevent the excitation of WGMs in the fluorescence signal of molecules. Meanwhile, based on the large specific surface area and photon nanojet of the PS MS and the radiative LSP scattering channel of Au NPs, apparent enhancement of the Raman signal of molecules can be realized, which has been demonstrated in SERS applications with a relatively low DL and good robustness.Methods
Materials
A Au/SiO2/Si substrate with a 100 nm Au film was ordered from Beijing Top Vendor Technology Co., Ltd (Beijing, China). A polystyrene microsphere (PS MS) reagent was ordered from Structure Probe, Inc. (PA, USA). The average diameter of the PS MS is about 5 μm and the density of the PS MS is about 50 MSs per mm2. A gold nanoparticle (Au NP) colloidal reagent was ordered from Suzhou Derivative Biotechnology Co., Ltd (Suzhou, China). The average size of the Au NP is about 45 nm and the concentration of the original reagent is 1.53 × 10¹¹ NPs per ml. Nile Blue A (NBA) and rhodamine 6G dye molecules were ordered from Nanjing Juyou Science Equipment Co., Ltd (Nanjing, China) and Shanghai Bailingwei Chemical Technology Co., Ltd (Shanghai, China), respectively.Preparation of samples
The photonic–plasmonic samples were prepared by the drop-casting method. Take the structure of NBA/Au NPs/PS MS as an example. First, 0.05 ml PS MS reagent mixed by 0.05 ml deionized water was dropped onto the bare Au film/SiO2/Si substrate and dried in air for about 9–10 minutes. Then, about 0.05 ml Au NP colloidal reagent was dropped onto the surface of microspheres and dried in air for about 7–8 minutes. Finally, the NBA solution was dropped onto the surface of Au NPs/PS MS and dried in air for about 5–6 minutes. The preparation procedures of PS MS/NBA/Au NPs and Au NPs/PS MS/NBA are the same except for the dropping sequences. The microscopic images of the three hybrid systems are presented in Fig. S3.† It should be noted that solution mixing is unavoidable during sample preparation. Considering that the mass and size of a PS MS are much larger than those of Au NPs and the microspheres are easily aggregated together, solution mixing should cause slight effects on them. Even if some Au NPs on the substrate are transported to the surface of a PS MS during solution mixing, the coverage density of Au NPs should be high enough to destroy the formation condition of WGMs, as supported by Fig. S2.† Meanwhile, some NBA molecules will be transported to other places during solution mixing. However, it will not change the main conclusions of our results because the selectively enhanced Raman or WGM signals are mainly determined by the relative positions between Au NPs and PS MS.Spectrum measurement
The spectrum measurement was implemented using a confocal Micro-Raman Spectrometer (B&W TEK) at an excitation wavelength of 532 nm. For fair comparison, the laser power was kept constant at about 0.4 mW during the measurement and the integrated time for a single spectrum was set as 8000 ms. The laser was focused onto the sample using a 20× objective (Olympus, NA = 0.4). The diameter of the laser spot is about 1.7 μm. All measurements were done after the samples were dried completely in air.Numerical simulation
The finite-difference time-domain (FDTD) simulation was conducted using the commercial software Lumerical FDTD Solutions (Lumerical Solutions Inc., Vancouver, Canada) to obtain the radiation spectrum of molecules and the electric field distributions. During the simulation, we used an electric dipole source to mimic the molecule and employed the perfectly matched layer (PML) absorbing boundary condition along all three directions. We set two gird meshes in the simulation region. One is the rough mesh (Δx = Δy = Δz = 50 nm) applied in the whole simulation region. Another is the fine mesh (Δx = Δy = Δz = 25 nm) that only covers the Au NP region. The complex dielectric constants for Au and SiO2 (or Si) were fitted based on the Johnson & Christy and Palik databases, respectively. The enhancement factor of the sample was roughly calculated based on the fourth power of the local field.Conflicts of interest
The authors declare no conflict of interest.Acknowledgements
The financial support from the National Natural Science Foundation of China (NSFC) (61675096, 61205042); Natural Science Foundation of Jiangsu Province (BK20141393); Six Talent Peaks Project in Jiangsu Province (XYDXX-027); Fundamental Research Funds for the Central Universities (30919011106, 30919011251).References
- M. Moskovits, Rev. Mod. Phys., 1985, 57, 783–826 Search PubMed.
- E. Fort and S. Gresillon, J. Phys. D Appl. Phys., 2008, 41, 31 Search PubMed.
- S. Lal, N. K. Grady, J. Kundu, C. S. Levin, J. B. Lassiter and N. J. Halas, Chem. Soc. Rev., 2008, 37, 898–911 Search PubMed.
- S. Schlucker, Angew. Chem., Int. Ed., 2014, 53(19), 4756–4795 Search PubMed.
- M. Pelton, Nat. Photonics, 2015, 9, 427–435 Search PubMed.
- S. Y. Ding, J. Yi, J. F. Li, B. Ren, D. Y. Wu, R. Panneerselvam and Z. Q. Tian, Nat. Rev. Mater., 2016, 1, 16021 Search PubMed.
- J. Xu, Y. J. Zhang, H. Yin, H. L. Zhong, M. Su, Z. Q. Tian and J. F. Li, Adv. Opt. Mater., 2018, 6, 1701069 Search PubMed.
- M. Fleischmann, P. J. Hendra and A. J. McQuillan, Chem. Phys. Lett., 1974, 26, 163–166 Search PubMed.
- C. E. Talley, J. B. Jackson, C. Oubre, N. K. Grady, C. W. Hollars, S. M. Lane, T. R. Huser, P. Nordlander and N. J. Halas, Nano Lett., 2005, 5, 1569–1574 Search PubMed.
- B. Yan, A. Thubagere, W. R. Premasiri, L. D. Ziegler, L. Dal Negro and B. M. Reinhard, ACS Nano, 2009, 3(5), 1190–1202 Search PubMed.
- J. F. Li, Y. F. Huang, Y. Ding, Z. L. Yang, S. B. Li, X. S. Zhou, F. R. Fan, W. Zhang, Z. Y. Zhou, D. Y. Wu, B. Ren, Z. L. Wang and Z. Q. Tian, Nature, 2010, 464, 392–395 Search PubMed.
- T. Ming, L. Zhao, Z. Yang, H. J. Chen, L. D. Sun, J. F. Wang and C. H. Yan, Nano Lett., 2009, 9, 3896–3903 Search PubMed.
- G. W. Lu, W. Q. Li, T. Y. Zhang, S. Yue, J. Liu, L. Hou, Z. Li and Q. H. Gong, ACS Nano, 2012, 6, 1438–1448 Search PubMed.
- H. Wang, C. S. Levin and N. J. Halas, J. Am. Chem. Soc., 2005, 127, 14992–14993 Search PubMed.
- X. Y. Zhang, J. Zhao, A. V. Whitney, J. W. Elam and R. P. Van Duyne, J. Am. Chem. Soc., 2006, 128, 10304–10309 Search PubMed.
- M. Hu, F. S. Ou, W. Wu, I. Naumov, X. M. Li, A. M. Bratkovsky, R. S. Williams and Z. Y. Li, J. Am. Chem. Soc., 2010, 132, 12820–12822 Search PubMed.
- Y. J. Hung, I. I. Smolyaninov, C. C. Davis and H. C. Wu, Opt. Express, 2006, 14, 10825–10830 Search PubMed.
- X. F. Ji, C. Y. Xiao, W. F. Lau, J. P. Li and J. X. Fu, Biosens. Bioelectron., 2016, 82, 240–247 Search PubMed.
- C. Cao, J. Zhang, X. L. Wen, S. L. Dodson, N. T. Dao, L. M. Wong, S. J. Wang, S. Z. Li, A. T. Phan and Q. H. Xiong, ACS Nano, 2013, 7, 7583–7591 Search PubMed.
- X. Y. Zhang, Y. H. Zheng, X. Liu, W. Lu, J. Y. Dai, D. Y. Lei and D. R. MacFarlane, Adv. Mater., 2015, 27, 1090–1096 Search PubMed.
- T. T. Yin, L. Y. Jiang, Z. G. Dong, J. K. W. Yang and Z. X. Shen, Nanoscale, 2017, 9, 2082–2087 Search PubMed.
- Y. Zhang, C. Shi, C. Gu, L. Seballos and J. Z. Zhang, Appl. Phys. Lett., 2007, 90, 193504 Search PubMed.
- M. S. Anderson, Appl. Phys. Lett., 2010, 97, 131116 Search PubMed.
- B. B. Li, W. R. Clements, X. C. Yu, K. B. Shi, Q. H. Gong and Y. F. Xiao, Proc. Natl. Acad. Sci. U. S. A., 2014, 111, 14657–14662 Search PubMed.
- S. H. Huang, X. F. Jiang, B. Peng, C. Janisch, A. Cocking, S. K. Ozdemir, Z. W. Liu and L. Yang, Photonics Res., 2018, 6, 346–356 Search PubMed.
- Y. Hong, M. Pourmand, S. V. Boriskina and B. M. Reinhard, Adv. Mater., 2013, 25, 115–119 Search PubMed.
- W. M. Ahn, Y. Hong, S. V. Boriskina and B. M. Reinhardt, ACS Nano, 2013, 7, 4470–4478 Search PubMed.
- S. Y. Lin, W. Q. Zhu, Y. H. Jin and K. B. Crozier, Nano Lett., 2013, 13, 559–563 Search PubMed.
- B. Y. Ding, C. Hrelescu, N. Arnold, G. Isic and T. A. Klar, Nano Lett., 2013, 13, 378–386 Search PubMed.
- S. Y. Cui, X. Y. Zhang, T. L. Liu, J. Lee, D. Bracher, K. Ohno, D. Awschalom and E. L. Hu, ACS Photonics, 2015, 2, 465–469 Search PubMed.
- X. W. Zhao, J. Y. Xue, Z. D. Mu, Y. Huang, M. Lu and Z. Z. Gu, Biosens. Bioelectron., 2015, 72, 268–274 Search PubMed.
- F. Liang, Y. Z. Guo, S. C. Hou and Q. M. Quan, Sci. Adv., 2017, 3, e1602991 Search PubMed.
- B. Liu, D. Zhang, H. B. Ni, D. L. Wang, L. Y. Jiang, D. G. Fu, X. F. Han, C. Zhang, H. Y. Chen, Z. Z. Gu and X. W. Zhao, ACS Appl. Mater. Interfaces, 2018, 10, 21–26 Search PubMed.
- J. Do, K. N. Sediq, K. Deasy, D. M. Coles, J. Rodriguez-Fernandez, J. Feldmann and D. G. Lidzey, Adv. Opt. Mater., 2013, 1, 946–951 Search PubMed.
- T. P. Zhang, S. Callard, C. Jamois, C. Chevalier, D. Feng and A. Belarouci, Nanotechnology, 2014, 25, 315201 Search PubMed.
- J. Xavier, S. Vincent, F. Meder and F. Vollmer, Nanophotonics, 2018, 7, 1–38 Search PubMed.
- P. Anger, P. Bharadwaj and L. Novotny, Phys. Rev. Lett., 2006, 96, 113002 Search PubMed.
- H. H. Li, Q. S. Chen, M. M. Hassan, Q. Ouyang, T. H. Jiao, Y. Xu and M. Chen, Anal. Chim. Acta, 2018, 1018, 94–103 Search PubMed.
- J. N. Zhang, X. Y. Ma and Z. P. Wang, Anal. Chem., 2019, 91, 6600–6607 Search PubMed.
- Y. X. Zhang, W. Chen, T. Fu, J. W. Sun, D. X. Zhang, Y. Li, S. P. Zhang and H. X. Xu, Nano Lett., 2019, 19, 6284–6291 Search PubMed.
- C. Y. Zhang, T. T. Zhang, Z. L. Zhang and H. R. Zheng, Front. Chem., 2019, 7, 647 Search PubMed.
- Y. C. Chang, B. H. Huang and T. H. Lin, Nanomaterials, 2020, 10, 776 Search PubMed.
- M. Li, H. D. Lin, S. K. Paidi, N. Mesyngier, S. Preheim and I. Barman, ACS Sens., 2020, 5, 1419–1426 Search PubMed.
- W. L. Shi, Y. Sahoo, M. T. Swihart and P. N. Prasad, Langmuir, 2005, 21, 1610–1617 Search PubMed.
- Y. X. Li, Y. F. Pan, C. Yang, Y. Gao, Z. Q. Wang and G. Xue, Colloids Surf., A, 2012, 414, 504–511 Search PubMed.
- A. Yamaguchi, T. Fukuoka, R. Hara, K. Kuroda, R. Takahashi and Y. Utsumi, RSC Adv., 2015, 5, 73194–73201 Search PubMed.
- A. Yamaguchi, T. Fukuoka, R. Takahashi, R. Hara and Y. Utsumi, Sens. Actuators, B, 2016, 230, 94–100 Search PubMed.
- A. Yamaguchi, Y. Utsumi and T. Fukuoka, Appl. Surf. Sci., 2019, 465, 405–412 Search PubMed.
- D. S. Weiss, V. Sandoghdar, J. Hare, V. Lefevre-Seguin, J. M. Raimond and S. Haroche, Opt. Lett., 1995, 20, 1835–1837 Search PubMed.
- T. J. Kippenberg, S. M. Spillane and K. J. Vahala, Opt. Lett., 2002, 27, 1669–1671 Search PubMed.
- A. Mazzei, S. Goetzinger, L. D. Menezes, G. Zumofen, O. Benson and V. Sandoghdar, Phys. Rev. Lett., 2007, 99, 173603 Search PubMed.
- A. B. Matsko and V. S. Ilchenko, IEEE J. Sel. Top. Quantum Electron., 2006, 12, 3–14 Search PubMed.
- M. L. Gorodetsky, A. D. Pryamikov and V. S. Ilchenko, J. Opt. Soc. Am. B, 2000, 17, 1051–1057 Search PubMed.
- Z. G. Chen, A. Taflove and V. Backman, Opt. Express, 2004, 12, 1214–1220 Search PubMed.
- G. M. Das, A. B. Ringne, V. R. Dantham, R. K. Easwaran and R. Laha, Opt. Express, 2017, 25, 19822–19831 Search PubMed.
- L. K. Ausman and G. C. Schatz, J. Chem. Phys., 2008, 129, 054704 Search PubMed.
- F. Vollmer and S. Arnold, Nat. Methods, 2008, 5, 591–596 Search PubMed.
Footnote |
| † Electronic supplementary information (ESI) available: Influence of substrate, influence of coverage density of Au NPs, microscopical images of hybrid structures. See DOI: 10.1039/d0na00625d |
| This journal is © The Royal Society of Chemistry 2020 |

