 Open Access Article
Synthesis of diamine functionalised graphene oxide and its application in the fabrication of electrically conducting reduced graphene oxide/polymer nanocomposite films†
Namrata
Maslekar
a,
Rabiatul A.
Mat Noor
a,
Rhiannon P.
Kuchel
b,
Yin
Yao
b,
Per B.
Zetterlund
 *a and
Vipul
Agarwal
 *a
*a
aCentre for Advanced Macromolecular Design (CAMD), School of Chemical Engineering, University of New South Wales, Sydney, NSW 2052, Australia. E-mail: p.zetterlund@unsw.edu.au; agarwalvipul84@gmail.com
bMark Wainwright Analytical Centre, University of New South Wales, Sydney, NSW 2052, Australia
First published on 18th August 2020
Abstract
The focus of research in diamine functionalised graphene oxide (GO) has been limited to the use of diamines either as crosslinker or to achieve simultaneous functionalisation, reduction and stitching of GO sheets, especially in the case of ethylene diamine (EDA). Controlling the extent of stitching and functionalisation has to date remained a challenge. In particular, synthesis of colloidally stable monofunctionalised GO–NH2 with dangling amine groups using diamines has remained elusive. This has been the limiting factor towards the utility of EDA functionalised GO (GO–NH2) in the field of polymer-based nanocomposites. We have synthesised colloidally stable GO–NH2 with dangling amine groups and subsequently demonstrated its utility as a surfactant to synthesize colloidally stable waterborne polymer nanoparticles with innate affinity to undergo film formation at room temperature. Thermally annealed dropcast polymer/GO–NH2 nanocomposite films exhibited low surface roughness (∼1 μm) due to the homogeneous distribution of functionalised GO sheets within the polymer matrix as observed from confocal laser scanning microscopy, scanning electron microscopy and transmission electron microscopy. The films exhibited considerable electrical conductivity (∼0.8 S m−1), demonstrating the potential of the GO–NH2/polymer nanocomposite for a wide range of applications.
Introduction
Graphene oxide (GO), the most widely studied derivative of graphene, is obtained primarily from the oxidation mediated exfoliation of graphite. GO continues to draw research interest and has been widely used in various applications such as sensors, electronic devices, biomedical applications including drug delivery, water filtration, gas adsorption and preparation of nanocomposites.1–7 For all these applications, the colloidal stability of the GO sheets within the solvent or polymer matrix is a prerequisite in order to control their distribution or arrangement necessary to develop high-quality GO-based nanocomposites. The stability of GO sheets is attributed to the hydrophilic functional groups such as hydroxyl (–OH) on the basal plane and epoxy (–CH(O)CH–) groups on the sheet edges. The presence of hydrophilic oxygen-containing functional groups in combination with the hydrophobic sp2 hybridized graphitic basal plane induce amphiphilic character to GO sheets.8,9 Such amphiphilic character has recently been exploited to synthesise colloidally stable polymer particles using GO as a sole surfactant in miniemulsion polymerisation.9–14 Using miniemulsion polymerisation, we have previously shown that the surfactant ability of GO can be utilised to synthesise polymer/GO nanocomposites where polymer particles are decorated with GO sheets.9,10 Based on this approach, decoration or localisation of GO sheets around polymer particles greatly overcomes the restacking affinity of GO sheets. This approach can be used to fabricate polymer/GO nanocomposite films with controlled GO morphology mediated by the self-assembly of the GO sheets leading to their homogeneous distribution throughout the film.10There is a considerable drive to functionalise GO in order to improve its surface, chemical, electronic and mechanical properties for various applications. For example, methylene dianiline-functionalised GO/polycaprolactone (PCL) nanocomposites have been shown to promote bone marrow derived mesenchymal stem cell adhesion and thereby significantly enhance their differentiation into osteoblasts (bone cells) compared to GO/PCL nanocomposites.15 The observed enhanced response was assigned to the positive surface charge on the methylene dianiline-functionalised GO/PCL nanocomposite compared to neutral GO/PCL nanocomposite matrix. In order to elucidate the impact of amine functionalisation on the properties of GO, Kim et al. functionalised GO with ethylamine (EA) and ethylene diamine (EDA).16 They reported that EDA induces simultaneous reduction, surface modification and stitching (covalent linking) of GO sheets. However, no stitching was observed in the case of EA. The stitching can be explained by the fact that both amine groups in diamine have the same nucleophilicity and thus same reactivity towards the oxygen-containing functional groups present on the surface of GO sheets. Furthermore, inclusion of GO–EDA in linear low-density polyethylene (LLDPE) significantly improved the storage modulus of the polymer nanocomposite as compared to either LLDPE/GO–EA or LLDPE/GO based composites and LLDPE alone. Such superior performance of the LLDPE/GO–EDA composite was attributed to the reduction, surface modification and stitching of GO when reacted with EDA. In another study, the simultaneous reduction, surface modification and stitching concept was explored to achieve site selective functionalisation of GO.17 EDA and 1,4-butandiol were utilised to selectively react with the oxygen-containing functional groups either at the edge of the GO sheets or both at the edge and on the basal plane. EDA was shown to react with epoxy and carboxyl groups present both at the edges and basal plane of the sheets, while 1,4-butandiol reacts primarily with carboxyl groups present on the edges. EDA functionalised GO paper, fabricated using the vacuum filtration method, exhibited significantly higher electrical conductivity compared to 1,4-butandiol–GO paper, thus highlighting the advantage of using EDA to functionalise GO.17
Surface charge and polarity of bioscaffolds have been known to play a crucial role in regulating cellular response by providing the relevant chemical cues. For example, large-area sub-nanometre patterned polymer substrate fabricated using capillary force lithography was surface functionalised with either EDA or poly(acrylic acid) (PAA) to study the effect of specific surface charge on neuronal differentiation.18 It was reported that EDA mediated positively charged nano-conduits significantly enhanced the neuronal differentiation as compared to negatively charged PAA-functionalised substrate.
Recently, a phytotoxicity study was conducted comparing the effect of amine functionalised GO (GO–NH2) with GO in wheat plants (Triticum aestivum), assessing in terms of seed germination, seedling growth and morphological changes in the plants.19 GO and GO–NH2 exhibited contrary response on plant germination where GO inhibited germination while GO–NH2 promoted it in the first 24 h. However, this inhibitory effect of GO and the difference between GO and GO–NH2 on seed germination was not evident at 72 h. Furthermore, contrary to GO–NH2, treatment with GO significantly restrained the growth of the wheat seedlings which had rippled adverse effects on the development of root length, shoot length and biomass, and morphological damage to the root cells. It was postulated that the observed detrimental response of GO could be due to the localised accumulation of GO sheets in the roots of the plants. However, no such aggregation was observed for GO or GO–NH2 in the root cells.
Taken together these studies highlight the advantages of diamine functionalisation of GO in terms of improving the mechanical, chemical and electrical properties, as well as cytocompatibility of GO. It has been widely accepted that reaction of EDA on GO results in simultaneous stitching (crosslinking), functionalisation and reduction of GO sheets which tend to compromise the aqueous colloidal stability of EDA-functionalised GO.16,20,21 Thus, fabrication of EDA-functionalised GO-based nanocomposites traditionally requires multiple processing steps, organic solvents and an extensive ultrasonication step to redisperse EDA-functionalised GO or any diamine-functionalised GO, solution mixing or physical (as powder) mixing with polymer, and a subsequent processing step such as compression molding to form nanocomposite sheets.16,22 To the best of our knowledge there are only few reported polymer/EDA-functionalised GO based nanocomposites, which primarily concentrated on the use of diamine as a chemical crosslinker to improve the physical and mechanical properties of the nanocomposite.23–25 The need for complex fabrication strategy and difficulty in synthesising colloidally stable EDA-functionalised GO with dangling amine groups has been a major deterrent in the field, limiting the development of polymer/EDA-functionalised GO-based nanocomposites. Furthermore, given that GO–NH2 cannot be dispersed in water due to the uncontrolled stitching of the GO sheets during the synthesis, the alternative strategy based on physical mixing of EDA-functionalised GO with polymer colloids cannot be applied to make electrically conductive surface coatings. In addition, there are no reports on waterborne emulsion approaches to fabricate in situ polymer/EDA-functionalised GO nanocomposites with innate ability to undergo film formation under ambient conditions.
In the present work, using a simple synthetic strategy, we have synthesised colloidally stable EDA-functionalised GO with dangling amine groups (referred as GO–NH2) and used it as a surfactant in a miniemulsion polymerisation of styrene/butylacrylate (St/nBA) employing our previously developed method.9,10 The synthesised (St/nBA) polymer/GO–NH2 was fabricated into electrically conducting nanocomposite films by a simple dropcasting method.
Materials and methods
Materials
Styrene (Sigma Aldrich, >99%) and n-butyl acrylate (Sigma Aldrich, 96%) were purified by removing the inhibitor through an activated basic aluminium oxide (Ajax) column. Azobisisobutyronitrile (AIBN, Aldrich) was recrystallized in water before use. Graphene oxide (Graphenea, 0.4 wt% in water), hexadecane (HD, Sigma-Aldrich), ethylene diamine (Sigma Aldrich), 1-ethyl-3-(3-dimethylaminopropyl)carbodiimide (EDC) (Sigma Aldrich), N-hydroxysuccinimide (Sigma Aldrich), tetrahydrofuran (THF) (Sigma Aldrich, HPLC grade) and sodium dodecyl sulfate (Sigma Aldrich) were all used as received.Synthesis of GO–NH2
Different experimental conditions in terms of amount of GO, EDA, reaction time and whether coupling agents (EDC and NHS) were used are presented in Table S1.† Colloidally stable GO–NH2 was synthesised as follows: EDA (0.125 mM) was added to 25 mL aqueous GO dispersion (4 mg mL−1) and reacted at room temperature for 0.5 h to obtain aqueous dispersion of GO–NH2 with 1.2 atom% nitrogen. Freshly prepared GO–NH2 was immediately used for miniemulsion polymerisation (Scheme 1).Miniemulsion polymerization
Water (1.25 mL) was added to 5 wt% of freshly synthesised aqueous suspension of GO–NH2 (8.75 g, 5 wt% rel. to monomer) and ultrasonicated using a Branson Digital Sonifier at 70% amplitude on ice for 10 min. In a separate 25 mL glass vial, 50![[thin space (1/6-em)]](https://www.rsc.org/images/entities/char_2009.gif) :
:![[thin space (1/6-em)]](https://www.rsc.org/images/entities/char_2009.gif) 50 wt% of the monomers (0.35 g each of styrene (St) and n-butyl acrylate (nBA)) were added to the organic phase comprising hexadecane (0.0525 g, 5 wt% rel. to monomers) and AIBN (0.05 g, 0.25 M rel. to organic phase), and SDS (22.5 mg, for 3 wt% or 38.25 mg for 5 wt%, respectively). Subsequently, the ultrasonicated GO–NH2 dispersion was added to the organic phase and magnetically stirred at room temperature for 15 min followed by ultrasonication (at 70% amplitude) on ice for 10 min to form the miniemulsion. The miniemulsion was then subjected to nitrogen degassing on ice for 20 min and the vial was sealed. The sealed vial was heated for 24 h at 70 °C.
50 wt% of the monomers (0.35 g each of styrene (St) and n-butyl acrylate (nBA)) were added to the organic phase comprising hexadecane (0.0525 g, 5 wt% rel. to monomers) and AIBN (0.05 g, 0.25 M rel. to organic phase), and SDS (22.5 mg, for 3 wt% or 38.25 mg for 5 wt%, respectively). Subsequently, the ultrasonicated GO–NH2 dispersion was added to the organic phase and magnetically stirred at room temperature for 15 min followed by ultrasonication (at 70% amplitude) on ice for 10 min to form the miniemulsion. The miniemulsion was then subjected to nitrogen degassing on ice for 20 min and the vial was sealed. The sealed vial was heated for 24 h at 70 °C.
Monomer conversion
The synthesised pre-weighed nanocomposite latex was dried in a vacuum oven at 30 °C for 24 h. The monomer conversion was determined from the difference between the pre-weighed wet nanocomposite latex and the corresponding dried latex.Film formation
50 μL of the synthesized nanocomposite latex was dropcast evenly onto a glass slide in rectangular shape. The glass slide was allowed to dry for 24 h at room temperature. The dried film was thermally annealed in an air cooled vacuum oven at 160 °C for 24 h to transform GO into electrically conductive reduced GO (rGO).Gel permeation chromatography (GPC)
GPC was utilised to measure the number-average (Mn) and weight-average (Mw) molecular weights and molecular weight distributions (MWDs) of the polymer. The GPC instrument was configured with a DGU-12A solvent degasser, an LC-10AT pump, a CTO-10A column oven, a ECR 7515-A refractive index detector, and a 5.0 μm bead-size guard column (50 × 7.8 mm, Polymer Laboratories) followed by four 300 × 7.8 mm linear Phenogel columns. THF was used as solvent at 40 °C with 1.0 mL min−1 flow rate and an injection volume of 100 μL. Linear polystyrene standards ranging from 500 to 106 g mol−1 were used to calibrate the instrument. Samples were prepared using our previously described method12,26 where dried polymer/GO–NH2 nanocomposite (∼4 mg) was dissolved in THF (2 mL) overnight. The undissolved GO and impurities were removed through multiple cycles of centrifugation and subsequent filtration through a syringe filter.Dynamic light scattering (DLS)
DLS measurements were conducted using the Malvern Zetasizer NanoSeries by diluting a drop of latex (∼10−4 mg mL−1) in MilliQ water and recording the particle size in triplicates with the average of least 11 measurements per replicate. The data is reported as average of three replicates.Fourier-transform infrared spectroscopy (FTIR)
FTIR was conducted using a Bruker IFS66/S on the dried GO and GO–NH2. The measurements were conducted from 400 to 4000 cm−1 at a wavenumber resolution of 4 cm−1, with data presented as an average of 16 scans per sample.X-ray photoelectron spectra (XPS)
XPS was carried out using a Kratos Axis ULTRA XPS with monochromatic Al X-rays (1486.6 eV) at 225 W (15 kV, 15 mA). XPS was conducted using the conditions as reported by us previously.10 The sensitivity factors provided with the instrument were C 1s – 1, N 1s – 1.676, and O – 2.881.Raman spectroscopy
Raman spectroscopy was carried out using a 20× objective on a Renishaw inVia Raman Microscope with an Ar laser (514 nm). The as-synthesised GO–NH2 was dried on a glass slide and subjected to Raman analysis. Similarly, non-reduced and thermally reduced polymer/GO–NH2/SDS nanocomposite films were fabricated onto the glass slide and subjected to Raman. The deconvolution and peak analysis were carried out after fitting the D and G peaks using Lorentzian fitting employing Origin8 software.Electrical conductivity measurements
St/nBA/GO/SDS (5 wt%) and St/nBA/GO–NH2/SDS (3 or 5 wt%) films were fabricated by dropcasting the polymer nanocomposite latexes onto glass slides followed by drying overnight under ambient conditions. The dried films were thermally reduced by annealing at 160 °C for 24 h in an oven under air. The reduced films were subjected to four-point probe (Jandel Model RM3) measurements of the resistivity in triplicates on two separate films of the same sample. The thickness of the films was measured using a stylus profilometer (KLA Tencor Alpha-Step D-600). The glass surface on either side of the film was taken as a reference. The electrical conductivity was calculated using the relationship σ = 1/(ρd), where σ is the electrical conductivity, ρ is the resistivity and d is film thickness.Contact angle
Contact angle measurements were conducted using a custom-made goniometer on the non-reduced and thermally reduced nanocomposite films. A 10 μL MQ water droplet was manually dropped on the nanocomposite film and allowed to equilibrate for 10 s before capturing the image using a Moticam 5 (5.0 MP) camera. The contact angle was determined by analysing the images of the drop on nanocomposite films using ImageJ software. Two films per sample and two images per film were obtained and analysed. Data is presented as average ± standard deviation.X-ray diffraction (XRD)
XRD was conducted using the PANalytical Empyrean thin film XRD using CuKα as source on the dried nanocomposite films. Diffraction intensities were recorded in the 2θ ranging from 5° to 70° with a step width of 0.013°, count time of 19.266 s and scan speed of 0.109° s−1.Surface roughness
Surface roughness of the reduced films was determined using the confocal laser scanning microscope (Keyence, VK-X200 series) with 20× objective. Two separate films of each sample were analysed based on at least at 5 different locations on each film. Surface roughness was determined using the instrument software and reported as average ± standard deviation.Scanning electron microscopy (SEM)
SEM was conducted on dried and thermally reduced nanocomposite films after sputter coating them with 4 nm platinum. Imaging was conducted using FEI Nova NanoSEM 450 FE-SEM at an accelerating voltage of 2–3 kV.Transmission electron microscopy (TEM)
TEM samples were prepared by embedding the nanocomposite films in L.R. white resin (80% polyhydroxy substituted bisphenol, a dimethacrylate resin 19.6%, C12 methacrylate ester, 0.9% benzoyl peroxide) and curing the sample at 60 °C for 24 h. Samples were sectioned ultrathin using a Leica EM UC6 Ultramicrotome and mounted onto cleaned 200 copper-mesh grids before imaging using JEOL1400 transmission electron microscope at an accelerating voltage of 100 kV at the magnification of 15![[thin space (1/6-em)]](https://www.rsc.org/images/entities/char_2009.gif) 000.
000.
Results and discussion
Synthesis and characterization of GO–NH2
Ethylene diamine (EDA) functionalisation of GO was conducted under different conditions (ESI, Table S1†) in order to achieve the highest amount of free amine groups without losing the colloidal stability of the functionalised GO sheets. Previously reported colloidal instability of GO–NH2 sheets at higher concentrations of EDA has been attributed to the combination of stitching between GO sheets and possibly some level of chemical reduction of GO.16 Although the chemical reduction mechanism remains to be fully elucidated, it has been postulated to proceed through a mechanism similar to the hydrazine mediated reduction of GO.27,28 We observed that a maximum 1.2 atom% nitrogen (EDA) can be functionalised onto GO sheets (∼600 nm by DLS) without compromising their colloidal stability. Colloidal stability of GO is paramount for fabrication of polymer/GO nanocomposite substrates with homogeneously dispersed GO sheets, which has been recently shown to govern electrical properties of these nanocomposites.10Fig. 1a shows a colloidally stable aqueous dispersion of GO–NH2, which when dropcast and dried on a glass slide under ambient conditions resulted in a homogeneous coating with no obvious sign of agglomerated GO sheets (Fig. 1b).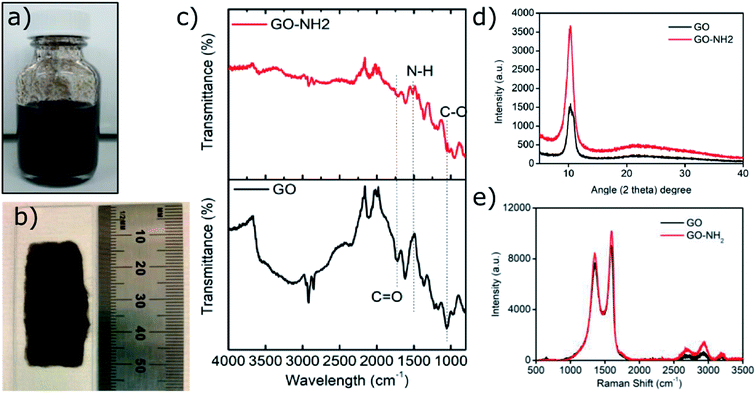 | ||
| Fig. 1 Characterisation of as synthesised GO–NH2. (a) Colloidal aqueous dispersion of GO–NH2; (b) dried GO–NH2 dispersion on a glass slide; (c) FTIR; (d) XRD; (e) Raman analysis. | ||
FTIR analysis of the GO–NH2 is presented in Fig. 1c. The reaction of EDA with GO resulted in a dramatic reduction in the intensities of the peaks associated with the oxygen containing functional groups such as 3359 cm−1 and 1377 cm−1 peaks assigned to –OH stretching and bending, respectively, and the epoxy (C–O–C stretching) peak at 1217 cm−1. Almost complete loss of the –COOH stretching vibration peak at 1718 cm−1 and the alkoxy peak at ∼1055 cm−1 was observed after EDA functionalisation.29,30 The appearance of the peak at ∼1523 cm−1 in GO–NH2 is assigned to the –C–N scissoring absorption.16,31–33 The loss of oxygen-containing functional groups and emergence of peaks specific to nitrogen containing groups confirm the formation of GO–NH2. XRD patterns of GO and GO–NH2 are shown in Fig. 1d. We observed a marginal shift in the 002 reflection peak for GO–NH2 (2θ = 10.22°, d-spacing = 0.87 nm) compared to GO (2θ = 10.40°, d-spacing = 0.85 nm). The observed GO–NH2 signal was in line with previously published reports.34 The observed shift in the 10.22° peak and increase in d-spacing can be attributed to the surface functionalisation of EDA on the GO surface (1.2 atom% nitrogen as determined by XPS) and consequential partial stitching of adjacent GO sheets upon EDA functionalisation.20 Raman spectra exhibited characteristic well-defined D and G bands at ∼1358 and 1595 cm−1 for GO–NH2, and ∼1361 and 1586 cm−1 for GO (Fig. 1e). The observed shifts for both D and G bands between GO–NH2 and GO can tentatively be attributed to recovery of the conjugated hexagonal sp2 hybridised carbon network as GO is reduced to GO–NH2.35 The ID/IG ratio decreased from 0.95 in pure GO to 0.86 for GO–NH2. This decrease is similar to the previous reports on EDA functionalised GO and has been mainly attributed to the loss of oxygen-containing functional groups due to the reduction of GO (caused by EDA).16,20,35 EDA mediated reduction was also confirmed from the calculations of crystalline domains (La, eqn (1)), distance between the defects (LD, eqn (2)) and density of defects (nD, eqn (3)) as determined based on the Raman analysis for GO and GO–NH2 (Table 1).36,37
 | (1) |
 | (2) |
 | (3) |
| Sample | D (cm−1) | G (cm−1) | I D/IG | L a (nm) | L D (nm) | n D (cm−2) |
|---|---|---|---|---|---|---|
| GO | 1354 | 1586 | 0.95 | 17.63 | 11.77 ± 1.74 | 2.45 ± 0.96 × 10¹¹ |
| GO–NH2 | 1358 | 1585 | 0.86 | 19.48 | 11.97 ± 2.40 | 2.22 ± 0.87 × 10¹¹ |
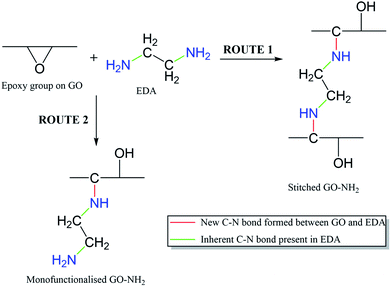
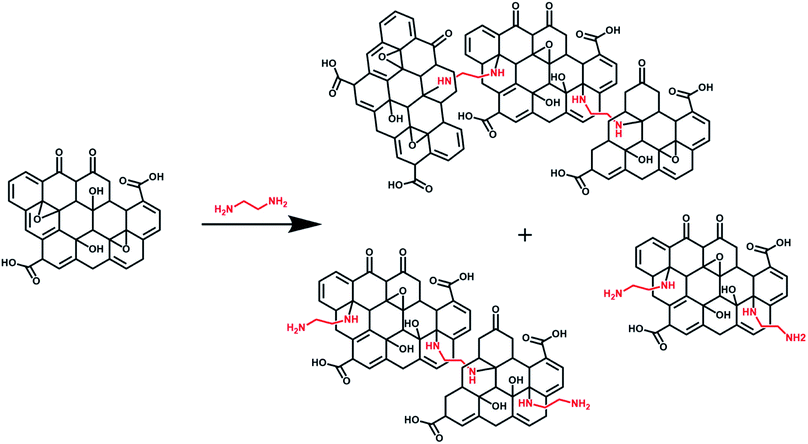
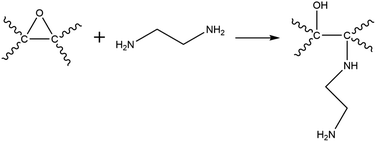
XPS analysis confirmed the functionalisation of EDA on GO as evident from the increase in the C/O ratio from 1.99 (GO) to 2.78 (GO–NH2) as well as the presence of a nitrogen peak in the survey spectrum (Fig. 2a). The significant reduction in the epoxy (C–O–C) peak in the deconvoluted C 1s XPS spectrum of GO–NH2 clearly indicates that functionalisation has occurred predominantly on epoxy groups leading to the formation of the –CN/–OH (285.5 eV) peak (Fig. 2b, c and ESI, Table S2†). This can be understood by the nucleophilic ring opening reaction shown below.38
It is important to note that the carboxyl peak (–COOH, ∼289 eV) contribution in the deconvoluted C 1s spectra remains the same for GO (2.8%) and GO–NH2 (2.79%), which is indicative of no reaction of diamine with the carboxyl groups present at the edges of the GO. The deconvoluted N 1s spectrum of GO–NH2 (Fig. 2d) revealed two peaks which were attributed to the –CN/–RN+ (0.78%) and –NH (0.43%) functionalities. The –CN peak is due to the combination of (i) formation of carbon–nitrogen (–CN) bonds as a result of epoxy ring opening reaction and/or (ii) nucleophilic attack on hydroxyl group and (iii) –CN bond in EDA. The –NH peak is the combination of both –CN(H) bond formation and unreacted primary amine (–NH2) groups (which form when only one amine functionality in EDA reacts). Fig. 3 shows a simplified illustration of the possible mechanism behind these –CN and –NH peaks in XPS. This could be explained by the fact that should there be complete stitching (route 1) where both amines (–NH2) groups in EDA have reacted, the contribution of both –CN peaks should be twice as much as the –NH peak in deconvoluted nitrogen XPS spectrum due to the formation of two new –CN bonds [–C–NH–CH2–CH2–HN–C–, shown in red] plus the two –CN functionalities [2HN–CH2–H2C–NH2, show in green] inherently present in EDA and only two –NH functionalities [–C–NH–CH2–CH2–HN–C–, shown in blue], giving the ratio of 2 between –CN and –NH. Contrarily, in the case of monofunctionalised GO–NH2 (route 2), we would expect three –CN bonds [–C–NH–CH2–H2C–NH2, shown as red and green bonds] and three –NH functionalities [–CNH–CH2–CH2–NH2, shown in blue], giving the ratio of 1 between –CN and –NH. However, we observed the ratio between –CN and –NH to be ∼1.8, which indicates the combination of stitching and mono-functionalised GO sheets with free amine groups (–NH2). Such free amine groups would presumably play an important role in providing the observed colloidal stability of GO–NH2. The EDA grafting density, here defined as the number ratio of N-atoms (from EDA) to C-atoms (from GO and EDA) as a percentage, was determined from XPS data (Fig. 2) by calculating the N/C ratio based on the atomic sensitivity factor (asf) of N and C (eqn (4)). The term asf denotes the atomic sensitivity factor, which is 1.676 for N 1s and 1.000 for C 1s.
 | (4) |
Miniemulsion polymerization using GO–NH2 as surfactant
We subsequently explored whether colloidally stable GO–NH2 (1.2 atom% nitrogen) can function as a surfactant in miniemulsion polymerisation. According to the mechanism of miniemulsion polymerization, sub-micron size monomer droplets dispersed in a continuous aqueous phase are directly converted to the corresponding polymer particles via polymerization within the monomer droplets.39,40 Stabilization of the initial monomer droplets, usually achieved via small molecule conventional surfactants, is a characteristic feature of these polymerization systems. Based on our previous work,9,10,13 a statistical copolymer of styrene and n-butyl acrylate (P(St-stat-nBA)) was selected as polymer matrix with innate affinity to undergo film formation under ambient conditions. The weight ratios of St and nBA was kept at 1![[thin space (1/6-em)]](https://www.rsc.org/images/entities/char_2009.gif) :
:![[thin space (1/6-em)]](https://www.rsc.org/images/entities/char_2009.gif) 1 to obtain a suitable glass transition temperature (Tg) necessary to achieve ambient temperature film formation (theoretical value ∼ 4 °C).9,10 We have previously shown that the presence of a small amount of sodium dodecyl sulfate (SDS) is required in miniemulsion polymerisations stabilized by GO when St is used as monomer in order to increase the polymerisation rate and reach high final conversions.9,11 The polymerisation experiments conducted in the present study under different reaction conditions such as using GO–NH2 synthesised under different synthetic conditions (using different concentrations of EDA and reaction time) and their respective miniemulsion polymerisation are listed in Tables S3 and S4.†
1 to obtain a suitable glass transition temperature (Tg) necessary to achieve ambient temperature film formation (theoretical value ∼ 4 °C).9,10 We have previously shown that the presence of a small amount of sodium dodecyl sulfate (SDS) is required in miniemulsion polymerisations stabilized by GO when St is used as monomer in order to increase the polymerisation rate and reach high final conversions.9,11 The polymerisation experiments conducted in the present study under different reaction conditions such as using GO–NH2 synthesised under different synthetic conditions (using different concentrations of EDA and reaction time) and their respective miniemulsion polymerisation are listed in Tables S3 and S4.†
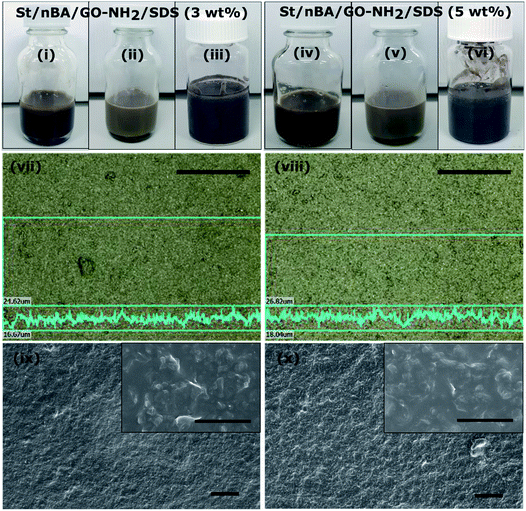
The amount of GO–NH2 and SDS must be carefully considered in order to maintain the colloidal stability of GO–NH2 (i.e. avoid precipitation and subsequent sedimentation of GO–NH2) throughout the polymerisation (24 h). We observed that a minimum 5 wt% GO–NH2 (relative to monomer, referring to GO–NH2 with 1.2 atom% nitrogen) and 3 wt% SDS (relative to organic phase) was required to maintain stable miniemulsions throughout the polymerisation (Fig. 4(i)–(vi)). It is also important to note that freshly synthesised GO–NH2 should be used in the polymerisation to ensure stability during the polymerisation. GO–NH2 tends to lose its colloidal stability during storage over time (even for 24 h), which compromises the stability of the miniemulsion during polymerisation, ultimately resulting in significant phase separation. The obtained nanocomposite latexes (prepared using 5 wt% GO–NH2 and either 3 or 5 wt% SDS) were stable for months under ambient conditions. Use of lower concentrations of either GO–NH2 (less than 5 wt%) or SDS (less than 3 wt%) did result in kinetically stable miniemulsions before polymerization (ESI, Table S3† – serial numbers 2 and 3). However, as the polymerisation proceeded, phase separation became more apparent, finally resulting in total phase separation between polymer and GO–NH2 at the end of the polymerisation (ESI, Table S3 – serial numbers 2 and 3, and Table S4†). The monomer conversion reached in 24 h was marginally higher at 74% for 5 wt% SDS compared to 68% at 3 wt% SDS. This can be attributed to the formation of SDS mediated additional nucleation sites (secondary nucleation) as alluded to above.9,11 The molecular weights of the polymers synthesised at different SDS concentrations (3 or 5 wt%) were within the typical range usually observed for radical polymerisation under similar conditions (ESI, Table S5†).
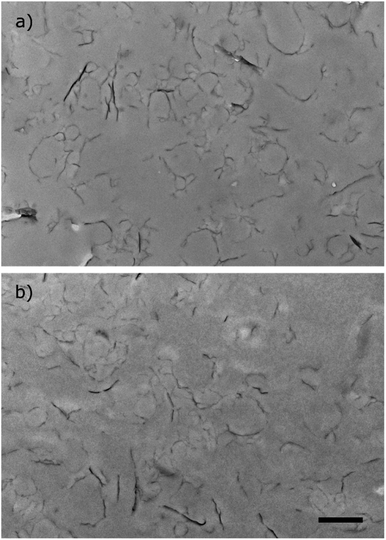
The two stable miniemulsion latexes prepared using GO–NH2 (5 wt% relative to monomer) and SDS at either 3 or 5 wt% (relative to the organic phase) were dropcast to fabricate films under ambient conditions. The films were subsequently annealed at 160 °C for 24 h under atmospheric pressure to render them electrically conducting by reducing GO to “reduced GO” (rGO). The reduction of GO within the polymer matrix was confirmed by measuring the water contact angle on the surface of the nanocomposite films. The water contact angle increased from ∼62° to ∼82° as a result of thermal reduction of the nanocomposite films (Table S6, Fig. S1†). The increase in the contact angle was attributed to increased hydrophobicity as a result of the loss of oxygen containing functional groups in line with previously published reports.9 XRD analysis of the nanocomposite films exhibited characteristic peaks at 2θ = ∼9° and a broad peak centred around 20° which were attributed to 001 reflection peak from GO41 and the polymer peak, respectively (Fig. S2†). The broad polymer peak was ascribed to the amorphous nature of the polymer. Thermal reduction of both nanocomposite films resulted in the disappearance of ∼9° (001 GO peak) which is indicative of efficient reduction of GO within the nanocomposite films into rGO.42Fig. 4(vii) and (viii) shows optical scanning laser microscopy images of the films. The films exhibited rough but homogeneous surface topography. The surface roughness (Ra) of the reduced films was measured to be 0.97 ± 0.10 μm and 1.14 ± 0.10 μm (n = 6, average ± standard deviation) for St/nBA/GO–NH2/SDS (3 wt%) and St/nBA/GO–NH2/SDS (5 wt%), respectively, using confocal laser scanning microscopy (Table S6†). Scanning electron microscopy of the nanocomposite films (Fig. 4(ix) and (x)) revealed relatively rougher surface topography in the case of St/nBA/GO–NH2/SDS (5 wt%) compared to St/nBA/GO–NH2/SDS (3 wt%). In addition, the higher magnification SEM images revealed homogeneous distribution of GO sheets within the polymer matrix (inset in Fig. 4(ix) and (x)). The SEM analysis corroborated the surface roughness trend determined using confocal laser scanning microscopy. The higher surface roughness at the higher SDS concentration can be speculated to have its origin in a greater number of GO–NH2 sheets present at the nanocomposite film surface. In order to explore the distribution of GO–NH2 sheets within the polymer matrix, we conducted TEM analysis on ultrathin microtomed cross-sections of the nanocomposite films (Fig. 5). The TEM images of both nanocomposite films display homogeneous distribution of a disjointed network of GO–NH2 sheets within the polymer matrix. The GO–NH2 sheets give darker colour features under TEM (Fig. 5) while the coalesced polymer particles correspond to the smooth grey film. The homogeneous distribution of GO–NH2 sheets observed under TEM corroborates the data obtained using SEM and confocal laser scanning microscopy.
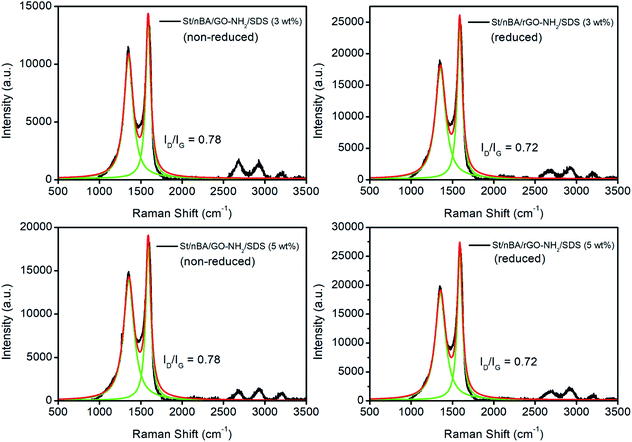
The thermally reduced films were subsequently subjected to four-point probe analysis to measure their electrical conductivity. The reduced St/nBA/GO–NH2/SDS (3 wt%) film yielded an electrical conductivity of 0.79 ± 0.0001 S m−1 (n = 6, average ± standard deviation) while the reduced St/nBA/GO–NH2/SDS (5 wt%) film resulted in 0.89 ± 0.0370 S m−1 (n = 6) (Table S8†). These conductivity values are at least two orders of magnitude higher than previously reported values for EDA-reduced GO aerogels (∼1.6 × 10⁻³ S m−1).35 The observed electrical conductivity can be attributed to the combination of (i) formation of inter (GO) particle interfaces, (ii) stitching mediated formation of conductive networks, and (iii) possibly formation ionic channels facilitating charge transfer across the film.27 Since preparation of colloidally stable GO–NH2 has to date remained elusive, to the best of our knowledge there are no reports in the literature on the electrical conductivity of EDA-functionalised GO films or their polymer-based nanocomposites. The electrical conductivity of both films were however considerably lower than the conductivity obtained for St/nBA/GO (5 wt%) film prepared under similar conditions (2.5 S m−1) in our previous work.10 The observed decrease in electrical conductivity in the case of films fabricated from polymer/GO–NH2 can be attributed to the grafting of electronegative –NH– moieties onto the basal plane of GO and stitching of the GO sheets. This in conjunction with the lack of large-area inter-connected GO–NH2 sheets interface within the polymer matrix (as evident from Fig. 5) could have profound impact on the movement of electrons across the nanocomposite films. The electronegative functional group will disrupt the delocalised π-electrons from the basal plane while stitching can provide multiple alternative pathways for the electrons to travel thus marginalising their linear movement across the film. To ascertain that the observed difference in electrical conductivity between the St/nBA/GO–NH2/SDS (3 wt%) and St/nBA/GO–NH2/SDS (5 wt%) films is not due to different extent of reduction of GO to rGO, we conducted Raman analysis on the films before and after thermal reduction. The analysis of the Raman data (Fig. 6) confirmed similar extent of reduction in both reduced nanocomposite films as evident from their ID/IG ratios. The reduction of ID/IG ratios in the case of reduced films compared to non-reduced films is in line with the published reports.43,44
Conclusions
Colloidally stable EDA functionalised GO (GO–NH2) with dangling NH2 groups was synthesised in water at room temperature without any coupling agent (EDC/NHS) to specifically functionalise the epoxy and hydroxyl groups on the GO basal plane. The amount of EDA was carefully considered to avoid excessive stitching of GO sheets by EDA mediated crosslinking. The as-synthesised GO–NH2 was utilised as a surfactant in miniemulsion polymerisation using styrene and n-butyl acrylate (P(St-stat-nBA)) to fabricate waterborne nanocomposite latex with innate ability to undergo film formation under ambient conditions. Minimum 5 wt% of GO–NH2 (relative to monomer) and 3 wt% of SDS (relative to monomer) was required to synthesise colloidally stable latexes which were subsequently dropcast to form nanocomposite films. SEM analysis of the nanocomposite films revealed homogeneous distribution of the GO sheets which was further consistent with the TEM analysis on microtomed ultrathin cross sections of nanocomposite films. Thermally reduced nanocomposite films exhibited electrical conductivity values of ∼0.79 S m−1 and ∼0.89 S m−1 for St/nBA/GO–NH2/SDS (3 wt%) and St/nBA/GO–NH2/SDS (5 wt%), respectively. Raman analysis confirmed that the extent of reduction was very similar in both St/nBA/GO–NH2/SDS (3 wt%) and St/nBA/GO–NH2/SDS (5 wt%) films. It is evident that GO–NH2 can be incorporated within the polymer matrix to fabricate conductive substrates. This will allow for its exploration in a variety of research fields including biomedical engineering, where combination of surface polarity and electrical conductivities are highly desirable traits.15,18Conflicts of interest
There are no conflicts of interest to declare.Acknowledgements
PBZ is grateful to the Australian Research Council for a Discovery Grant (DP190100831). VA acknowledges the National Health and Medical Research Council (NHMRC), Australia, for an Early Career Fellowship (GNT1139060) and UNSW for UNSW-India Collaborative Research Seed Grant. The authors also acknowledge The Mark Wainwright Analytical Centre (MWAC) at UNSW for access to the analytical and microscopy facilities.References
- S. Drewniak, R. Muzyka, A. Stolarczyk, T. Pustelny, M. Kotyczka-Morańska and M. Setkiewicz, Sensors, 2016, 16, 103 CrossRef PubMed.
- E. Yazici, S. Yanik and M. B. Yilmaz, Carbon, 2017, 111, 822–827 CrossRef CAS.
- E. P. Randviir and C. E. Banks, Nanotechnol. Energy Sustainability, 2017, 725–744 CAS.
- J. Lee, J. Kim, S. Kim and D.-H. Min, Adv. Drug Delivery Rev., 2016, 105, 275–287 CrossRef CAS PubMed.
- D. P. Singh, C. E. Herrera, B. Singh, S. Singh, R. K. Singh and R. Kumar, Mater. Sci. Eng., C, 2018, 86, 173–197 CrossRef CAS PubMed.
- K. Santhosh, M. D. Modak and P. Paik, Nanomed. Res. J., 2017, 5, 1–6 Search PubMed.
- R. K. Joshi, P. Carbone, F. C. Wang, V. G. Kravets, Y. Su, I. V. Grigorieva, H. A. Wu, A. K. Geim and R. R. Nair, Science, 2014, 343, 752–754 CrossRef CAS PubMed.
- J. Kim, L. J. Cote, F. Kim, W. Yuan, K. R. Shull and J. Huang, J. Am. Chem. Soc., 2010, 132, 8180–8186 CrossRef CAS PubMed.
- Y. Fadil, V. Agarwal, F. Jasinski, S. C. Thickett, H. Minami and P. B. Zetterlund, Nanoscale, 2019, 11, 6566–6570 RSC.
- Y. Fadil, L. N. M. Dinh, M. O. Y. Yap, R. P. Kuchel, Y. Yao, T. Omura, U. A. Aregueta-Robles, N. Song, S. Huang, F. Jasinski, S. C. Thickett, H. Minami, V. Agarwal and P. B. Zetterlund, ACS Appl. Mater. Interfaces, 2019, 11, 48450–48458 CrossRef CAS PubMed.
- Y. Fadil, F. Jasinski, T. Wing Guok, S. C. Thickett, H. Minami and P. B. Zetterlund, Polym. Chem., 2018, 9, 3368–3378 RSC.
- Y. Cai, Y. Fadil, F. Jasinski, S. C. Thickett, V. Agarwal and P. B. Zetterlund, Carbon, 2019, 149, 445–451 CrossRef CAS.
- Y. Fadil, S. H. C. Man, F. Jasinski, H. Minami, S. C. Thickett and P. B. Zetterlund, J. Polym. Sci., Part A: Polym. Chem., 2017, 55, 2289–2297 CrossRef CAS.
- S. H. Che Man, S. C. Thickett, M. R. Whittaker and P. B. Zetterlund, J. Polym. Sci., Part A: Polym. Chem., 2013, 51, 47–58 CrossRef CAS.
- S. Kumar, S. Raj, E. Kolanthai, A. K. Sood, S. Sampath and K. Chatterjee, ACS Appl. Mater. Interfaces, 2015, 7, 3237–3252 CrossRef CAS PubMed.
- N. H. Kim, T. Kuila and J. H. Lee, J. Mater. Chem. A, 2013, 1, 1349–1358 RSC.
- J. U. Lee, W. Lee, J. W. Yi, S. S. Yoon, S. B. Lee, B. M. Jung, B. S. Kim and J. H. Byun, J. Mater. Chem. A, 2013, 1, 12893–12899 RSC.
- B. Li, V. Agarwal, D. Ho, J.-P. Vede and K. S. Iyer, New J. Chem., 2018, 42, 7237–7240 RSC.
- J. Chen, L. Yang, S. Li and W. Ding, Molecules, 2018, 23, 1104 CrossRef PubMed.
- F. Samadaei, M. Salami-Kalajahi, H. Roghani-Mamaqani and M. Banaei, RSC Adv., 2015, 5, 71835–71843 RSC.
- K. Fan, J. Li, L. Li and J. Li, Fullerenes, Nanotubes, Carbon Nanostruct., 2018, 26, 30–37 CrossRef CAS.
- S. H. Ryu, J. H. Sin and A. M. Shanmugharaj, Eur. Polym. J., 2014, 52, 88–97 CrossRef CAS.
- L. Hu, P. Jiang, P. Zhang, G. Bian, S. Sheng, M. Huang, Y. Bao and J. Xia, J. Mater. Sci., 2016, 51, 8296–8309 CrossRef CAS.
- H. Koolivand, A. Sharif, M. R. Kashani, M. Karimi, M. K. Salooki and M. A. Semsarzadeh, J. Polym. Res., 2014, 21, 599 CrossRef.
- Y. Chen, D. Li, W. Yang, C. Xiao and M. Wei, Polymer, 2018, 140, 56–72 CrossRef CAS.
- L. N. M. Dinh, L. N. Ramana, V. Agarwal and P. B. Zetterlund, Polym. Chem., 2020, 11, 3217–3224 RSC.
- S. Stankovich, D. A. Dikin, R. D. Piner, K. A. Kohlhaas, A. Kleinhammes, Y. Jia, Y. Wu, S. T. Nguyen and R. S. Ruoff, Carbon, 2007, 45, 1558–1565 CrossRef CAS.
- S. Park, Y. Hu, J. O. Hwang, E.-S. Lee, L. B. Casabianca, W. Cai, J. R. Potts, H.-W. Ha, S. Chen, J. Oh, S. O. Kim, Y.-H. Kim, Y. Ishii and R. S. Ruoff, Nat. Commun., 2012, 3, 638 CrossRef PubMed.
- V. Agarwal, D. McLean, J. Horne, D. Richardson and K. Stack, J. Appl. Polym. Sci., 2013, 127, 3970–3979 CrossRef CAS.
- P. K. Samantaray, S. Indrakumar, K. Chatterjee, V. Agarwal and S. Bose, Nanoscale Adv., 2020, 2, 2824–2834 RSC.
- J. Ma, Q. Meng, A. Michelmore, N. Kawashima, Z. Izzuddin, C. Bengtsson and H.-C. Kuan, J. Mater. Chem. A, 2013, 1, 4255–4264 RSC.
- N. Izza Taib, V. Agarwal, N. M. Smith, R. C. Woodward, T. G. St. Pierre and K. S. Iyer, Mater. Chem. Front., 2017, 1, 2335–2340 RSC.
- V. Agarwal, A. G. Panicker, S. Indrakumar and K. Chatterjee, Int. J. Biol. Macromol., 2019, 133, 382–390 CrossRef CAS PubMed.
- W.-S. Hung, C.-H. Tsou, M. De Guzman, Q.-F. An, Y.-L. Liu, Y.-M. Zhang, C.-C. Hu, K.-R. Lee and J.-Y. Lai, Chem. Mater., 2014, 26, 2983–2990 CrossRef CAS.
- K. Vrettos, N. Karouta, P. Loginos, S. Donthula, D. Gournis and V. Georgakilas, Front. Mater., 2018, 5 DOI:10.3389/fmats.2018.00020.
- D. Voiry, J. Yang, J. Kupferberg, R. Fullon, C. Lee, H. Y. Jeong, H. S. Shin and M. Chhowalla, Science, 2016, 353, 1413–1416 CrossRef CAS PubMed.
- F. Alotaibi, T. T. Tung, M. J. Nine, S. Kabiri, M. Moussa, D. N. H. Tran and D. Losic, Carbon, 2018, 127, 113–121 CrossRef CAS.
- Y. Zhao, H. Ding and Q. Zhong, Appl. Surf. Sci., 2012, 258, 4301–4307 CrossRef CAS.
- J. M. Asua, Prog. Polym. Sci., 2002, 27, 1283–1346 CrossRef CAS.
- P. B. Zetterlund, S. C. Thickett, S. Perrier, E. Bourgeat-Lami and M. Lansalot, Chem. Rev., 2015, 115, 9745–9800 CrossRef CAS PubMed.
- V. Abhilash, N. Rajender and K. Suresh, in Spectroscopy of Polymer Nanocomposites, Elsevier, 2016, pp. 410–451 Search PubMed.
- R. Aradhana, S. Mohanty and S. K. Nayak, Polymer, 2018, 141, 109–123 CrossRef CAS.
- G. Cai, Z. Xu, M. Yang, B. Tang and X. Wang, Appl. Surf. Sci., 2017, 393, 441–448 CrossRef CAS.
- G. Eda and M. Chhowalla, Adv. Mater., 2010, 22, 2392–2415 CrossRef CAS PubMed.
Footnote |
| † Electronic supplementary information (ESI) available. See DOI: 10.1039/d0na00534g |
| This journal is © The Royal Society of Chemistry 2020 |

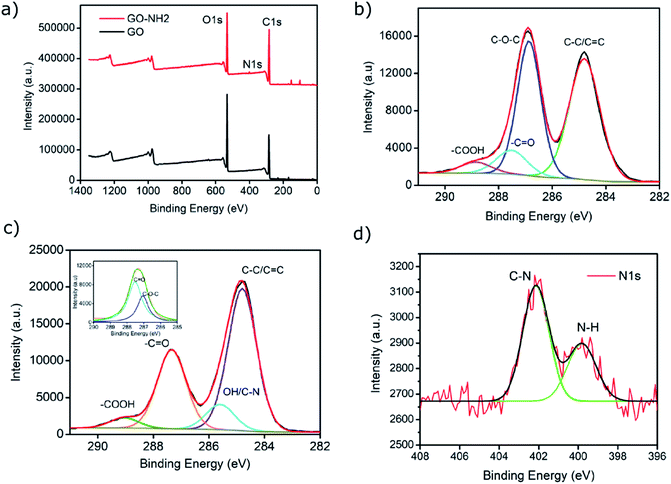
![[double bond, length as m-dash]](https://www.rsc.org/images/entities/char_e001.gif) O peak); (d) deconvoluted N 1s spectrum of GO–NH2 exhibiting characteristic C–N and N–H peaks.
O peak); (d) deconvoluted N 1s spectrum of GO–NH2 exhibiting characteristic C–N and N–H peaks.