 Open Access Article
Synthesis and catalytic evaluation of PVP–CeO2/rGO as a highly efficient and recyclable heterogeneous catalyst for multicomponent reactions in water†
Shaheen
Siddiqui
 and
Zeba N.
Siddiqui
*
Department of Chemistry, Aligarh Muslim University, Aligarh 202002, Uttar Pradesh, India. E-mail: siddiqui_zeba@yahoo.co.in; zns.siddiqui@gmail.com
First published on 28th August 2020
Abstract
A highly efficient and eco-friendly route for the reduction of graphene oxide (GO) to reduced graphene oxide (rGO) was developed by using polyvinylpyrrolidone coated CeO2 NPs (PVP–CeO2) as a reducing and stabilizing agent. The resulting carbonaceous material, PVP–CeO2/rGO, was well characterized with different spectroscopic techniques such as Fourier Transform Infrared (FTIR) spectroscopy, Scanning Electron Microscopy (SEM), Energy Dispersive X-ray (EDX), elemental mapping, Transmission Electron Microscopy (TEM), Raman spectroscopy, powder X-ray diffraction (XRD), Brunauer–Emmett–Teller (BET), X-ray Photoelectron Spectroscopy (XPS), and Thermal Gravimetric (TG) analyses. The material exhibited high catalytic potential towards multicomponent reactions for the synthesis of biologically relevant benzodiazepine derivatives in aqueous media. The efficiency of the material for the desired reaction was shown in the form of an excellent product yield (96–98%) and a very short reaction time period (7–10 min). The use of water as solvent and recyclability of the catalyst made the present protocol acceptable from a green perspective.
1. Introduction
Graphene is a 2D system with very strong sp2 hybridized carbon–carbon bonds arranged in a hexagonal manner to form a layered structure with a high aspect ratio and a large π-electronic surface. It has some unique and remarkable properties such as exceptionally high thermal conductivity, a greater surface area, very high carrier mobility at room temperature and excellent mechanical properties.1 Graphene is generally produced by three methods viz. chemical reduction of graphene oxide (GO),2 chemical vapor deposition3 and micro-mechanical stripping.4 The chemical reduction of GO to rGO is a simple and large scale route but it involves hazardous reducing agents such as hydrazine,5 NaBH4,6 dimethyl hydrazine,7 hydroquinone etc.8 Recently, the development of innovative synthetic approaches utilizing non-toxic and cost effective chemicals for the reduction of GO to rGO has attracted prime interest and as a result various environmentally benign methods have been adopted to synthesize rGO.9–12 The incorporation of metal nanoparticles into GO sheets has become a widespread green methodology for the reduction of GO resulting in the formation of metal functionalized rGO such as Au–rGO,13 Ag–rGO,14 Pd–rGO,15 W–rGO,9 Fe–rGO,16 Ti–rGO,17 Mo–rGO,18 Ce–rGO,19etc. Metal functionalized rGO materials have potential applications including stripping analysis of methyl parathion,13 biological activities,14 catalysis,15,18 photoelectrochemical water splitting,16 and sensing.17,20 Focussing on catalytic applications, graphene based materials have been extensively used as catalysts in various organic transformations such as reduction of nitro organics,21 oxidative C–H functionalization of tertiary amines,22 Suzuki and Heck cross-coupling,23 oxidative esterification of alcohols,24 alkene hydrogenation,25 Friedel–Crafts addition,26a Knoevenagel condensation,26betc. To the best of our knowledge, there is no report of using metal functionalized rGO for the synthesis of benzodiazepine derivatives. Cerium oxide nanoparticles (CeO2 NPs) have attracted tremendous interest in the field of science and nanotechnology because of their useful industrial and synthetic applications.20,27–30 CeO2 NPs owing to their acid–base and redox properties have been widely used as an efficient catalyst in various organic transformations such as dehydration of alcohols, alkylation of aromatic compounds, carbamate synthesis from CO2, reduction of carboxylic acid, ketonization of alcohols, etc.31 Different polymeric materials have been used for the stabilization of CeO2 NPs. Polyvinylpyrrolidone (PVP) is a highly cross-linked, non-ionic,32 and non-toxic33 polymer containing both hydrophilic (the pyrrolidone moiety) and hydrophobic components (the alkyl group) in its structure.34 It acts as a stabilizer by inhibiting the aggregation of NPs resulting from the repulsive forces through its hydrophobic carbon chains that extend into solvents and interact with each other.35Benzodiazepine nuclei are important pharmacophoric scaffolds and constitute a special class of heterocycles with diverse biological activities such as anti-HIV-1,36 antiviral,37 antitumor,38etc. Besides their eye-catching biological properties, benzodiazepines have also been used as valuable synthons for various fused ring compounds such as imidazo,39 triazolo,40 and pyrimido-benzodiazepines.41 Water as a solvent also contributes to green chemistry by featuring many benefits such as simplifying workup procedures, enabling the recycling of the catalyst, improving reactivity and selectivity, and allowing mild reaction conditions and protecting-group free synthesis in addition to being benign itself.42 Taking into account the aforementioned properties of graphene based materials and in continuation of our ongoing research,43 we herein, describe an easy route for the synthesis of PVP–CeO2 coated reduced graphene oxide (PVP–CeO2/rGO). The material was well characterized and used as an efficient heterogeneous catalyst for water compatible synthesis of benzodiazepine derivatives under environmentally benign conditions.
2. Experimental
2.1. Synthesis of graphene oxide (GO)
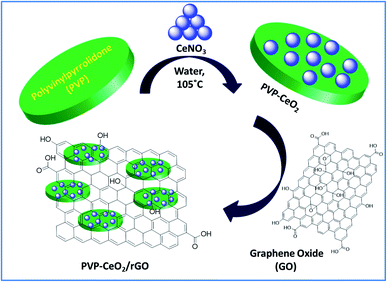
GO was synthesized using modified Hummers' method.44 In a 250 mL RB flask, 1.2 g of graphite flakes, 0.55 g of NaNO3 and 25 mL conc. H2SO4 were added and the resulting mixture was stirred for 30 min in an ice bath at 0–5 °C to obtain a black paste. To this mixture, 3.2 g of KMnO4 was slowly added (at a rate of 1 g per 15 min) with vigorous stirring and temperature was maintained using an ice bath to avoid explosion. After complete addition of KMnO4, the ice bath was removed and the reaction mixture was stirred at 35 °C for 2 h. After that, 50 mL of de-ionized water was added very slowly to the reaction mixture. Since, it is a highly exothermic process, a huge amount of heat is produced during this process and the temperature reaches around 100 °C and the colour of the reaction mixture turns brownish. After 25 min, 10 mL of 30% H2O2 and 100 mL warm water were added to the reaction flask and the mixture was stirred for 5 min resulting in the formation of a yellowish-brown solution. The resulting solution was filtered, treated with 5% HCl to remove impurities and subsequently washed with a copious amount of double distilled water. As obtained, the product (yellowish-brown) was oven dried at 60 °C for 14 h and re-dispersed in 100 mL double distilled water by ultrasonication for 3 h to obtain a brown colored GO dispersion. The resulting dispersion was filtered and washed thoroughly with deionized water and dried at 60 °C for 6 h to obtain a brown colored solid (GO) (yield: GO = 1.52 g).2.2. Synthesis of PVP–CeO2 coated reduced graphene oxide (PVP–CeO2/rGO)
In the first step, PVP coated cerium oxide NPs (PVP–CeO2 NPs) were synthesized by adopting a previously reported procedure with a slight modification.45 In a typical run, CeNO3 (130 mg) was dissolved in 5 mM aqueous solution (50 mL) of PVP and the mixture was heated at 105 °C for 3 h. After heating, the reaction mixture was poured into cold water and acetone (4![[thin space (1/6-em)]](https://www.rsc.org/images/entities/char_2009.gif) :
:![[thin space (1/6-em)]](https://www.rsc.org/images/entities/char_2009.gif) 1 ratio, acetone/particle suspension) to remove excess PVP. The mixture was then centrifuged at 4000 rpm for 10 min. The yellow pellets (PVP–CeO2 NPs) thus obtained were retained and the excess liquid was discarded (yield: PVP–CeO2 = 0.98 g).
1 ratio, acetone/particle suspension) to remove excess PVP. The mixture was then centrifuged at 4000 rpm for 10 min. The yellow pellets (PVP–CeO2 NPs) thus obtained were retained and the excess liquid was discarded (yield: PVP–CeO2 = 0.98 g).
In the second step, the pellets were re-suspended in 100 mL double distilled water containing GO (1 g) and the resulting mixture was sonicated for 30 min at 45 °C. The yellowish brown colour of the solution turned black indicating the reduction of GO and formation of PVP–CeO2/rGO. The obtained PVP–CeO2/rGO was separated by centrifugation, washed with double distilled water and dried in a vacuum oven at 60 °C for 24 h (yield: PVP–CeO2/rGO = 1.78 g).
2.3. General procedure for the synthesis of benzodiazepine derivatives (4a–j)
A mixture of 5-acetyl-1,3-dimethylbarbituric acid 1 (1 mmol), aromatic/hetero aromatic aldehydes 2a–e (1 mmol), 1,2-diamines 3a,b (1 mmol) and PVP–CeO2/rGO (30 mg) were taken in a round bottom flask (50 mL) and stirred in water at room temperature for a specified time period. The completion of the reaction was marked by TLC. The reaction mixture was kept at room temperature for a few minutes and ethyl acetate (5 mL) was added to extract the product. The catalyst being insoluble in ethyl acetate was separated by filtration, washed thoroughly with ethyl acetate (2 × 10 mL), dried and reused. The filtrate containing the crude products was washed thoroughly with double distilled water (4 × 10 mL), dried over anhydrous sodium sulphate and evaporated under reduced pressure. The crude products were recrystallized from ethanol to afford pure products 4a–j.3. Results and discussion
3.1. Characterization of PVP–CeO2/rGO
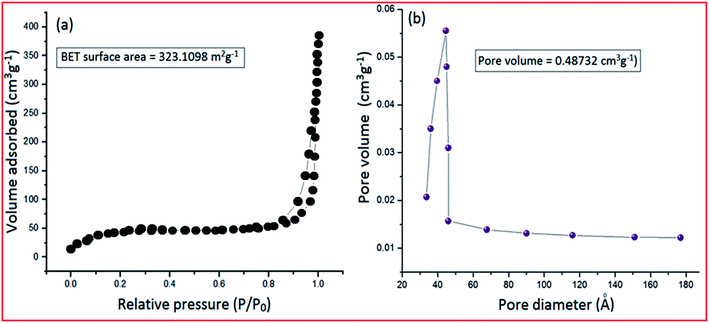
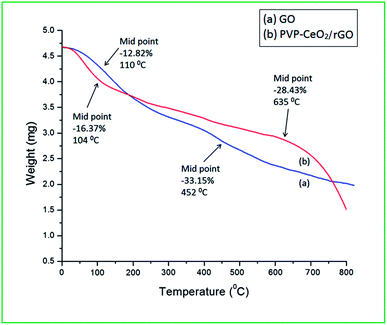
The material PVP–CeO2/rGO was synthesized as outlined in Scheme 1.The synthesized material (PVP–CeO2/rGO) combines the properties of PVP, CeO2 and rGO. CeO2 NPs provided sufficient acidity to the catalyst, PVP acted as a stabilizing agent for NPs and graphene sheets provided a surface for the catalytic activity. The material was characterized by various techniques such as FTIR, SEM, EDX, elemental mapping, TEM, Raman spectroscopy, XRD, BET, XPS and TG analyses.
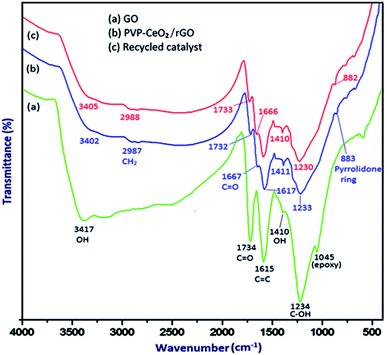
![[double bond, length as m-dash]](https://www.rsc.org/images/entities/char_e001.gif) O stretching vibration, C
O stretching vibration, C![[double bond, length as m-dash]](https://www.rsc.org/images/entities/char_e001.gif) C stretching vibration of aromatic rings, –OH deformation, C–OH stretching and C–O (epoxy) stretching respectively.46 When PVP–CeO2 was introduced into GO sheets, the intensity of C
C stretching vibration of aromatic rings, –OH deformation, C–OH stretching and C–O (epoxy) stretching respectively.46 When PVP–CeO2 was introduced into GO sheets, the intensity of C![[double bond, length as m-dash]](https://www.rsc.org/images/entities/char_e001.gif) O and C–OH bands decreased significantly whereas the band at 1045 cm−1 disappeared completely indicating the reduction of GO leading to the formation of PVP–CeO2/rGO (Fig. 1b). The characteristic bands of PVP appeared at 2987 cm−1, 1667 cm−1 and 883 cm−1 due to the stretching vibration of CH2 of alkyl chain, C
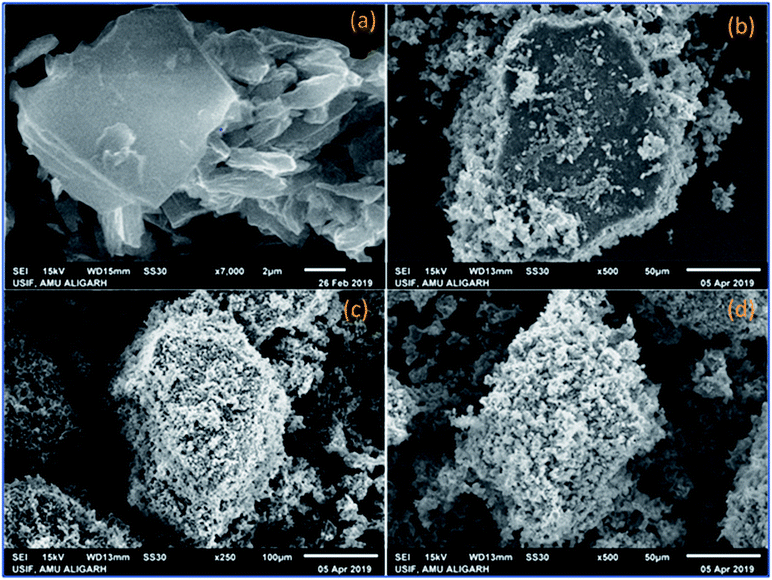
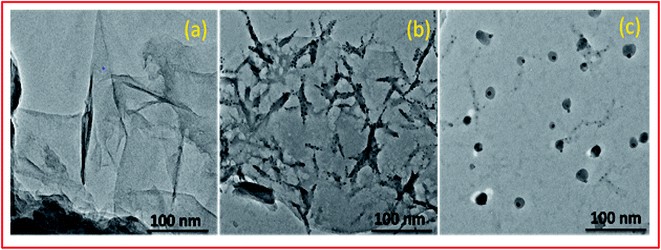
O and C–OH bands decreased significantly whereas the band at 1045 cm−1 disappeared completely indicating the reduction of GO leading to the formation of PVP–CeO2/rGO (Fig. 1b). The characteristic bands of PVP appeared at 2987 cm−1, 1667 cm−1 and 883 cm−1 due to the stretching vibration of CH2 of alkyl chain, C![[double bond, length as m-dash]](https://www.rsc.org/images/entities/char_e001.gif) O stretching and breathing vibration of the pyrrolidone ring respectively (Fig. 1b).47 The surface morphology of GO (Fig. 2a) showed a sheet like structure, whereas the uniform distribution of PVP–CeO2 NPs over the rGO sheets was clearly discernible in PVP–CeO2/rGO (Fig. 2b and c).
O stretching and breathing vibration of the pyrrolidone ring respectively (Fig. 1b).47 The surface morphology of GO (Fig. 2a) showed a sheet like structure, whereas the uniform distribution of PVP–CeO2 NPs over the rGO sheets was clearly discernible in PVP–CeO2/rGO (Fig. 2b and c).
![[thin space (1/6-em)]](https://www.rsc.org/images/entities/char_2009.gif) :
:![[thin space (1/6-em)]](https://www.rsc.org/images/entities/char_2009.gif) 1
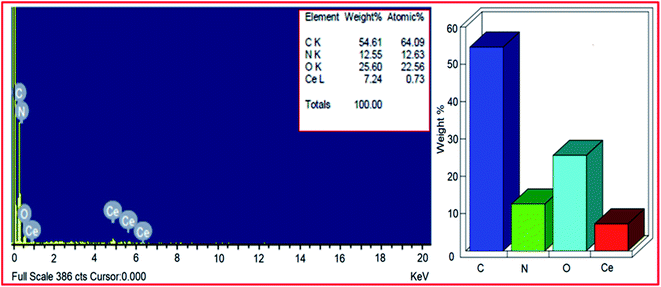
1![[thin space (1/6-em)]](https://www.rsc.org/images/entities/char_2009.gif) 48 and in rGO most of the oxygen functionalities were removed. But, from the EDX pattern of PVP–CeO2/rGO, the carbon
48 and in rGO most of the oxygen functionalities were removed. But, from the EDX pattern of PVP–CeO2/rGO, the carbon![[thin space (1/6-em)]](https://www.rsc.org/images/entities/char_2009.gif) :
:![[thin space (1/6-em)]](https://www.rsc.org/images/entities/char_2009.gif) oxygen ratio was obtained to be approximately 3
oxygen ratio was obtained to be approximately 3![[thin space (1/6-em)]](https://www.rsc.org/images/entities/char_2009.gif) :
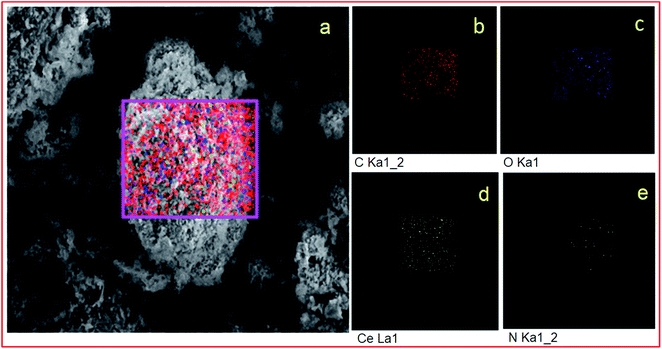
:![[thin space (1/6-em)]](https://www.rsc.org/images/entities/char_2009.gif) 1.5. This showed the presence of excess oxygen in PVP–CeO2/rGO due to the incorporation of CeO2 NPs. From the EDX pattern, the atomic% of nitrogen was obtained to be 12.63% which has come from the PVP moiety present in the catalyst. Elemental mapping analysis of PVP–CeO2/rGO was performed to observe the distribution of the elements in the matrix. The elemental mapping image of the PVP–CeO2/rGO material (Fig. 4a) confirmed the uniform distribution of carbon (Fig. 4b), oxygen (Fig. 4c) cerium (Fig. 4d) and nitrogen (Fig. 4e) elements in the catalyst.
1.5. This showed the presence of excess oxygen in PVP–CeO2/rGO due to the incorporation of CeO2 NPs. From the EDX pattern, the atomic% of nitrogen was obtained to be 12.63% which has come from the PVP moiety present in the catalyst. Elemental mapping analysis of PVP–CeO2/rGO was performed to observe the distribution of the elements in the matrix. The elemental mapping image of the PVP–CeO2/rGO material (Fig. 4a) confirmed the uniform distribution of carbon (Fig. 4b), oxygen (Fig. 4c) cerium (Fig. 4d) and nitrogen (Fig. 4e) elements in the catalyst.
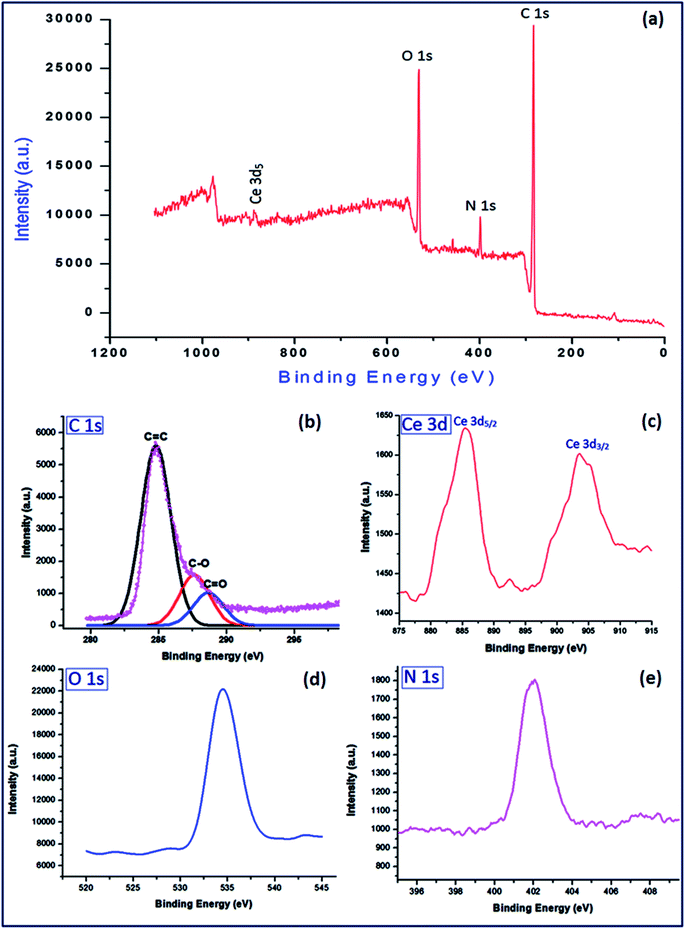
![[double bond, length as m-dash]](https://www.rsc.org/images/entities/char_e001.gif) C, C–O and C
C, C–O and C![[double bond, length as m-dash]](https://www.rsc.org/images/entities/char_e001.gif) O at binding energies 284.8 eV, 287.6 eV and 288.3 eV respectively2 (Fig. 8a). The Ce 3d displayed two sharp peaks for 3d5/2 and 3d3/2 at 885.4 eV and 903.2 eV respectively54 (Fig. 8b). The sharp bands at binding energies 534.6 eV and 402.1 eV were assigned to O 1s (Fig. 8c) and N 1s (Fig. 8d) respectively. The cerium content was found to be 7.34% which corresponds to 0.523 mmol g−1 of the catalyst.
O at binding energies 284.8 eV, 287.6 eV and 288.3 eV respectively2 (Fig. 8a). The Ce 3d displayed two sharp peaks for 3d5/2 and 3d3/2 at 885.4 eV and 903.2 eV respectively54 (Fig. 8b). The sharp bands at binding energies 534.6 eV and 402.1 eV were assigned to O 1s (Fig. 8c) and N 1s (Fig. 8d) respectively. The cerium content was found to be 7.34% which corresponds to 0.523 mmol g−1 of the catalyst.
3.2. Catalytic evaluation
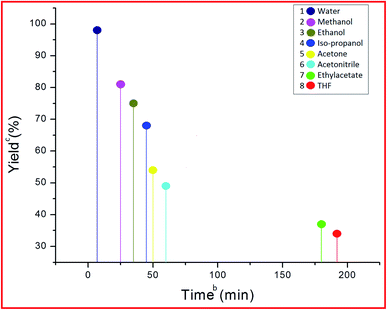
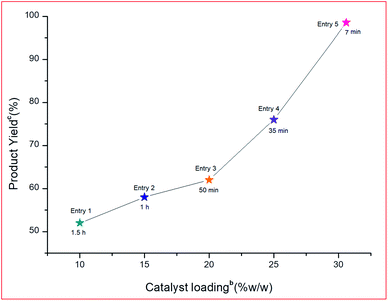
The efficiency of the synthesized material as a catalyst was tested by synthesizing benzodiazepine derivatives. Several parameters such as the effect of different catalysts, solvents, catalyst loading and temperatures on a model reaction were taken into consideration. A reaction between 5-acetyl-1,3-dimethylbarbituric acid 1, 3-nitrobenzaldehyde 2c and o-phenylenediamine 3a to produce substituted benzodiazepine 4c was chosen as the model reaction (Scheme 2). The components 1 and 3a had no substituents and 2c was functionalized with a m-NO2 substituent which had the minimum effect out of all aldehydes used for the synthesis of benzodiazepine derivatives. Therefore, Scheme 2, was the best composition of reactants to see the effect of different parameters.| Entry | Catalyst | Timeb | Yieldc (%) |
|---|---|---|---|
| a Reaction conditions: 5-acetyl-1,3-dimethylbarbituric acid 1 (1 mmol), 3-nitrobenzaldehyde 2c (1 mmol), o-phenylenediamine 3a (1 mmol), different catalysts (30 mg), water, r.t. stirring. b Reaction progress monitored by TLC. c Isolated yield. | |||
| 1 | — | 24 h | — |
| 2 | ZnO NPs | 5 h | 40 |
| 3 | CaO NPs | 4.2 h | 42 |
| 4 | CuO NPs | 4 h | 45 |
| 5 | TiO2 NPs | 3.5 h | 48 |
| 6 | Fe2O3 NPs | 3 h | 51 |
| 7 | CeO2 NPs | 2 h | 54 |
| 8 | PPy–CeO2 | 1.8 h | 56 |
| 9 | PANI–CeO2 | 1.5 | 59 |
| 10 | PVA–CeO2 | 1.2 h | 61 |
| 11 | Chitosan–CeO2 | 1 h | 64 |
| 12 | PVP–CeO2 | 50 min | 70 |
| 13 | PVP–CeO2/Al2O3 | 28 min | 73 |
| 14 | PVP–CeO2/ZrO2 | 25 min | 76 |
| 15 | PVP–CeO2/SiO2 | 20 min | 78 |
| 16 | PVP–CeO2/rGO | 7 min | 98 |
| Entry | Catalyst loading | Timeb (min) | Yieldc (%) | TON | TOF (h−1) |
|---|---|---|---|---|---|
| a Reaction conditions: 5-acetyl-1,3-dimethylbarbituric acid 1 (1 mmol), 3-nitrobenzaldehyde 2c (1 mmol), o-phenylenediamine 3a (1 mmol), PVP–CeO2/rGO, different amount of catalyst, r.t. stirring. b Reaction progress monitored by TLC. c Isolated yield. | |||||
| 1 | 10 mg | 90 | 43 | 82.21 | 54.81 |
| 2 | 20 mg | 45 | 62 | 59.27 | 79.03 |
| 3 | 25 mg | 25 | 81 | 61.95 | 148.68 |
| 4 | 30 mg | 7 | 98 | 62.46 | 535.37 |
| 5 | 40 mg | 7 | 98 | 46.84 | 401.52 |
3.3. Catalytic reaction
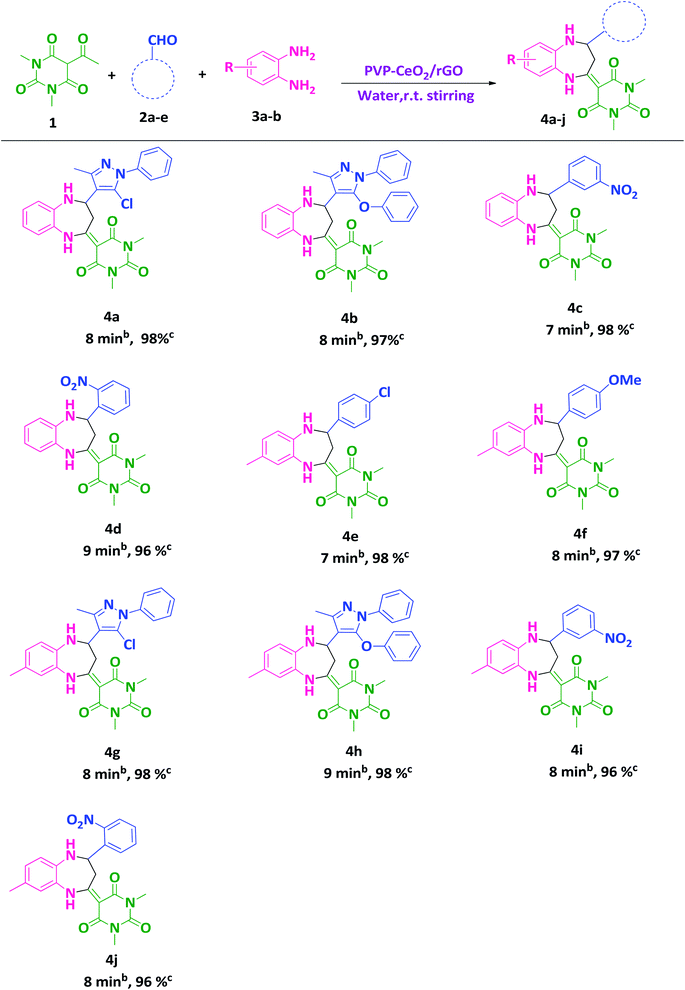
After finding out the most suitable reaction conditions, substituted benzodiazepine derivatives were synthesized by carrying out the reaction between 5-acetyl-1,3-dimethylbarbituric acid 1 (1 mmol), hetero-aromatic/aromatic aldehydes 2a–e and 1,2-diamines 3a,b (1 mmol) in the presence of PVP–CeO2/rGO at room temperature stirring in water for a specified time period (Scheme 3). The turnover number (TON) and turnover frequency (TOF) of the catalyst were calculated to show the efficiency of PVP–CeO2/rGO. The high TONs and TOFs confirmed the excellent performance of PVP–CeO2/rGO for the synthesis of benzodiazepines (Table 3).| Entry | Product | Time (min) | Yield (%) | TON | TOF (h−1) |
|---|---|---|---|---|---|
| 1 | 4a | 8 | 98 | 62.46 | 468.45 |
| 2 | 4b | 8 | 97 | 61.82 | 463.65 |
| 3 | 4c | 7 | 98 | 62.46 | 535.37 |
| 4 | 4d | 9 | 96 | 61.18 | 407.86 |
| 5 | 4e | 7 | 98 | 62.46 | 535.37 |
| 6 | 4f | 8 | 97 | 61.82 | 463.65 |
| 7 | 4g | 8 | 98 | 62.46 | 468.45 |
| 8 | 4h | 9 | 98 | 62.46 | 416.40 |
| 9 | 4i | 8 | 96 | 61.18 | 458.85 |
| 10 | 4j | 8 | 96 | 61.18 | 458.85 |
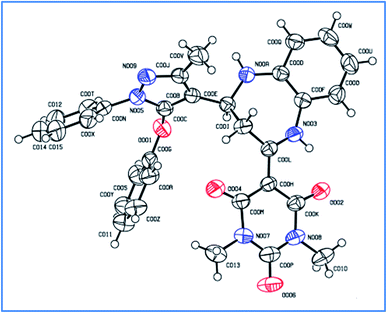
The single crystal structure of one of the synthesized compounds 4b is shown in Fig. 13. The relevant details are provided in Table 4.
| Identification code | 4b |
| Empirical formula | C31H28N6O4 |
| Formula weight | 548.59 |
| Temperature/K | 273.15 |
| Crystal system | Monoclinic |
| Space group | P21/n |
| a/Å | 18.836(3) |
| b/Å | 7.2533(10) |
| c/Å | 19.682(3) |
| α/° | 90 |
| β/° | 92.081(4) |
| γ/° | 90 |
| Volume/Å3 | 2687.3(6) |
| Z | 4 |
| ρ calc/g cm−3 | 1.356 |
| μ/mm−1 | 0.093 |
| F(000) | 1152.0 |
| Crystal size/mm3 | 0.52 × 0.25 × 0.08 |
| Radiation | MoKα (λ = 0.71073) |
| 2Θ range for data collection/° | 5.882 to 49.998 |
| Index ranges | −22 ≤ h ≤ 22, −8 ≤ k ≤ 8, −23 ≤ l ≤ 23 |
| Reflections collected | 29![[thin space (1/6-em)]](https://www.rsc.org/images/entities/char_2009.gif) 871 871 |
| Independent reflections | 4723 [Rint = 0.0593, Rsigma = 0.0407] |
| Data/restraints/parameters | 4723/0/377 |
| Goodness-of-fit on F2 | 1.033 |
| Final R indices I ≥ 2σ(I) | R 1 = 0.0514, wR2 = 0.1151 |
| Final R indices all data | R 1 = 0.0943, wR2 = 0.1372 |
| Largest diff. peak/hole/e Å−3 | 0.16/−0.24 |
The green perspective of the present protocol was also discussed in terms of atom economy (AE), reaction mass efficiency (RME), overall efficiency (OE), carbon efficiency (CE), process mass intensity (PMI), E-factor and solvent intensity (SI). The details of the green metric calculations of these parameters are provided in the ESI.† The values of all parameters showed that the present protocol was fitting suitably in the range of sustainability as confirmed by an earlier study.56 The results of the green metric parameters are given in Table 5.
| Compound | % yield | % AEa | % CEb | % RMEc | % OEd | PMIe | SIf | E-factorg |
|---|---|---|---|---|---|---|---|---|
| a % AE: percentage atom economy. b % CE: percentage carbon efficiency. c % RME: percentage reaction mass efficiency. d % OE: percentage overall efficiency. e PMI: process mass intensity. f SI: solvent intensity. g E-factor. h Catalyst amount was not used in the calculations because of its reusability.57 i Calculations up to the crude product in all cases. | ||||||||
| 4a | 98 | 93.15 | 100.00 | 91.29 | 98.00 | 5.25 | 3.99 | 4.25 |
| 4b | 97 | 93.83 | 100.00 | 91.01 | 96.99 | 4.86 | 3.53 | 3.86 |
| 4c | 98 | 92.92 | 100.00 | 90.27 | 97.14 | 5.95 | 4.65 | 4.95 |
| 4d | 96 | 92.92 | 100.00 | 88.43 | 95.16 | 6.08 | 4.55 | 5.08 |
| 4e | 98 | 92.17 | 100.00 | 90.33 | 98.00 | 5.92 | 4.62 | 4.92 |
| 4f | 97 | 92.10 | 100.00 | 89.34 | 97.00 | 6.03 | 4.61 | 5.03 |
| 4g | 98 | 93.33 | 100.00 | 91.96 | 98.53 | 5.14 | 3.88 | 4.14 |
| 4h | 98 | 93.96 | 100.00 | 92.11 | 98.03 | 4.71 | 3.48 | 3.71 |
| 4i | 96 | 92.35 | 100.00 | 88.66 | 96.00 | 5.91 | 4.41 | 4.91 |
| 4j | 96 | 92.35 | 100.00 | 88.66 | 96.00 | 5.91 | 4.41 | 4.91 |
3.4. Recyclability of the catalyst
The reusability of the catalyst was checked by carrying out the recycling experiment on the model reaction (ESI†). It was observed that the catalyst was efficient up to six subsequent cycles with minor loss in catalytic activity after the sixth run (Table 6 and Fig. 1S†).| Catalytic cycle | Timeb (min) | Yieldc (%) |
|---|---|---|
| a Reaction conditions: 5-acetyl-1,3-dimethylbarbituric acid 1 (1 mmol), 3-nitrobenzaldehyde 2c (1 mmol), o-phenylenediamine 3a (1 mmol), PVP–CeO2/rGO(30 mg), water, r.t. stirring. b Reaction progress monitored by TLC. c Isolated yield. | ||
| 1 | 7 | 98 |
| 2 | 7 | 98 |
| 3 | 7 | 98 |
| 4 | 7 | 98 |
| 5 | 7 | 98 |
| 6 | 7 | 98 |
| 7 | 7 | 90 |
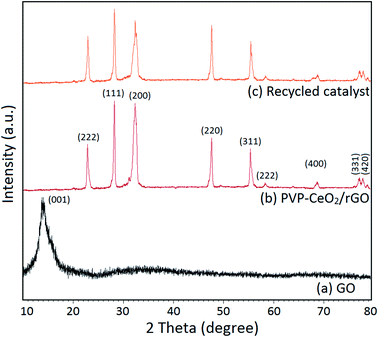
The structural integrity of the recovered catalyst after six runs was established by FTIR, SEM, TEM and powder XRD analyses. In the FTIR spectrum of the recycled catalyst, characteristic peaks were observed in approximately the same region as for the fresh catalyst (Fig. 1c). The SEM and TEM images of the recovered catalyst showed a similar morphology (Fig. 2d and 5c) and characteristic peaks remained the same in the XRD pattern also (Fig. 7c).
3.5. Comparison of the activity of PVP–CeO2/rGO with some previously reported catalysts
In order to determine the advantage of PVP–CeO2/rGO over previously reported catalysts for the synthesis of benzodiazepines, a comparative study was carried out (Table 7). It was observed that the present methodology (Table 7, Entry 5) is better as compared with other reported methods (Table 7, Entries 1–4) in terms of product yield and time. The use of water as a solvent and room temperature synthesis make it environment friendly as well.4. Conclusion
We have developed a simple and easy route for the reduction of graphene oxide with the help of PVP–CeO2 NPs. The carbonaceous material, PVP–CeO2/rGO, was used as a heterogeneous catalyst for the multicomponent synthesis of benzodiazepines. The high catalytic performance of the carbon material was verified by its excellent product yield (96–98%), short reaction time period (7–10 min) and recyclability. The methodology involved use of non-toxic chemicals and solvents for the synthesis and therefore can be considered as eco-friendly.Conflicts of interest
There is no conflict of interest to declare.Acknowledgements
The authors would like to acknowledge DRS-II New Delhi for providing necessary research facilities and USIF, A.M.U. for facilitating SEM/EDX, elemental mapping, and TEM analyses and SAIF, IIT-Patna for single crystal X-ray crystallographic analysis.References
- K. S. Novoselov, V. I. Fal, L. Colombo, P. R. Gellert, M. G. Schwab and K. Kim, Nature, 2012, 490, 192 Search PubMed.
- Q. Lyu, H. Yan, L. Li, Z. Chen, H. Yao and Y. Nie, Polymers, 2017, 9, 447 Search PubMed.
- K. S. Novoselov, A. K. Geim, S. V Morozov, D. Jiang, Y. Zhang, S. V Dubonos, I. V Grigorieva and A. A. Firsov, Science, 2004, 306, 666–669 Search PubMed.
- K. S. Kim, Y. Zhao, H. Jang, S. Y. Lee, J. M. Kim, K. S. Kim, J.-H. Ahn, P. Kim, J.-Y. Choi and B. H. Hong, Nature, 2009, 457, 706 Search PubMed.
- S. Stankovich, D. A. Dikin, R. D. Piner, K. A. Kohlhaas, A. Kleinhammes, Y. Jia, Y. Wu, S. T. Nguyen and R. S. Ruoff, Carbon, 2007, 45, 1558–1565 Search PubMed.
- H. Shin, K. K. Kim, A. Benayad, S. Yoon, H. K. Park, I. Jung, M. H. Jin, H. Jeong, J. M. Kim and J. Choi, Adv. Funct. Mater., 2009, 19, 1987–1992 Search PubMed.
- S. Stankovich, D. A. Dikin, G. H. B. Dommett, K. M. Kohlhaas, E. J. Zimney, E. A. Stach, R. D. Piner, S. T. Nguyen and R. S. Ruoff, Nature, 2006, 442, 282 Search PubMed.
- G. Wang, J. Yang, J. Park, X. Gou, B. Wang, H. Liu and J. Yao, J. Phys. Chem. C, 2008, 112, 8192–8195 Search PubMed.
- R. Yin, P. Shen and Z. Lu, J. Colloid Interface Sci., 2019, 550, 110–116 Search PubMed.
- R. Wijaya, G. Andersan, S. P. Santoso and W. Irawaty, Sci. Rep., 2020, 10, 1–9 Search PubMed.
- R. Sha and S. Badhulika, J. Electroanal. Chem., 2018, 816, 30–37 Search PubMed.
- L. Gan, B. Li, Y. Chen, B. Yu and Z. Chen, Chemosphere, 2019, 219, 148–154 Search PubMed.
- W. Zhu, W. Liu, T. Li, X. Yue, T. Liu, W. Zhang, S. Yu, D. Zhang and J. Wang, Electrochim. Acta, 2014, 146, 419–428 Search PubMed.
- D. Zhang, X. Liu and X. Wang, J. Inorg. Biochem., 2011, 105, 1181–1186 Search PubMed.
- A. H. Al-Marri, M. Khan, M. R. Shaik, N. Mohri, S. F. Adil, M. Kuniyil, H. Z. Alkhathlan, A. Al-Warthan, W. Tremel and M. N. Tahir, Arabian J. Chem., 2016, 9, 835–845 Search PubMed.
- B. Amanulla, S. Palanisamy, S.-M. Chen, V. Velusamy, T.-W. Chiu, T.-W. Chen and S. K. Ramaraj, J. Colloid Interface Sci., 2017, 487, 370–377 Search PubMed.
- F.-Y. Kong, S.-X. Gu, J.-Y. Wang, H.-L. Fang and W. Wang, Sens. Actuators, B, 2015, 213, 397–403 Search PubMed.
- N. Meng, J. Cheng, Y. Zhou, W. Nie and P. Chen, Appl. Surf. Sci., 2017, 396, 310–318 Search PubMed.
- N. Pachauri, K. Dave, A. Dinda and P. R. Solanki, J. Mater. Chem. B, 2018, 6, 3000–3012 Search PubMed.
- C. R. Stanek, A. H. H. Tan, S. L. Owens and R. W. Grimes, J. Mater. Sci., 2008, 43, 4157–4162 Search PubMed.
- S. Liu, Z. Chen, N. Zhang, Z.-R. Tang and Y.-J. Xu, J. Phys. Chem. C, 2013, 117, 8251–8261 Search PubMed.
- Y. Pan, S. Wang, C. W. Kee, E. Dubuisson, Y. Yang, K. P. Loh and C.-H. Tan, Green Chem., 2011, 13, 3341–3344 Search PubMed.
- H. A. Elazab, A. R. Siamaki, S. Moussa, B. F. Gupton and M. S. El-Shall, Appl. Catal., A, 2015, 491, 58–69 Search PubMed.
- S. Verma, D. Verma, A. K. Sinha and S. L. Jain, Appl. Catal., A, 2015, 489, 17–23 Search PubMed.
- Q. M. Kainz, R. Linhardt, R. N. Grass, G. Vilé, J. Pérez-Ramírez, W. J. Stark and O. Reiser, Adv. Funct. Mater., 2014, 24, 2020–2027 Search PubMed.
- (a) A. V. Kumar and K. R. Rao, Tetrahedron Lett., 2011, 52, 5188–5191 Search PubMed; (b) T. Wu, X. Wang, H. Qiu, J. Gao, W. Wang and Y. Liu, J. Mater. Chem., 2012, 22, 4772–4779 Search PubMed.
- T. Hoshino, Y. Kurata, Y. Terasaki and K. Susa, J. Non-Cryst. Solids, 2001, 283, 129–136 Search PubMed.
- P. B. Zantye, A. Kumar and A. K. Sikder, Mater. Sci. Eng., R, 2004, 45, 89–220 Search PubMed.
- M. J. Cumbo, D. Fairhurst, S. D. Jacobs and B. E. Puchebner, Appl. Opt., 1995, 34, 3743–3755 Search PubMed.
- V. Sajith, C. B. Sobhan and G. P. Peterson, Adv. Mech. Eng., 2010, 2, 581407 Search PubMed.
- (a) L. Vivier and D. Duprez, ChemSusChem, 2010, 3, 654–678 Search PubMed; (b) M. Tamura, K. Shimizu and A. Satsuma, Chem. Lett., 2012, 41, 1397–1405 Search PubMed.
- S. V Jadhav, D. S. Nikam, V. M. Khot, N. D. Thorat, M. R. Phadatare, R. S. Ningthoujam, A. B. Salunkhe and S. H. Pawar, New J. Chem., 2013, 37, 3121–3130 Search PubMed.
- G. Lu, S. Li, Z. Guo, O. K. Farha, B. G. Hauser, X. Qi, Y. Wang, X. Wang, S. Han and X. Liu, Nat. Chem., 2012, 4, 310 Search PubMed.
- M. Bahadory, PhD thesis, Drexler University, USA, 2008.
- R. Si, Y.-W. Zhang, L.-P. You and C.-H. Yan, J. Phys. Chem. B, 2006, 110, 5994–6000 Search PubMed.
- M. Di Braccio, G. C. Grossi, G. Roma, L. Vargiu, M. Mura and M. E. Marongiu, Eur. J. Med. Chem., 2001, 36, 935–949 Search PubMed.
- J. R. Kavali and B. V. Badami, Il Farmaco, 2000, 55, 406–409 Search PubMed.
- A. Kamal, N. Shankaraiah, S. Prabhakar, C. R. Reddy, N. Markandeya, K. Laxma and X. Devaiah, Bioorg. Med. Chem. Lett., 2008, 18, 2434–2439 Search PubMed.
- L. Kosychova, L. Pleckaitiene, Z. Staniulyte, R. Janciene, A. Palaima and B. D. Puodziunaite, Arkivoc, 2006,(xiii), 158–164 Search PubMed.
- L. Kosychova, Z. Stumbreviciute, L. Pleckaitiene, R. Janciene and B. D. Puodziunaite, Chem. Heterocycl. Compd., 2004, 40, 811–815 Search PubMed.
- X. Che, L. Zheng, Q. Dang and X. Bai, Tetrahedron, 2006, 62, 2563–2568 Search PubMed.
- M.-O. Simon and C.-J. Li, Chem. Soc. Rev., 2012, 41, 1415–1427 Search PubMed.
- (a) S. Siddiqui, M. U. Khan and Z. N. Siddiqui, ACS Sustainable Chem. Eng., 2017, 5, 7932–7941 Search PubMed; (b) S. Siddiqui and Z. N. Siddiqui, Catal. Lett., 2018, 148, 3628–3645 Search PubMed; (c) S. Siddiqui and Z. N. Siddiqui, Appl. Organomet. Chem., 2019, 33, e5161 Search PubMed; (d) M. U. Khan and Z. N. Siddiqui, ACS Omega, 2018, 3, 10357–10364 Search PubMed; (e) M. U. Khan, S. Siddiqui and Z. N. Siddiqui, ACS Omega, 2019, 4, 7586–7595 Search PubMed; (f) R. A. Rather and Z. N. Siddiqui, J. Organomet. Chem., 2018, 868, 164–174 Search PubMed; (g) R. A. Rather and Z. N. Siddiqui, RSC Adv., 2019, 9, 15749–15762 Search PubMed.
- M. Kooti and M. Afshari, Mater. Res. Bull., 2012, 47, 3473–3478 Search PubMed.
- R. C. Merrifield, Z. W. Wang, R. E. Palmer and J. R. Lead, Environ. Sci. Technol., 2013, 47, 12426–12433 Search PubMed.
- S. Lv, Q. Zhou, Y. Cui, W. Yang and Y. Li, Arabian J. Chem., 2019, 12, 3028–3037 Search PubMed.
- Y.-J. Song, M. Wang, X.-Y. Zhang, J.-Y. Wu and T. Zhang, Nanoscale Res. Lett., 2014, 9, 17 Search PubMed.
- I. Tiginyanu, V. Ursaki and V. Popa, Ultra-thin membranes for sensor applications, in Nanocoatings and Ultra-Thin Films, Woodhead Publishing, 2011, pp. 330–354 Search PubMed.
- I. Boukhoubza, M. Khenfouch, M. Achehboune, L. Leontie, A. Carlescu, C. Doroftei, B. M. Mothudi, I. Zorkani and A. Jorio, J. Alloys Compd., 2020, 154874 Search PubMed.
- P. Sudarsanam, B. Mallesham, D. N. Durgasri and B. M. Reddy, RSC Adv., 2014, 4, 11322–11330 Search PubMed.
- P. Chamoli, M. K. Das and K. K. Kar, J. Phys. Chem. Solids, 2018, 113, 17–25 Search PubMed.
- M. J. McAllister, J.-L. Li, D. H. Adamson, H. C. Schniepp, A. A. Abdala, J. Liu, M. Herrera-Alonso, D. L. Milius, R. Car and R. K. Prud'homme, Chem. Mater., 2007, 19, 4396–4404 Search PubMed.
- S. Wang, F. Gao, Y. Zhao, N. Liu, T. Tan and X. Wang, Nanoscale Res. Lett., 2018, 13, 377 Search PubMed.
- E. Bêche, P. Charvin, D. Perarnau, S. Abanades and G. Flamant, Surf. Interface Anal., 2008, 40, 264–267 Search PubMed.
- P. Chamoli, M. K. Das and K. K. Kar, Phys. E, 2017, 90, 76–84 Search PubMed.
- M. M. Khan, S. Khan, S. Shareef and S. C. Sahoo, RSC Adv., 2018, 8, 41892–41903 Search PubMed.
- J. Safari, S. H. Banitaba and S. D. Khalili, J. Mol. Catal. A: Chem., 2011, 335, 46–50 Search PubMed.
- H. Naeimi and H. Foroughi, Chin. J. Catal., 2015, 36, 734–741 Search PubMed.
- Y. S. An, X. Q. Li, X. R. An and L. Z. Wang, Monatsh. Chem., 2015, 146, 165–172 Search PubMed.
- A. Amoozadeh, M. Malmir, N. Koukabi and S. Otokesh, J. Chem. Res., 2015, 39, 694–697 Search PubMed.
- Z. Nasir, A. Ali, M. Shakir, R. Wahab, Shamsuzzaman and Lutfullah, New J. Chem., 2016, 40, 4223–4227 Search PubMed.
Footnote |
| † Electronic supplementary information (ESI) available: General experimental details, green metrics calculation, recycling experiment and spectral data of synthesized compounds. CCDC 1958389. For ESI and crystallographic data in CIF or other electronic format see DOI: 10.1039/d0na00491j |
| This journal is © The Royal Society of Chemistry 2020 |

