 Open Access Article
The long-range π-conjugation between electron-rich species and multiwall carbon nanotubes influences the fluorescence lifetime and electromagnetic shielding†
Sourav
Biswas
a,
Sujit S.
Panja
 *a and
Suryasarathi
Bose
 *b
*b
aDepartment of Chemistry, National Institute of Technology, Durgapur 713209, India. E-mail: sujit.panja@gmail.com
bDepartment of Materials Engineering, Indian Institute of Science, Bangalore 560012, India. E-mail: sbose@materials.iisc.ac.in
First published on 19th August 2020
Abstract
The efficient dispersion of carbon nanotubes in a given polymer matrix remains an open challenge. Unless addressed, the full potential of carbon nanotubes towards influencing electronic properties of a composite is far from being well understood. Although several reports are available in an open forum that addresses this challenge using various strategies, a mechanistic insight is still lacking. Herein, we have conjugated different electron-rich species with multi-walled carbon nanotubes. We systematically studied their properties by fluorescence lifetime measurements using time-correlated single-photon counting and by density functional theory. Although such conjugations vary with the electronic structure of the electron-rich species, theoretical and computational modeling sheds more light on the actual orientation of such conjugation. Taken together, the fluorescence lifetime and the type of conjugation allowed us to gain mechanistic insight into this conjugation, which further influenced several key properties of the composites. Herein, we attempted to understand these factors influencing the electrical conductivity, and electromagnetic (EM) shielding efficiency in the composite. With the addition of aminoanthracene, which established a T-shaped conjugation with multiwall carbon nanotubes (2 wt%), a remarkable −25 dB shielding effectiveness was achieved with 87% absorption for a shielding material of just 1 mm thick. The actual shielding mechanism, effect of the electronic structure, and the co-relation with the fluorescence lifetime opens new avenues in designing composite-based EM shielding materials.
Introduction
In the last three decades, researchers have been engaged in counteracting the consequences of electromagnetic (EM) radiation, mostly in the microwave region, which comes out as an offshoot of modern electronic devices.1,2 Despite the massive advancements in material science, a definite objective has not yet been fulfilled due to the rapid change in the technological prerequisites. However, researchers have already fixed the properties that are fundamentally significant for any shielded material. The most important of these parameters include the electrical connectivity, dielectric permittivity, and magnetic permeability.2–5 Besides fixing the important properties, researchers are additionally dealing with the choice of a proper technologically required matrix. However, this process did not take much time to change the matrix from a metallic shield to a polymer. The main challenge has been the insulating matrix itself, although the discovery of different nanomaterials with different functional properties helped to solve this problem deftly.6 So, by proper loading of different nanomaterials (single or hybrid) with required properties in the polymer matrix, one can easily achieve the EM shielding efficiency in different frequency regions.7However, this kind of approach was rapidly made obsolete by the progression in research and technological requirements. The two mutually opposing factors, high loading of nanoparticles to meet the specifications and the flexibility of the matrix need to be balanced. Consequently, researchers have been trying to achieve the maximum shielding property by optimizing the filler concentration. They have already proposed different strategies to maximize the shielding efficiency.8–11 However, there are many alternative approaches to achieve the desired properties with the minimum loading of nanoparticles.
Here, we have chosen a model blend system, PC/PVDF (polycarbonate/polyvinylidene difluoride), which exhibits a wide window of bi-continuous structures. The spatial distribution can be controlled by suitably tailoring the chemistry of nanoparticles, which include conducting fillers like multi-walled carbon nanotubes (MWCNTs). To maximize the shielding efficiency by loading the minimum filler concentration, we mainly focused on utilizing non-covalent interactions to prevent the agglomeration of multi-walled carbon nanotubes in the blend. We introduced three different polyaromatic molecules, which could noncovalently conjugate with MWCNTs due to their extended π-electron clouds. This noncovalent conjugation aids in their effective dispersion in the matrix, resulting in a very high AC electrical conductivity and shielding efficiency. In addition, one of the rationales of this study is to gain a deeper understanding as to how this long-range π-conjugation between the electron-rich species and multiwall carbon nanotubes influences the fluorescence lifetime. All the selected molecules explored, herein, are fluorescence active. We monitored the effect of such conjugation through UV-Vis absorption spectra, fluorescence intensity, and fluorescence lifetime measurements. Through computational study, we have also attempted to understand how such conjugation influences the fluorescence lifetime and shielding efficiency in the composites. We believe that such a systematic study will help direct the research community in developing the next-generation EM shielding material.
Results and discussion
We chose three different polyaromatic molecules (anthracene (A), 9-anthracene carboxaldehyde (AC), and 9-aminoanthracene (AA)) to study how the long-range π-conjugation between these electron-rich species and the multiwall carbon nanotubes influences the fluorescence lifetime and electromagnetic shielding in the composites. The presence of different functionalities in the chosen electron-rich molecules was confirmed using spectroscopic analysis (FT-IR spectra in Fig. S1†). Here, A is the parent molecule, which has no intense peak in the FT-IR spectra due to the absence of any associated functional groups. The peak at 3046 cm−1 corresponds to the![[double bond, length as m-dash]](https://www.rsc.org/images/entities/char_e001.gif) C–H stretching frequency of electron-rich anthracene moieties, and is present in the other two molecules as well. However, for AC, the peak at 2853 cm−1 corresponds to the aldehydic –C–H stretching frequency and the peak at 1664 cm−1 corresponds to the aldehydic C
C–H stretching frequency of electron-rich anthracene moieties, and is present in the other two molecules as well. However, for AC, the peak at 2853 cm−1 corresponds to the aldehydic –C–H stretching frequency and the peak at 1664 cm−1 corresponds to the aldehydic C![[double bond, length as m-dash]](https://www.rsc.org/images/entities/char_e001.gif) O frequency. In the case of AA, the peak at 3370 cm−1 corresponds to the N–H stretching frequency.
O frequency. In the case of AA, the peak at 3370 cm−1 corresponds to the N–H stretching frequency.
All of the molecules chosen here are anthracene-based and contain three condensed six-membered aromatic rings. Thus, all molecules are enriched with an extended π-electron cloud. Similarly, due to the conjugated polycyclic structure of MWCNTs, it also has an extended π-orbital that can easily conjugate with the polyaromatic molecules via long-range π–π stacking.12–14 It has already been proven that π–π stacking is stronger than the van der Waals interactions and CH–π noncovalent interaction forces.15,16 So, it is envisaged that via π–π stacking between the anthracene-based molecules and MWCNTs, the inter-tube agglomeration of MWCNTs can be greatly suppressed.12,17,18 However, the availability of the π-electron cloud of the anthracene-based molecules is not the same in all cases studied here because of the presence of different functional end groups. In anthracene, due to the absence of any functional groups, all of the associated π-electron cloud is available for the interaction with MWCNTs. However, due to the presence of an electron-withdrawing group in AC, the availability of the π-electron cloud is less, whereas the presence of the electron-donating group in AA enhances the electron density in the π-orbital.
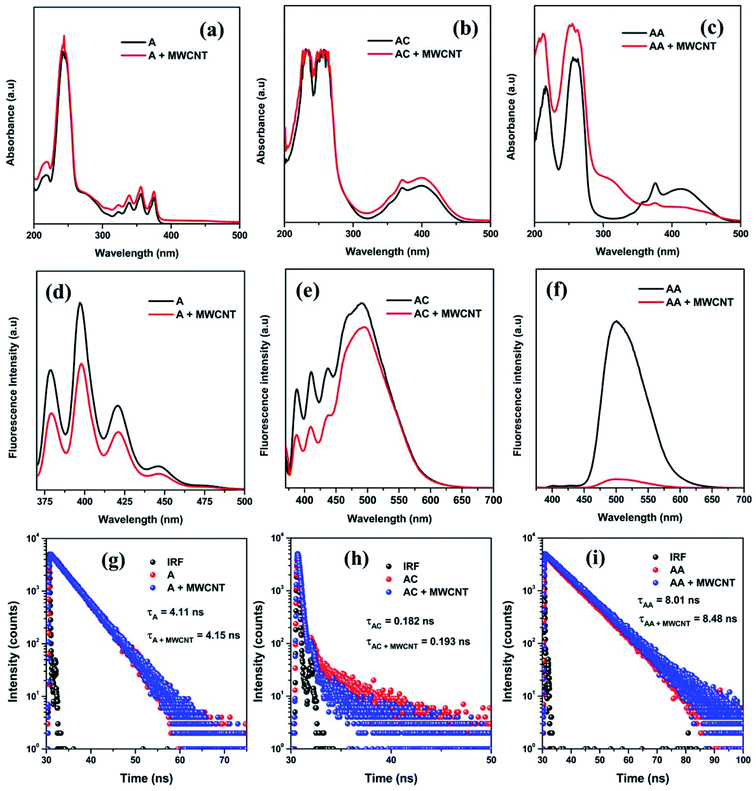
Herein, the nature and extent of the interaction between the chosen molecules and MWCNTs were studied in more detail for the first time to the best of our knowledge using two very basic spectroscopic techniques, viz., absorption and fluorescence spectroscopy. The characteristic perturbation in the UV-Vis absorption spectra of these three molecules in the absence and presence of MWCNTs clearly show the interaction between them. The band at ∼250 nm is present for all three molecules that represent the π–π* transition, and the bands at 400 nm (for AC and AA) and 350 nm (for A) represent the n–π* transition (Fig. 1a–c). All other additional peaks in <300 nm region (in the case of AC and AA) broadly represent the n–π* transition due to the interactions with heteroatoms. Now, after conjugating these species with MWCNTs, a noticeable change was observed in both bands for all molecules. In general, the absorbance (A) can be calculated by the following Beer–Lambert equation,
| A = εcl | (1) |
The interaction between the molecules and MWCNTs can be further studied by fluorescence emission spectra, as all of the molecules are fluorescence active. It is well known that fluorescence is a very inherent and sensitive property of a molecule. The fluorescence lifetime is sensitive to internal factors that are dependent on the fluorophore structure. The fluorescence lifetime is a measure of the time a fluorophore spends in the excited state before returning to the ground state by emitting a photon. The lifetimes of fluorophores generally can range from picoseconds to hundreds of nanoseconds. In all cases, the quenching in the fluorescence intensity strongly suggests the dissipation of excited state electrons towards the π–π conjugation with MWCNTs (Fig. 1d–f). However, the striking change in the fluorescence intensity of AA after conjugating with MWCNTs signifies the strongest plausible interaction and the dissipation of the maximum population of π* electrons during the emission via non-radiative pathway (Fig. 1f). Moreover, the lesser intensity in the fluorescence spectra suggests the existence of any strong interaction with external molecules and the stabilization of excited states. Now, for gathering more information about the electron transition process, the fluorescence lifetime was measured using a time-correlated single-photon counting (TCSPC) experiment. Here, we observed that all molecules have different average lifetime values (Fig. 1g–i). The average lifetime value is an intrinsic property of any molecule, and it does not depend on any other external factors (e.g., concentration, solvation). The average lifetime values of A and AA are 4.11 ns and 8.01 ns, respectively, and they were evaluated by a monoexponentially fitting factor. The average lifetime value of AC is 0.182 ns, which was evaluated by a biexponentially fitting factor. However, after successful conjugation with MWCNTs, this fluorescence lifetime was found to be increased slightly due to stabilization through an attractive interaction of the molecules with the MWCNT moiety in the excited state, and which was maximum for the AA/MWCNTs pair. So, it was clear that we successfully conjugated all molecules with MWCNTs. However, the extent of conjugation depends on their electronic structure. We found that the presence of an electron-donating group in the conjugated molecules enhanced the overall conjugation process.
The spectroscopic technique confirms the conjugation. However, to elucidate the actual configuration of such conjugation, a model computational study was performed by DFT. The Mulliken charge vector direction of the optimized structure of the anthracene-based molecules confirmed the effect of the electron-donating and withdrawing groups (Fig. 2a–c). Interestingly, after optimization, we observed that the distance between the two centers of mass for the moieties favored the long-range π conjugation process each time. However, the preferred geometrical conformation is T-shaped (Fig. 2d–f).16,19–21 In the A/MWCNT pair, the distance between the two moieties is 4.76 Å and the angle is 88°. In the AC/MWCNT pair, the distance between the two moieties is 4.82 Å and the angle is 92°. In the AA/MWCNT pair, the distance is 4.71 Å and the angle is 94°. The T-shaped conformation suggests a quadrupole/quadrupole interaction between the two moieties, where the positive quadrupole of the carbon nanotubes attracts the negative quadrupole of the anthracene-based molecules.19 The presence of an electron-donating group in the anthracene moieties significantly enhances the negative quadrupole charge, and simultaneously improves the overall interaction.
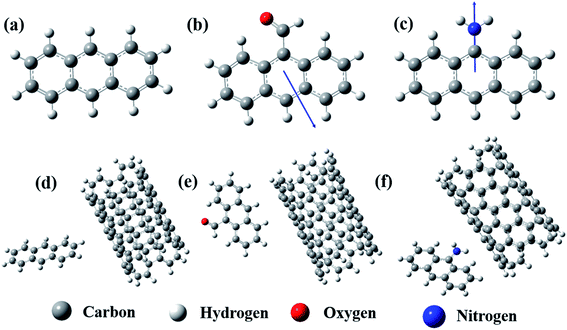 | ||
| Fig. 2 Optimized structure of (a) A, (b) AC, (c) AA, (d) A-conjugated MWCNT, (e) AC-conjugated MWCNT and (f) AA-conjugated MWCNT. | ||
The SEM images of the PC/PVDF blend system, where the PC phase was etched out to improve the contrast, clearly show the effect of such a conjugation process, which aided in the selective dispersion of MWCNT in the PVDF matrix. In Fig. 3a where the pristine MWCNTs were present, a visible agglomeration could be observed throughout the matrix due to the strong inter-tube van der Waals attractive forces. Interestingly, after the incorporation of the chemically conjugated MWCNTs, the dispersion improved significantly (Fig. 3b–d). However, such improvement in the dispersion relies upon the extent of the conjugation of MWCNTs with distinctive molecules, and the AA-conjugated MWCNTs showed the best possible dispersion. The π–π stacking between the anthracene-based molecules and MWCNTs favors the dispersion in the matrix by overcoming the inter-tube van der Waals attractive forces. The presence of strongly electrophilic F groups in PVDF also facilitates the specific interaction with the conjugated molecules. For instance, such an effect is not visible in the absence of any functional groups, as in anthracene. However, for AC and AA, the functional groups can easily interact with the strong electrophilic F groups of PVDF and orient itself with the conjugated MWCNTs. Such interaction is stronger for the AA type of molecules due to the plausible formation of H⋯F bonding. Here, we confirm the H⋯F bonding formation between AA and the matrix PVDF by a computational study, where the distance between H and F is nearly 1.85 Å (Fig. 4a).22
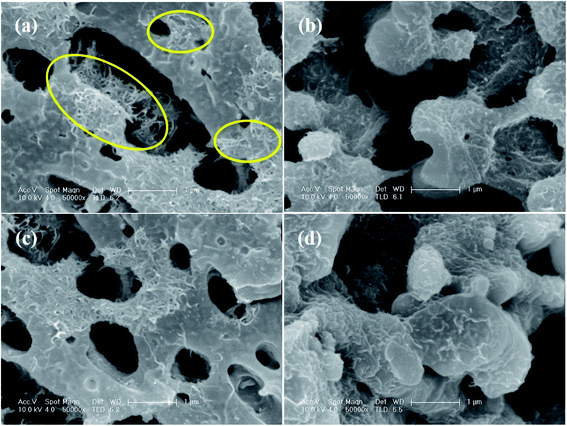 | ||
| Fig. 3 SEM micrographs of the PC/PVDF blend containing (a) MWCNT, (b) A-conjugated MWCNT, (c) AC-conjugated MWCNT, and (d) AA-conjugated MWCNT. | ||
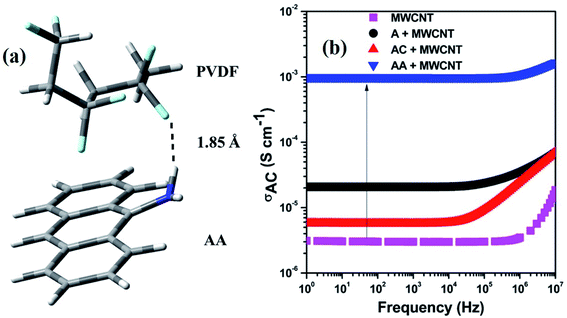 | ||
| Fig. 4 (a) Optimized structure for showing the interaction between PVDF and AA, (b) electrical conductivity plot of various composites. | ||
Furthermore, the FT-IR spectra supported the presence of such interaction between the matrix and the filler (Fig. S2†). PVDF is a semi-crystalline polymer with characteristic IR peaks at 764, 797 and 974 cm−1 corresponding to the non-polar α-crystallites and 840, 1274 cm−1 corresponding to the polar β-crystallites.23 Now, due to the interaction with the functional groups and associated MWCNTs, the orientation in the crystallites is expected, which may influence the polar crystallite contribution.24 A sharp enhancement in the peak of β-crystallites and quenching of α-crystallites were observed for the AA-conjugated MWCNTs-containing blend, suggesting the strong polar–polar interaction with the matrix. We observed that a strong H⋯F bonding was formed due to the interaction with F and H. This facilitated the generation of more β-crystallites by preferring the orientation of the PVDF crystals.
The AC electrical conductivity results further supported the observed SEM micrographs. The enhancement in the dispersion of the conducting filler facilitated the paving of a pathway for an interconnected network and the overall conductivity in the blends. It has been well reported that any noncovalent conjugation with MWCNTs helps in the de-bundling of MWCNTs. This is achieved by overcoming the inter-tube van der Waals force of attraction, which helps in dispersion. However, the chemical integrity of MWCNTs is also an important parameter for an effective charge transfer. Herein, we have chosen a noncovalent conjugation strategy in which no harsh chemical process is involved. This ensures the structural integrity of MWCNTs. We observed a gradual enhancement in the AC electrical conductivity based on the extent of conjugation between the anthracene-based molecules and MWCNTs. Finally, we observed a 3-order enhancement in conductivity after the incorporation of AA-conjugated MWCNTs (Fig. 4b). Undoubtedly, the improved dispersion enhances the overall conductivity value, but it is regulated by the overall charge-carrying mechanism. This can be assessed by the following power law equation,
| σAC = σDC + Aωn | (2) |
The shielding efficiency is the ability to attenuate incident EM waves. Herein, it was measured by utilizing the scattering parameters.27,28 This study assessed the total shielding effectiveness (SET) in the 8–12.4 and 12.4–18 GHz frequency range. Fig. 5a and b portrays the total shielding effectiveness of the prepared blends. The general trend in the shielding efficiency echoes the observed electrical conductivity data, as an effective charge transfer is key to a high shielding efficiency. As a result, we observed a maximum −25 dB total shielding efficiency for the AA-conjugated MWCNTs-containing blend. In addition, the value of the total shielding efficiency is 3.6 times higher than that for the MWCNTs-containing blend alone. However, it is important to note that a high conductivity value always enhances the reflection part of the shielding, rather than absorption. Due to the technological requirements, shielding by absorption is crucial. In this study, when we differentiated the shielding parameters, we observed that shielding by absorption was increased, despite the enhancement of the conductivity value (Fig. S3†). This drove us to take a closer look at the mechanism of shielding in more detail, and also to relate with the time-correlated single-photon counting.
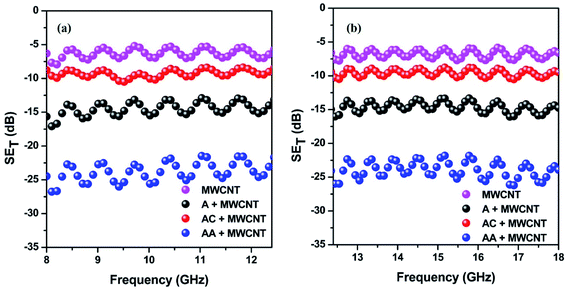 | ||
| Fig. 5 Total shielding efficiency of different blends in the (a) 8–12.4 GHz and (b) 12.4–18 GHz frequency ranges. | ||
The magnitude of shielding by reflection can be evaluated by this equation,
 | (3) |
 | (4) |
The fluorescence lifetime study reveals that there is a time lag between the excitation and recombination of electrons, and the fluorescence intensity suggests the dissipation of excited state electrons. So, during the interaction with the incident EM wave when the conducting fillers are carrying the charge particles, some portion of that charge is absorbed by the associated conjugated molecules. Now, if the recombination time is very fast, the absorbed charge particles are readily available in the ground state, and again take part in the electronic conduction process. However, for the molecules with a larger lifetime, the absorbed charged particle is trapped for a while, and has more chances to dissipate via other conjugated molecules or by heat energy. So, it is clear enough that a delay in the fluorescence lifetime enhances the associated conduction loss. As the fluorescence lifetime of the AA type of molecules is highest in this case, it results in more conduction loss in comparison with others. Additionally, the presence of an insulating polymer matrix also contributes to the conduction loss value due to its higher resistance. However, such an effect is constant here because the matrix composition is the same. Conversely, the polarization loss originates here due to the orientation of dipoles of the PVDF matrix in the presence of incident EM energies. The β-crystallites of PVDF are the main source of such dipole generation.24 As we previously discussed, the content of the β-crystallites varies with different conjugated molecules due to specific interactions with the electrophilic F groups and functional end groups. The result suggests that the AA type of molecules generates more dipole-active crystallites in PVDF, and our computational study also shows that the overall dipole moment of the optimized structure of AA and PVDF is 1.88 debye. So, it is obvious that the generated dipole-active crystallites can account for the maximization of polarization loss.
Here, the consolidated dielectric loss parameters mainly account for the dissipation of the incident EM energies. Now, this dissipated dielectric loss energy is converted into heat energy through the dielectric heating mechanism, and that can be distributed throughout the matrix.29,30 So, the total power loss factor of the incident EM energies can be calculated by the subsequent equation,
 | (5) |
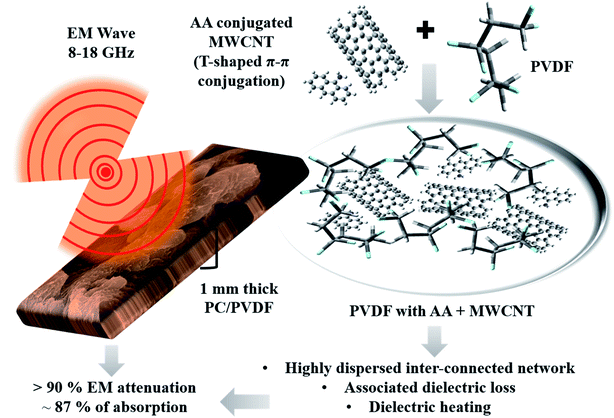 | ||
| Fig. 6 Schematic representation of the EM shielding mechanism of the AA-conjugated MWCNTs-containing PC/PVDF blend. | ||
So, this study revealed that just by physical conjugation between the electron-rich molecules and MWCNTs, the dispersion of MWCNTs in a given polymer matrix can easily be regulated. However, such dispersion solely depends on the electronic structure of the conjugated molecules. Now, this enhancement in the dispersion of fillers is beneficial for achieving a higher AC electrical conductivity and higher shielding efficiency with a high absorption value, which is practically relevant. Besides that, the conjugation mechanism via experimental and computational modelling with various functional groups has been discussed here, which also widens up the scope of this study. It can help guide researchers working in this field from both academia and industry.
Experimental
Materials
Kynar-761 PVDF was provided by Arkema. Lexan 143R PC was acquired from Sabic. Chloroform and dimethylformamide (DMF) were obtained from different viable sources. MWCNTs (diameter 9.5 nm, length 1.5 μm) were acquired from Nanocyl (NC 7000). Anthracene, 9-anthracene carboxaldehyde and 9-aminoanthracene were procured from Sigma Aldrich.Preparation of MWCNT conjugation with different molecules
Here, we prepared three different conjugated MWCNTs with three distinctive anthracene-based molecules by the following methodology. Initially, pristine MWCNTs were properly dispersed in DMF by the probe and bath sonication process. Afterwards, different anthracene-based molecules like anthracene (denoted as A), 9-anthracene carboxaldehyde (denoted as AC) and 9-aminoanthracene (denoted as AA) were added separately in a similar fashion, and all mixtures were then further sonicated for 1 h, and stirred at room temperature for the next 12 h. After that, the mixture was kept at room temperature for another 12 h for aging.Blend preparation method and compositions
All polymer blends were prepared by a typical solvent-mediated mixing-cum-casting process to limit the loss of any fillers and associated conjugated molecules. Initially, all nanomaterials (pure or conjugated) were properly dispersed and aged in DMF, as described previously. PVDF and PC (50/50 w/w) were then added to that mixture, and further sonicated and coupled with a mechanical stirrer for 2 h. Finally, the mixture was casted upon a Teflon tray and slowly heated for removal of the solvent. Obtained films were then vacuum-dried at 100 °C for 24 h. For the measurements of the conductivity and EM shielding efficiency, we used these vacuum-dried films to prepare the specifically designed samples by a lab-scale compression-molding machine operating at 200 °C. Here, all blends contained 2 wt% MWCNT and the associated conjugated molecules.Computational methodology
Computational studies were performed using the Gaussian 09 computational package. Optimization of each molecule and the conjugated molecules was carried out using density functional theory with the B3LYP hybrid functional and 6-31G basis set without any symmetry constraints.Characterization
Morphological analysis of the blends was evaluated by Sirion XL30 FEG SEM. UV-Vis absorption spectra were recorded by a Shimadzu UV-1800 spectrophotometer in the 200–800 nm region. A Hitachi F-2500 spectrofluorimeter was used for fluorescence intensity measurements, where the band pass was 2.5 nm, the photomultiplier tube voltage was 400 V, and the scan speed was 5 nm s−1. We optimized the excitation point and excited A, AC, and AA at 370 nm, 380 nm, and 390 nm, respectively. Fluorescence lifetimes were measured by a time-correlated single-photon counting (TCSPC) Horiba DeltaFlex instrument. A 375 nm nano-LED was used as a light source for the experiment, where the pulse repetitions were set to 1 MHz. The IBH software was used for the decay data analysis, and the χ2 value is in the range between 0.98 to 1.1. An Alpha-N Analyser, (Novocontrol) was utilized for the electrical conductivity measurements at room temperature. The electromagnetic shielding efficiency was assessed by VNA (Anritsu Shockline) and associated waveguide with 8–12.4 GHz and 12–18 GHz frequency ranges.Conflicts of interest
The authors declare no competing financial interest.Acknowledgements
The authors gratefully acknowledge the financial support from DST-SERB, India (EMR/2016/001230).References
- D. Chung, Carbon, 2001, 39, 279–285 CrossRef CAS.
- S. Biswas, S. S. Panja and S. Bose, J. Mater. Chem. C, 2018, 6, 3120–3142 RSC.
- M. H. Al-Saleh and U. Sundararaj, Carbon, 2009, 47, 1738–1746 CrossRef CAS.
- S. Biswas, I. Arief, S. S. Panja and S. Bose, ACS Appl. Mater. Interfaces, 2017, 9, 3030–3039 CrossRef CAS PubMed.
- S. Geetha, K. Satheesh Kumar, C. R. Rao, M. Vijayan and D. Trivedi, J. Appl. Polym. Sci., 2009, 112, 2073–2086 CrossRef CAS.
- J.-M. Thomassin, C. Jerome, T. Pardoen, C. Bailly, I. Huynen and C. Detrembleur, Mater. Sci. Eng., R, 2013, 74, 211–232 CrossRef.
- S. Biswas, S. S. Panja and S. Bose, J. Phys. Chem. C, 2018, 122, 19425–19437 CrossRef CAS.
- M. Arjmand, M. Mahmoodi, G. A. Gelves, S. Park and U. Sundararaj, Carbon, 2011, 49, 3430–3440 CrossRef CAS.
- M. Arjmand, K. Chizari, B. Krause, P. Pötschke and U. Sundararaj, Carbon, 2016, 98, 358–372 CrossRef CAS.
- A. Gebrekrstos, S. Biswas, A. V. Menon, G. Madras, P. Pötschke and S. Bose, Composites, Part B, 2019, 166, 749–757 CrossRef CAS.
- S. P. Pawar, S. Biswas, G. P. Kar and S. Bose, Polymer, 2016, 84, 398–419 CrossRef CAS.
- E. M. Pérez and N. Martín, Chem. Soc. Rev., 2015, 44, 6425–6433 RSC.
- C. R. Martinez and B. L. Iverson, Chem. Sci., 2012, 3, 2191–2201 RSC.
- S. Grimme, Angew. Chem., Int. Ed., 2008, 47, 3430–3434 CrossRef CAS PubMed.
- S. S. Panja and T. Chakraborty, J. Chem. Phys., 2003, 118, 6200–6204 CrossRef CAS.
- T. Kar, H. F. Bettinger, S. Scheiner and A. K. Roy, J. Phys. Chem. C, 2008, 112, 20070–20075 CrossRef CAS.
- R. W. Friddle, M. C. Lemieux, G. Cicero, A. B. Artyukhin, V. V. Tsukruk, J. C. Grossman, G. Galli and A. Noy, Nat. Nanotechnol., 2007, 2, 692 CrossRef CAS PubMed.
- R. J. Chen, Y. Zhang, D. Wang and H. Dai, J. Am. Chem. Soc., 2001, 123, 3838–3839 CrossRef CAS PubMed.
- F. Tournus, S. Latil, M. Heggie and J.-C. Charlier, Phys. Rev. B: Condens. Matter Mater. Phys., 2005, 72, 075431 CrossRef.
- J. Lu, S. Nagase, X. Zhang, D. Wang, M. Ni, Y. Maeda, T. Wakahara, T. Nakahodo, T. Tsuchiya and T. Akasaka, J. Am. Chem. Soc., 2006, 128, 5114–5118 CrossRef CAS PubMed.
- J. Zhao, J. P. Lu, J. Han and C.-K. Yang, Appl. Phys. Lett., 2003, 82, 3746–3748 CrossRef CAS.
- C. Tuma, A. D. Boese and N. C. Handy, Phys. Chem. Chem. Phys., 1999, 1, 3939–3947 RSC.
- S. Wolff, F. Jirasek, S. Beuermann and M. Türk, RSC Adv., 2015, 5, 66644–66649 RSC.
- J.-K. Yuan, S.-H. Yao, Z.-M. Dang, A. Sylvestre, M. Genestoux and J. Bai, J. Phys. Chem. C, 2011, 115, 5515–5521 CrossRef CAS.
- K. Ngai, A. Jonscher and C. White, Nature, 1979, 277, 185 CrossRef CAS.
- S. Biswas, G. P. Kar and S. Bose, ACS Appl. Mater. Interfaces, 2015, 7, 25448–25463 CrossRef CAS PubMed.
- S. Biswas, I. Arief, S. S. Panja and S. Bose, Mater. Chem. Front., 2017, 1, 2574–2589 RSC.
- S. Ghosh, S. Mondal, S. Ganguly, S. Remanan, N. Singha and N. C. Das, Fibers Polym., 2018, 19, 1064–1073 CrossRef CAS.
- J. Sun, W. Wang and Q. Yue, Materials, 2016, 9, 231 CrossRef PubMed.
- B. Wen, M.-S. Cao, Z.-L. Hou, W.-L. Song, L. Zhang, M.-M. Lu, H.-B. Jin, X.-Y. Fang, W.-Z. Wang and J. Yuan, Carbon, 2013, 65, 124–139 CrossRef CAS.
- S. Biswas, S. Dutta, S. S. Panja and S. Bose, J. Phys. Chem. C, 2019, 123, 17136–17147 CrossRef CAS.
Footnote |
| † Electronic supplementary information (ESI) available: FT-IR of different molecules, FT-IR of different PC/PVDF blends, shielding of the absorption of various blends, dielectric loss of various blends, table for the power-law fitting exponents, and table for the total shielding efficiency of various blends with the fluorescence life-time value. See DOI: 10.1039/d0na00444h |
| This journal is © The Royal Society of Chemistry 2020 |

