
 Open Access Article
 This Open Access Article is licensed under a Creative Commons Attribution-Non Commercial 3.0 Unported Licence
A few-layer graphene for advanced composite PVDF membranes dedicated to water desalination: a comparative study
M.
Frappa
 a,
A. E.
Del Rio Castillo
b,
F.
Macedonio
*a,
A.
Politano
bc,
E.
Drioli
ae,
F.
Bonaccorso
*bd,
V.
Pellegrini
bd and
A.
Gugliuzza
*a
a,
A. E.
Del Rio Castillo
b,
F.
Macedonio
*a,
A.
Politano
bc,
E.
Drioli
ae,
F.
Bonaccorso
*bd,
V.
Pellegrini
bd and
A.
Gugliuzza
*a
aInstitute on Membrane Technology-National Research Council (CNR-ITM), Via Pietro Bucci 17C, Rende (CS) 87036, Italy. E-mail: a.gugliuzza@itm.cnr.it; f.macedonio@itm.cnr.it
bGraphene Labs, Fondazione Istituto Italiano di Tecnologia, Via Morego, 3016163 Genova, Italy. E-mail: Francesco.Bonaccorso@iit.it
cDepartment of Physical and Chemical Sciences, University of L'Aquila, Via Vetoio, 67100 L'Aquila, AQ, Italy
dBedimensional s.p.a, Via Albisola 121, 16163 Genova, Italy
eDepartment of Environmental and Chemical Engineering, University of Calabria, Via P. Bucci, 87036 Rende, CS, Italy
First published on 17th August 2020
Abstract
Membrane distillation is envisaged to be a promising best practice to recover freshwater from seawater with the prospect of building low energy-consuming devices powered by natural and renewable energy sources in remote and less accessible areas. Moreover, there is an additional benefit of integrating this green technology with other well-established operations dedicated to desalination. Today, the development of membrane distillation depends on the productivity–efficiency ratio on a large scale. Despite hydrophobic commercial membranes being widely used, no membrane with suitable morphological and chemical feature is readily available in the market. Thus, there is a real need to identify best practices for developing new efficient membranes for more productive and eco-sustainable membrane distillation devices. Here, we propose engineered few-layer graphene membranes, showing enhanced trans-membrane fluxes and total barrier action against NaCl ions. The obtained performances are linked with filling polymeric membranes with few-layer graphene of 490 nm in lateral size, produced by the wet-jet milling technology. The experimental evidence, together with comparative analyses, confirmed that the use of more largely sized few-layer graphene leads to superior productivity related efficiency trade-off for the membrane distillation process. Herein, it was demonstrated that the quality of exfoliation is a crucial factor for addressing the few-layer graphene supporting the separation capability of the host membranes designed for water desalination.
1. Introduction
Water scarcity worldwide is a well-known matter nowadays.1 Demographic expansions as well as industrial and agricultural activities are expected to intensify water demand in coming years with conceivable consequences for humanity and ecosystem survival. Considering that ocean represents ∼97% of planet's water, covering a volume of 1.4 × 10⁹ km3,2,3 it represents the most precious natural source of freshwater according to eco-sustainable practices, including membrane operations.4 Currently, reverse osmosis is one of the most practical routes to recover freshwater from seawater.5 However, for large seawater reverse osmosis (SWRO) desalination plants, an energy consumption ranging from 3 to 4 kW h m−3 is traditionally estimated, with a unit water cost of ∼$0.5 m−3 and an overall recovery factor of 50–80%, based on the ratio between the permeate quantity and saltwater.6,7 This data clearly evidences prospects of circular economy, the need for development of new eco-sustainable and more productive easy green approaches, and if need be to integrate more traditional processes. Membrane distillation (MD) is an advanced eco-friendly technology dedicated to water desalination through hybrid thermal/membrane process.8–10 It is a flexible and sustainable technique also employed in wastewater treatment, CO2 control and concentration of non-volatile compounds, such as salts and sugars in fruit juices, as well as in the blood treatment.11–13 Concerning water desalination, the MD technology enables the production of desalted water with a recovery factor of more than 70%.7,8 Solar energy or waste heat can be directly used in MD thermally driven processes.11 So, self-powered systems can be realized and would be technically feasible and compatible with the transient nature of the energy source.12Traditionally, MD uses hydrophobic porous membranes as physical barriers between two liquid–liquid or liquid–gas phases, establishing a durable vapour–liquid interface at the entrance of every single pore against wetting.13–15 Among the possible configurations, thermally driven MD in the direct contact mode (DCMD) is one of the most simple. In this case, the salt solution is heated (feed side) to induce water evaporation, with related diffusion through the pores of the membrane and condensation on the opposite cooled side (permeate side), while the salts are collected in the retentate side. The driving force of the MD process is the vapour pressure gradient induced, in this case, by the difference in temperature applied across the membrane.15 Currently, the major limitations for implementing this technology at the industrial level are the low trans-membrane fluxes and partial resistance to wetting and thermal polarization events.9,16 It is of paramount importance, therefore, to identify new strategies to increase the long-term productivity of MD operations and to preserve high-quality standards for the production of freshwater. The design of functional membranes17–24 is envisioned to be a practical route for developing MD operations through well-addressed structure–chemistry relationships, which could ensure large mass transfer, stable waterproofness, resistance to scaling and thermal polarization as well as mechanical stability.8,9,13–15 One way to improve the productivity and efficiency of the process could be through assisted water vapour diffusion and by adjusting the resistance to wetting and thermal polarization.24 The literature refers to efforts using low thermal conductive and superhydrophobic omniphobic membranes as well as dual layer membranes for high-performing MD applications.25–27 Clays, nanocomposites, carbon nanotubes and nanoparticles are frequently used as fillers to improve anti-wetting properties and increase water vapour transport.28–33 Recently, graphene platelets (GNPs), graphene oxide (GO) and reduced graphene oxide (rGO), have been regarded as interesting materials to increase the productivity of membranes34–41 for water desalination purposes. Defective graphene and derivatives have been often proposed for membrane distillation operations due to their attractive hydrophobic and anti-wetting nature, anti-fouling properties and selective sorption of water vapours34–47. However, a lot of attention has been paid to identify a suitable polymer–nanofiller ratio for achieving good performance; whilst the morphological and chemical features of the nanofiller have been hardly considered in the final outcome of the process. The objective of this work was therefore to explore whether the exfoliation quality of graphene could enhance the final performance of membranes dedicated to MD operations. More specifically, the intent was to produce a large number of few-layers graphene with a lateral size larger than that obtained traditionally. The exfoliation procedure used in this work was based on an advanced technique, namely wet-jet milling (MJW).48 Functional PVDF membranes were therefore enriched with few-layer graphene (FLG) with a thickness of ∼1.5 nm and a lateral size of 490 nm. A comparative study was performed with graphene flakes (GPNs) exfoliated by traditional techniques, such as the liquid-phase exfoliation (LPE) based on ultrasonic waves (UW).35 The GPNs exhibited a thickness of ∼1.8 nm but a lateral size of 120 nm. This study assessed how defective few-layers graphene with a larger surface area could provide a higher interface to the penetrant during its diffusion, thereby resulting in an enhanced ability of the membrane to allow water vapour to permeate while blocking the passage of NaCl ions.
It was, therefore, essential to consider that the desired properties of a nanocomposite membrane can be amplified on the macroscopic scale if the quality of the filler is morphologically and chemically well addressed. The target of a ‘uniform nanofiller’ is hard to achieve and is often lost when commercial and tailor-made graphene is chosen, usually due to contamination by chemicals used in the production process and the formation of heterogeneous mixtures of single-, double- and multi-layered flakes as well as a large amount of un-exfoliated layered material.49 The exfoliation yield using UW, expressed as the ratio of masses between the starting material and the final product, is well below 10% and the concentration of the solute in the solvent hardly exceeds 1 g L−1.50 Instead, the WJM technique provides the desired thickness and lateral size of graphene nanofillers on demand.48,51 It has been demonstrated that the pulverization or colloidal homogenization of bulk nanomaterials can be performed according to the WJM technique.51,52 The exfoliation of layered materials with desired structural features can reach production rates of up to 2 L h−1 at a concentration of 10 g L−1, with subsequent prospects for the scaling-up of layered materials on an industrial level.51–53 In this logic, formulations of few-layer graphene (FLG) with a larger size were prepared at two different concentrations (0.65 and 10 g L−1) in N-methyl-2-pyrrolidone (NMP). Successively, a fluorinated polymer, such as polyvinylidene fluoride (PVDF), was added to the dispersions with a defined composition of few-layer graphene with a larger lateral size. Hydrophobic porous membranes were then prepared from each single mixture using a well-scaled dry–wet phase inversion procedure.54,55 The final concentrations of FLG in the dried membranes were 0.5% and 7% with respect to the polymer. Structure–property relationships have been identified and MD experiments have been implemented under different working conditions. MD tests revealed a capacity of these new tailored membranes to produce a flux up to 15.9 g L−1 h−1 at 55 °C and under a flow rate of 100 mL min−1. An increase in mass transfer of 38% was estimated in comparison to membranes functionalized with GPN34 flakes at an equal concentration. A 99.7% increase in flux resulted compared to a pristine PVDF membrane under the same conditions (FPVDF = 7.94 L m−2 h−1). A further increase in the flux of up to 28.4 L m−2 h−1 was achieved for the novel nanocomposite membranes when operated at 60 °C and under a flow rate of 400 mL min−1. Full selectivity was also estimated for this kind of functional membranes, resulting in a rejection of 100% against a value of 99.90–99.99% estimated for pristine and other tailor-made membranes. Moreover, the experimental findings provided useful insights about the importance of confining low amounts of large-sized graphene in membranes in order to limit undesired thermal polarization events.
The results achieved within the frame of this work are interesting and helpful for researchers to look at the design of advanced classes of nanocomposite matrixes based on graphene with a well-addressed morphology for superior water desalination.
2. Result and discussion
2.1 Exfoliated graphene quality
Graphene-based dispersions were produced via WJM according to the procedure detailed in ref. 52. Briefly, graphite powder was dispersed in NMP, in a mass ratio of 1![[thin space (1/6-em)]](https://www.rsc.org/images/entities/char_2009.gif) :100, and a successive step involving exfoliation of the dispersed graphene flakes occurred when the mixtures were exposed to hydrodynamic forces, i.e. high shear rates (108 s−1) and cavitation, produced through high-pressure (250 MPa) compression of the dispersant fluid phase.51,52 Subsequently, the samples were cooled down to 4 °C using a chiller. The lateral size and thickness of the flakes had modes at 490 nm and ∼1.5 nm, respectively (Fig. 1). The obtained results showed an improvement in the flake size compared to from other techniques, e.g. exfoliation by UW,35,48 in which, usually, the lateral size mode of the exfoliated flakes is ∼100 nm, while the thickness is similar to that obtained by WJM.51,52 Exfoliation control experiments were carried out using UW, see methods section for further information. The flakes' size distribution was in agreement with the reported data, i.e. a lateral size and thickness mode of 120 and 1.8 nm (Fig. 1). Raman spectroscopy was carried out to analyse the quality of the exfoliated flakes, in terms of defectiveness, e.g. carbon vacancies, the addition of functional groups or doping.56,57 The typical spectrum of graphitic materials consists of three main bands. The G band is positioned at ∼1585 cm−1 and corresponds to the E2g phonon vibrational mode at the Brillouin zone centre.58,59 The D band is associated to the breaking of the structural symmetry of the carbon ring.57 The 2D band is centred at ∼2680 cm−1 (for an excitation wavelength of 514.5 nm in the case of single-layer graphene).54 In the cases of FLG and multi-layer graphene, the 2D peak is a superposition of multiple sub-components, with the main ones being the 2D1 and 2D2 sub-bands.60 For graphite, the intensity of the 2D2 band is roughly twice the 2D1 band,50 while for mechanically exfoliated single-layer graphene (SLG), the 2D band is a single and sharp peak, which is ∼4 times more intense than the G peak.57Fig. 1g shows, in blue colour, the typical spectra of the FLG flakes exfoliated by LPE via UW58 and in red the spectra of FLG exfoliated via WJM. For comparison, the spectrum of graphite was plotted in black. It is noteworthy that there was an increase in the D band and change in the shape of the 2D band of the FLG spectrum compared to the graphite one. The statistical analysis of the intensity of the D band and the full width at half maximum of the G band, Fig. 1h, showed no correlation between both parameters for both samples, indicating that the defects were due to the edges of sub-micron flakes and not to structural or in-plane defects. The thickness or number of layers constituting a flake can also be estimated by Raman spectroscopy.
:100, and a successive step involving exfoliation of the dispersed graphene flakes occurred when the mixtures were exposed to hydrodynamic forces, i.e. high shear rates (108 s−1) and cavitation, produced through high-pressure (250 MPa) compression of the dispersant fluid phase.51,52 Subsequently, the samples were cooled down to 4 °C using a chiller. The lateral size and thickness of the flakes had modes at 490 nm and ∼1.5 nm, respectively (Fig. 1). The obtained results showed an improvement in the flake size compared to from other techniques, e.g. exfoliation by UW,35,48 in which, usually, the lateral size mode of the exfoliated flakes is ∼100 nm, while the thickness is similar to that obtained by WJM.51,52 Exfoliation control experiments were carried out using UW, see methods section for further information. The flakes' size distribution was in agreement with the reported data, i.e. a lateral size and thickness mode of 120 and 1.8 nm (Fig. 1). Raman spectroscopy was carried out to analyse the quality of the exfoliated flakes, in terms of defectiveness, e.g. carbon vacancies, the addition of functional groups or doping.56,57 The typical spectrum of graphitic materials consists of three main bands. The G band is positioned at ∼1585 cm−1 and corresponds to the E2g phonon vibrational mode at the Brillouin zone centre.58,59 The D band is associated to the breaking of the structural symmetry of the carbon ring.57 The 2D band is centred at ∼2680 cm−1 (for an excitation wavelength of 514.5 nm in the case of single-layer graphene).54 In the cases of FLG and multi-layer graphene, the 2D peak is a superposition of multiple sub-components, with the main ones being the 2D1 and 2D2 sub-bands.60 For graphite, the intensity of the 2D2 band is roughly twice the 2D1 band,50 while for mechanically exfoliated single-layer graphene (SLG), the 2D band is a single and sharp peak, which is ∼4 times more intense than the G peak.57Fig. 1g shows, in blue colour, the typical spectra of the FLG flakes exfoliated by LPE via UW58 and in red the spectra of FLG exfoliated via WJM. For comparison, the spectrum of graphite was plotted in black. It is noteworthy that there was an increase in the D band and change in the shape of the 2D band of the FLG spectrum compared to the graphite one. The statistical analysis of the intensity of the D band and the full width at half maximum of the G band, Fig. 1h, showed no correlation between both parameters for both samples, indicating that the defects were due to the edges of sub-micron flakes and not to structural or in-plane defects. The thickness or number of layers constituting a flake can also be estimated by Raman spectroscopy.
 | ||
| Fig. 1 Characterisation of the graphite exfoliation using the wet-jet milling process. (a and b) TEM images of selected flakes obtained via WJM and UW, respectively. (c) Statistical lateral size distribution of exfoliated flakes, in red the WJM and in blue the UW. (d and e) AFM images of exfoliated flakes obtained via WJM and UW, respectively. (f) Statistical thickness distribution of exfoliated flakes, in red WJM and in blue UW. (g) Typical Raman spectrum of FLG (in red and blue) and graphite (in black). The 2D sub-bands are also plotted, in ochre and green. (h) I(D)/I(G) vs. FWHM(G) and (i) normalised intensities of the 2D sub-bands, I(2D1) vs. I(2D2). | ||
Fig. 1i shows the statistical distribution of the normalised intensities of the sub-components of the 2D band, in which the line represents the condition of 4–6 graphene layer flakes, [I(2D1)/I(G) = I(2D2)/I(G)].61–63 The points below the line [I(2D1)/I(G) < I(2D2)/I(G)] are considered graphitic flakes, while the ones above the line [I(2D1)/I(G) > I(2D2)/I(G)] are considered FLG and SLG.64–67 For comparison reasons, the subcomponents of the 2D band of graphite were also plotted in black, fulfilling, as expected, the condition I(2D1)/I(G) < I(2D2)/I(G). Contrarily, the exfoliated samples corroborate previously reported results of graphite exfoliation using the WJM and UW approaches, in which the presence of FLG – [I(2D1)/I(G) > I(2D2)/I(G)] – was larger than the graphitic points.67
X-ray photoelectron spectroscopy (XPS) analysis revealed a slight oxidation for both the FLG-WJM and FLG-UW samples with a predominance for the first ones [O 1s: 1.2% (WJM) vs 0.8% (UW); N 1s: 0.3% (WJM) vs 0.5% (UW); C 1s: 98.5% (WJM) vs 98.7% (UW)].
2.2 Preparation and characterization of the engineered membranes
Two dispersions containing 0.65 g L−1 and 10 g L−1 of FLG, exfoliated via WJM, were added to PVDF under controlled thermal conditions.51 After mechanical stirring for 24 h, the mixtures were cast and coagulated in a soft bath containing 2-propanol (Fig. 2a and b). In this way, phase separation was induced and porous membranes were formed.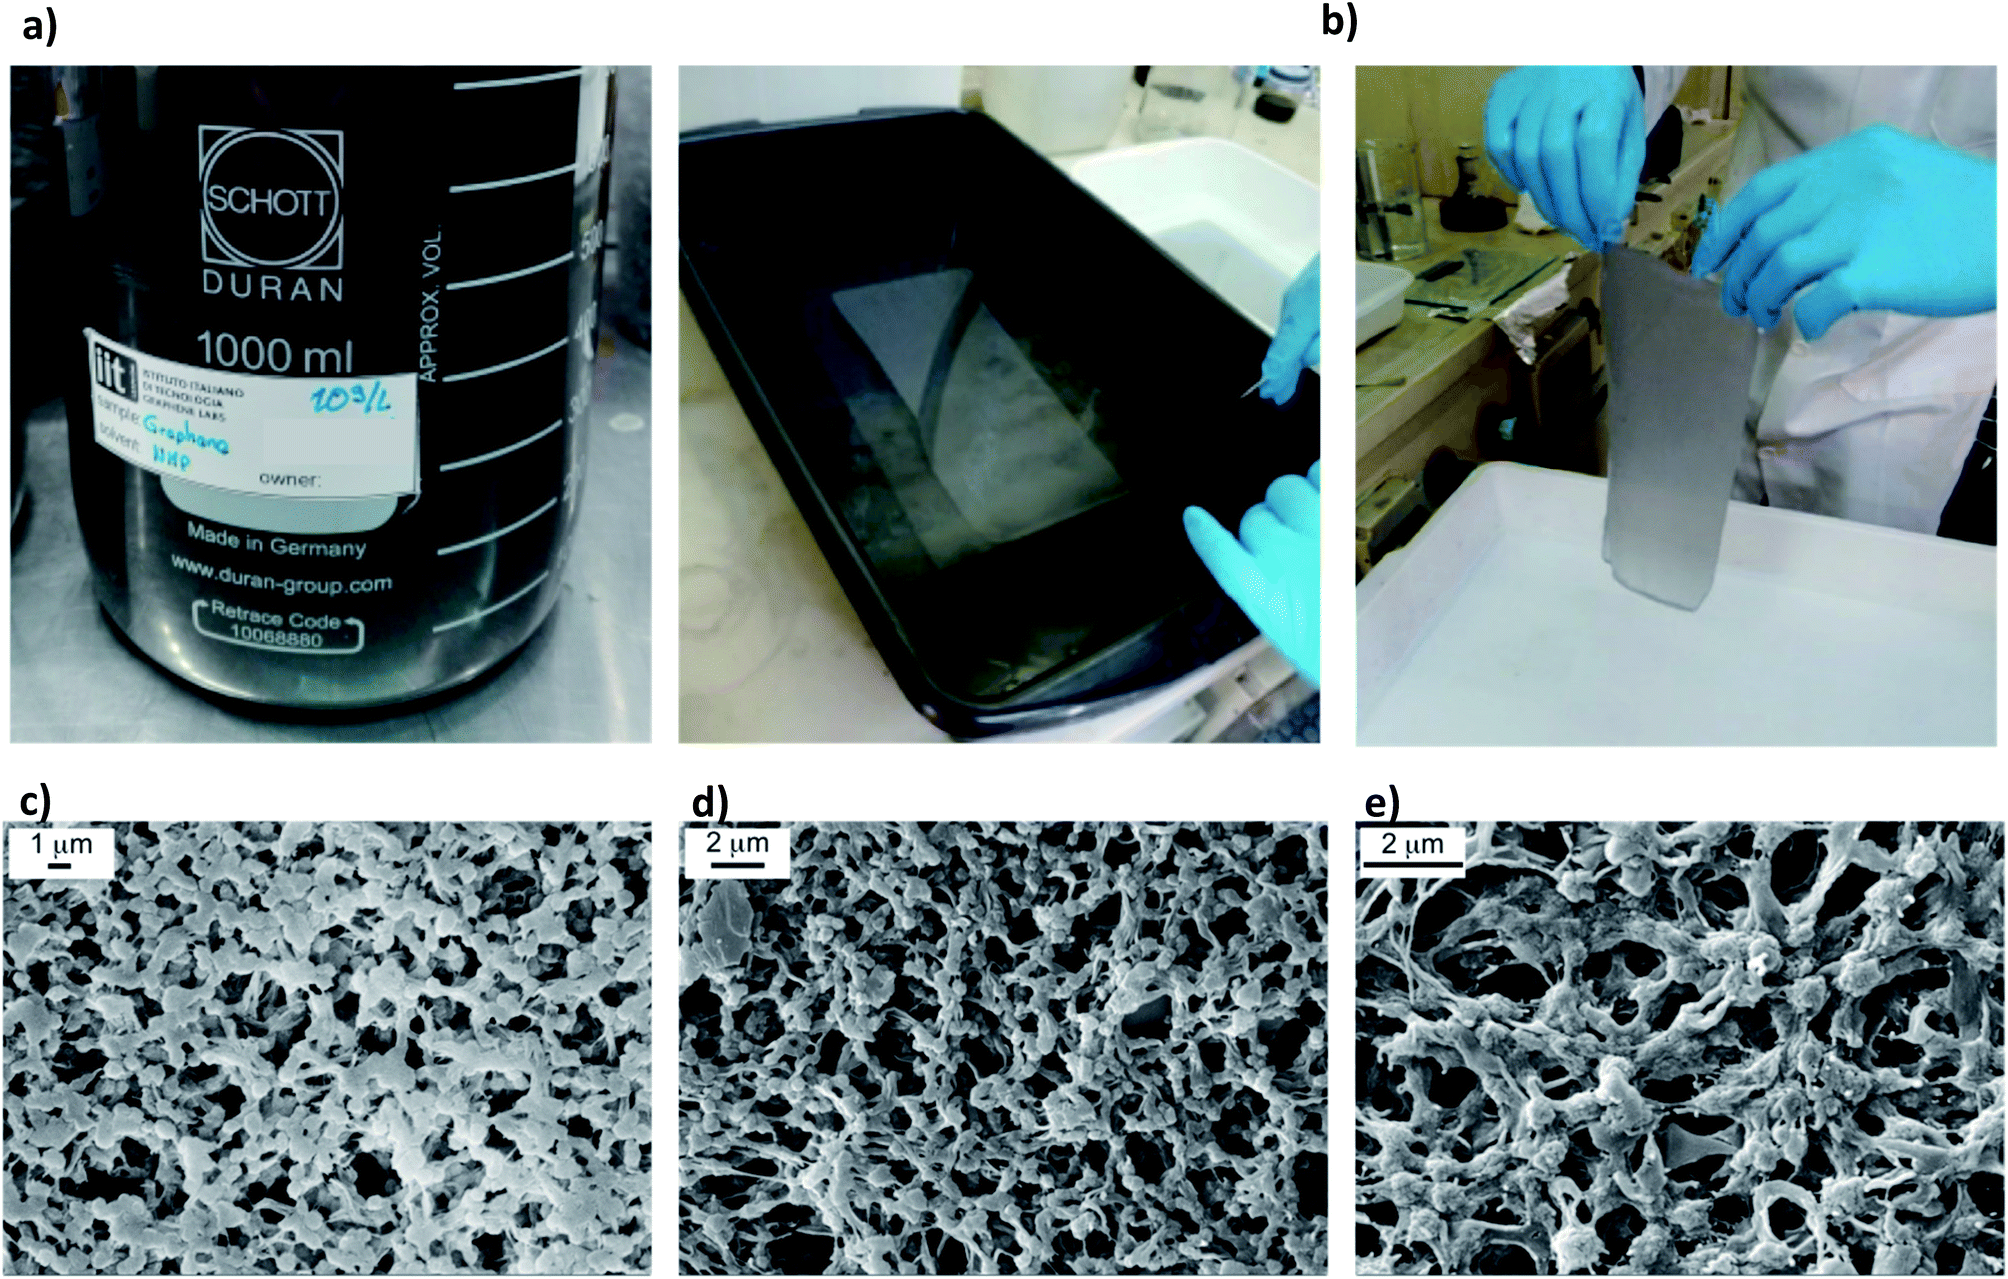 | ||
| Fig. 2 FLG dispersion (a) and membranes preparation via the dry–wet phase inversion method (b). SEM images collected on the top surface of the pristine PVDF (c) FLG-WJM(0.65) (d) FLG-WJM(10) (e). | ||
The SEM micrographs showed the spherulitic-like morphology of the polymer network and FLG flakes randomly entrapped in the matrix (Fig. 2c and d). The final concentrations of FLG in the dried systems were 0.5% and 7.0% with respect to the amount of polymer used. More technical details are reported in the Materials and methods section.
The membranes enriched with FLG exhibited an increase in the resistance to break with enhanced elastic deformation compared to the pristine PVDF membranes (Fig. 3). This property is a fundamental requisite for membrane durability and processing.11,13,52 The mechanical performance of the FLG-WJM membranes was also evaluated in comparison to that of membranes functionalised with GPNs – exfoliated via traditional UW – at a comparable concentration of nanofiller (0.5 and 10.0 wt%, respectively).
 | ||
| Fig. 3 Elongation at break (a) and Young modulus (b) estimated for the pristine PVDF membranes and FLG-WJM (0.5% and 7.0% derived from dispersions at 0.65 and 10 g L−1, in red) and GPNs-UW membranes (0.5% and 5%, in blue). | ||
Fig. 3a shows that the inclusion of FLG (0.65 g L−1) exfoliated via WJM (FLG-WJM) into the PVDF matrix improved the resistance at break by up to 175% compared to the pristine membrane (PVDF); whereas, the resistance at the break increased by 166% for the nanocomposite membranes prepared with GPNs-UW at the same concentration. Also, when the graphene percentage in the WJM membranes was increased up to 7.0% (from the FLG-WJM dispersion at 10 g L−1) an improvement of 38% was obtained. Instead, a drastic reduction in the elongation at break (−73%) was estimated for GPNs-UW at 10% nanofiller (Fig. 3a). The largest size of FLG improved the elastic behaviour of the composite membranes, which is in full agreement with the literature.68–70 The enhanced mechanical resistance of the WJM membranes was further confirmed by the trend for the Young modulus, which appeared to be more contained for FLG flakes embedded in the polymer matrix (Fig. 3b).
To examine the effect of the morphological features on the mass transfer, it is relevant to note that the membranes prepared from FLG dispersions at 0.65 g L−1 had the smallest pore size – 0.24 ± 0.05 μm against a bubble point diameter (dp) of 0.43 ± 0.01 μm – and overall porosity (ε) of 56 ± 7% (Table 1). Whereas, when 10 g L−1 of filler in the dispersion was used, the pore size increased to 0.43 ± 0.01 μm with an overall porosity of 58 ± 3%. For control reasons, the pore size of the pristine PVDF membranes was also measured, and was found to be compareable to that of FLG-WJM(10) (0.48 ± 0.09 μm). A higher overall porosity of 63 ± 5% was also estimated for the pristine membrane. Differently, the pristine PVDF membrane exhibited a slightly lower thickness compared to those measured for FLG-WJM(0.65) and FLG-WJM(10).
| Membrane | Pore size (μm) | Bubble point diameter (μm) | Porosity (%) | Thickness (μm) |
|---|---|---|---|---|
| PVDF | 0.48 ± 0.09 | 0.73 ± 0.05 | 63 ± 5 | 57 ± 2 |
| FLG-WJM(0.65) | 0.24 ± 0.05 | 0.43 ± 0.01 | 56 ± 7 | 62 ± 3 |
| FLG-WJM(10) | 0.43 ± 0.01 | 0.83 ± 0.08 | 58 ± 3 | 63 ± 3 |
When an inert gas, i.e. nitrogen, was fluxed through the membranes, a transport dependence on the pore size was detected as a consequence of the different resistance opposed to the mass transfer. In fact, Fig. 4a shows how the pristine PVDF membranes permeated similarly to the FLG-WJM(10) but much more than the FLG-WJM(0.65) ones. A different behaviour was instead observed when water vapour was fluxed through the membranes (Fig. 4b). In this case, water vapour permeated at 8.0, 6.7 and 3.7 L m−2 h−1 for the FLG-WJM(0.65), PVDF and FLG-WJM(10) membranes, respectively. For the latter, the lowering in the flux was also ascribed to the effect of a minor driving force; that is, a lower difference in the vapour partial pressure (ΔP) across the membrane. However, it was interesting to observe the inversion of water vapour permeation between PVDF and FLG-WJM(0.65) independently of the driving force applied across the membranes. The PVDF membrane allowed less water vapour to permeate than the FLG-WJM(0.65) membrane, although it was operated under a higher driving force. A similar behaviour was recently observed for membranes based on GPNs produced by UW at a comparable concentration of nanofiller.35
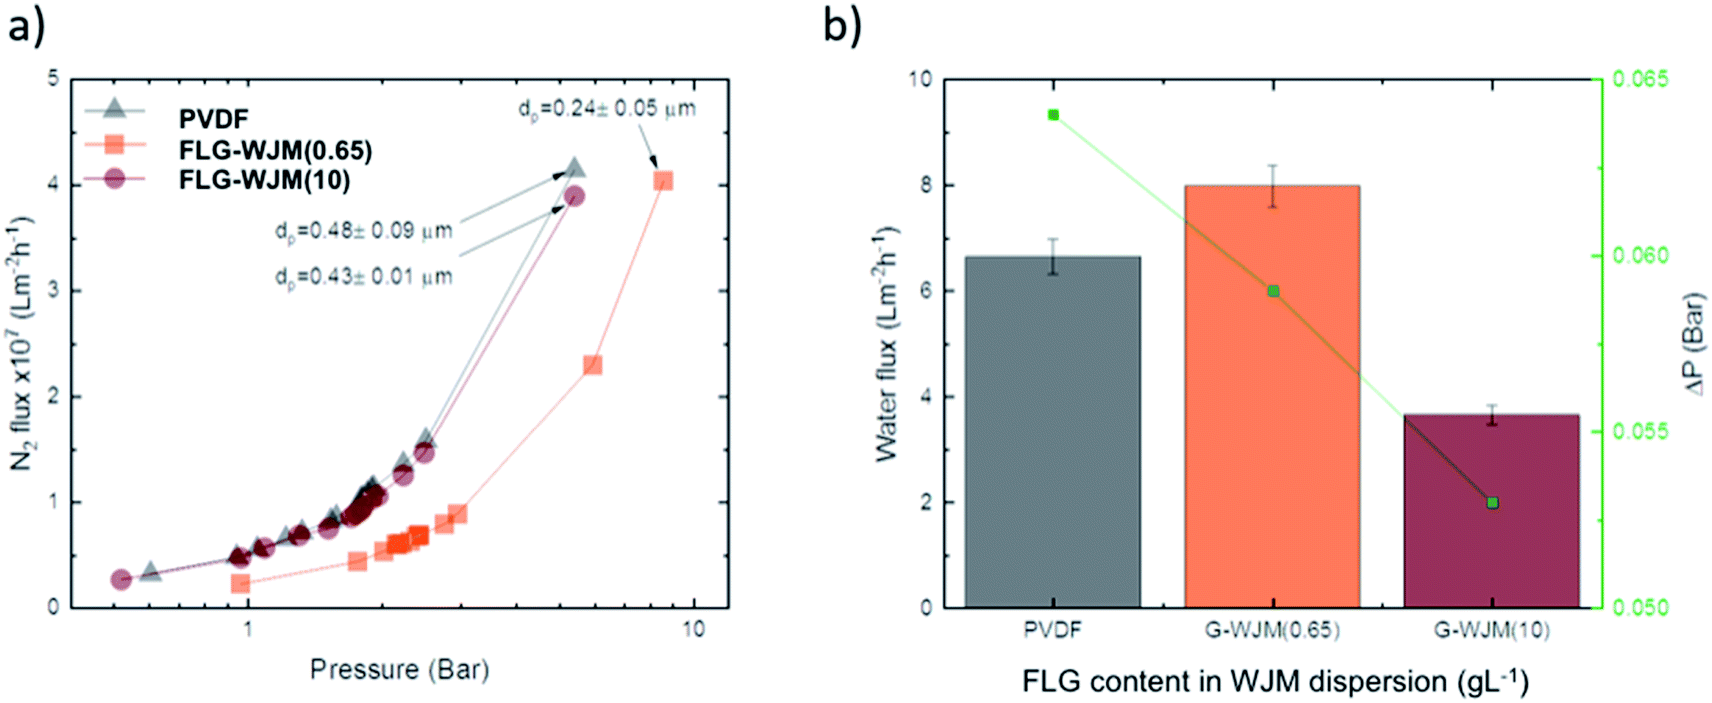 | ||
| Fig. 4 Nitrogen flux vs. pressure at 20 °C (a) and water flux at 40 °C (b) estimated for pristine and nanocomposite FLG-WJM membranes prepared from WJM dispersions at 0.65 and 10 g L−1, respectively. | ||
2.3 Membrane distillation tests
All membranes were tested in direct contact mode by using NaCl solutions at different concentrations: 0.6, 2.0 to 4.0 M. Fig. 5a shows the flux measured through the FLG-WJM and pristine PVDF membranes as a function of the temperature. In this case, NaCl 0.6 M was used as the feed solution – synthetic seawater. A general increase in the flux was observed with temperature, whereas a higher mass transfer was detected for the membranes filled with FLG following the sequence FLG-WJM(0.65) > FLG-WJM(10) > pristine PVDF. Considering that the membranes exhibited a more or less comparable porosity and thickness but a smaller mean pore size for the FLG-WJM(0.65) membrane, it is reasonable to suppose an involvement of the nanofiller in the mass transfer through the membranes.35,45,71Table 2 shows the MD transport coefficients (B) calculated for the two FLG-WJM membranes. In both cases, the trend fluctuated independently of the difference in the partial pressure applied across the membranes. This behaviour is in agreement with what recently observed for GPNs (UW)35 and suggested there was no inertia of graphene towards water vapour but rather a supporting action in the diffusion process. This experimental evidence is unquestionably corroborated by the literature, which refers to a certain aptitude of graphene to interact with water molecules42–45,72 with indications from the adsorption of water vapour on exfoliated GPNs of up to 249 cm3 g−1 at 20 °C,42 the adsorption of water on the edge of graphene through the dissociation of H2O to an H atom and OH group,71 the increased work adhesion between water and the membrane surface modified with GPNs.45 Herein, Raman spectroscopy gave an indication of the presence of defects due to the edges of the WJM flakes (Fig. 1h), while XPS analysis revealed the state of oxidation of around 1.2% for WJM flakes, thus giving credibility to the involvement of defective graphene flakes in water transport. | ||
| Fig. 5 (a) Flux vs. Tfeed estimated at 100 mL min−1 for pristine PVDF and FLG-WJM membranes in NaCl 0.6 M solutions. (b) Flux with time estimated at different Tfeed and 100 mL min−1 for FLG-WJM(0.65) membrane when NaCl 0.6 M was used. | ||
| ΔP (Pa) | B FLG-WJM(0.65) × 10−4 (L m−2 h−1 Pa−1) | ΔP (Pa) | B FLG-WJM(10) × 10−4 (L m−2 h−1 Pa−1) |
|---|---|---|---|
| 3628 | 8.5 | 3044 | 5.9 |
| 5683 | 8.0 | 5008 | 4.5 |
| 10040 |
6.8 | 6750 | 5.7 |
| 14296 |
6.5 | 11517 |
4.6 |
Fig. 5b shows an increase in productivity of 180% for FLG-WJM(0.65) in contact with NaCl 0.6 M as the temperature was increased from 40 °C to 55 °C, leading to an increase in the flux of up to 99.7% compared to the pristine PVDF. As expected, a further increase in the flux of up to 28.4 L m−2 h−1 was achievable when working at 60 °C under a flow rate of 400 mL min−1.
The constant and stable fluxes with time yielded further indications about the good resistance to wetting and fouling phenomena42 (Fig. 5b). Total salt rejection (100%) was achieved in all the cases, providing clear evidence about the good membrane waterproofness.
A good resistance to wetting continued over 20 h running time with a salt rejection rate of 99.996% (Fig. 6a). However, the relative flux (F/F0) indicated a decline in water transfer of around 30% over the last 13 h of operation for the FLG-WJM(0.65) membrane. Indeed, the decrease in the temperature polarization coefficient (τ) revealed a slight loss in the driving force (ΔT) for the transport in the first 6 h of the process (Fig. 6b). This undesired event was more visible for the FLG-WJM(10) membranes, through which the diminution of the flux was tangible compared to the FLG-WJM(0.65) membranes. So, the confinement of low amounts of exfoliated graphene in the membranes appeared to be a good compromise for enhancing the MD productivity without seriously affecting the resistance of the membrane to heat transfer.
 | ||
| Fig. 6 Relative flux (F/F0) estimated with time for FLG-WJM(0.65) at Tfeed = 40 °C and 100 mL min−1 (a); temperature polarization coefficient (t) comparing FLG-WJM membranes at 40 °C (b). | ||
Independent of the FLG concentration, the membranes continued to exhibit a liquid entry pressure (LEP) of around 1 bar and contact angle values higher than 130°. More specifically, the FLG-WJM(0.65) and FLG-WJM(10) membrane surfaces show contact angle values of 136 ± 1° and 129 ± 2° against a value of 144 ± 2° measured for the pristine PVDF membrane. The hydrophobic character of the surface associated to waterproofness persists also when the nanocomposite membrane comes in contact with solutions at higher NaCl concentrations (Fig. 7).
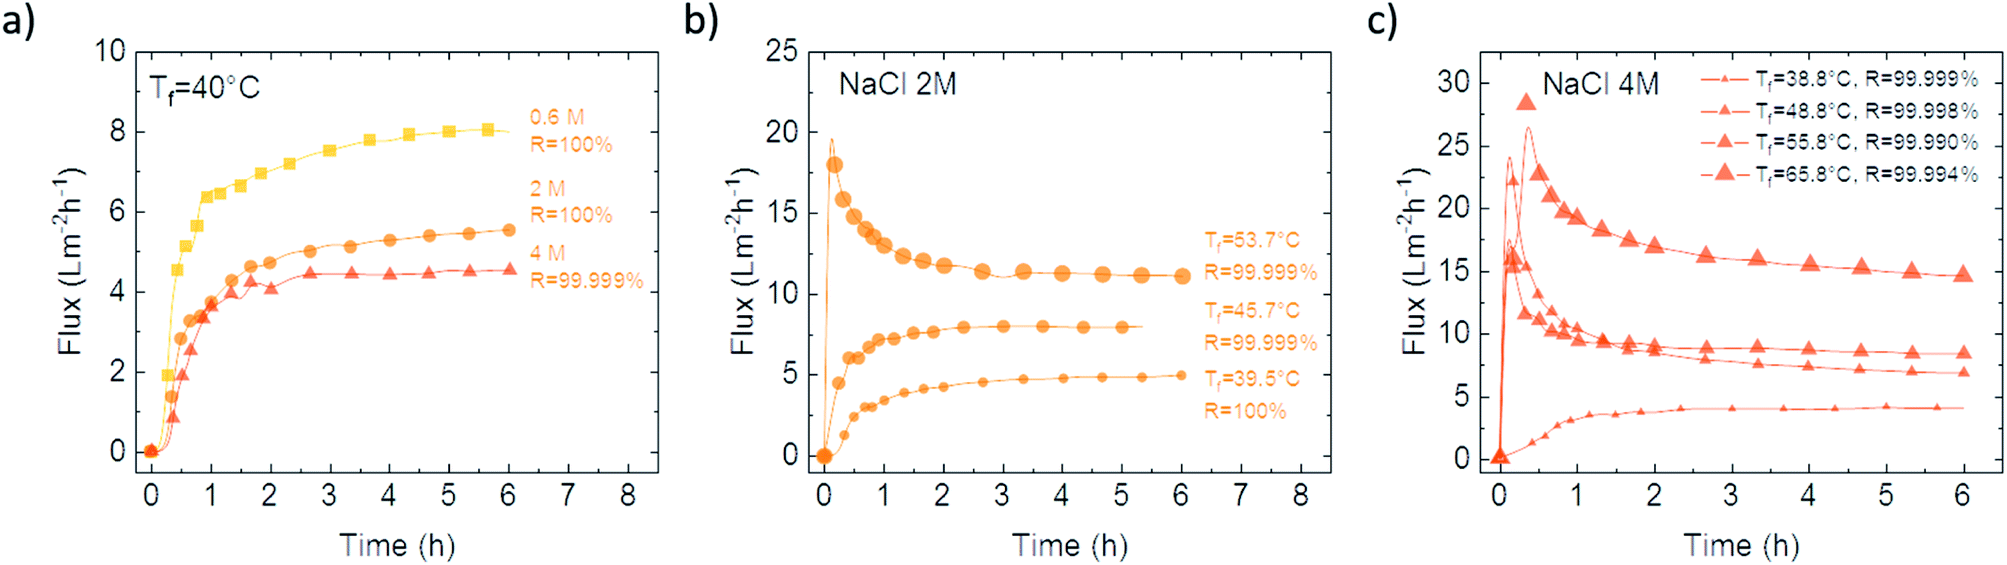 | ||
| Fig. 7 Permeation capacity of FLG-WJM(0.65) membrane under different working conditions: (a) effect of NaCl concentration (0.6, 2 and 4 M) on the flux at 40 °C (a); effect of the temperature on the flux when NaCl 2 M (b) and 4 M (c) were used. | ||
Rejection values ranged, in fact, from 100% to 99.999% within a temperature range of 40–55 °C, providing exceptional barrier action against ions. The fluxes continued to increase with temperature, even when the higher viscosity of the solutions together with the reduced water activity caused a loss in mass transfer. As an example, the FLG-WJM(0.65) membrane exhibited – at 48.8 °C and with a 4 M NaCl solution – a flux of 7 L m−2 h−1 and a rejection rate of 99.999% (Fig. 7c) against a flux of 5 L m−2 h−1 and a rejection rate of 99.0% estimated at 50 °C for polypropoylene membranes layered with PTFE (thickness = 35 μm; nominal pore size = 0.22 μm; porosity = 82%).73 At 65.8 °C and with a NaCl solution of 4 M, the FLG-WJM(0.65) membrane allowed water vapour to permeate with a flux of 15.7 L m−2 h−1 and a rejection rate of 99.994% (Fig. 7c) against a flux of 12 L m−2 h−1 and a rejection rate of 99.90% estimated at 60 °C for a porous superhydrophobic PVDF membrane micro-pillared with CF4 (thickness = 264 μm; porosity = 79%).74
To evaluate the effect of the lateral size of few-layer graphene, the flux-rejection values were compared taking into account the FLG-WJM and GPNs-UW membranes,35 where both the membrane types were prepared via phase inversion and processed under the same working conditions. In this regard, it is quite important to stress that significant changes in the flux take place due to the fluid dynamics, unit configuration, driving forces, temperatures, and chemical compositions of the streams processed. So, comparative studies imply a processing similarity. In this case, a plot of rejection versus flux was built up considering a direct contact membrane distillation (DCMD) configuration and a solution of NaCl 0.6 M (35 g L−1) with a Tfeed of ∼55 °C and Tperm of 20 °C and flow rates of 100 and 83 mL min−1 at the feed and permeate side, respectively (Fig. 8). The FLG-WJM(0.65) membranes – with an effective graphene concentration in the membrane of 0.5% – exhibited an increase in the flux of 38% and a rejection value of 100% compared to the GNPs-UW membranes (GNPs = 0.5% and thickness = 62 μm).35 Also, the FLG-WJM(10) membranes – with an effective graphene concentration of 7.0% – exhibited a higher flux and salt rejection rate (F = 9.05 L m−2 h−1 and R = 99.996%) compared to GNPs-UW membranes (GPNs = 10% and thickness = 65 μm) (F = 0.3 L m−2 h−1 and R = 99.984%).34
 | ||
| Fig. 8 Comparative productivity–efficiency trade-off of membranes based on PVDF enhanced with different fillers, i.e. graphene (obtained by WJM, red circles and UW in blue diamonds35), clay (orange triangles),28, nonwoven fabric (dark brown squares)29 and nanoparticles (NPs) at 70 °C (brown triangles),.31 Working conditions: feed: NaCl solution 35 g L−1 (0.6 M); Tfeed: ∼55 °C (except for the nanoparticles Tfeed = 70 °C). | ||
At concentration parity, the largest size of few-layers is expected to provide a greater surface area. This was postulated to cause a more accessible interface between the penetrant and defective flakes, which showed supporting activity towards water diffusion according to the MD mass-transport coefficients (B).
To concern the performance of FLG-WJM with respect to other tailor-made membranes operated under similar conditions,28,29,31 further assessment was needed (Fig. 8). Compared to electrospun membranes based on clay and having an average thickness of 300 μm and an overall porosity of ∼82%,28 the FLG-WJM membranes showed a better flux-rejection ratio with a flux increase of 217% and a salt rejection rate of 100%. Also, an increase in flux of 6% and a rejection rate of 100% against 99.99% were estimated with respect to supported nonwoven fabric flat-sheet membranes with a thickness of 200 to 215 μm and an overall porosity of ∼48% to 55%.29 A better performance was further found for the FLG-WJM(0.65) membranes when compared to the ones functionalized with nanoparticles (NPs, thickness = ∼70 μm and overall porosity = ∼68%) and processed at 70 °C.31 Membranes filled with FLG-WJM showed an increase in flux higher than 13.3% and a salt rejection rate of 100% (Fig. 8).
3. Conclusion
Few-layer graphene flakes were produced by a wet-jet milling (WJM) process with thickness of 1.5 nm and lateral size of 490 nm, thus resulting in a higher surface area when compared to GPNs exfoliated via ultrasonication. The samples showed defects due to the edges, while the structural integrity was preserved. A slight degree of oxidation was further found. FLG-WJM dispersions were used to fill polyvinylidene fluoride (PVDF) networks and to tailor new functional membranes for water desalination via MD. The FLG-based membranes exhibited outstanding resistance to mechanical stress and resistance to wetting independent of the salt concentration, flow rate and running temperature. Thermal polarization was detected as a larger amount of FLG was confined in the membranes, thus making the confinement of a low amount of FLG preferable. An amplified water vapour flux was detected of up to 15.9 L m−2 h−1 when working at ∼55 °C and with a flow rate of 100 mL min−1. A further increase of ∼80% of the flux could be achieved by running at a flow rate of 400 mL min−1. A total barrier action against ions was always detected, while a fluctuation of the membrane distillation (MD) mass transport coefficients indicated the involvement of defective few-layer graphene in water vapour diffusion. As a result, the FLG-based membranes outperformed the membranes filled with GPNs exfoliated via UW. Under mild fluid dynamics conditions, an increase in productivity of 38% was detected when compared to the GPNs-UW membrane and of 99.7% with respect to pristine membranes fabricated using the same procedure.This comparative study provides experimental evidence of a lateral size-dependent effect on the total trans-membrane flux. A larger surface area was postulated to produce a larger supporting interface between the confined nanofiller and the diffusing penetrant.
4. Materials
PVDF (Solef®6020, Solvay Solexis: water adsorption <0.040% @ 23 °C after 24 h; dp = 1.78 kg m−3) was supplied by Solavy Specialty Polymers. Graphite, 100 mesh, was purchased from Merk. N-Methyl-2-pyrrolidinone (NMP, Riedel de Haëm: max 0.05% in water, d = 1.03 kg m−3) and 2-propanol (IPA, WWR PROLAB: d = 0.78 kg m−3) were used as the solvent and non-solvent, respectively. Fluorinert (FC-40, Novec) was used for the gas–liquid displacement measurements for the pore size and overall porosity estimation. Ultrapure water (filtered by a USF ELGA plant) and NaCl solutions were used as probe liquids to test the wetting resistance. All the materials were used as received.5. Graphene ink preparation via WJM
A mixture of 20 g of bulk graphite flakes (+100 mesh from Sigma-Aldrich) and 2 L of NMP (Sigma-Aldrich) was prepared. The mixture was placed in a container and mixed with a mechanical stirrer (Eurostar digital Ika-Werke). The graphite exfoliation was carried out through the WJM (Jokho, JN100) exfoliation method, by adopting a four-pass protocol published previously.34 The first WJM pass used a nozzle aperture of 0.30 mm. The piston pass, defined as the number of times the piston was charged and discharged with the graphite/NMP mixture, was set to 1000 passes (10 mL per pass). The processed sample was then collected in a second container. The second WJM exfoliation step was repeated processing the sample through the 0.15 mm nozzle. Finally, the nozzle was changed to 0.10 mm diameter and a third and fourth WJM steps were carried out. From the 2 L batch, 300 mL was taken and diluted in NMP to reach a concentration of 0.65 g L−1.6. Membrane preparation
The membranes were prepared by dry–wet phase inversion according to the procedure detailed in ref. 50 and 51. Briefly, PVDF powder was mechanically stirred into the two graphene dispersions (0.65 and 10 g L−1) to fix the concentration of the polymer at 12 wt%. The mixtures were stirred at 30 °C overnight and degassed for 2 h. Each mixture was uniformly cast on a glass plate by using a casting knife regulated at 250 μm (Elcometer Instruments Inc). The casting solution was coagulated in a bath containing IPA in order to promote solid–liquid demixing and then washed in milli-Q water. Each membrane was air-dried at room temperature overnight and annealed at 30 °C for 1 hour. The final concentrations of few-layer graphene in the dried membranes were 0.5 and 10 wt%, respectively.7. Methods
7.1 Structural and physicochemical properties
Transmission electron microscopy (TEM) analysis of the graphene dispersions was performed. First, the dispersions were drop-cast onto ultrathin C-film on holey carbon 400 mesh Cu grids, from Ted Pella Inc. The graphene samples were diluted 1:50. The grids were stored under vacuum at room temperature to remove the solvent residues. TEM images were obtained using a JEOL JEM-1011 transmission electron microscope, operated at an acceleration voltage of 100 kV.
For atomic force microscopy (AFM) analysis, the graphene dispersions were diluted 1:30 in NMP, and 100 μL of the dilutions was drop-cast onto Si/SiO2 wafers and dried at 50 °C overnight. The AFM images were acquired with a Bruker Innova® AFM instrument in the tapping mode using silicon probes (frequency = 300 kHz, spring constant = 40 N m−1). Thickness statistics were obtained by measuring ∼100 flakes from the AFM images. The statistical analyses were fitted with log-normal distributions. Statistical analyses were performed using the WSxM Beta 4.0 software.
For Raman spectroscopy, the as-prepared dispersions were diluted 1:30 in NMP and drop-cast onto a Si wafer (LDB Technologies Ltd) covered with 300 nm thermally grown SiO2. The Raman measurements were carried out on a Renishaw inVia spectrometer using a 50× objective (numerical aperture 0.75) laser with a wavelength of 514.5 nm with an incident power of ∼5 mW. A total of ca. 30 points per sample were measured to perform the statistical analysis. OriginPro 2016 was used to perform the deconvolution and statistics.
X-ray photoelectron spectroscopy analysis was accomplished using a Kratos Axis UltraDLD spectrometer on samples drop-cast onto gold-coated silicon wafers. The X-ray photoelectron spectroscopy (XPS) spectra were acquired using a monochromatic Al Kα source operating at 20 mA and 15 kV. The analyses were carried out on a 300 μm × 700 μm area. High-resolution spectra of the C 1s and Au 4f peaks were collected at a pass energy of 10 eV and energy step of 0.1 eV. Energy calibration was performed setting the Au 4f7/2 peak at 84.0 eV. Data analysis was carried out with CasaXPS software (version 2.3.17).
The membrane morphology was inspected by SEM (Zeiss EVO MA10, Germany). Small samples specimens were broken in liquid nitrogen and placed in a sample holder. An ultrathin coating of electrically conducting gold (Au) was deposited by using a sputter coating for SEM and the morphology of the membranes was analysed in a high vacuum.
The pore size and distribution were estimated according to the gas–liquid displacement technique. The nitrogen flux was measured through dried samples (PM, Instruments). Three samples with an effective area of 3.5 cm2 were filled by FC-40 and the liquid was displaced from bigger to smaller pores with increasing pressure. The overall porosity was measured by filling them with FC-40. The membrane weight was estimated before and after filling and the porosity was expressed as a percentage as the ratio between the volume occupied by the fluorinert liquid and the volume of the membrane. The procedure was repeated for five specimens. Changes in mechanical resistance were evaluated by using a tensile stress–strain meter (Roell/Zwick); an average of 4–5 specimens with an area of 10 cm2 were tested at 20 °C.
7.2 Membrane distillation experiments
Thermally driven MD experiments were executed according to the direct contact (DC) configuration using NaCl solutions 0.6, 2 and 4 M with the condition: fiow rate = 100 (feed) and 83 (permeate) mL min−1; Tfeed = 40 to 60 °C and Tperm = 20 °C. Retentate and distillate streams converged, in a counter-current way, towards the membrane module containing the membrane, where the liquid water was evaporated (Scheme 1). | ||
| Scheme 1 Picture (a) and schematic drawing (b) of a membrane distillation (MD) plant. | ||
On the retentate side, a pump was used for taking and sending the heated feed to the membrane module. Also on the distillate side, a second pump ensured the counter-current recycling of the cold stream in order to remove from the solution the vapour diffusing through the membrane pores. The trans-membrane fluxes were estimated by evaluating the weight variations in the distillate tanks. The salt conductivity of the feed and permeate streams were measured by using a conductive meter (Eutech Instruments PC 2700). The temperature polarization was measured through the τ coefficient and expressed as the ratio between the difference of Tm1 and Tm2, which are the temperatures at the hot and cold membrane surfaces, respectively, and the difference between Tb1 and Tb2, which are the temperatures in the feed and permeate bulk solutions, respectively.
Conflicts of interest
There are no conflicts of interest to declare.Acknowledgements
We acknowledge financial grant from ‘the Italian Ministry of Foreign Affairs and International Cooperation’ within the framework of the Great Relevance International Project Italy (MAECI)-China (NSFC) 2018–2020 - New Materials, with particular reference to Two-dimensional systems and Graphene (2DMEMPUR) (Grant agreement. No. MAE0065611) and European Union’s Horizon 2020 research and innovation programme under the grant agreement No. 785219 – GrapheneCore2.References
- M. M. Mekonnen and A. Y. Hoekstra, Four billion people facing severe water scarcity, Sci. Adv., 2016, 2, e1500323 CrossRef.
- L. Bengtsson, The global atmospheric water cycle, Environ. Res. Lett., 2010, 5, 2, DOI:10.1088/1748-9326/5/2/025202.
- M. Elimelech and W. A. Phillip, The Future of Seawater Desalination: Energy, Technology, and the Environment, Science, 2011, 333, 712–717 CrossRef CAS.
- Global Water Intelligence, Water Desalination Report, IDA Desalination Yearbook 2017-2018, Media Analytics Ltd., 2018 Search PubMed.
- I. G. Wenten, Khoiruddin. Reverse osmosis applications: Prospect and challenges, Desalination, 2016, 391, 112–125 CrossRef CAS.
- E. Drioli and E. Curcio, Membrane engineering for process intensification: A perspective, J. Chem. Technol. Biotechnol., 2007, 82, 223–227 CrossRef CAS.
- F. Macedonio and E. Drioli, Membrane Engineering for Green Process Engineering, Engineering, 2017, 3, 290–298 CrossRef.
- E. Drioli, A. Ali and F. Macedonio, Membrane distillation: Recent developments and perspectives, Desalination, 2015, 356, 56–84 CrossRef CAS.
- F. Macedonio and E. Drioli, Pressure-driven membrane operations and membrane distillation technology integration for water purification, Desalination, 2008, 223, 396–409 CrossRef CAS.
- O. R. Lokare, S. Tavakkoli, S. Wadekar, V. Khanna and R. D. Vidic, Fouling in direct contact membrane distillation of produced water from unconventional gas extraction, J. Membr. Sci., 2017, 524, 493–501 CrossRef CAS.
- A. Gugliuzza and A. Basile, Membranes for Clean and Renewable Power Applications, 2013, vol. 524, pp. 493–501 Search PubMed.
- C. Charcosset, Combining membrane processes with renewable energy technologies: Perspectives on membrane desalination, biofuels and biogas production, and microbial fuel cells, in Membranes for Clean and Renewable Power Applications, 2013 Search PubMed.
- A. Gugliuzza and A. BasileMembrane contactors: fundamentals, membrane materials and key operations, in Handbook of Membrane Reactors, 2013 Search PubMed.
- M. Frappa, F. Macedonio and E. Drioli, Progress of membrane engineering for water treatment, J. Membr. Sci. Res., 2020, 6, 269–279 Search PubMed.
- M. S. El-Bourawi, Z. Ding, R. Ma and M. Khayet, A framework for better understanding membrane distillation separation process, J. Membr. Sci., 2006, 285, 4–29 CrossRef CAS.
- D. M. Warsinger, A. Servi, G. B. Connors, M. O. Mavukkandy, H. A. Arafat, K. K. Gleason and J. H. Lienhard, Reversing membrane wetting in membrane distillation: comparing dryout to backwashing with pressurized air, Environ. Sci.: Water Res. Technol., 2017, 3, 930–939 RSC.
- A. Gugliuzza, M. C. Aceto and E. Drioli, Interactive functional poly(vinylidene fluoride) membranes with modulated lysozyme affinity: A promising class of new interfaces for contactor crystallizers, Polym. Int., 2009, 58, 1452–1464 CrossRef CAS.
- M. L. Perrotta, et al. An ultrathin suspended hydrophobic porous membrane for high-efficiency water desalination, Appl. Mater. Today, 2017, 9, 1–9 CrossRef.
- T. R. Gaborski, et al. High-performance separation of nanoparticles with ultrathin porous nanocrystalline silicon membranes, ACS Nano, 2010, 4, 6973–6981 CrossRef CAS.
- Z. Cui, et al. Hyflon/PVDF membranes prepared by NIPS and TIPS: Comparison in MD performance, Sep. Purif. Technol., 2020, 247, 116992 CrossRef CAS.
- V. Speranza, F. Trotta, E. Drioli and A. Gugliuzza, High-definition polymeric membranes: Construction of 3d lithographed channel arrays through control of natural building blocks dynamics, ACS Appl. Mater. Interfaces, 2010, 2, 459–466 CrossRef CAS.
- O. A. Sadik, N. Du, I. Yazgan and V. Okello, Nanostructured Membranes for Water Purification, in Nanotechnology Applications for Clean Water: Solutions for Improving Water Quality, Second edn, 2014, DOI:10.1016/B978-1-4557-3116-9.00006-8.
- V. Pingitore and A. Gugliuzza, Fabrication of porous semiconductor interfaces by pH-driven assembly of carbon nanotubes on honeycomb structured membranes, J. Phys. Chem. C, 2013, 117, 26562–26572 CrossRef CAS.
- A. Gugliuzza, A. Politano and E. Drioli, The advent of graphene and other two-dimensional materials in membrane science and technology, Curr. Opin. Chem. Eng., 2017, 16, 78–85 CrossRef.
- W. Zhong, J. Hou, H. C. Yang and V. Chen, Superhydrophobic membranes via facile bio-inspired mineralization for vacuum membrane distillation, J. Membr. Sci., 2017, 540, 98–107 CrossRef CAS.
- C. Boo, J. Lee and M. Elimelech, Omniphobic Polyvinylidene Fluoride (PVDF) Membrane for Desalination of Shale Gas Produced Water by Membrane Distillation, Environ. Sci. Technol., 2016, 50, 12275–12282 CrossRef CAS PubMed.
- M. Qtaishat, M. Khayet and T. Matsuura, Guidelines for preparation of higher flux hydrophobic/hydrophilic composite membranes for membrane distillation, J. Membr. Sci., 2009, 329, 193–200 CrossRef CAS.
- J. A. Prince, et al. Preparation and characterization of highly hydrophobic poly(vinylidene fluoride) - Clay nanocomposite nanofiber membranes (PVDF-clay NNMs) for desalination using direct contact membrane distillation, J. Membr. Sci., 2012, 397–398, 80–86 CrossRef CAS.
- D. Hou, et al. Preparation and characterization of PVDF/nonwoven fabric flat-sheet composite membranes for desalination through direct contact membrane distillation, Sep. Purif. Technol., 2012, 135, 211–222 CrossRef.
- A. K. An, E.-J. g Lee, J. Guo, S. Jeong, J.-G. Lee and N. Ghaffour, Enhanced vapor transport in membrane distillation via functionalized carbon nanotubes anchored into electrospun nanofibres, Sci. Rep., 2017, 7, 41562 CrossRef PubMed.
- J. Zhang, Z. Song, B. Li, Q. Wang and S. Wang, Fabrication and characterization of superhydrophobic poly (vinylidene fluoride) membrane for direct contact membrane distillation, Desalination, 2013, 324, 1–9 CrossRef CAS.
- H. Attia, S. Alexander, C. J. Wright and N. Hilal, Superhydrophobic electrospun membrane for heavy metals removal by air gap membrane distillation (AGMD), Desalination, 2017, 420, 318–329 CrossRef CAS.
- A. Gugliuzza, R. Fabiani, M. G. Garavaglia, A. Spisso and E. Drioli, Study of the surface character as responsible for controlling interfacial forces at membrane-feed interface, J. Colloid Interface Sci., 2016, 303, 388–403 CrossRef PubMed.
- A. Chogani, A. Moosavi and M. Rahiminejad, Numerical Simulation of Salt Water Passing Mechanism Through Nanoporous Single-Layer Graphene Membrane, Chem. Prod. Process Model., 2016, 11, 73–76 CAS.
- E. Gontarek, et al. Adsorption-assisted transport of water vapour in super-hydrophobic membranes filled with multilayer graphene platelets, Nanoscale, 2019, 11, 11521–11529 RSC.
- A. Abdel-Karim, et al. PVDF membranes containing reduced graphene oxide: Effect of degree of reduction on membrane distillation performance, Desalination, 2019, 452, 196–207 CrossRef CAS.
- W. Intrchom, S. Roy, M. S. Humoud and S. Mitra, Immobilization of graphene oxide on the permeate side of a membrane distillation membrane to enhance flux, Membranes, 2018, 8, 63 CrossRef PubMed.
- H. H. Huang, R. K. Joshi, K. K. H. De Silva, R. Badam and M. Yoshimura, Fabrication of reduced graphene oxide membranes for water desalination, J. Membr. Sci., 2019, 572, 12–19 CrossRef CAS.
- H. M. Hegab and L. Zou, Graphene oxide-assisted membranes: Fabrication and potential applications in desalination and water purification, J. Membr. Sci., 2015, 484, 95–106 CrossRef CAS.
- S. Leaper, et al. Flux-enhanced PVDF mixed matrix membranes incorporating APTS-functionalized graphene oxide for membrane distillation, J. Membr. Sci., 2018, 554, 309–323 CrossRef CAS.
- Y. Mao, Q. Huang, B. Meng, K. Zhou, G. Liu, A. Gugliuzza, E. Drioli and W. Jin, Roughness-enhanced hydrophobic graphene oxide membrane for water desalination via membrane distillation, J. Membr. Sci., 2020, 446, 350–375 Search PubMed.
- D. H. Seo, et al. Anti-fouling graphene-based membranes for effective water desalination, Nat. Commun., 2018, 9, 683 CrossRef PubMed.
- M. X. Wang, et al. Water vapor adsorption on low-temperature exfoliated graphene nanosheets, J. Phys. Chem. Solids, 2012, 73, 1440–1443 CrossRef CAS.
- Z. Zhen, et al. Formation of Uniform Water Microdroplets on Wrinkled Graphene for Ultrafast Humidity Sensing, Small, 2018, 14, 1703848 CrossRef PubMed.
- M. L. Perrotta, et al. Graphene stimulates the nucleation and growth rate of NaCl crystals from hypersaline solution via membrane crystallization, Environ. Sci.: Water Res. Technol., 2020, 6, 1723–1736 RSC.
- A. Boretti, et al. Outlook for graphene-based desalination membranes, npj Clean Water, 2018, 1, 5 CrossRef CAS.
- M. L. Perrotta, et al. Molecular insights on NaCl crystals formation approaching the PVDF membranes functionalized with graphene, Phys. Chem. Chem. Phys., 2020, 22, 7817–7827 RSC.
- F. Bonaccorso, A. Bartolotta, J. N. Coleman and C. Backes, 2D-Crystal-Based Functional Inks, Adv. Mater., 2016, 28, 6136–6166 CrossRef CAS PubMed.
- A. P. Kauling, et al. The Worldwide Graphene Flake Production, Adv. Mater., 2018, 30, 1803784 CrossRef PubMed.
- Y. Xu, H. Cao, Y. Xue, B. Li and W. Cai, Liquid-phase exfoliation of graphene: An overview on exfoliation media, techniques, and challenges, Nanomaterials, 2018, 8, 942 CrossRef PubMed.
- A. E. Del Río Castillo, et al. Single-step exfoliation and functionalization of few-layers black phosphorus and its application for polymer composites, FlatChem, 2019, 18, 100131 CrossRef.
- A. E. Del Rio Castillo, et al. High-yield production of 2D crystals by wet-jet milling, Mater. Horiz., 2018, 5, 890–904 RSC.
- I. N. Seekkuarachchi, K. Tanaka and H. Kumazawa, Dispersion mechanism of nano-particulate aggregates using a high pressure wet-type jet mill, Chem. Eng. Sci., 2008, 63, 2341–2366 CrossRef CAS.
- A. Gugliuzza and E. Drioli, PVDF and HYFLON AD membranes: Ideal interfaces for contactor applications, J. Membr. Sci., 2007, 300, 51–62 CrossRef CAS.
- A. Gugliuzza and E. Drioli, New performance of hydrophobic fluorinated porous membranes exhibiting particulate-like morphology, Desalination, 2009, 240, 14–20 CrossRef CAS.
- A. C. Ferrari and D. M. Basko, Raman spectroscopy as a versatile tool for studying the properties of graphene, Nat. Nanotechnol., 2013, 8, 235–246 CrossRef CAS PubMed.
- F. Bonaccorso, P. H. Tan and A. C. Ferrari, Multiwall nanotubes, multilayers, and hybrid nanostructures: New frontiers for technology and Raman spectroscopy, ACS Nano, 2013, 7, 1838–1844 CrossRef CAS PubMed.
- U. Khan, et al. Size selection of dispersed, exfoliated graphene flakes by controlled centrifugation, Carbon, 2012, 50, 470–475 CrossRef CAS.
- C. Backes, et al. Spectroscopic metrics allow in situ measurement of mean size and thickness of liquid-exfoliated few-layer graphene nanosheets, Nanoscale, 2016, 8, 4311–4323 RSC.
- A. Capasso, et al. Ink-jet printing of graphene for flexible electronics: An environmentally-friendly approach, Solid State Commun., 2015, 224, 53–63 CrossRef CAS.
- A. Das, B. Chakraborty and A. K. Sood, Raman spectroscopy of graphene on different substrates and influence of defects, Bull. Mater. Sci., 2008, 31, 579–584 CrossRef CAS.
- A. C. Ferrari, et al. Raman spectrum of graphene and graphene layers, Phys. Rev. Lett., 2006, 97, 187401 CrossRef CAS PubMed.
- Y. Hernandez, et al. High-yield production of graphene by liquid-phase exfoliation of graphite, Nat. Nanotechnol., 2008, 3, 563–568 CrossRef CAS PubMed.
- A. C. Ferrari, Raman spectroscopy of graphene and graphite: Disorder, electron-phonon coupling, doping and nonadiabatic effects, Solid State Commun., 2007, 143, 47–57 CrossRef CAS.
- L. M. Malard, M. A. Pimenta, G. Dresselhaus and M. S. Dresselhaus, Raman spectroscopy in graphene, Phys. Rep., 2009, 473, 51–87 CrossRef CAS.
- M. S. Dresselhaus, G. Dresselhaus and M. Hofmann, Raman spectroscopy as a probe of graphene and carbon nanotubes, Philos. Trans. R. Soc., A, 2008, 366, 231–236 CrossRef CAS PubMed.
- A. Ansaldo, et al. High-power graphene–Carbon nanotube hybrid supercapacitors, ChemNanoMat, 2017, 3, 436–446 CrossRef CAS.
- P. Cataldi, et al. Effect of graphene nano-platelet morphology on the elastic modulus of soft and hard biopolymers, Carbon, 2016, 109, 331–339 CrossRef CAS.
- J. Wang, X. Wang, C. Xu, M. Zhang and X. Shang, Preparation of graphene/poly(vinyl alcohol) nanocomposites with enhanced mechanical properties and water resistance, Polym. Int., 2011, 60, 816–822 CrossRef CAS.
- A. J. Crosby and J.-Y. Lee, Polymer Nanocomposites: The “Nano” Effect on Mechanical Properties, Polym. Rev., 2007, 47, 217–229 CrossRef CAS.
- F. Macedonio, A. Politano, E. Drioli and A. Gugliuzza, Bi2Se3-assisted membrane crystallization, Mater. Horiz., 2018, 5, 912–919 RSC.
- L. Jiang, J. Wang, P. Liu, W. Song and B. Hea, Study of water adsorption on graphene edges, RSC Adv., 2018, 8, 11216–11221 RSC.
- Y. Guan, J. Li, F. Cheng, J. Zhao and X. Wang, Influence of salt concentration on DCMD performance for treatment of highly concentrated NaCl, KCl, MgCl2 and MgSO4 solutions, Desalination, 2015, 355, 110–117 CrossRef CAS.
- Z. Xiao, et al. Slippery for scaling resistance in membrane distillation: A novel porous micropillared superhydrophobic surface, Water Res., 2019, 155, 152–161 CrossRef CAS PubMed.
| This journal is © The Royal Society of Chemistry 2020 |