
 Open Access Article
 This Open Access Article is licensed under a Creative Commons Attribution-Non Commercial 3.0 Unported Licence
Alzheimer's disease-related amyloid β peptide causes structural disordering of lipids and changes the electric properties of a floating bilayer lipid membrane†
Dusan
Mrdenovic
 ab,
Zhangfei
Su
b,
Wlodzimierz
Kutner
ac,
Jacek
Lipkowski
*b and
Piotr
Pieta
*a
ab,
Zhangfei
Su
b,
Wlodzimierz
Kutner
ac,
Jacek
Lipkowski
*b and
Piotr
Pieta
*a
aInstitute of Physical Chemistry, Polish Academy of Sciences, Kasprzaka 44/52, 01-224 Warsaw, Poland. E-mail: ppieta@ichf.edu.pl
bDepartment of Chemistry, University of Guelph, 50 Stone Road East, Guelph, Ontario N1G 2W1, Canada. E-mail: jlipkows@uoguelph.ca
cFaculty of Mathematics and Natural Sciences, School of Sciences, Cardinal Stefan Wyszynski University in Warsaw, Wóycickiego 1/3, 01-815 Warsaw, Poland
First published on 29th June 2020
Abstract
Neurodegeneration in Alzheimer's disease is associated with disruption of the neuronal cell membrane by the amyloid β (Aβ) peptide. However, the disruption mechanism and the resulting changes in membrane properties remain to be elucidated. To address this issue, herein the interaction of amyloid β monomers (AβMs) and amyloid β oligomers (AβOs) with a floating bilayer lipid membrane (fBLM) was studied using electrochemical and IR spectroscopy techniques. IR measurements showed that both Aβ forms interacted similarly with the hydrophobic membrane core (lipid acyl chains), causing conformational and orientational changes of the lipid acyl chains, thus decreasing acyl chain mobility and altering the lipid packing unit cell. In the presence of AβOs, these changes were more significant than those in the presence of AβMs. However, respective interactions of AβMs and AβOs with the membrane hydrophilic exterior (lipid heads) were quite different. AβMs dehydrated lipid heads without affecting their orientation while AβOs changed the orientation of lipid heads keeping their hydration level intact. Electrochemical measurements showed that only AβOs porated the fBLM, thus significantly changing the fBLM electrical properties. The present results provide new molecular-level insight into the mechanism of membrane destruction by AβOs and changes in the membrane properties.
1. Introduction
Extension of the human life span is accompanied by an increased chance of acquiring a neurodegenerative disease, like Alzheimer's, Parkinson's, and Huntington's disease. Alzheimer's disease (AD) remains incurable, and the progressive increase in the number of AD patients represents a serious and growing medical problem worldwide.1 It is necessary to get a deeper insight into the pathophysiology of AD to develop its effective treatment. The amyloid cascade hypothesis is one of the most popular attempts to decipher AD.2 According to this hypothesis, misfolded amyloid β (Aβ) peptide undergoes nucleation-dependent polymerization (also known as fibrillation or fibrillogenesis), in which toxic Aβ forms are produced. Throughout fibrillation, Aβ monomers (AβMs) aggregate into globular aggregates, i.e., small (low-molecular-weight) and big (high-molecular-weight) oligomers as well as elongated aggregates, i.e., protofibrils and mature fibrils. These aggregates associate to form protein deposits (amyloid plaques) located in the brain of the AD patients that represent the hallmark of AD.3,4 Recent studies showed that Aβ oligomers (AβOs) are the most toxic form of Aβ aggregates. However, the mechanism of AβOs toxicity is not fully understood. Different types of AβOs can exert different toxic actions. AβOs can impair hippocampal synaptic plasticity causing deficiency in learning and cognition,5,6 trigger cell death via leakage of lysosomal enzymes,7 inhibit mitochondrial activity,8 increase production of reactive oxygen species,9 or impair cytosolic proteasome.10An important feature of AβOs toxicity is the destruction of the cell membrane.11 Different mechanisms of this destruction were proposed, including pore/ion channel formation12,13 and membrane fragmentation/lipid extraction.14,15 Our previous AFM study showed that the AβO-induced lipid bilayer destruction mechanism consisted of pore formation followed by lipid extraction.16 This pore formation action was exclusively linked to small AβOs. On the other hand, big AβOs only aggregated on the membrane leaving its surface intact.16 Both small and big AβOs altered nanomechanical properties of the membrane, thus suggesting that both forms were toxic, but their respective toxicity mechanisms were different. Importantly, our AFM results were consistent with those of the studies published at the same time.17,18 These studies showed that only small aggregates permeated a cell membrane while bigger aggregates induced cell inflammation. That was the case for aggregates produced in a lab and those extracted from the cerebrospinal fluid of the AD patients.17,18
The results of our previous AFM study lacked information about the changes inside the membrane.16 Therefore, the goal of the present research is to study the AβO-induced changes in the floating bilayer lipid membrane (fBLM) using polarization-modulation infrared reflection-absorption spectroscopy (PM-IRRAS) and different electrochemical techniques. These techniques have been successfully applied to study the effect of antimicrobial peptides on the fBLM properties.19–22 To demonstrate that the interaction of AβOs with fBLM was unique, we also herein studied the interaction of fBLM with non-toxic AβMs. Apparently, only AβOs could form defects in the membrane. This defects formation resulted in a significant change in the membrane electric properties. These defects differed from the ion channels formed by other pore-forming peptides/proteins. Moreover, both AβMs and AβOs caused conformational and orientational changes of lipids molecules in the fBLM. All changes in fBLM were more pronounced in the presence of AβOs, thus indicating that the interaction of AβOs with the membrane was stronger than that of AβMs. Our results provide new insight into the AβO–lipid interaction expanding knowledge about our previously proposed mechanism of AβO-induced membrane destruction.
2. Experimental section
2.1 Aβ peptide preparation
Recombinant amyloid β (1–42) peptide was purchased from rPeptide (Watkinsville, USA). Its purity was high, as evidenced by MS analysis showing molecular mass identical to that expected for a monomer (Fig. S1 in ESI†). The peptide was prepared following the previously developed protocol23 with slight modifications that were introduced in our previous study.16 First, a 1 mg sample of Aβ was dissolved in trifluoroacetic acid (TFA) from Sigma-Aldrich to reach the final concentration of 0.5 mg ml−1. This dissolution is a necessary step to remove pre-existing Aβ aggregates that may act as seeds accelerating Aβ aggregation causing irreproducibility in the experiments. Addition of TFA to the peptide was followed by 5 min vortexing, and then the solvent was removed under Ar stream. The resulting peptide film was left on the vial glass wall. Next, 1,1,1,3,3,3-hexafluoro-2-propanol (HFIP) from Sigma-Aldrich was added to reach the 0.5 mg ml−1 Aβ concentration. HFIP is another solvent used for Aβ disaggregation and it also helps to remove traces of TFA. The Aβ-HFIP solution was vortexed for 5 min, and then HFIP was evaporated under Ar stream. The addition, and then removal of HFIP were repeated once more. Next, the peptide film was dissolved in HFIP to achieve the 0.25 mg ml−1 Aβ concentration, and subsequently the solution was vortexed for 5 min. The Aβ solution was divided into 20 aliquots, each containing 50 μg of the peptide per centrifuge tube. The tubes were covered with Kimtech wipes to protect them from dust, and then left under the fume hood overnight to allow for HFIP evaporation. Next, residual HFIP was removed under decreased pressure in a desiccator for 1 h. This HFIP removal resulted in the peptide films deposition on the bottom of the tubes. Those were then stored in the freezer at −20 °C. A single aliquot was used for each experiment. First, the aliquot was allowed to equilibrate to room temperature for several minutes. Then, the peptide film was resuspended in 20 μl of dimethyl sulfoxide (DMSO) from Sigma-Aldrich and, finally, it was diluted with the 0.01 M phosphate buffer saline, PBS (pH = 7.4) solution to reach the 50 μg ml−1 Aβ concentration. The PBS solution was prepared by dissolving PBS tablets from Sigma-Aldrich in 200 ml of Milli Q water, 18.2 MΩ cm (EMD Millipore, Billerica, MA, US), thus obtaining the 0.01 M phosphate buffer, 0.0027 M KCl, and 0.137 M NaCl (pH = 7.4) solution. The Aβ solution prepared that way contained AβMs. Our previous AFM study showed that AβMs molecules are globular and are ∼0.7 nm high.16 This AβMs solution was immediately used to study AβM–lipid bilayer interaction. To study the AβO–lipid bilayer interaction, the AβMs solution was stored in the fridge at 4 °C for 24 h, thus allowing aggregation of AβMs into AβOs. Previous AFM study showed that toxic, globular AβOs with the height of 1.5–2.5 nm and the average diameter of ∼6 nm are formed under these conditions.162.2 Lipid vesicles preparation
1,2-Distearoyl-sn-glycero-3-phosphoethanolamine (DSPE), 1,2-dipalmitoyl-sn-glycero-3-phosphocholine (DPPC), cholesterol (Chol), porcine brain sphingomyelin (SM), and ovine brain monosialoganglioside (GM1) were purchased from Sigma-Aldrich and then used without further purification. Structural formulas of lipids used are shown in Scheme 1. DSPE was dissolved in a chloroform![[thin space (1/6-em)]](https://www.rsc.org/images/entities/char_2009.gif) :methanol (9:1, v/v ratio) mixed solvent solution at 50 °C. Other lipids were dissolved in chloroform at room temperature. Lipid stock solutions were stored in the freezer at −20 °C. An aliquot of the lipid stock solution was transferred to a glass vial, and the final solution contained 1 mg of lipids. The lipid mixture contained 50% DSPE, 15% DPPC, 25% Chol, 8% SM, and 2% GM1 (w/w). This lipid composition was used to mimic aged lipid rafts formed in the membrane of the cells from the human frontal cortex found in AD patient brains.24 Next, the solvent was evaporated under Ar stream accompanied by vortexing. The solvent removal resulted in the formation of a lipid film on the bottom of the glass vial. Then, this film was resuspended in the PBS (pH = 7.4) solution to reach the 1 mg ml−1 concentration of lipids. Subsequently, the solution was sonicated using an ultrasonic cleaner (VWR Model 50D, 120 V) for 20 min at 45 °C, which resulted in the formation of lipid vesicles.
:methanol (9:1, v/v ratio) mixed solvent solution at 50 °C. Other lipids were dissolved in chloroform at room temperature. Lipid stock solutions were stored in the freezer at −20 °C. An aliquot of the lipid stock solution was transferred to a glass vial, and the final solution contained 1 mg of lipids. The lipid mixture contained 50% DSPE, 15% DPPC, 25% Chol, 8% SM, and 2% GM1 (w/w). This lipid composition was used to mimic aged lipid rafts formed in the membrane of the cells from the human frontal cortex found in AD patient brains.24 Next, the solvent was evaporated under Ar stream accompanied by vortexing. The solvent removal resulted in the formation of a lipid film on the bottom of the glass vial. Then, this film was resuspended in the PBS (pH = 7.4) solution to reach the 1 mg ml−1 concentration of lipids. Subsequently, the solution was sonicated using an ultrasonic cleaner (VWR Model 50D, 120 V) for 20 min at 45 °C, which resulted in the formation of lipid vesicles.
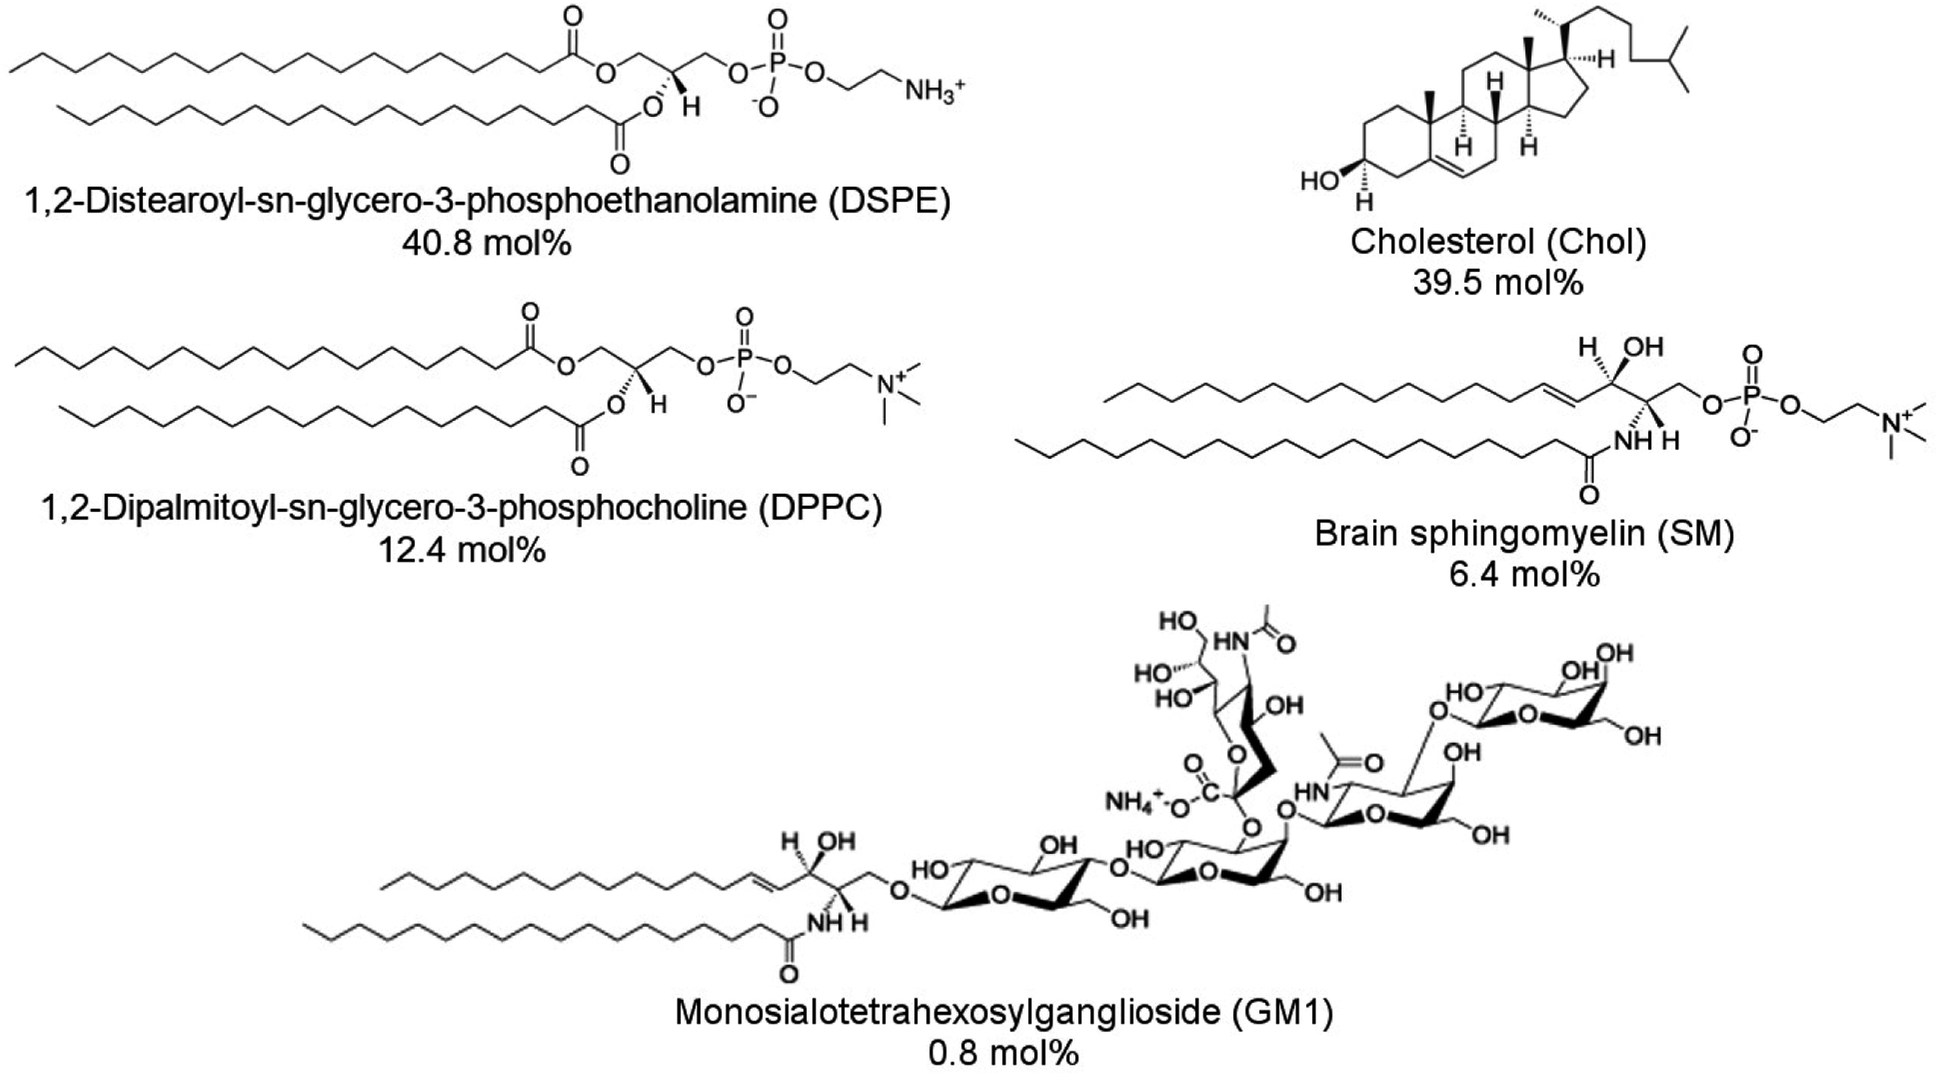 | ||
| Scheme 1 Structural formulas of lipids used to construct a model membrane of the human brain cell and their corresponding concentrations expressed in molar percentages. | ||
2.3 Floating bilayer lipid membrane (fBLM) preparation
The vesicles fusion method was used to prepare a fBLM.25 Small and big single-crystal Au(111) electrodes (surface area of 0.172 and 1.33 cm2, respectively) were used as the working electrodes for electrochemical and PM-IRRAS measurements, respectively. Before use, the Au electrodes were pretreated according to the previously developed procedure.26 Briefly, the electrodes were rinsed with Milli-Q® water, and then flame annealed using Bunsen burner. After cooling down to room temperature, the electrodes were immersed in a 0.4 mg ml−1 1-thio-β-D-glucose (Tg) solution from Sigma-Aldrich for 5 h, which resulted in the formation of a self-assembled monolayer of Tg (SAM-Tg) on the gold surface. The SAM-Tg provides a hydrophilic cushion layer that enhances vesicle fusion and relieves stress imposed by the gold substrate on the fBLM.27 Moreover, it provides a water-rich layer underneath the lipid bilayer, thus mimicking the natural cell membrane environment. After SAM-Tg formation, the electrodes were rinsed with Milli-Q® water and then immersed in the lipid vesicles solution (either containing or not containing Aβ) overnight. Finally, the electrodes were taken out of the solution, and then the excess of the solution was gently removed with a Kimtech wipe.2.4 Preparation of the Aβ–lipid bilayer mixture
In all experiments, the Aβ and lipid vesicle solutions were mixed to reach the peptide-to-lipid mass ratio of 1:20. Then, the mixture was sonicated for 10 min at room temperature, followed by overnight immersion of the Au(111) electrode in this mixture.
2.5 Electrochemical measurements
The all-glass three-electrode cell was used for all electrochemical measurements. An Au(111), Pt wire, and saturated Ag/AgCl electrode were used as the working, counter, and reference electrode, respectively. Before each measurement, the cell was purged for 30 min with an Ar stream to remove oxygen. During the experiments, a cushion of Ar was flowing over the solution. A small Au(111) electrode coated with the fBLM was assembled in the electrochemical cell in the hanging meniscus configuration. That is, the electrode was slowly pushed down vertically towards the electrolyte solution until it touched it. Then, it was raised until a meniscus between the electrode surface, and the electrolyte was formed.The immersion method28,29 was employed to determine the potential of zero free charge (Epzfc) at the electrode surface. For that, the electrode freshly coated with the fBLM in the Aβ absence was used for each immersion measurement. The transient of current flowing to the electrode brought into contact with the electrolyte at a controlled potential, was measured. Insets (a) and (b) to Fig. 1 show characteristic current transients recorded at potentials negative and positive to Epzfc, respectively. The transients were integrated, and the corresponding charge was plotted as a function of the applied potential. The intercept corresponding to zero charge density shows that the Epzfc is equal to 0.11 ± 0.02 V vs. Ag/AgCl.
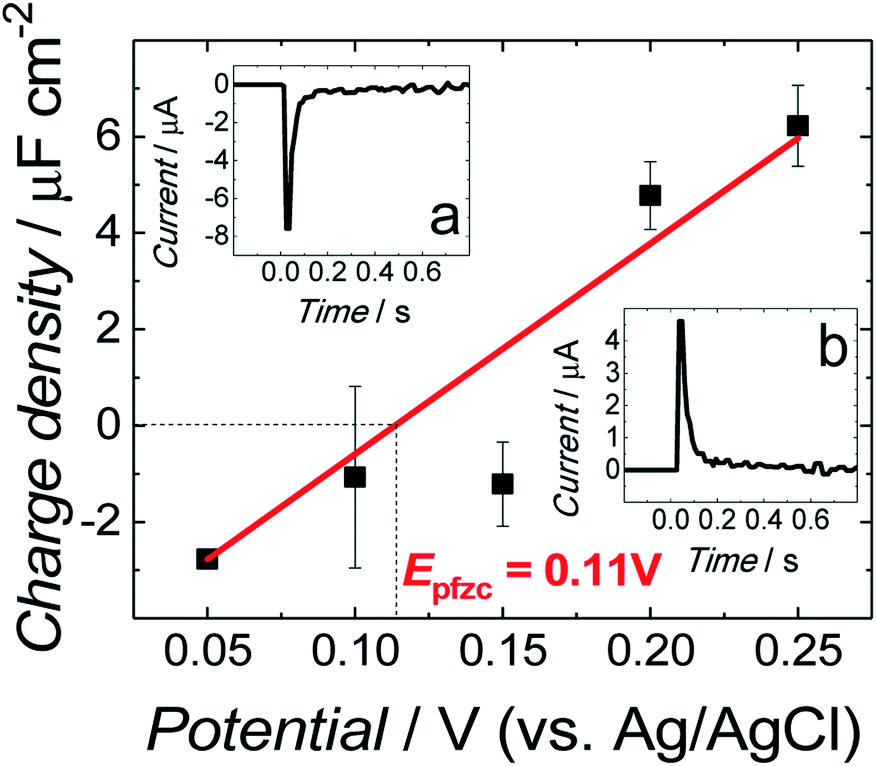 | ||
| Fig. 1 Charge density as a function of potential for fBLM in the PBS (0.01 M phosphate buffer, 0.0027 M KCl and 0.137 M NaCl, pH = 7.4) solution. Insets show current transients recorded for fBLM at (a) 0.05 V and (b) 0.25 V vs. Ag/AgCl in the same PBS solution. | ||
Differential capacitance (DC) measurements were performed using PG590 potentiostat/galvanostat (HEKA, Pfalz, DE) and a lock-in amplifier (EG&G Instruments 7265 DSP, Wellesley, MA, US). The DC vs. potential curves were measured in the potential range of 0.3 to −0.9 V vs. Ag/AgCl, at a scan rate of 20 mV s−1. The results were collected using custom-designed software. The capacity was calculated from the in-phase and out-of-phase components of the ac signal treating the electrochemical interface as a simple series RC equivalent electrical circuit.
Electrochemical impedance spectroscopy (EIS) measurements were conducted using the Solartron SI 187 electrochemical interface and Solartron SI 1260 impedance/gain-phase analyzer (Ametek Scientific Instruments, Depew, NY). The EIS spectra were acquired in the potential range of 0.3 to −0.4 V vs. Ag/AgCl. During EIS measurements, an excitation sinusoidal signal of the amplitude of 10 mV was applied, and the spectra were recorded in the frequency range of 103 to 0.06 Hz. The data were analyzed and interface modeled using ZView software (Scribner Associates Inc.).
2.6 PM-IRRAS measurements
PM-IRRAS experiments were performed using Thermo Nicolet Nexus 8700 spectrometer (Madison, WI). The spectrometer was equipped with an external tabletop optical mount (TOM) box. A CaF2 equilateral prism (BoXin, Changchun, CN) was used. The prism was first washed with methanol, and then with Milli-Q® water followed by 15 min treatment in the UV-ozone cleaner (Jelight, Irvine, USA). The PM-IRRAS spectra for each spectral region of interest were recorded in a separate experiment. For large enhancement of the mean-square electric-field strength, the half-wave retardation of the photoelastic modulator (PEM) was adjusted at 1600 and 2900 cm−1, and the incidence angle was adjusted to 60 and 57° for spectra recording in the C![[double bond, length as m-dash]](https://www.rsc.org/images/entities/char_e001.gif) O stretching/CH2 scissoring and C–H stretching vibration regions, respectively. The spectro-electrochemical cell was filled with the PBS (pH = 7.4) solution prepared with D2O to avoid spectral interference of the H2O bands. The spectral resolution was 4 cm−1. For spectra recording, 4000 scans were acquired, and then averaged in the potential range of 0.40 to −0.40 V vs. Ag/AgCl. Corrections for the PEM response functions were applied, as previously described.30 Fourier self-deconvolution analysis (FSD) was performed using the bandwidth of 25–32 cm−1 and the enhancement factor of 2.5 depending on the spectral region of examination.
O stretching/CH2 scissoring and C–H stretching vibration regions, respectively. The spectro-electrochemical cell was filled with the PBS (pH = 7.4) solution prepared with D2O to avoid spectral interference of the H2O bands. The spectral resolution was 4 cm−1. For spectra recording, 4000 scans were acquired, and then averaged in the potential range of 0.40 to −0.40 V vs. Ag/AgCl. Corrections for the PEM response functions were applied, as previously described.30 Fourier self-deconvolution analysis (FSD) was performed using the bandwidth of 25–32 cm−1 and the enhancement factor of 2.5 depending on the spectral region of examination.
2.7 Tilt angle calculations
The integrated intensity of an IR band depends on the angle (θ) between the transition dipole moment of that vibration and the electric field vector of the photon. Because the electric field vector of the p-polarized photon is perpendicular to the metal surface, the angle between the transition dipole moment and surface normal can be calculated using the following expression: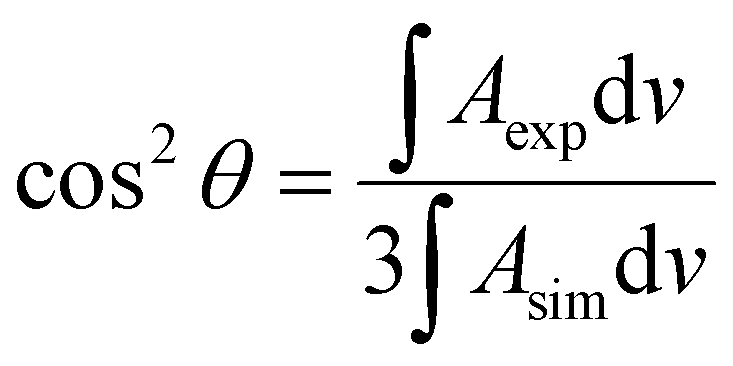 | (1) |
The bands of symmetric (νs) and asymmetric (νas) methylene stretches were used to calculate the average tilt angle of the acyl chains of the lipid molecules. Directions of the transition dipoles of symmetric and asymmetric methylene stretches are perpendicular to each other and are perpendicular to the direction of the all-trans stretched acyl chains of lipids. Eqn (1) was used to determine angles between the surface normal and transition dipoles of the symmetric (θs) and asymmetric (θas) methylene stretches. The average tilt angle of trans fragments of the acyl chains (θtilt) could then be calculated using the following expression:30
| cos2θs + cos2θas + cos2θtilt = 1 | (2) |
3. Results and discussion
3.1 Electrochemical measurements
Differential capacitance (DC) measurements were performed to assess the quality and stability of the floating bilayer lipid membrane in the Aβ absence (fBLM) as well as in the presence of Aβ monomers (fBLM-AβMs) and Aβ oligomers (fBLM-AβOs). Fig. 2 shows DC vs. potential curves for the membrane-free Au electrode (curve 1) as well as the Au electrode coated with fBLM (curve 2), with fBLM-AβMs (curve 3), and with fBLM-AβOs (curve 4) in the potential range of 0.3 to −0.9 V vs. Ag/AgCl. The upper abscissa plots the transmembrane potential equal to (E–Epzfc). For all fBLMs, capacitance is the lowest at 0.1 V vs. Ag/AgCl, thus indicating the highest stability at Epzfc. The lowest value of capacitance for the fBLM is equal to 7.3 μF cm−2, a value typical for fBLMs.22,32 In the presence of either AβMs or AβOs, the minimum value of capacitance increases to 14.6 or 16.8 μF cm−2, respectively, thus indicating a decrease in the membrane quality. When the electrode potential becomes more negative, the capacitance of electrodes coated with the three membranes gradually increases. The bilayer starts detaching at −0.60 V vs. Ag/AgCl, as manifested by a characteristic desorption/detachment peak at −0.70 V vs. Ag/AgCl. The DC vs. potential curves indicate that all three membranes are unstable at potentials more negative than −0.60 V vs. Ag/AgCl. Therefore, all further measurements were performed at E > −0.40 V vs. Ag/AgCl, i.e., where electrode wetting does not occur.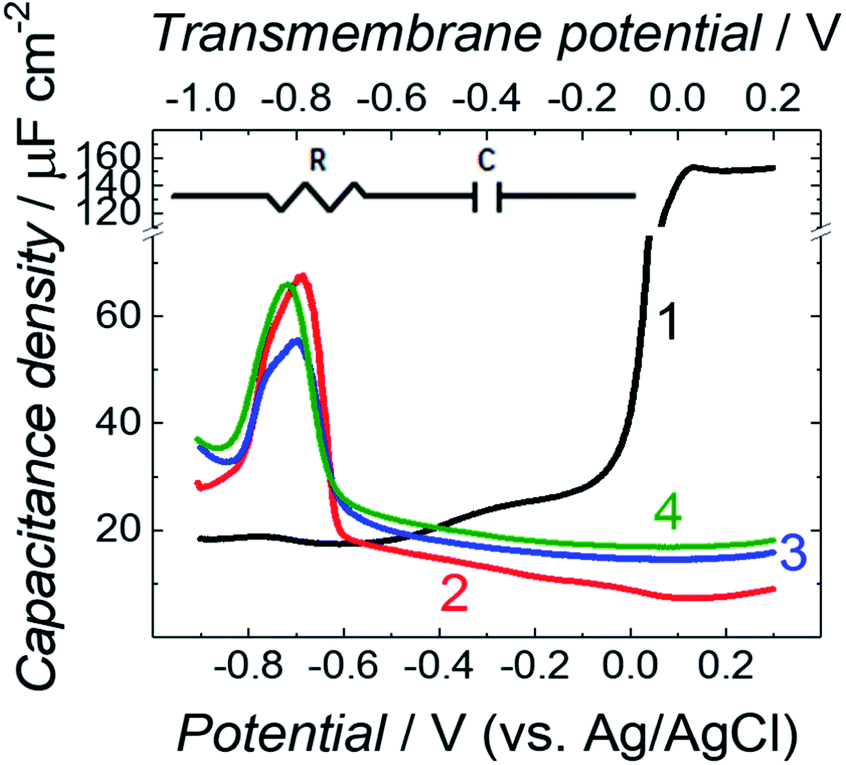 | ||
| Fig. 2 Differential capacitance vs. potential curves for the membrane-free Au electrode (curve 1), Au electrode coated with fBLM (curve 2), fBLM-AβM (curve 3), and fBLM-AβO (curve 4) in the PBS (0.01 M phosphate buffer, 0.0027 M KCl, and 0.137 M NaCl, pH = 7.4) solution. The upper abscissa plots the transmembrane potential that accounts for the potential of zero free charge (Epzfc = 0.11 V vs. Ag/AgCl). Inset shows an equivalent electric circuit used to determine the capacitance values. | ||
The capacitance values (Fig. 2) were determined using a simplified RC in series equivalent electric circuit, showed as inset in Fig. 2. They provide useful information about the potential range where the bilayers are stable. More precise details on the electrical properties of the bilayers can be obtained from electrochemical impedance spectroscopy (EIS) measurements and fitting of an appropriate equivalent electric circuit to the EIS data acquired. These data can also provide information about the pore/defect forming abilities of Aβ. Fig. 3 shows plots of Bode impedance vs. frequency in the range of 1000 to 0.06 Hz for fBLM-AβMs (Fig. 3a and c) and fBLM-AβOs (Fig. 3b and d) at constant potentials in the range of 0.30 to −0.40 V vs. Ag/AgCl. The EIS data for the fBLM are shown in Fig. S2 in ESI.†
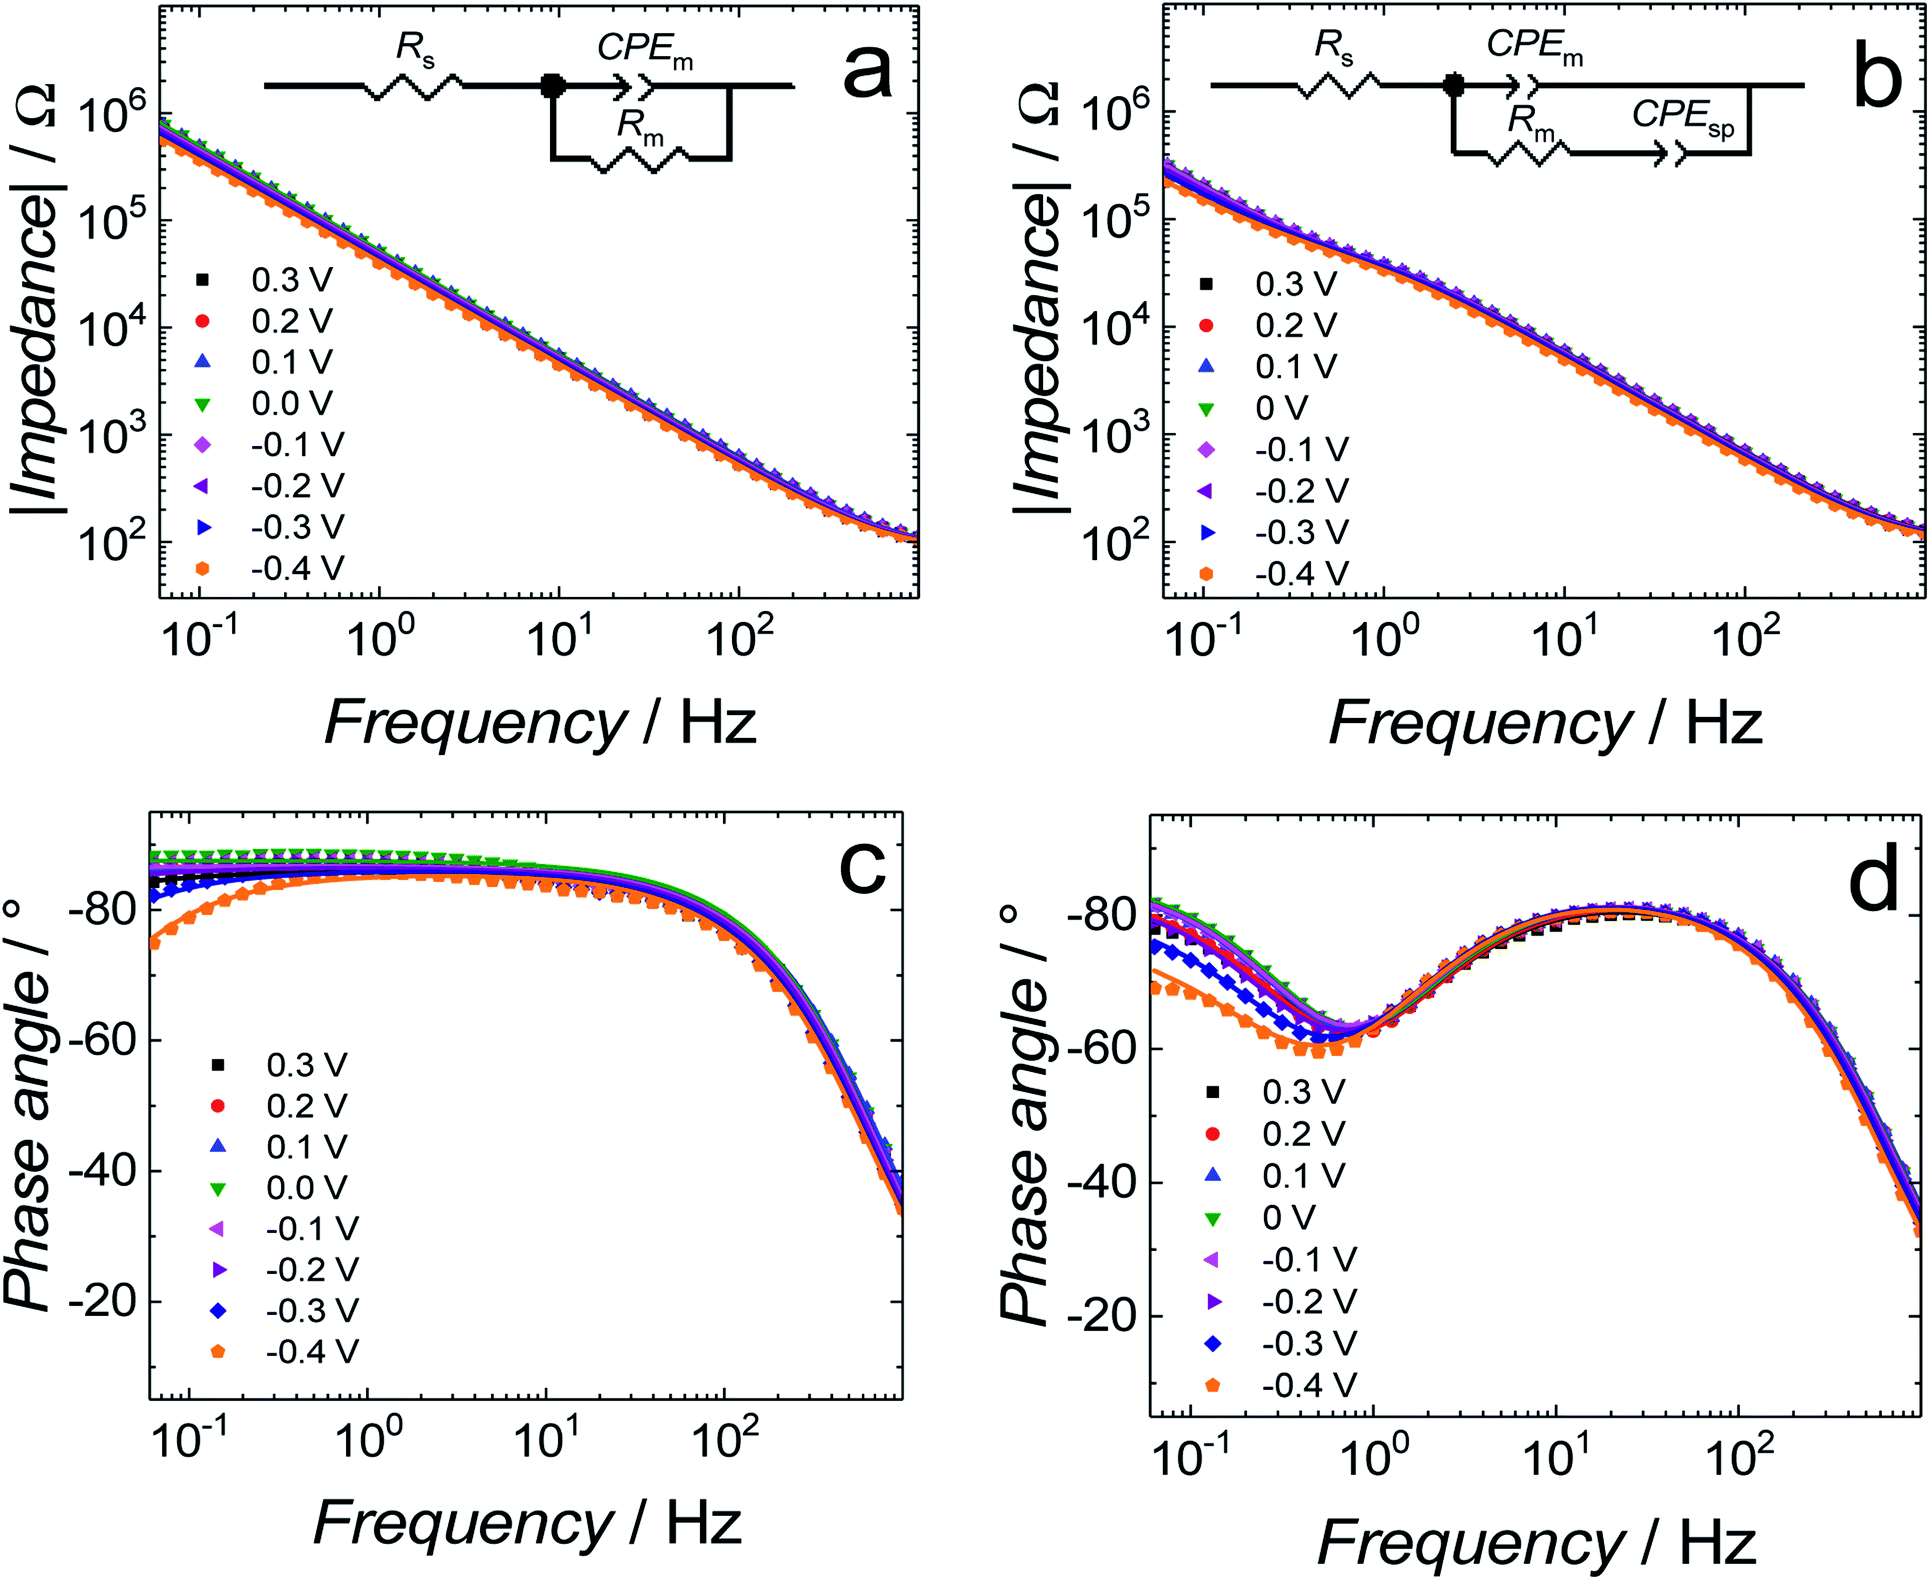 | ||
| Fig. 3 (a and b) Impedance and (c and d) phase angle as a function of frequency for (a and c) fBLM-AβMs and (b and d) fBLM-AβOs in the PBS (0.01 M phosphate buffer, 0.0027 M KCl and 0.137 M NaCl, pH = 7.4) solution at different potentials. Symbols and lines of the same colors represent experimental data and results of fitting of parameters of the equivalent electrical circuits to the EIS data, respectively, for the same measurement at a single potential. Rs and Rm – solution and membrane resistance, respectively; CPEm and CPEsp – constant-phase element for the membrane and sub membrane (spacer) region, respectively. | ||
Fig. 3a and b show the dependence of absolute impedance on frequency for fBLM-AβMs and fBLM-AβOs, respectively. Fig. S2a† shows a similar plot for the fBLM. The impedance vs. frequency curves are almost linear for fBLM and fBLM-AβMs, which is typical for capacitive systems.33 Their respective phase angle vs. frequency plots (Fig. S2b† and 3c) display a plateau with the phase angle values exceeding 80°, thus indicating that the impedance is largely controlled by the membrane capacitance. The phase angle decreases with the frequency decrease below 1 Hz for the two most negative potentials, i.e., −0.30 and −0.40 V vs. Ag/AgCl. This behavior is characteristic of the pores/defects formation in the membrane because of electroporation.34–36 For the fBLM-AβOs membrane, the impedance vs. frequency curve (Fig. 3b) displays a “step-like” feature below 1 Hz. The corresponding phase angle vs. frequency curve (Fig. 3d) reveals a characteristic minimum at ∼0.8 Hz. This minimum indicates the poration of the membrane by AβOs.33,37 This experiment was repeated four times and the average values of frequency (fmin) and phase angle (ϕmin) at the minimum of the phase angle curve are plotted as a function of potential in Fig. 4a and b, respectively. Apparently, the fmin and ϕmin are potential independent for transmembrane potentials higher than −0.20 V. In addition, the minimum in the phase angle vs. frequency plot (Fig. 3d) is symmetric. Both fmin and ϕmin decrease with the transmembrane potential decrease at potentials more negative than −0.20 V. Concomitantly, the minimum in the phase angle vs. frequency plot (Fig. 3d) becomes asymmetric.
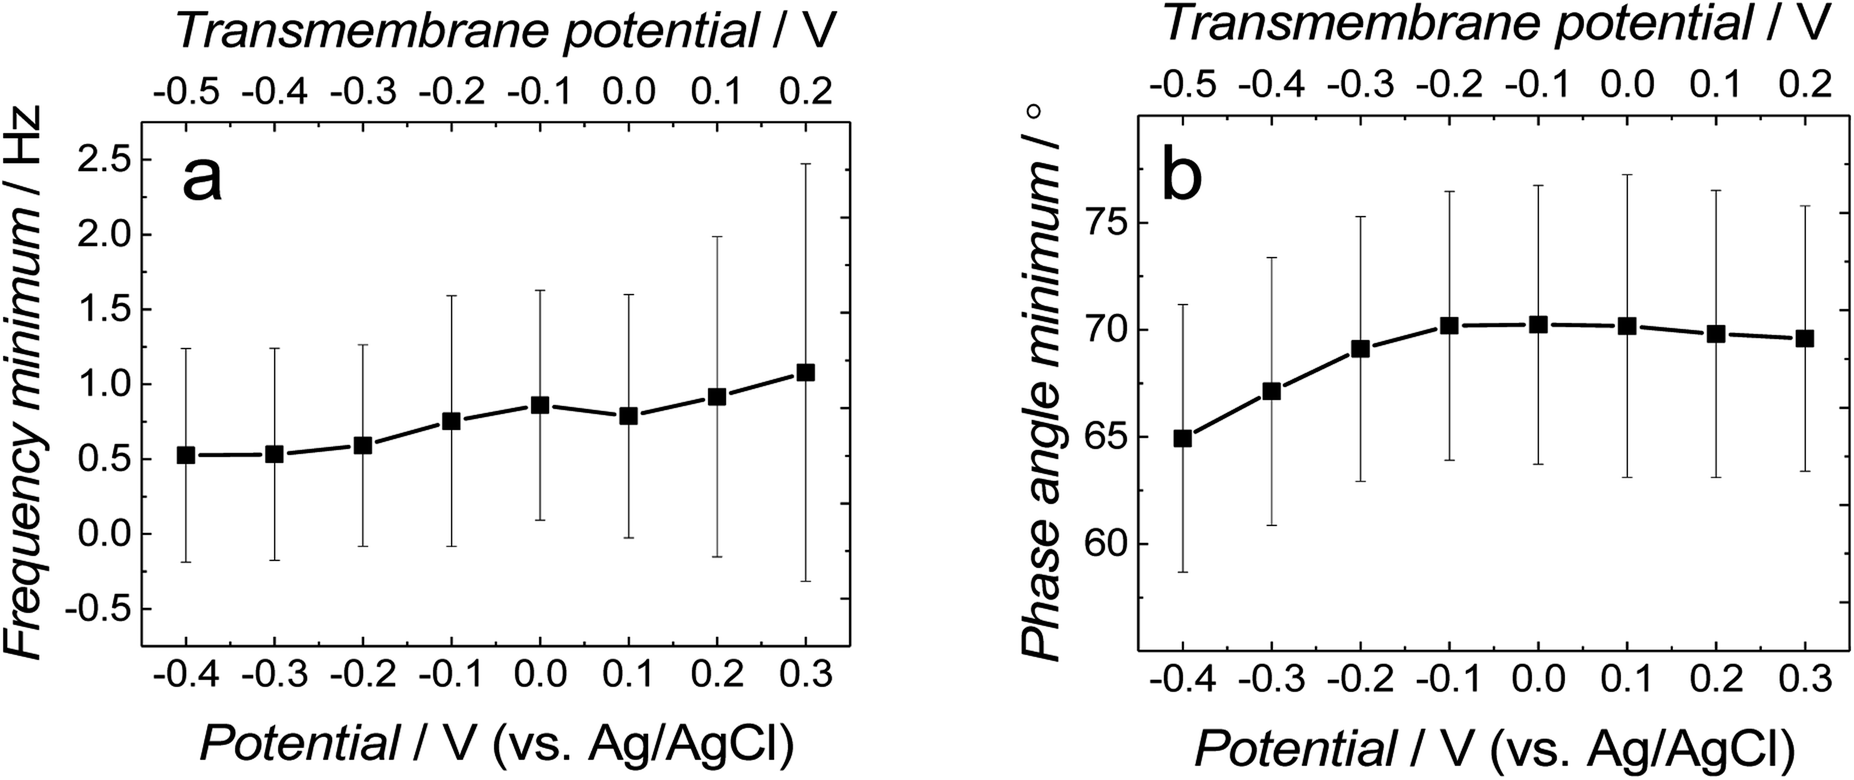 | ||
| Fig. 4 The change of (a) frequency and (b) phase angle at the phase angle vs. frequency minimum as a function of potential for fBLM-AβO in the PBS (0.01 M phosphate buffer, 0.0027 M KCl and 0.137 M NaCl, pH = 7.4) solution. The upper abscissa plots the transmembrane potential that accounts for the potential of zero free charge (Epzfc = 0.11 V vs. Ag/AgCl). | ||
The shape and position of the phase angle vs. frequency minimum depends on the density and distribution of membrane defects.37 For homogeneous distribution of defects, the ϕmin is independent of the defects density and the fmin shifts towards higher frequencies with the increase of the defects density. Typically, defects distribution is homogeneous in the lipid bilayers in the presence of peptides, such as α-hemolysin and alamethicin.19,37,38 For heterogeneous defects distribution (defect clusters), defect density increase causes the ϕmin increase and the fmin shift towards higher frequencies that is much less pronounced than that in the case of homogeneous defects distribution. In the presence of vaginolysin, membrane pores clustered in the lipid bilayers.33 Therefore, the phase angle vs. frequency minimum shift towards lower phase angles and a minor shift with frequency at transmembrane potentials lower than −0.20 V (Fig. 3d and 4) would suggest a decrease in the defect density. However, the membrane is electroporated in this potential range. That is, small pores are formed in addition to the pores generated by AβOs. Therefore, the defect density should be higher and not lower, as earlier suggested.37 However, all simulations concerning homogeneous and heterogeneous defects distribution were made for membranes containing pores of the same radius.37 Our AFM data16 showed that Aβ generated pores of different sizes in the lipid bilayers. To examine whether the change in the pore radius affects the position of the phase angle vs. frequency minimum or not, the EIS spectra for the membrane containing pores of different radii were simulated (Fig. S3a and b†). This modeling was performed using the previously adopted approach.37 Fig. S3b† shows that the increase in the pore radius causes a shift of the phase angle vs. frequency minimum towards both higher phase angles and frequencies. Therefore, not only changes of density of the pores but also changes of the pore size significantly influences the position of the phase angle vs. frequency minimum. If this behavior (Fig. 3d and 4) is considered, it is then evident that only big pores generated by AβOs are present in the membrane at transmembrane potentials more positive than −0.20 V. However, at potentials more negative than −0.20 V, additional small pores are generated because of electroporation. Hence, a shift of the phase angle vs. frequency minimum towards lower phase angles and frequencies indicates a decrease of the average pore radius. These results demonstrate that the change in the pore size significantly affects EIS spectral features and should be taken into account when interpreting the results. Moreover, it reveals the fundamental difference between properties of ion channels formed by other peptides, like α-hemolysin or alamethicin,19,37,38 and defects/pores formed by AβOs.
Fig. S3c† compares absolute impedance values determined at 0.8 Hz, i.e., the frequency at which phase angle vs. frequency minimum is present (Fig. 3d), for all three fBLMs as a function of the electrode potential. For all three membranes, the impedance displays a maximum at ∼0 V vs. Ag/AgCl, i.e., the potential slightly more negative than Epzfc. Apparently, either positive or negative charging of the electrode decreases membrane impedance. Significantly, impedance is the highest for fBLM and the lowest for fBLM-AβOs.
Further information concerning the electrical properties of the three fBLMs was obtained by fitting an equivalent electric circuit to the EIS data. For fBLM and fBLM-AβMs, a simple equivalent circuit (inset in Fig. 3a) was used, where Rs and Rm are solution and membrane resistance, respectively, and CPEm is the membrane constant-phase element. The EIS measurements indicate that the presence of AβMs does not lead to the formation of pores in the membrane (there is no minimum in the phase angle vs. frequency plot). For the fBLM-AβOs, the equivalent circuit proposed by Valincius36 (inset in Fig. 3b) was used. This circuit introduces a constant phase element of the sub membrane (spacer) region (CPEsp), which accounts for the electrical properties of the hydrated Tg monolayer separating the membrane from the gold surface. In the presence of pores, ions may travel between the submembrane region and the solution bulk, thus affecting properties of this region. The impedance of the constant phase element is defined as:
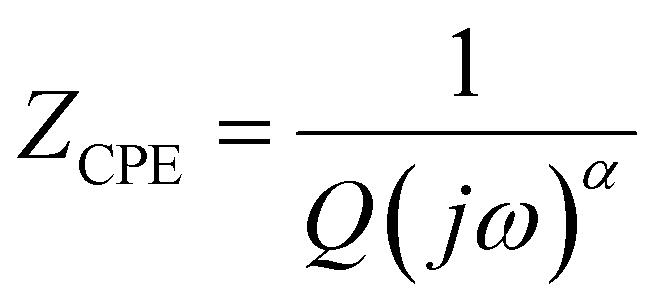 | (3) |
Symbols in Fig. 3 and in Fig. S2 in ESI† show experimental data and solid curves represent the fitting of the equivalent circuits to the experimental data. Numerical values of elements of the equivalent circuits are reported in Table S1 in ESI.† The Qm values can be considered as representing membrane capacitance because αm parameters are close to 1. Fig. 5a compares membrane capacitance (Qm) vs. potential curves for the three fBLMs. Qualitatively, they agree well with the corresponding DC vs. potential curves (Fig. 2). All three curves display a broad minimum at (E–Epzfc) ∼ −0.1 V. The addition of AβMs or AβOs to the fBLM results in the increase of the membrane capacitance at all potentials. For fBLM, the Qm in the presence of AβOs is higher than that in the presence of AβMs. Capacitance is defined as ε/d, where ε is electric permittivity and d is the membrane thickness. Our previous AFM study demonstrated16 that BLM thickness was not affected by the presence of AβOs.16 Therefore, the increase of the membrane capacitance could be explained in terms of an increase of the membrane permittivity. This explanation is consistent with that of Valincius et al.,39 who proposed that AβOs caused a local increase in the membrane electric permittivity without membrane thinning and in that way decreased the membrane barrier to ion transport. Our previous AFM study showed16 that small AβOs generated pores in the BTLE lipid bilayer, which were larger than ion channels. Therefore, the AβO-induced membrane capacitance changes could result from the AβO-induced pore formation/lipid extraction mechanism.16 Earlier electrochemical studies suggested that the membrane was not porated by AβO.39–41 However, our results indicate the increase of the membrane capacitance with the AβOs activity increase leading to membrane poration.
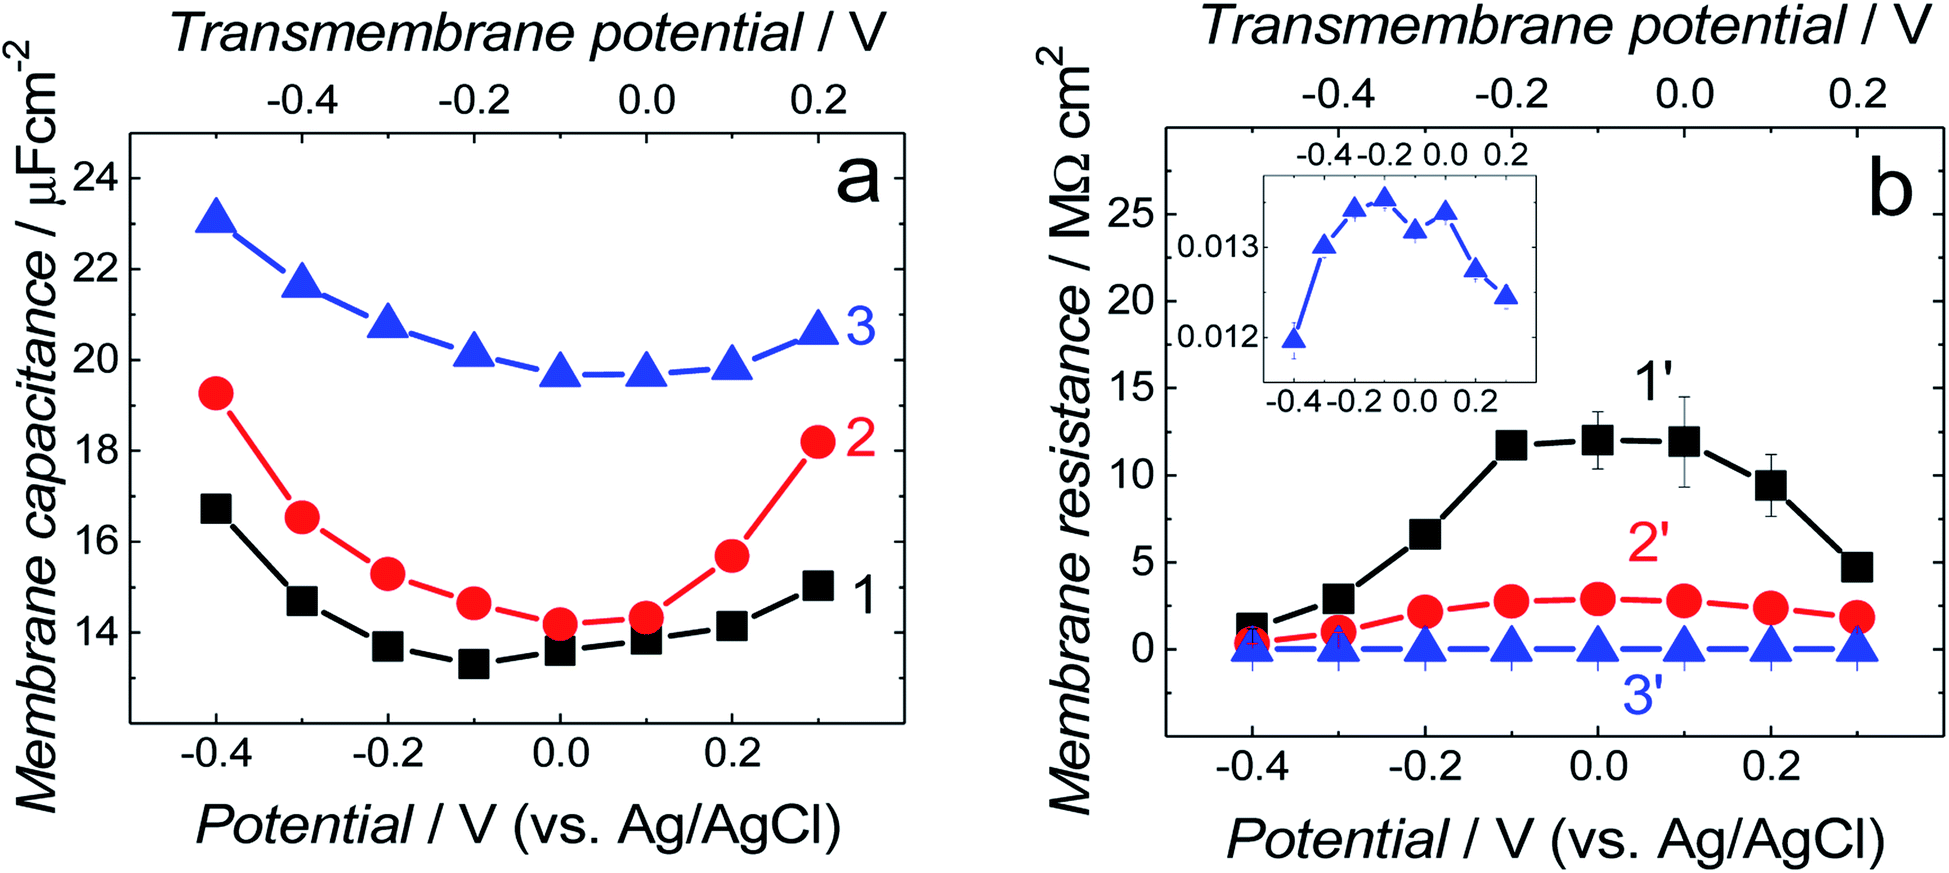 | ||
| Fig. 5 Potential dependence of membrane (a) capacitance (Qm) and (b) resistance (Rm) for the fBLM (curves 1 and 1′), fBLM-AβMs (curves 2 and 2′), and fBLM-AβOs (curves 3 and 3′) at different potentials in the PBS (0.01 M phosphate buffer, 0.0027 M KCl and 0.137 M NaCl, pH = 7.4) solution. Inset shows the magnified Rmvs. potential curve for fBLM-AβOs. The upper abscissa plots the transmembrane potential that accounts for the potential of zero free charge (Epzfc = 0.11 V vs. Ag/AgCl). | ||
Fig. 5b compares membrane resistance changes with potential for the three membranes. Each curve displays a maximum at the transmembrane potential of ∼−0.10 V, which well corresponds to the position of minima in the Qmvs. potential curves in Fig. 5a. The Rm rapidly decreases at both positive and negative potentials (Fig. 5b). The maximum Rm value for the fBLM is ∼4 and ∼1200 times higher than that for fBLM-AβMs and fBLM-AβOs, respectively. Very low Rm values for fBLM-AβOs are consistent with the pore formation by AβOs, observed in our previous study.16
Fig. S4† presents plots of the capacitance of the spacer layer (Qsp) and coefficient αsp for fBLM-AβOs as a function of electrode potential. The minimum of Qsp and maximum of αsp is displayed at transmembrane potential ∼−0.10 V, thus indicating the highest impedance of the sub membrane region and demonstrating capacitive behavior at this potential (see, eqn (3)). The Qsp increase (Zsp decrease) at both more positive and more negative potentials is associated with the decrease of αsp, thus suggesting that the impedance of CPEsp at this potential is more resistive. This behavior is consistent with electroporation and AβO assisted membrane poration.
3.2 IR spectroscopy measurements
PM-IRRAS studies allow determination of conformation and orientation of both phospholipids and Aβ molecules in the membrane and their dependence on the external electric field. The C–H vibration modes (located in the spectral range of 3100–2800 cm−1), CO vibration modes (1800–1700 cm−1) and CH2 vibration modes (1550–1350 cm−1) provide information about geometric properties of phospholipid molecules. The amide I band region (1700–1600 cm−1) is useful for the determination of Aβ properties. Present PM-IRRAS measurements were performed in the potential range of +0.40 to −0.40 V vs. Ag/AgCl.
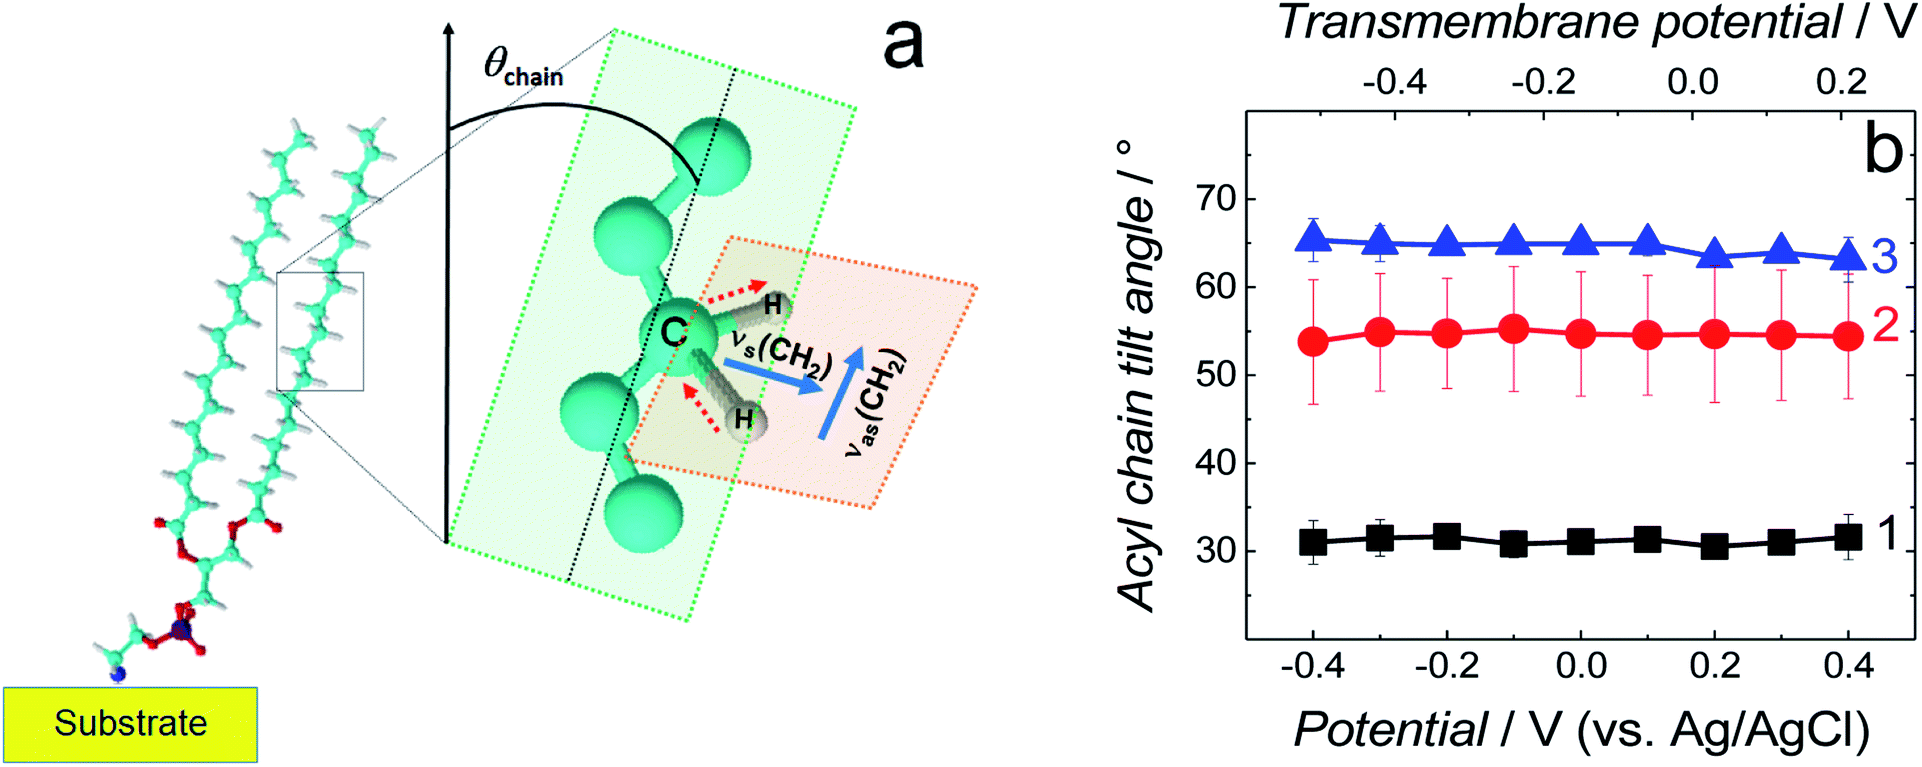 | ||
| Fig. 6 (a) Schematic diagram of the DSPE molecule showing directions of the transition dipole moments of the symmetric (νs(CH2)) and asymmetric (νas(CH2)) methylene stretches for a lipid acyl chain as well as the tilt angle (θchain) of acyl chains [adapted from ref. 42]. (b) The tilt angle of lipid acyl chains as a function of potential for the fBLM (curve 1), fBLM-AβM (curve 2) and fBLM-AβO (curve 3) in PBS/D2O (0.01 M phosphate buffer, 0.0027 M KCl and 0.137 M NaCl, pH = 7.4) solution. The upper abscissa plots the transmembrane potential that accounts for the potential of zero free charge (Epzfc = 0.11 V vs. Ag/AgCl). | ||
Position and width of v(CH2)s and v(CH2)as bands provide information on the phospholipid acyl chain conformation and mobility in the membrane. Positions of the two CH2 stretching bands are potential independent for both fBLM-AβMs and fBLM-AβOs (Fig. 7a and b). In contrast, these bands for fBLM are shifted to higher wavenumbers at negative potentials. This effect is more pronounced for the asymmetric band (curve 1 in Fig. 7b). The v(CH2)s and v(CH2)as wavenumbers lower than 2850 and 2920 cm−1, respectively, are characteristic of the gel state of the bilayer, in which acyl chains are fully stretched and assume the all-trans conformation.42 Wavenumbers values of the two bands correspond to the gel state of fBLM in the absence of Aβ (Fig. 7a and b). In the presence of either AβMs or AβOs, these bands shift towards higher wavenumbers which indicates partial melting of the chains. This shift is more pronounced for the v(CH2)as band than for the v(CH2)s band. These results indicate that lipids have an increased number of gauche conformers in the presence of both AβMs and AβOs, thus indicating lipid acyl chains melting by both Aβ forms.45,46 The chain melting is more pronounced in the presence of AβOs than in the presence of AβMs. For all three membranes, widths of the v(CH2)as and v(CH2)s bands are potential independent (Fig. 7c and d). However, the presence of either AβMs or AβOs induces a significant decrease in the width of both bands. This behavior indicates an Aβ-induced decrease of lipid acyl chain mobility.45,47
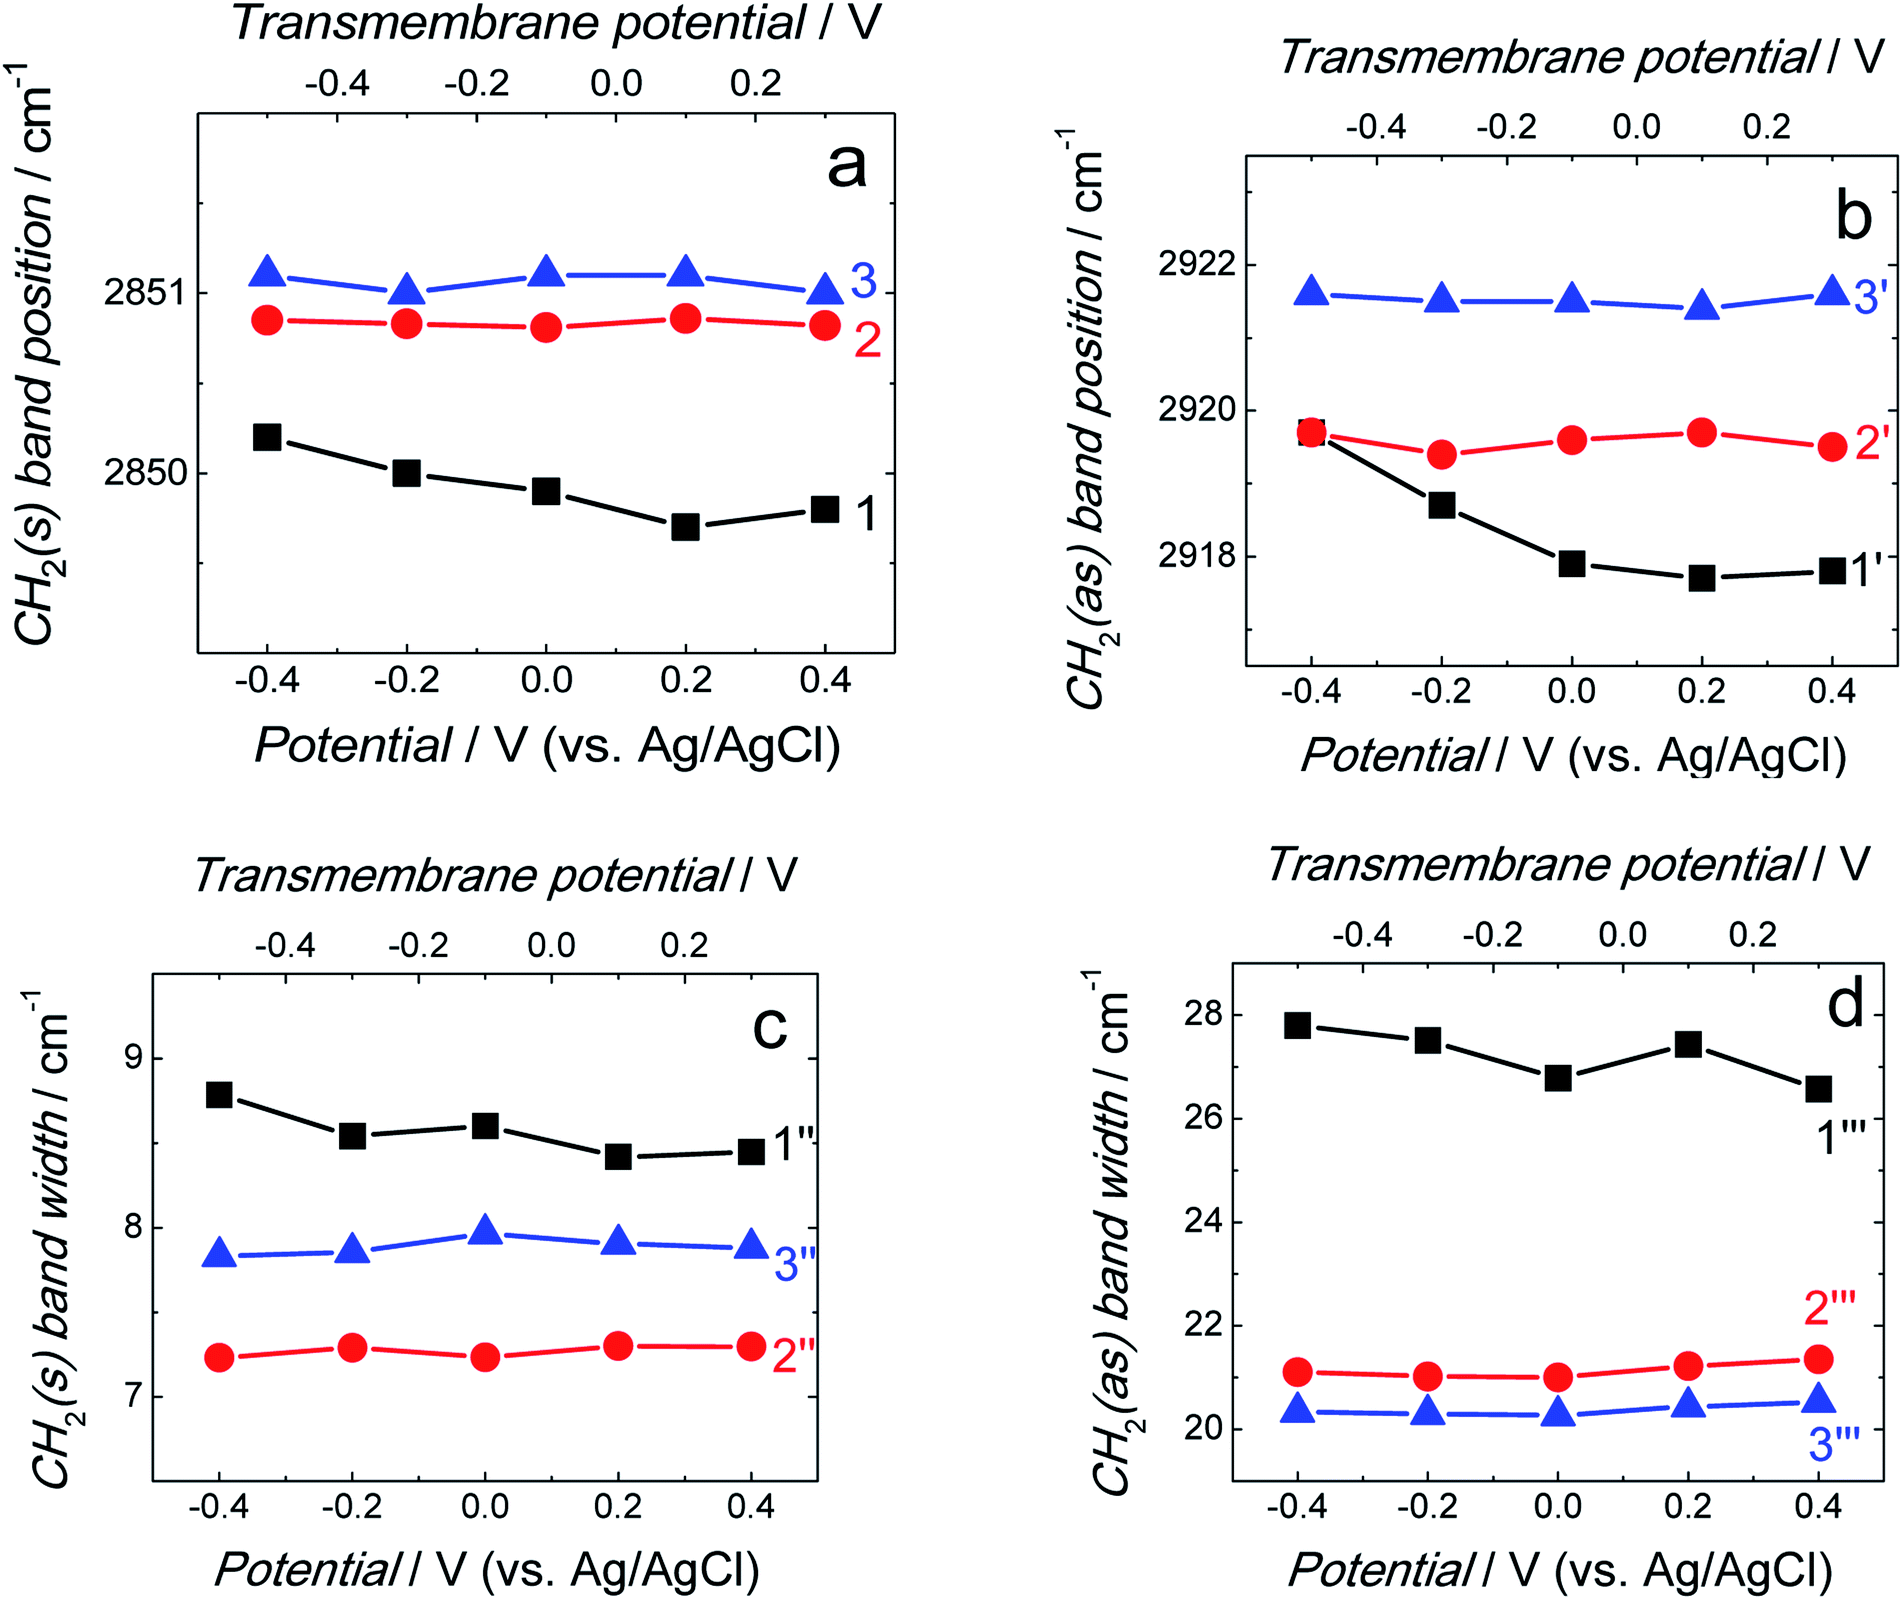 | ||
| Fig. 7 (a and b) Position and (c and d) width of the (a and c) v(CH2)s and (b and d) v(CH2)as bands as a function of potential for fBLM (curves 1, 1′, 1′′, and 1′′′), fBLM-AβM (curves 2, 2′, 2′′, and 2′′′), and fBLM-AβO (curve 3, 3′, 3′′, and 3′′′) in the PBS/D2O (0.01 M phosphate buffer, 0.0027 M KCl and 0.137 M NaCl, pH = 7.4) solution. CH2(s) and CH2(as) stand for symmetric and asymmetric CH2 stretching vibrations, respectively. The upper abscissa plots the transmembrane potential that accounts for the potential of zero free charge (Epzfc = 0.11 V vs. Ag/AgCl). | ||
The spectra in the C–H stretching region showed that the amyloids induce not only changes in the orientation and conformation of lipid molecules but also decrease the mobility of their acyl chains. These changes differ from typical temperature-induced phospholipid chain melting where conformational disordering is accompanied by increased lipid acyl chain mobility.48
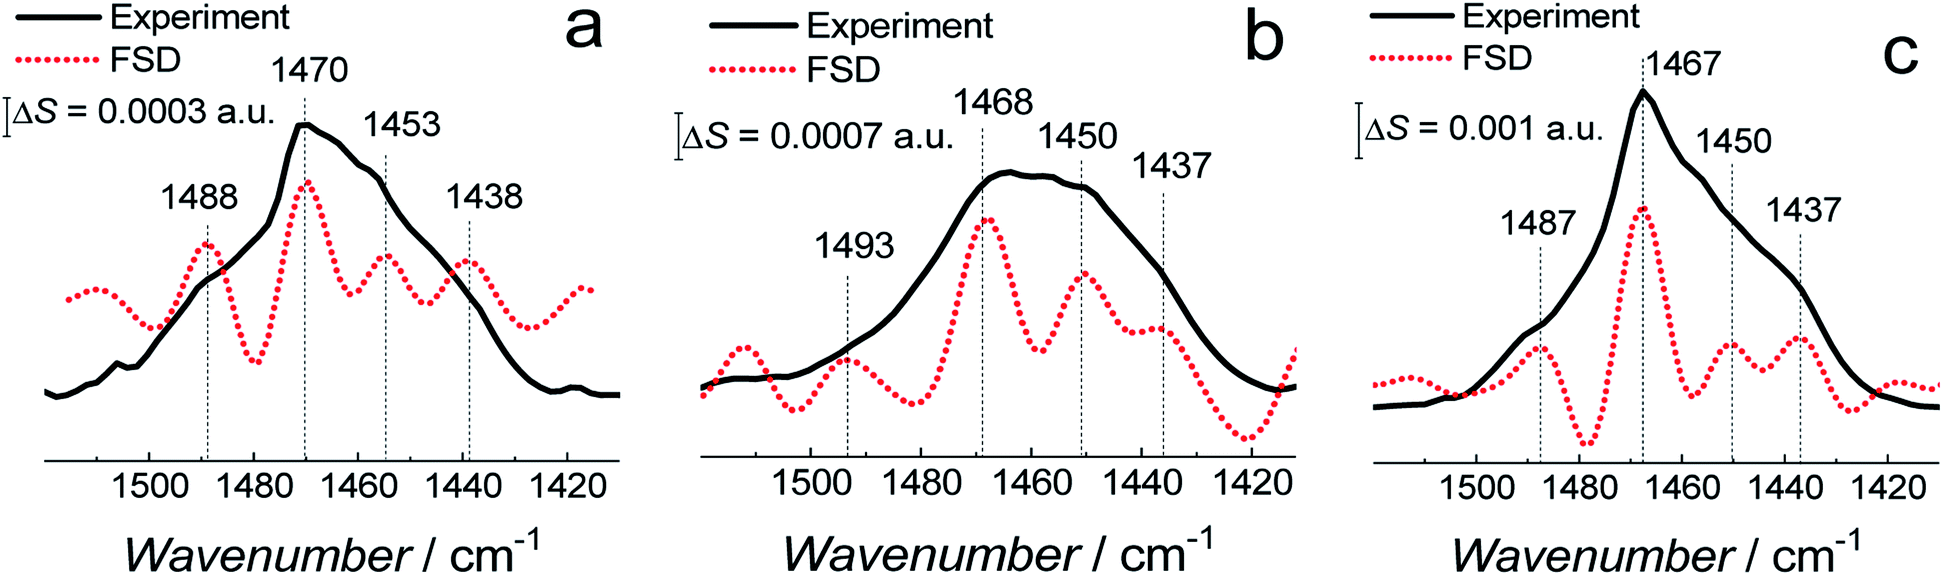 | ||
| Fig. 8 The PM-IRRAS spectra (black solid curves) in the CH2 scissoring vibration band region and corresponding FSD spectra (red dotted curves) for (a) fBLM, (b) fBLM-AβMs, and (c) fBLM-AβOs in the PBS/D2O (0.01 M phosphate buffer, 0.0027 M KCl and 0.137 M NaCl, pH = 7.4) solution. | ||
The δ(CH2) scissoring band shifts from 1470 cm−1 for fBLM to 1468 and 1467 cm−1 for fBLM-AβMs and fBLM-AβOs, respectively. These shifts indicate that in the presence of both Aβ forms, packing of lipid molecules changes from triclinic to hexagonal unit cell.50–53
![[double bond, length as m-dash]](https://www.rsc.org/images/entities/b_char_e001.gif) O stretching vibration mode of lipids.
The 1800–1700 cm−1 region of PM-IRRAS spectra contains a band corresponding to the ester carbonyl CO stretching vibration of the glycerol moiety of the phospholipid molecule (Fig. 9a). The PM-IRRAS spectra and the corresponding FSD analysis for the three bilayers at different potentials are shown in Fig. S7 in ESI.† The spectra are independent of the potential applied. Therefore, they were averaged and normalized to improve S/N (Fig. 9b).
O stretching vibration mode of lipids.
The 1800–1700 cm−1 region of PM-IRRAS spectra contains a band corresponding to the ester carbonyl CO stretching vibration of the glycerol moiety of the phospholipid molecule (Fig. 9a). The PM-IRRAS spectra and the corresponding FSD analysis for the three bilayers at different potentials are shown in Fig. S7 in ESI.† The spectra are independent of the potential applied. Therefore, they were averaged and normalized to improve S/N (Fig. 9b).
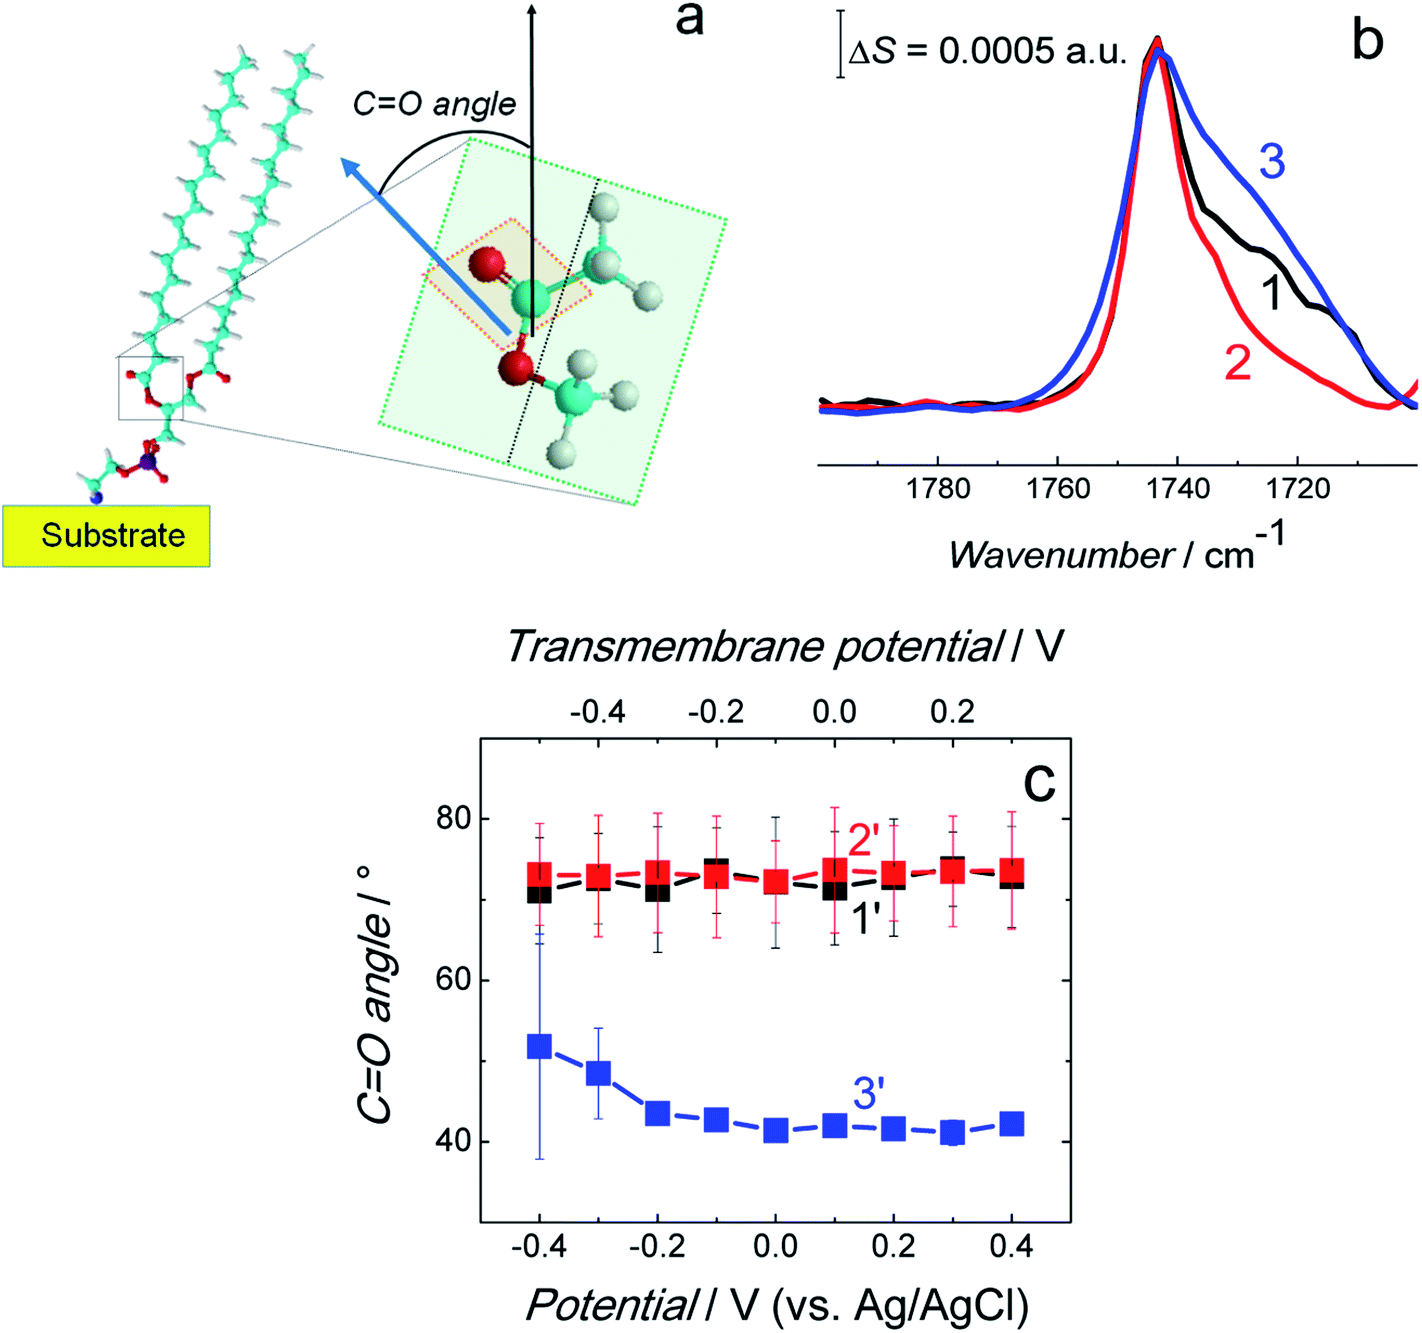 | ||
| Fig. 9 (a) Scheme showing the CO bond angle between the surface normal (black arrow) and direction of the transition dipole moment of the CO bond (blue arrow). (b) Normalized and averaged PM-IRRAS spectra in the CO stretching vibration region for the fBLM (curve 1), fBLM-AβMs (curve 2), and fBLM-AβOs (curve 3) in the PBS/D2O (0.01 M phosphate buffer, 0.0027 M KCl and 0.137 M NaCl, pH = 7.4) solution. Each spectrum is an average of five spectra shown in Fig. S7.† (c) The CO bond angle for the fBLM (curve 1′), fBLM-AβM (curve 2′), and fBLM-AβO (curve 3′) as a function of potential. The upper abscissa plots the transmembrane potential that accounts for the potential of zero free charge (Epzfc = 0.11 V vs. Ag/AgCl). | ||
The FSD analysis showed a band at ∼1743 cm−1 corresponding to the non-hydrogen bonded (dehydrated) carbonyl group and two bands at ∼1731 and ∼1724 cm−1 corresponding to the hydrogen bonded (hydrated) carbonyl group (Fig. S8a–c†). The deconvolution of the CO band revealed that sub bands corresponding to non-hydrogen bonded and hydrogen bonded carbonyl group occupy a similar area in fBLM and fBLM-AβOs (Fig. S8d and f in ESI†). This feature indicates that the content of non-hydrated and hydrated lipid heads in these two samples is similar. In fBLM, 52 and 48% of the lipid heads were non-hydrated and hydrated, respectively. In fBLM-AβO, 55 and 45% of the lipid heads were non-hydrated and hydrated, respectively. However, in fBLM-AβM, 67 and 33% of the lipid heads were non-hydrated and hydrated, respectively (Fig. S8e† in ESI†). This result suggests that AβMs, unlike AβOs, inhibit hydration of carbonyl groups.
The integrated intensity of the CO band and eqn (1) were used to calculate the angle between the direction of the transition dipole moment of the CO bond and the surface normal, i.e., the direction of CO bond angle (Fig. 9a). Fig. 9c plots the CO bond angle as a function of the potential applied for all three membranes. The CO bond angle was potential independent (within limits of experimental errors) for all three membranes. The CO bond is nearly perpendicular to the fully stretched acyl chain. Therefore, the sum of the acyl chains and the CO bond angles should be ∼90°. Indeed, the determined CO angle of ∼70° is consistent with the acyl chain tilt angle of ∼30° determined for fBLM (Fig. 6). However, the CO bond angle of ∼73° for fBLM-AβMs is unexpectedly high because the acyl chain tilt angle was ∼50°, thus resulting in the sum of these two angles to be ∼120°. Importantly, the sum of tilt angles for CO bonds and acyl chains for the fBLM-AβOs is again close to 100°. Similar value of the CO bond angle for fBLM-AβMs and fBLM, however higher sum of the CO bond and acyl chain angles, and dehydration of lipid heads determined for fBLM-AβMs higher than that for fBLM-AβOs suggest that AβMs interact with the membrane lipids in a fundamentally different way than AβOs do.
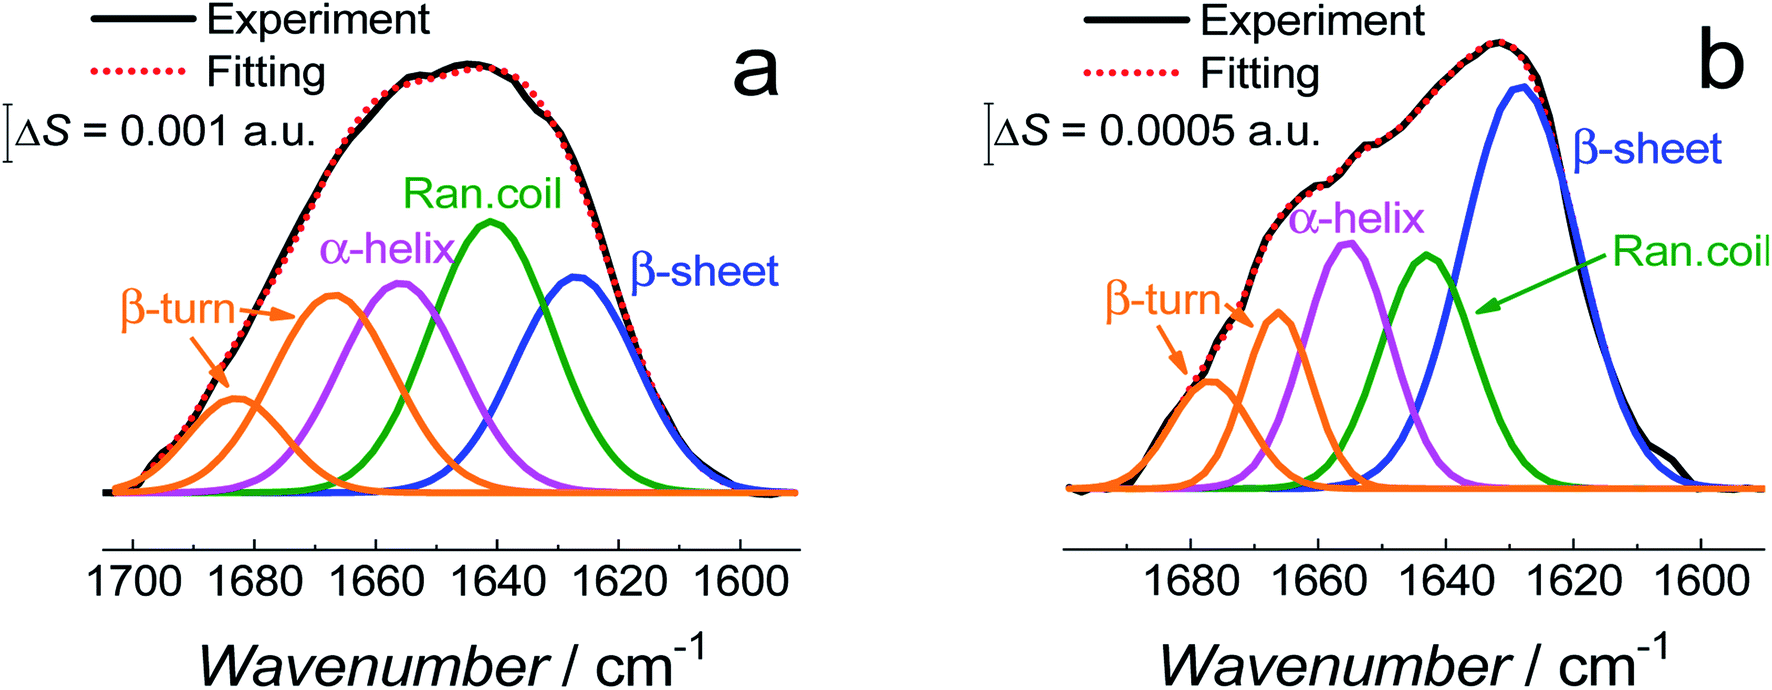 | ||
| Fig. 10 Deconvoluted amide I band region of the PM-IRRAS spectra averaged at all potentials for (a) fBLM-AβMs and (b) fBLM-AβOs in the PBS/D2O (0.01 M phosphate buffer, 0.0027 M KCl and 0.137 M NaCl, pH = 7.4) solution. | ||
Fig. 11 shows the correlation between the secondary structure content of both Aβ forms (AβMs and AβOs) and the CO bond angle of the phospholipid molecules. To obtain high enhancement of the signal in the spectral region of interest in the PM-IRRAS experiment, the aperture had to be adjusted accordingly and every spectral region of interest had to be studied in a separate experiment. The lipid CO band is located close to the amide I band of Aβ. Therefore, the signal from both regions is expected to be similarly enhanced. Hence, it was easy to directly correlate changes in the CO angle of the carbonyl glycerol ester group in the lipids with changes of the amide I band in the Aβ secondary structure in a single experiment. Fig. 11 was constructed using four independent measurements. A cluster of points at ∼78° and ∼68° correspond to two separate measurements for fBLM-AβMs and the remaining points correspond to measurements for fBLM-AβOs. Because the spectra were recorded at several potentials for each measurement, the spread of points within the cluster accounts for small changes induced by variation of the electrode potential. The content of the random coil and α-helix secondary structures is high and that of β-sheet is low for fBLM-AβMs, thus indicating a high population of AβMs and low population of AβOs, respectively. As expected, the content of the random coil and α-helix secondary structures is low and the content of the β-sheet is high for fBLM-AβOs. Apparently, the population of AβOs dominates over that of AβMs. This domination is expected because the population of AβOs increases at the expense of that of AβMs during Aβ aggregation. Interestingly, the higher the AβOs population, the lower is the CO bond angle. This relation directly shows that the change in the CO bond angle in each membrane is influenced by the presence of AβO only.
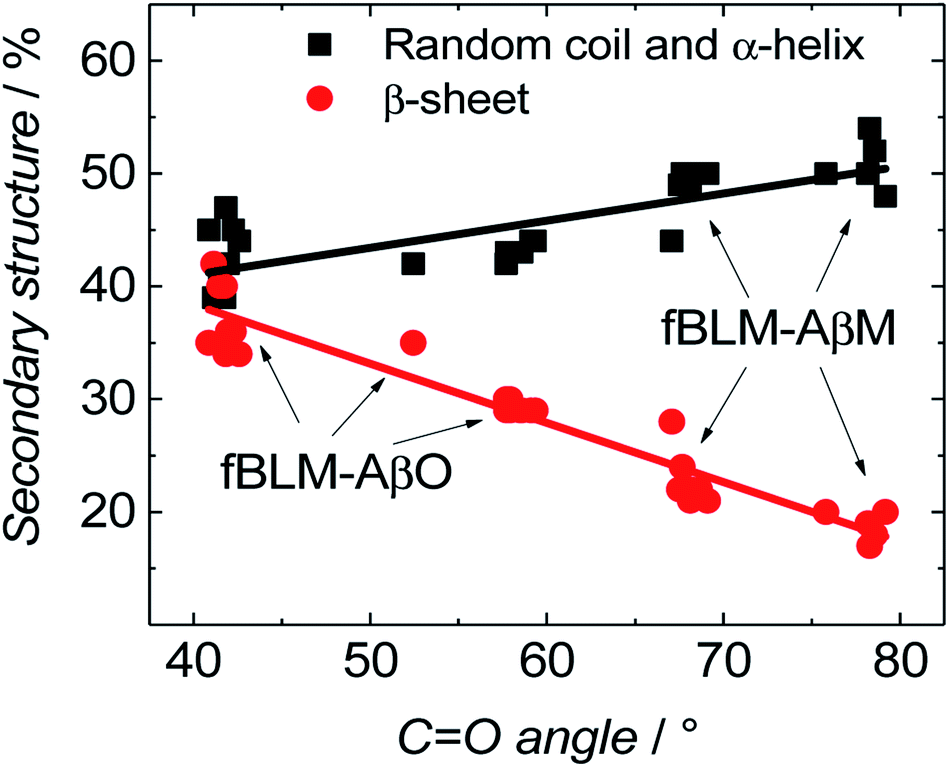 | ||
| Fig. 11 Correlation between the content of dominant Aβ secondary structure and changes in the CO bond angle for fBLM-AβMs and fBLM-AβOs samples. The percentage of the secondary structure corresponds to the fraction of the area of the sub bands to the total area under the amide I band. | ||
Generalized two-dimensional correlation spectroscopy (2D-COS)59 was employed to analyze spectra used to construct Fig. 11. The perturbation applied to these spectra was the change in the angle of the CO bond in the lipids of the bilayer. The 2D-COS analysis provides two important pieces of information, i.e., (i) it allows identifying the presence of bands corresponding to different elements of the secondary structure and, thus verifying the FSD analysis and (ii) it provides information about sequential changes of analyzed bands.59,60 Synchronous (Fig. 12a) and asynchronous (Fig. 12b and c) 2D-COS spectra were constructed for the 1800–1600 cm−1 region. The synchronous spectra show poorly resolved broad auto-correlation bands located at the diagonal (Fig. 12a). The poor resolution and the absence of sub bands indicates that the spectral changes are predominantly asynchronous (out of phase).42 There are two negative cross-correlation bands between bands corresponding to CO vibrations in lipids and amide I bands of Aβ. The negative sign of these bands indicates that the bands of lipids and amide I bands change in opposite directions. The resolution of asynchronous spectra is high and all sub bands identified by FSD are seen (Fig. 12b). This performance confirms that the observed changes are out of phase.
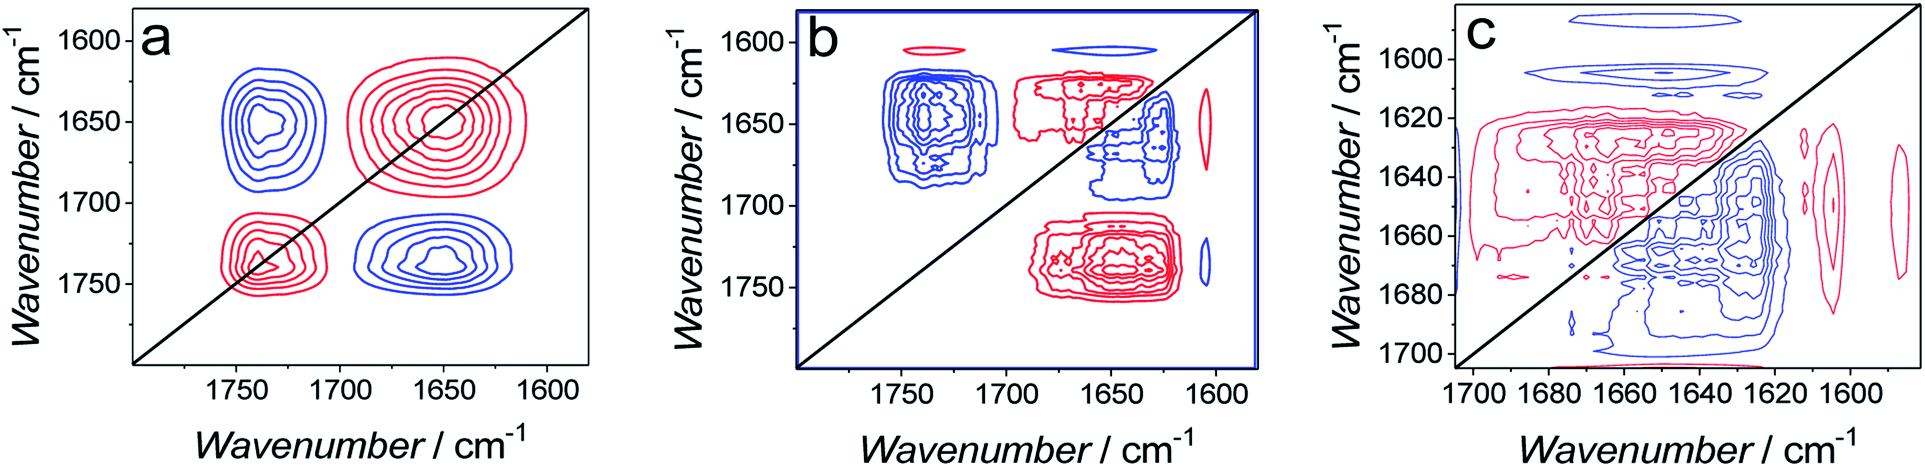 | ||
| Fig. 12 (a) Synchronous and (b) asynchronous 2D-COS spectra used to calculate data plotted in Fig. 11. (c) Enlarged asynchronous 2D-COS spectra showing the amide I band region for Aβ. | ||
The asynchronous spectrum consists of cross-correlation bands only and provides information about sequential changes of the bands. The positive sign of a band (v1, v2) indicates that changes in the v1 band precede changes in the v2 band.59,60 The cross-correlation of amide I bands of Aβ and CO bands of lipids is positive. However, the corresponding cross-correlation band in the synchronous spectrum is negative and, hence, it inverts the sequence predicted by the asynchronous bands. This feature indicates that changes in the CO band precede changes in the amide I bands, i.e., first, changes in the lipids, and then changes in the peptide occur.
Fig. 12c shows magnified asynchronous spectra corresponding to the amide I bands of Aβ. The synchronous spectra for this region are absent. The analysis shows that cross-correlation between the β-sheet band at 1626 cm−1 and all other amide I sub-bands is negative. This feature indicates that the β-sheet band changes after other sub bands change. In general, the analysis indicates that a band with higher wavenumber changes before the band with a lower wavenumber. Therefore, the 2D-COS analysis allows establishing the following order of changes in the secondary structure of the amide I band. That is, first, the β-turn (1681 cm−1) change sequentially followed by changes in β-turn (1667 cm−1), α-helix (1556 cm−1), random coil (1640 cm−1), and finally, in β-sheet (1626 cm−1). Changes in α-helix/random coil (AβMs structure) precede changes in β-sheet (AβOs structure). This sequence of changes suggests that the cause of changes shown in Fig. 11 is AβMs aggregation into AβOs, involving the transformation of the α-helix/random coil structure to that of β-sheet. This inference is consistent with the Aβ aggregation mechanism.54
4. Conclusions
We investigated interactions of AβMs and AβOs with fBLM using electrochemical and IR spectroscopic techniques. Electrochemical measurements demonstrated that AβOs significantly alter the electric properties of the membrane. These changes result from the membrane poration by AβOs. The electric properties of the fBLM-AβOs are different from those reported for lipid bilayers containing ion channels, thus evidencing the fundamental difference between pores formed by AβOs and ion channels formed by peptides like α-hemolysin or alamethicin.19,37,38 Moreover, it appeared that the change in the average pore size significantly affects EIS features and should be considered when analyzing the EIS data for phospholipid bilayers. This finding allowed us to demonstrate a novel way of interpreting the EIS results.PM-IRRAS studies showed that both AβMs and AβOs caused significant lipid molecules disordering, as evidenced by conformational and orientational changes of lipid molecules in the fBLM. Both Aβ forms interact with the membrane hydrophobic core, i.e., they increase the tilt angle of lipid acyl chains, increase the number of gauche conformers in the lipid acyl chains, decrease the mobility of lipid acyl chains, and change the lipid molecule packing. All these changes were more significant in the presence of AβOs than in the presence of AβMs. Dehydration of the phospholipid carbonyl groups and absence of change in the angle of the CO bond located in the lipid heads was only observed for fBLM-AβMs. Oppositely, AβOs changed the angle of the CO bond, causing the reorientation of lipid heads without affecting their hydration. These results demonstrate that the respective interactions of AβMs and AβOs with lipid heads were significantly different. The 2D-COS spectroscopy results demonstrated that structural changes of lipids are preceding those of Aβ. Moreover, they demonstrated that changes in the random coil and α-helix bands precede changes in the β-sheet band. This results are in line with the Aβ aggregation mechanism assuming structural transformation from the random coil/α-helix to the β-sheet secondary structure.
The present results provide new information on the Aβ-induced changes in the fBLM properties, thus enabling a deeper understanding of the mechanism of interaction of Aβ with bilayer lipid membranes and, consequently, pathology of Alzheimer's disease.
Conflicts of interest
The authors declare no conflicts of interest.Acknowledgements
This research was supported by funding from the Polish National Science Centre, grant no. OPUS12 2016/23/B/ST4/02791, and the European Union Horizon 2020 Research and Innovation Programme under the Marie Skłodowska-Curie grant agreement no. 711859 and the Polish Ministry of Science and Higher Education for the implementation of an international co-financed project in the years 2017–2021. It was also supported by a Discovery grant from the Natural Sciences and Engineering Research Council of Canada (NSERC), grant no. RG03958.References
- W. A. Rocca, R. C. Petersen, D. S. Knopman, L. E. Hebert, D. A. Evans, K. S. Hall, S. Gao, F. W. Unverzagt, K. M. Langa, E. B. Larson and L. R. White, Alzheimer's Dementia, 2011, 7, 80–93 CrossRef PubMed.
- J. Hardy and D. J. Selkoe, Science, 2002, 297, 353–356 CrossRef CAS PubMed.
- F. M. LaFerla, K. N. Green and S. Oddo, Nat. Rev. Neurosci., 2007, 8, 499–509 CrossRef CAS PubMed.
- D. M. Walsh, A. Lomakin, G. B. Benedek, M. M. Condron and D. B. Teplow, J. Biol. Chem., 1997, 272, 22364–22372 CrossRef CAS PubMed.
- G. M. Shankar, S. Li, T. H. Mehta, A. Garcia-Munoz, N. E. Shepardson, I. Smith, F. M. Brett, M. A. Farrell, M. J. Rowan, C. A. Lemere, C. M. Regan, D. M. Walsh, B. L. Sabatini and D. J. Selkoe, Nat. Med., 2008, 14, 837–842 CrossRef CAS PubMed.
- J. M. Mc Donald, G. M. Savva, C. Brayne, A. T. Welzel, G. Forster, G. M. Shankar, D. J. Selkoe, P. G. Ince and D. M. Walsh, Brain, 2010, 133, 1328–1341 CrossRef PubMed.
- G. Kroemer and M. Jäättelä, Nat. Rev. Cancer, 2005, 5, 886–897 CrossRef CAS PubMed.
- S. Rosales-Corral, D. Acuna-Castroviejo, D. X. Tan, G. López-Armas, J. Cruz-Ramos, R. Munoz, V. G. Melnikov, L. C. Manchester and R. J. Reiter, Oxid. Med. Cell. Longevity, 2012, 1–15 Search PubMed.
- M. Domínguez-Prieto, A. Velasco, A. Tabernero and J. M. Medina, J. Alzheimer's Dis., 2018, 65, 1109–1124 Search PubMed.
- B. P. Tseng, K. N. Green, J. L. Chan, M. Blurton-Jones and F. M. LaFerla, Neurobiol. Aging, 2008, 29, 1607–1618 CrossRef CAS PubMed.
- S. M. Butterfield and H. A. Lashuel, Angew. Chem., Int. Ed., 2010, 49, 5628–5654 CrossRef CAS PubMed.
- H. Lin, R. Bhatia and R. Lal, FASEB J., 2001, 15, 2433–2444 CrossRef CAS PubMed.
- A. Quist, I. Doudevski, H. Lin, R. Azimova, D. Ng, B. Frangione, B. Kagan, J. Ghiso and R. Lal, Proc. Natl. Acad. Sci. U. S. A., 2005, 102, 10427–10432 CrossRef CAS PubMed.
- M. Ewald, S. Henry, E. Lambert, C. Feuillie, C. Bobo, C. Cullin, S. Lecomte and M. Molinari, Nanoscale, 2019, 11, 7229–7238 RSC.
- S. Henry, N. B. Bercu, C. Bobo, C. Cullin, M. Molinari and S. Lecomte, Nanoscale, 2018, 10, 936–940 RSC.
- D. Mrdenovic, M. Majewska, I. S. Pieta, P. Bernatowicz, R. Nowakowski, W. Kutner, J. Lipkowski and P. Pieta, Langmuir, 2019, 35, 11940–11949 CrossRef CAS PubMed.
- S. De, D. R. Whiten, F. S. Ruggeri, C. Hughes, M. Rodrigues, D. I. Sideris, C. G. Taylor, F. A. Aprile, S. Muyldermans, T. P. J. Knowles, M. Vendruscolo, C. Bryant, K. Blennow, I. Skoog, S. Kern, H. Zetterberg and D. Klenerman, Acta Neuropathol. Commun., 2019, 7, 120 CrossRef PubMed.
- S. De, D. C. Wirthensohn, P. Flagmeier, C. Hughes, F. A. Aprile, F. S. Ruggeri, D. R. Whiten, D. Emin, Z. Xia, J. A. Varela, P. Sormanni, F. Kundel, T. P. J. Knowles, C. M. Dobson, C. Bryant, M. Vendruscolo and D. Klenerman, Nat. Commun., 2019, 10, 1541 CrossRef PubMed.
- P. Pieta, J. Mirza and J. Lipkowski, Proc. Natl. Acad. Sci. U. S. A., 2012, 109, 21223–21227 CrossRef CAS PubMed.
- P. Pieta, M. Majewska, Z. Su, M. Grossutti, B. Wladyka, M. Piejko, J. Lipkowski and P. Mak, Langmuir, 2016, 32, 5653–5662 CrossRef CAS PubMed.
- Z. Su, D. Ho, A. R. Merrill and J. Lipkowski, Langmuir, 2019, 35, 8452–8459 CAS.
- F. Abbasi, J. Alvarez-Malmagro, Z. Su, J. J. Leitch and J. Lipkowski, Langmuir, 2018, 34, 13754–13765 CrossRef CAS PubMed.
- S.-C. Jao, K. Ma, J. Talafous, R. Orlando and M. G. Zagorski, Amyloid, 1997, 4, 240–252 CrossRef CAS.
- M. Díaz, N. Fabelo, I. Ferrer and R. Marín, Neurobiol. Aging, 2018, 67, 42–52 CrossRef PubMed.
- H. M. McConnell, T. H. Watts, R. M. Weis and A. A. Brian, Biochim. Biophys. Acta, Rev. Biomembr., 1986, 864, 95–106 CrossRef CAS.
- J. Richer and J. Lipkowski, J. Electrochem. Soc., 1986, 133, 121–128 CrossRef CAS.
- A. H. Kycia, J. Wang, A. R. Merrill and J. Lipkowski, Langmuir, 2011, 27, 10867–10877 CrossRef CAS PubMed.
- U. W. Hamm, D. Kramer, R. S. Zhai and D. M. Kolb, J. Electroanal. Chem., 1996, 414, 85–89 CrossRef.
- Z. Su, J. Leitch and J. Lipkowski, Z. Phys. Chem., 2012, 226, 995–1009 CrossRef CAS.
- V. Zamlynny and J. Lipkowski, in Advances in Electrochemical Sciences and Engineering, 2006, vol. 9, pp. 315–376 Search PubMed.
- J. E. Bertie and C. D. Keefe, Fresenius. J. Anal. Chem., 1998, 362, 91–108 CrossRef CAS.
- M. Li, M. Chen, E. Sheepwash, C. L. Brosseau, H. Li, B. Pettinger, H. Gruler and J. Lipkowski, Langmuir, 2008, 24, 10313–10323 CrossRef CAS PubMed.
- G. Valincius, M. Mickevicius, T. Penkauskas and M. Jankunec, Electrochim. Acta, 2016, 222, 904–913 CrossRef CAS.
- I. Burgess, M. Li, S. L. Horswell, G. Szymanski, J. Lipkowski, J. Majewski and S. Satija, Biophys. J., 2004, 86, 1763–1776 CrossRef CAS.
- T. Uchida, M. Osawa and J. Lipkowski, J. Electroanal. Chem., 2014, 716, 112–119 CrossRef CAS.
- G. Valincius, T. Meškauskas and F. Ivanauskas, Langmuir, 2012, 28, 977–990 CrossRef CAS PubMed.
- G. Valincius and M. Mickevicius, Tethered Phospholipid Bilayer Membranes. An Interpretation of the Electrochemical Impedance Response, Elsevier Inc., 1st edn, 2015, vol. 21 Search PubMed.
- F. Abbasi, J. J. Leitch, Z. F. Su, G. Szymanski and J. Lipkowski, Electrochim. Acta, 2018, 267, 195–205 CrossRef CAS.
- G. Valincius, F. Heinrich, R. Budvytyte, D. J. Vanderah, D. J. McGillivray, Y. Sokolov, J. E. Hall and M. Lösche, Biophys. J., 2008, 95, 4845–4861 CrossRef CAS PubMed.
- R. Kayed, Y. Sokolov, B. Edmonds, T. M. McIntire, S. C. Milton, J. E. Hall and C. G. Glabe, J. Biol. Chem., 2004, 279, 46363–46366 CrossRef CAS PubMed.
- Y. Sokolov, J. A. Kozak, R. Kayed, A. Chanturiya, C. Glabe and J. E. Hall, J. Gen. Physiol., 2006, 128, 637–647 CrossRef CAS PubMed.
- A. H. Kycia, Z. Su, C. L. Brosseau and J. Lipkowski, in Vibrational Spectroscopy at Electrified Interfaces, John Wiley & Sons, Inc., Hoboken, NJ, USA, 2013, pp. 345–417 Search PubMed.
- N. Garcia-Araez, C. L. Brosseau, P. Rodriguez and J. Lipkowski, Langmuir, 2006, 22, 10365–10371 CrossRef CAS PubMed.
- J. J. Leitch, C. L. Brosseau, S. G. Roscoe, K. Bessonov, J. R. Dutcher and J. Lipkowski, Langmuir, 2013, 29, 965–976 CrossRef CAS PubMed.
- R. N. A. H. Lewis and R. N. Mcelhaney, Biochim. Biophys. Acta, Biomembr., 2013, 1828, 2347–2358 CrossRef CAS PubMed.
- R. G. Snyder, H. L. Strauss and C. A. Elliger, J. Phys. Chem., 1982, 86, 5145–5150 CrossRef CAS.
- I. Zawisza, X. Bin and J. Lipkowski, Langmuir, 2007, 23, 5180–5194 CrossRef CAS PubMed.
- R. N. Lewis, R. N. McElhaney, W. Pohle and H. H. Mantsch, Biophys. J., 1994, 67, 2367–2375 CrossRef CAS.
- W. K. Surewicz and H. H. Mantsch, Biochim. Biophys. Acta, Protein Struct. Mol. Enzymol., 1988, 952, 115–130 CrossRef CAS.
- D. G. Cameron, E. F. Gudgin and H. H. Mantsch, Biochemistry, 1981, 20, 4496–4500 CrossRef CAS PubMed.
- F. Damien and M. Boncheva, J. Invest. Dermatol., 2010, 130, 611–614 CrossRef CAS PubMed.
- A. M. Champagne, V. A. Pigg, H. C. Allen and J. B. Williams, J. Exp. Biol., 2018, 221, 1–6 CrossRef PubMed.
- G. S. Gooris and J. A. Bouwstra, Biophys. J., 2007, 92, 2785–2795 CrossRef CAS PubMed.
- M. D. Kirkitadze, M. M. Condron and D. B. Teplow, J. Mol. Biol., 2001, 312, 1103–1119 CrossRef CAS.
- F. Ding, J. M. Borreguero, S. V. Buldyrey, H. E. Stanley and N. V. Dokholyan, Proteins: Struct., Funct., Genet., 2003, 53, 220–228 CrossRef CAS PubMed.
- R. Sarroukh, E. Cerf, S. Derclaye, Y. F. Dufrêne, E. Goormaghtigh, J.-M. Ruysschaert and V. Raussens, Cell. Mol. Life Sci., 2011, 68, 1429–1438 CrossRef CAS PubMed.
- N. Benseny-Cases, M. Cócera and J. Cladera, Biochem. Biophys. Res. Commun., 2007, 361, 916–921 CrossRef CAS PubMed.
- K. Bagińska, J. Makowska, W. Wiczk, F. Kasprzykowski and L. ChmurzyńSKI, J. Pept. Sci., 2008, 14, 283–289 CrossRef PubMed.
- I. Noda, A. E. Dowrey, C. Marcott, G. M. Story and Y. Ozaki, Appl. Spectrosc., 2000, 54, 236A–248A CrossRef CAS.
- I. Noda, J. Mol. Struct., 2014, 1069, 50–59 CrossRef CAS.
Footnote |
| † Electronic supplementary information (ESI) available. See DOI: 10.1039/d0na00292e |
| This journal is © The Royal Society of Chemistry 2020 |