
 Open Access Article
 This Open Access Article is licensed under a Creative Commons Attribution-Non Commercial 3.0 Unported Licence
Effect of Fe-doping on bending elastic properties of single-crystalline rutile TiO2 nanowires†
Qiong
Liu
 a,
Haifei
Zhan
ab,
Yihan
Nie
a,
Yanan
Xu
a,
Huaiyong
Zhu
a,
Ziqi
Sun
a,
John
Bell
c,
Arinxin
Bo
*a and
Yuantong
Gu
*ab
a,
Haifei
Zhan
ab,
Yihan
Nie
a,
Yanan
Xu
a,
Huaiyong
Zhu
a,
Ziqi
Sun
a,
John
Bell
c,
Arinxin
Bo
*a and
Yuantong
Gu
*ab
aSchool of Mechanical, Medical and Process Engineering, Queensland University of Technology (QUT), Brisbane, Queensland 4001, Australia
bCenter for Materials Science, Queensland University of Technology (QUT), Brisbane, Queensland 4001, Australia
cUniversity of Southern Queensland, Ipswich, Queensland 4300, Australia
First published on 18th May 2020
Abstract
Transition-metal-doping can improve some physical properties of titanium dioxide (TiO2) nanowires (NWs), which leads to important applications in miniature devices. Here, we investigated the elastic moduli of single-crystalline pristine and Fe-doped rutile TiO2 NWs using the three-point bending method, which is taken as a case study of impacts on the elastic properties of TiO2 NWs caused by transition-metal-doping. The Young's modulus of the pristine rutile TiO2 NWs decreases when the cross-sectional area increases (changing from 246 GPa to 93.2 GPa). However, the elastic modulus of the Fe-doped rutile NWs was found to increase with the cross-sectional area (changing from 91.8 GPa to 200 GPa). For NWs with similar geometrical size, the elastic modulus (156.8 GPa) for Fe-doped rutile NWs is 24% smaller than that (194.5 GPa) of the pristine rutile TiO2 NWs. The vacancies generated by Fe-doping are supposed to cause the reduction of elastic modulus of rutile TiO2 NWs. This work provides a fundamental understanding of the effects of transition-metal-doping on the elastic properties of TiO2 NWs.
Introduction
Due to their unique chemical and physical properties,1 one-dimensional (1D) titanium dioxide (TiO2) nanostructures are of great interest and widely exploited in various applications, such as photovoltaics,2 batteries,3 optoelectronics,4 and electromechanical systems.5 To facilitate these applications, a comprehensive understanding of mechanical properties of nanomaterials is crucial, which plays a key role in the device degradation and failure. What is more, recent researches show that mechanical strain can significantly influence the electrical and optical properties of nanomaterials,6,7 making the strain engineering a salient approach to tune their physical properties. To date, different kinds of nanostructured materials including metal and alloys,8,9 semiconductors,10 and functional oxides have attracted much attention in terms of their mechanical and mechanical-coupled properties.11,12 A few studies have investigated the mechanical properties (e.g., elastic or Young's modulus, yielding or failure strain) of 1D pristine TiO2 nanostructures in the past decades.13–16 As the most stable phase among the four polymorphs (rutile, anatase, bronze, and brookite) of TiO2, 1D rutile nanostructures such as nanoribbon and nanobelt attracted great research interest on their elasticity. For example, Young's modulus of polycrystalline rutile TiO2 nanoribbon was measured to be ∼120 GPa.16 The single-crystalline rutile TiO2 nanobelt (30 nm in thickness, 160 nm in width) was reported with Young's modulus ∼360 GPa using nanoindentation technique after carefully subtracting the substrate effect.15Recent works reveal that some physical properties of TiO2, such as light absorption,17 dielectric property,12 and ferromagnetic property,18 can be enhanced through homogeneous transition-metal-doping. However, the impacts from the transition-metal-doping on the mechanical properties of 1D TiO2 nanomaterials have been rarely discussed. Generally, Young's modulus depends on the crystalline structure and defects in the materials.19,20 For instance, Chen et al. found that single-crystalline wurtzite GaAs NWs with rich stacking faults have a larger elastic modulus than their defect-free counterpart NWs.20 Previous works verified that homogeneous metal incorporation would not bring line defects and newborn phases in the host TiO2, only with some oxygen vacancies generated.12,17 Oxygen vacancies belong to the point defect family, which normally increase the average bond length and thus cause a reduction in elastic modulus.19 Hence, it is speculated that Young's modulus of metal-doped rutile TiO2 NWs would be decreased. However solid experimental evidences should be provided to verify this speculation.
Severe nanoscale-related experimental challenges have hampered the mechanical measurements on NWs. To address this issue, various techniques have been developed to characterize the mechanical behaviours of NWs, including bending tests using atomic force microscopy (AFM) or nanoindentation,15,21,22 mechanical resonance methods,23,24 and scanning/transmission electron microscopy (S/TEM)-based methods.8,25–28 Among them, nanoindentation-induced bending is a relatively effortless approach, which allows quickly obtaining the Young's modulus.15,19 Nanoindentation can be performed on a 1D nanostructure lying on a substrate. Whereas, the deformation of the substrate and the associated substrate-sample friction will cause an inaccuracy of the measurements, which is known as the substrate effects.15 Here, we synthesized single-crystalline pristine and Fe-doped rutile TiO2 NWs and investigated their elastic moduli. To minimize the substrate effects, we adopted a three-point bending approach using a nanoindentor,29 where the TiO2 NW was clamped at the two ends by Pt pads over a hole drilled on a silicon substrate. It is found that the elastic modulus of Fe-doped rutile NWs (∼156.8 GPa) is around 24% smaller than that of their pristine counterparts (∼194.5 GPa).
Experimental section
Synthesis of TiO2 NWs
High-quality single-crystalline rutile TiO2 NWs were synthesized using a reported molten salt flux method.17 Typically, 1 g of P25 powers, 1 g of Na2HPO4, and 4 g of NaCl were ground in a mortar with pestle to form an even and fine mixture. The mixture was transferred into an Al2O3 crucible and sintered in a muffle furnace at 825 °C for 5 h. After cooling to room temperature, the mixture was washed using hot deionized water by centrifugation. To synthesize Fe-doped rutile TiO2 NWs, 2% FeCl3 (by atomic percentage) was added to the mixture followed by the above procedure.Sample characterization
Morphologies of as-prepared NWs were characterized using a field-emission SEM (JEOL JSM-7001F, Japan) and a TEM (JEOL JEM-2100, Japan). The crystalline phases were defined by X-ray diffraction (XRD) patterns using a Philips PANalytical X'pert pro diffractometer equipped with a graphite monochromator with 40 kV Cu Kα radiation. The crystalline structures were further analysed by HRTEM. The elemental compositions of the as-prepared NWs were determined by an energy dispersive spectrometer (EDS) attached in the TEM. The chemical state of Fe, Ti, and O were defined using X-ray photon spectroscopy (XPS, Manchester, UK) technique.Three-point bending tests
To do the bending tests, micro-holes with diameters of 15 μm and a depth of 3 μm were drilled using the focused ion beam (FIB) on a Si substrate inside a FIB/SEM dual-beam working system (Scios FEI, USA). A single TiO2 NW was picked up using easy-lift nanomanipulation system and bridged over a hole milled by Ga source FIB. A double-clamped TiO2 nanobeam was then built by the Pt/C block using the electron beam induced deposition (EBID), with the pinning points situated at the edge of the hole. The EBID technique is used to deposit the Pt/C because the electron beam in SEM has much lower energy than that in TEM. It can hardly generate surface damage and surface defects on the NW that can be observed when a ceramic NW is under irradiation in TEM.30,31 Moreover, EBID can protect the NWs from crystal structure damage that can be caused by the high-energy ionic beam induced deposition technique.32 The pinning can accurately define the effective wire-beam length and to eliminate the substrate effect caused by the wire-substrate friction. Three-point bending tests were conducted using a nanoindentor (Hysitron TI950, Bruker corporation, USA) with a diamond Berkovich tip (radius = 140 nm) attached to a 1D transducer. Before each bending test, the sample topography was obtained using scanning mode to exactly determine the middle point of the NW beam. Then, the bending test was performed in contact mode at the middle point of the nanobeam. Each bending test consists of a loading-unloading cycle with each half of the cycle set to be finished in 20 s.Results and discussion
Fig. 1a and d show SEM images of the pristine and Fe-doped rutile TiO2 NWs, respectively, revealing the wire-like morphology with diameters ranging from 100 to 1200 nm and lengths from 10 to 30 μm. Fig. 1b and e display typical TEM images of these two kinds of NWs, further illustrating their wire-like morphology. HRTEM images were captured at the NWs' edges to further analyze their crystalline structures. Fig. 1c is the HRTEM image of the pristine TiO2 NW, where the marked d-spacing of 0.319 nm is in good agreement with that of (110) planes. The corresponding selected area electron diffraction (SAED) pattern (inset, Fig. 1c) viewed along the [1![[1 with combining macron]](https://www.rsc.org/images/entities/char_0031_0304.gif) 0] zone axis indicates the [001] growth direction of the NWs, and the single set of diffraction dots in it further confirms the single-crystalline nature of the rutile TiO2 NW. The HRTEM image (Fig. 1f) of the Fe-doped rutile NW and the corresponding SAED pattern (inset, Fig. 1f) also show the high crystallization of the material. The growth direction of the Fe-doped rutile NWs can also be defined along [001] direction, which is consistent with that of the pristine counterparts. Furthermore, the HRTEM image the Fe-doped rutile NW shows the absence of line or plane defects and impurity phases caused by the Fe-doping.
0] zone axis indicates the [001] growth direction of the NWs, and the single set of diffraction dots in it further confirms the single-crystalline nature of the rutile TiO2 NW. The HRTEM image (Fig. 1f) of the Fe-doped rutile NW and the corresponding SAED pattern (inset, Fig. 1f) also show the high crystallization of the material. The growth direction of the Fe-doped rutile NWs can also be defined along [001] direction, which is consistent with that of the pristine counterparts. Furthermore, the HRTEM image the Fe-doped rutile NW shows the absence of line or plane defects and impurity phases caused by the Fe-doping.
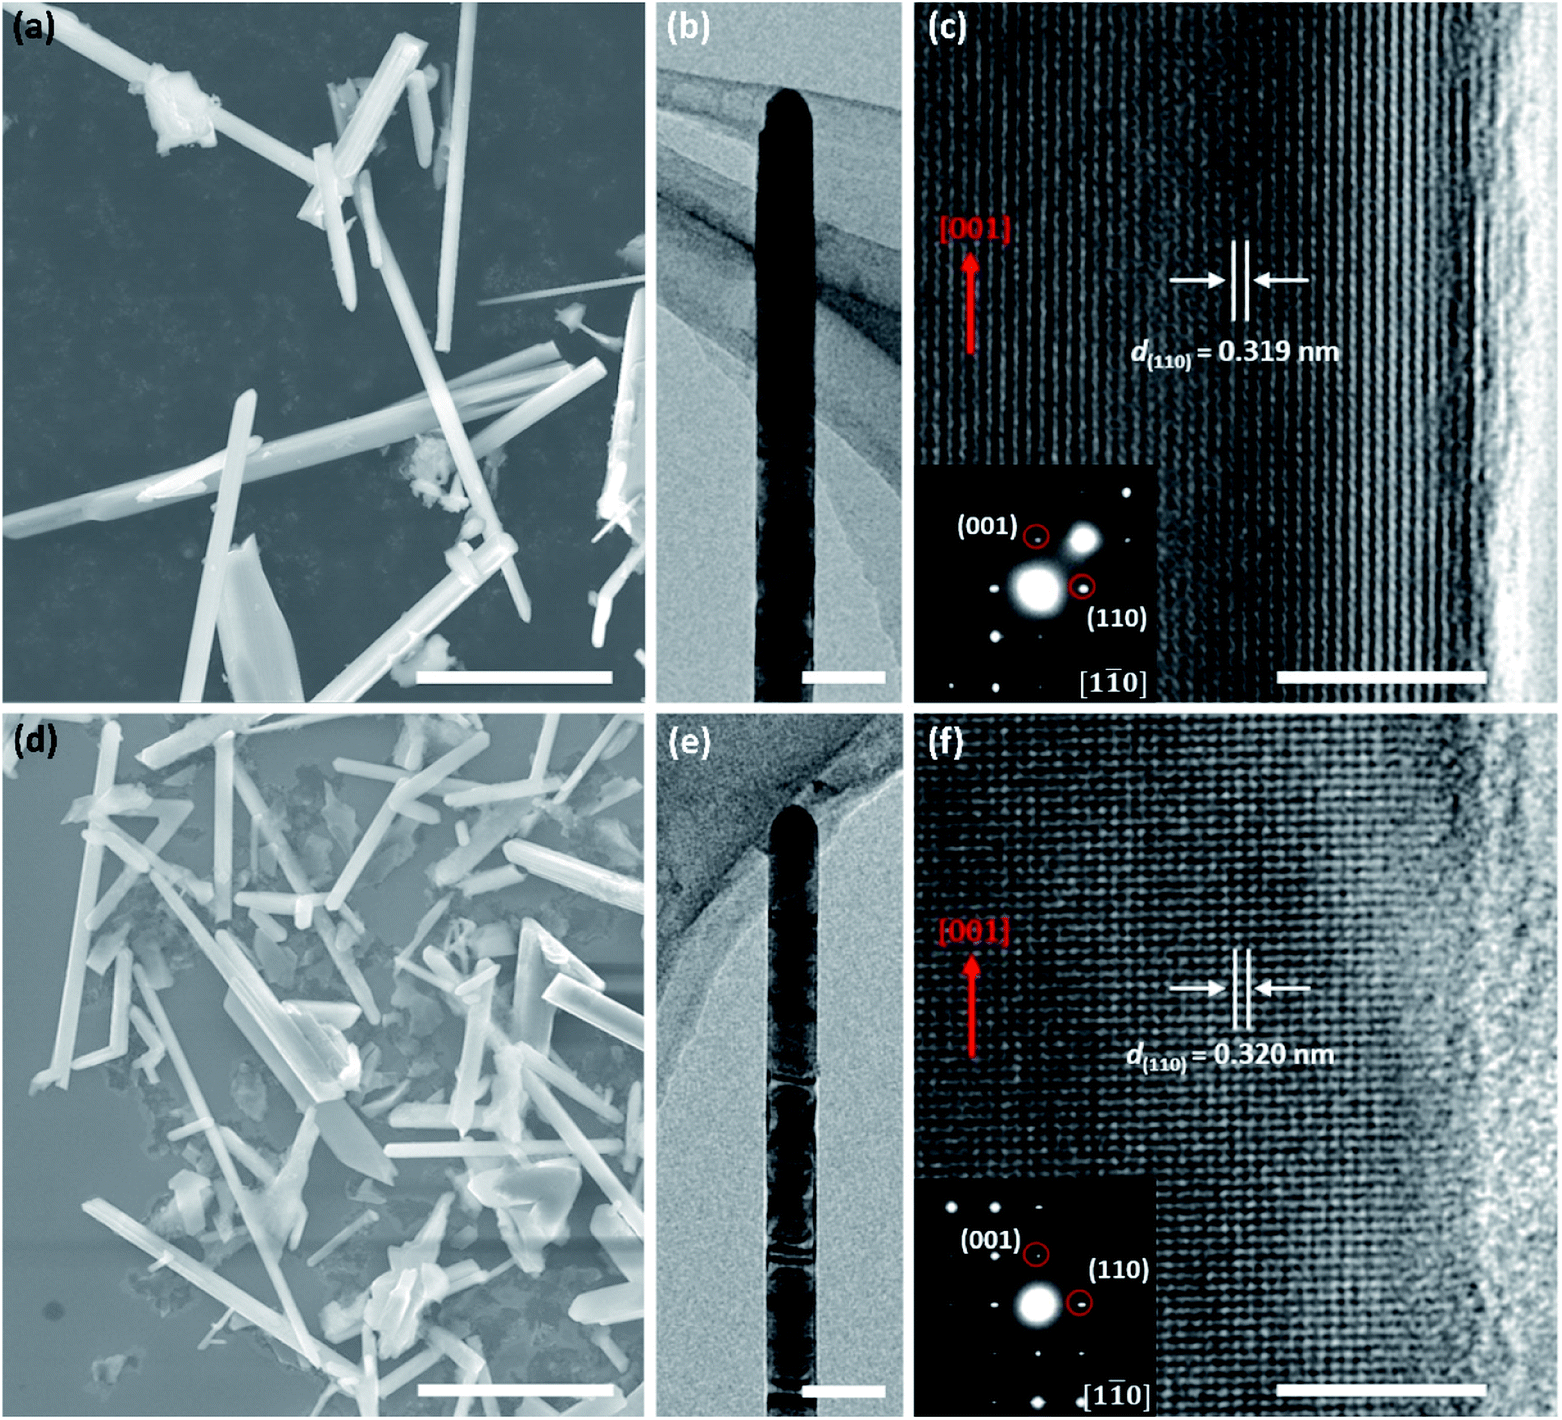 | ||
| Fig. 1 SEM and TEM characterization of the TiO2 NWs. (a) SEM image, (b) TEM image, and (c) HRTEM image (inset, SAED pattern) of the pristine rutile TiO2 NWs. (d) SEM image, (e) TEM image, and (f) HRTEM image (inset, SAED pattern) of the Fe-doped rutile TiO2 NWs. Scale bar, 10 μm (a) and (d), 200 nm (b) and (e), 5 nm (c) and (f). | ||
Fig. 2a is the photograph of the as-prepared samples, showing the color change from white of the pristine TiO2 to light red of the Fe-doped rutile TiO2. The reddish color indicates the presence of Fe in the structure. The XRD patterns of the synthesized samples are shown in Fig. 2b. As can be seen, the diffraction peaks of the pristine TiO2 index well to (110), (101), (200), (111), (210), (211), (220), (002), (310), (301) and (112) of tetragonal rutile phase (JCPDS, 21-1276). From the XRD pattern of Fe-doped sample, the rutile phase is confirmed to exist in the NWs, without any other phases appearing. This further indicates that the Fe-doping causes no phase transformation or structural degradation. The EDS elemental mapping results of the Fe-doped TiO2 NW are shown in Fig. 2c–f, where the uniform distribution of Ti, O, and Fe can be observed.
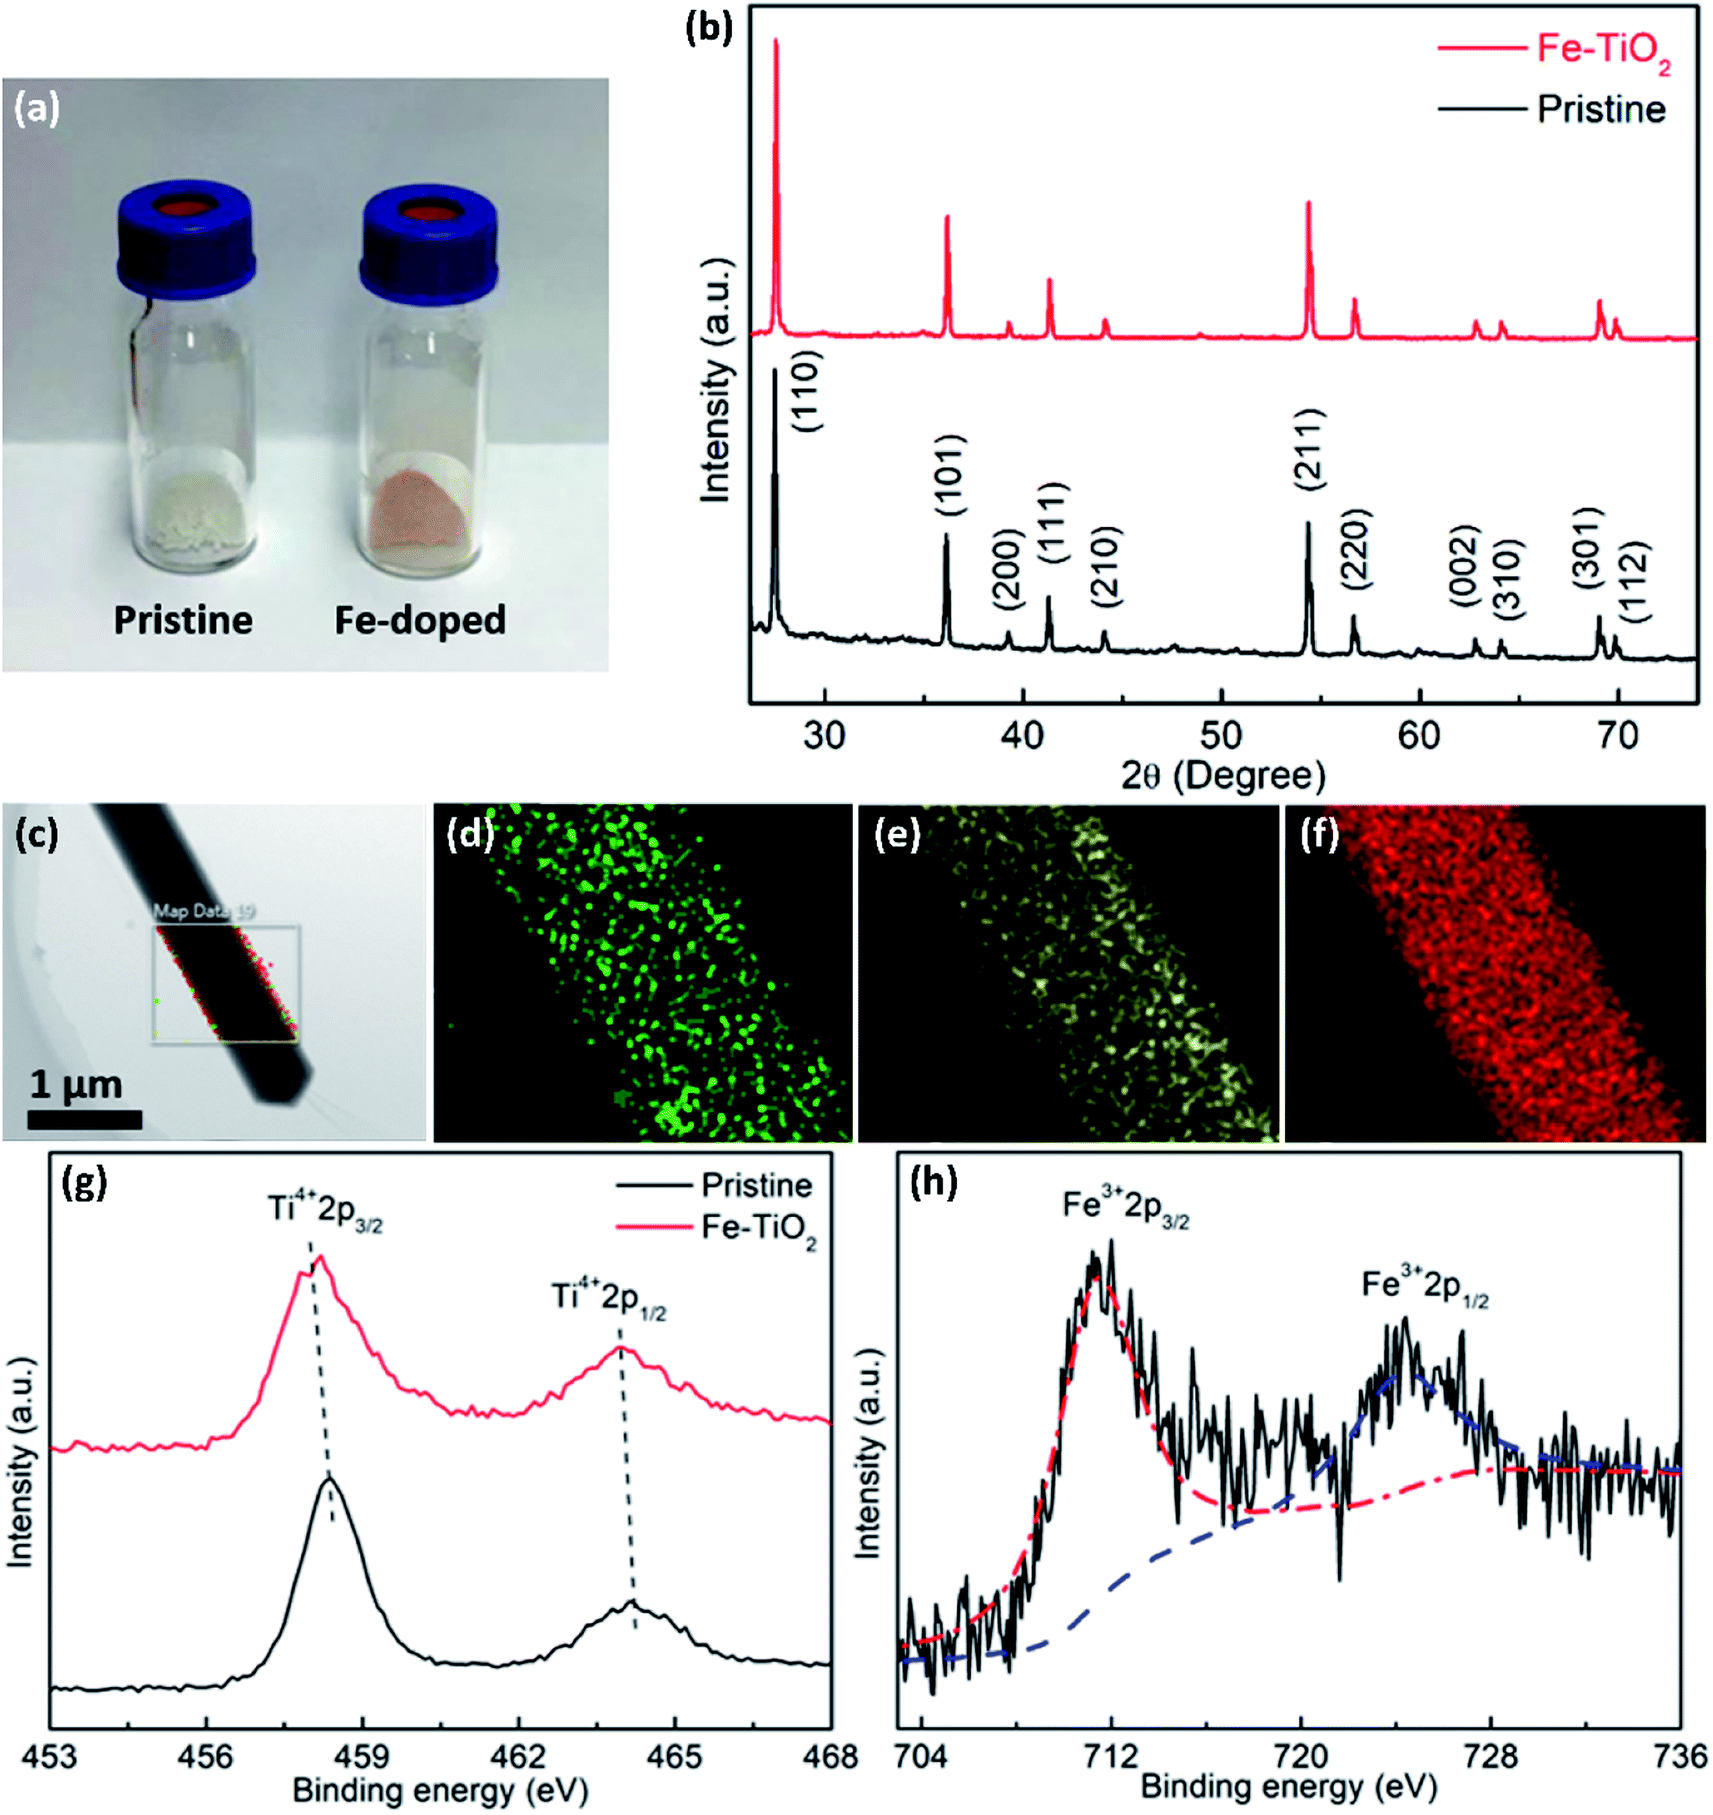 | ||
| Fig. 2 Characterization of the as-prepared rutile TiO2 NWs. (a) Photograph and (b) XRD patterns of pristine and Fe-doped rutile TiO2 NWs. (c–f) EDS mapping results of the Fe-doped rutile TiO2 NW. (g) High resolution XPS spectra of Ti in pristine and Fe-doped rutile TiO2 NWs. (h) High resolution XPS spectrum of Fe in Fe-doped rutile TiO2 NWs. | ||
XPS surveys were conducted to verify the valence state and chemical composition of pristine and Fe-doped TiO2 NWs. Fig. 2g shows the high resolution XPS spectra of Ti in the two kinds of samples. In the XPS spectrum of pristine TiO2 NWs, the two characteristic peaks located at 458.5 and 464.2 eV agree well with 2p3/2 and 2p1/2 for Ti4+, respectively; in the one of Fe-doped TiO2 NWs, both of the two peaks shift to lower binding energies, which are located at 458.0 and 463.9 eV, respectively. This shift in peaks indicates the nonstoichiometry in the Fe-doped NWs is contributed by the incorporation of Fe, which reflects the presence of oxygen vacancies.33Fig. 2h shows the high resolution XPS spectrum of Fe in Fe-doped TiO2 NWs, where the two peaks at 711.3 and 724.3 eV are ascribed to Fe 2p3/2 and Fe 2p1/2 of Fe3+, respectively.34 Previous works show that oxygen vacancies can be induced by doping of aliovalent cations. In Fe-doped TiO2 NWs, Fe3+ ions occupy substitutional Ti4+ sites in TiO2 lattices, forming oxygen vacancies to maintain charge neutrality.33,35 The formation formula of oxygen vacancies can be given by:
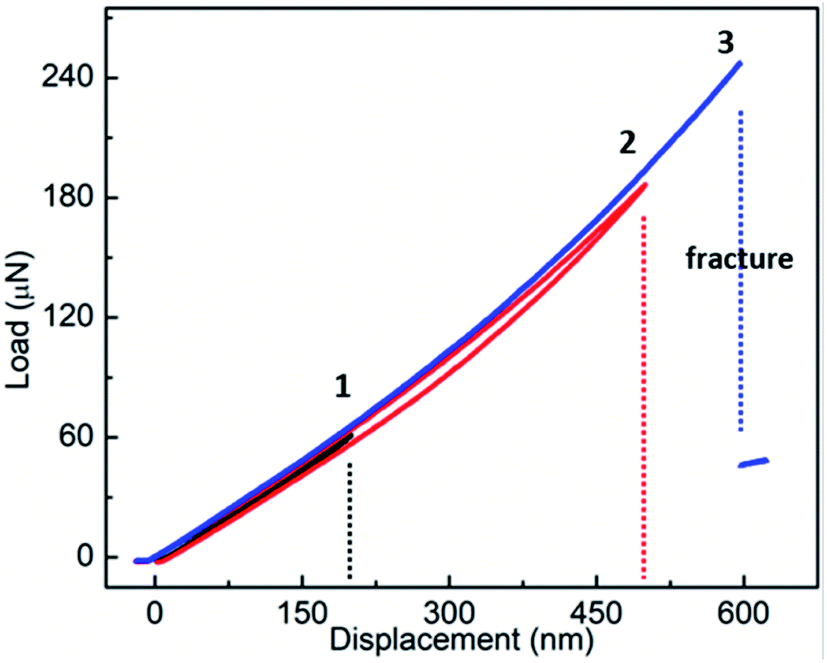
The bending behaviors can be reflected from the force versus displacement (F–d) curves obtained during the loading-unloading cycles with increasing maximum deflection of the NW beam. Fig. 3a displays the curve of a single loading–unloading cycle for a pristine rutile NW with the diameter of ∼800 nm. As is shown, the curve trajectories of loading and unloading almost completely overlay with each other, indicating the full recovery of the NW from an elastic bending deformation. In addition, Fig. 3a shows a typical hysteresis loop in the loading–unloading curve. This hysteresis loop shape also exists in the loading–unloading curves discussed below, which arises from the friction between the NW and the indenter tip or/and the penetration of the indenter tip into the NW surface.22,25 Fig. S1† shows a TiO2 NW after the three-point bending test, where it can be seen that no apparent residual indentation can be observed, indicating that the penetration depth into the NW surface of the indenter tip cannot be comparable to the NW deflection during bending. Therefore, penetration depth into the NW surface of the indenter tip cannot cause a large hysteresis in the F–d curve. Fig. 3b shows curves of six repeated loading-unloading cycles of the NW with gradually increasing the bending deflection. The coincidence of the curvilinear trend of the six curves suggests no degradation of the elasticity of the NW with increasing deformation deflection. When the displacement is increased to 1100 nm (curve 6), the NW fails eventually, as indicated by the sharp drop of the force, which suggests a brittle failure of the NW. The fracture of the NW can be seen from the SEM image, which located at the center of the NW, as shown in Fig. 3e. The sharp fracture edges also indicate the brittle failure of the NW. After fracture, we also observed a section of the NW being removed, which is likely caused by the mechanical vibration after the instant fracture. Meanwhile, the Pt welding point was not torn apart during the tests, suggesting the stability of the Pt welding and the sample preparation to be valid for the three-point bending test. To better observe the curvilinear shape from each loading-unloading cycle, the curves are displayed by stacking along Y coordinate axis, as shown in Fig. 3c. Initially, the applied force, F, increases linearly with the bending displacement, d, as can be seen from curves 1–3. When the bending deflection reaches around 700 nm, a nonlinear trend begins to appear in the curve, as seen from curves 4–6.
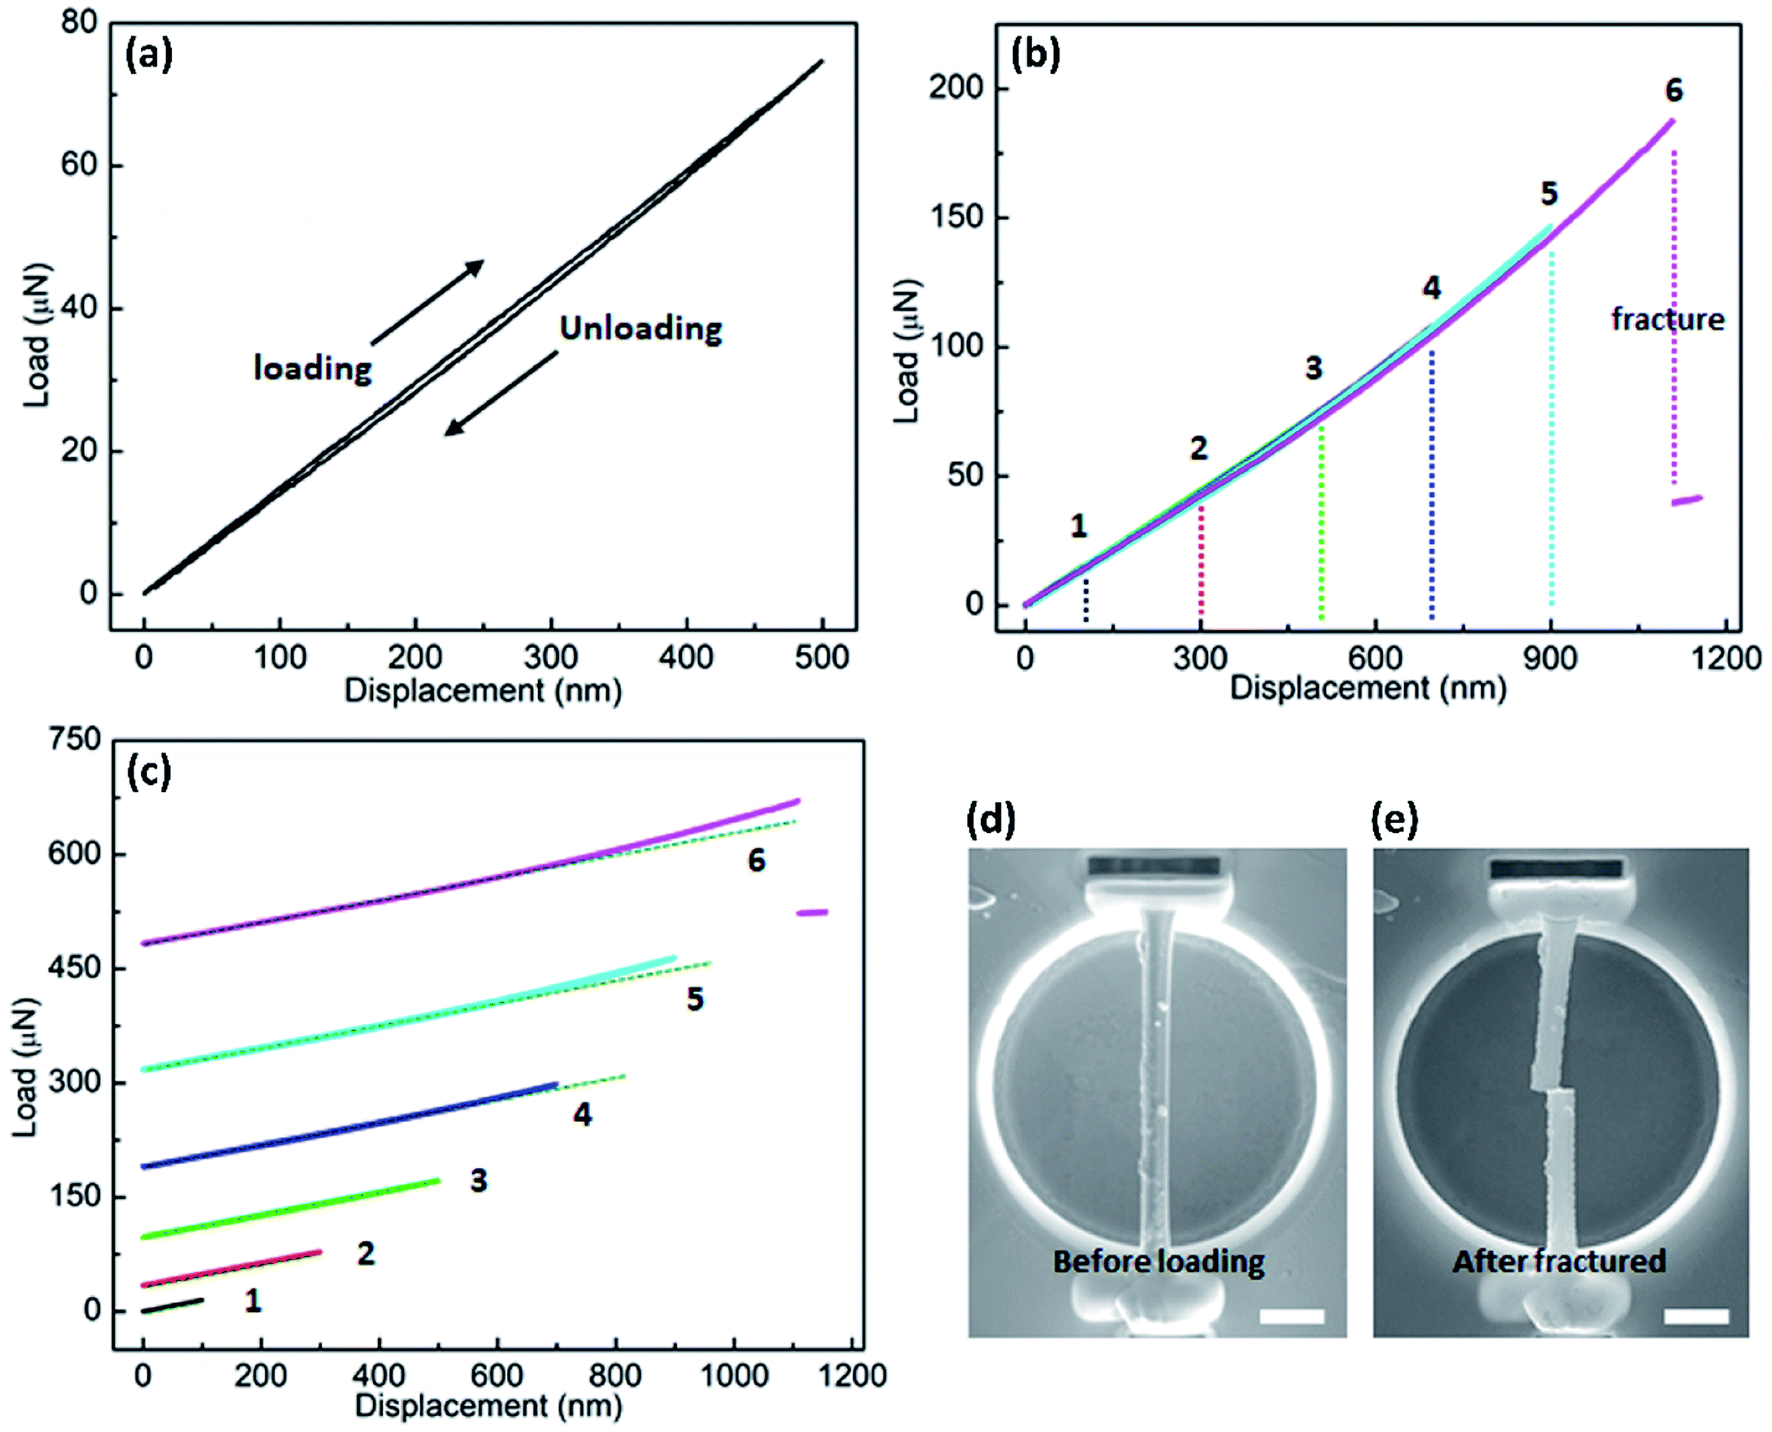 | ||
| Fig. 3 Results of three-point bending tests of the pristine rutile TiO2 NW. (a) F–d curve of a single loading-unloading cycle. (b) F–d curves of six loading–unloading cycles. (c) F–d curves stacking in Y coordinate axis. (d and e) SEM images before testing and after fractured, respectively. Scale bar, 1 μm. | ||
Fig. 4 shows F–d curves of a Fe-doped rutile TiO2 NW with the diameter of ∼733 nm. Unlike the pristine rutile TiO2 NWs, the loading curve shows a slight deviation from the one of unloading, which may be caused by a fractionally irreversible deformation. The overall deformation trait still resembles that of the pristine TiO2 NW. The F–d curves also exhibit a nonlinear behavior with increasing displacement. The nonlinear feature has been observed when characterizing the elastic moduli of various kinds of NWs, such as Si,22 WC,32 and Na2Ti3O7,21 which is caused by the inherent axial tension.36 Increasing the maximum deflection to 600 nm, a sharp drop of the force also occurred, indicating the failure and brittleness of the NW.
 | ||
| Fig. 4 Results of three-point bending tests of the Fe-doped rutile TiO2 NW, showing the F–d curves of three loading–unloading cycles. | ||
To better evaluate and compare the elastic properties of the two kinds of rutile TiO2 NWs, the elastic moduli were calculated. Nine pristine rutile TiO2 NWs and seven Fe-doped rutile TiO2 NWs with different cross-sectional areas were tested. Based on the linear part of the F–d curves, Young's moduli of the NWs can be obtained according to the equation,
| E = FcenterL3/(192Iδcenter), | (1) |
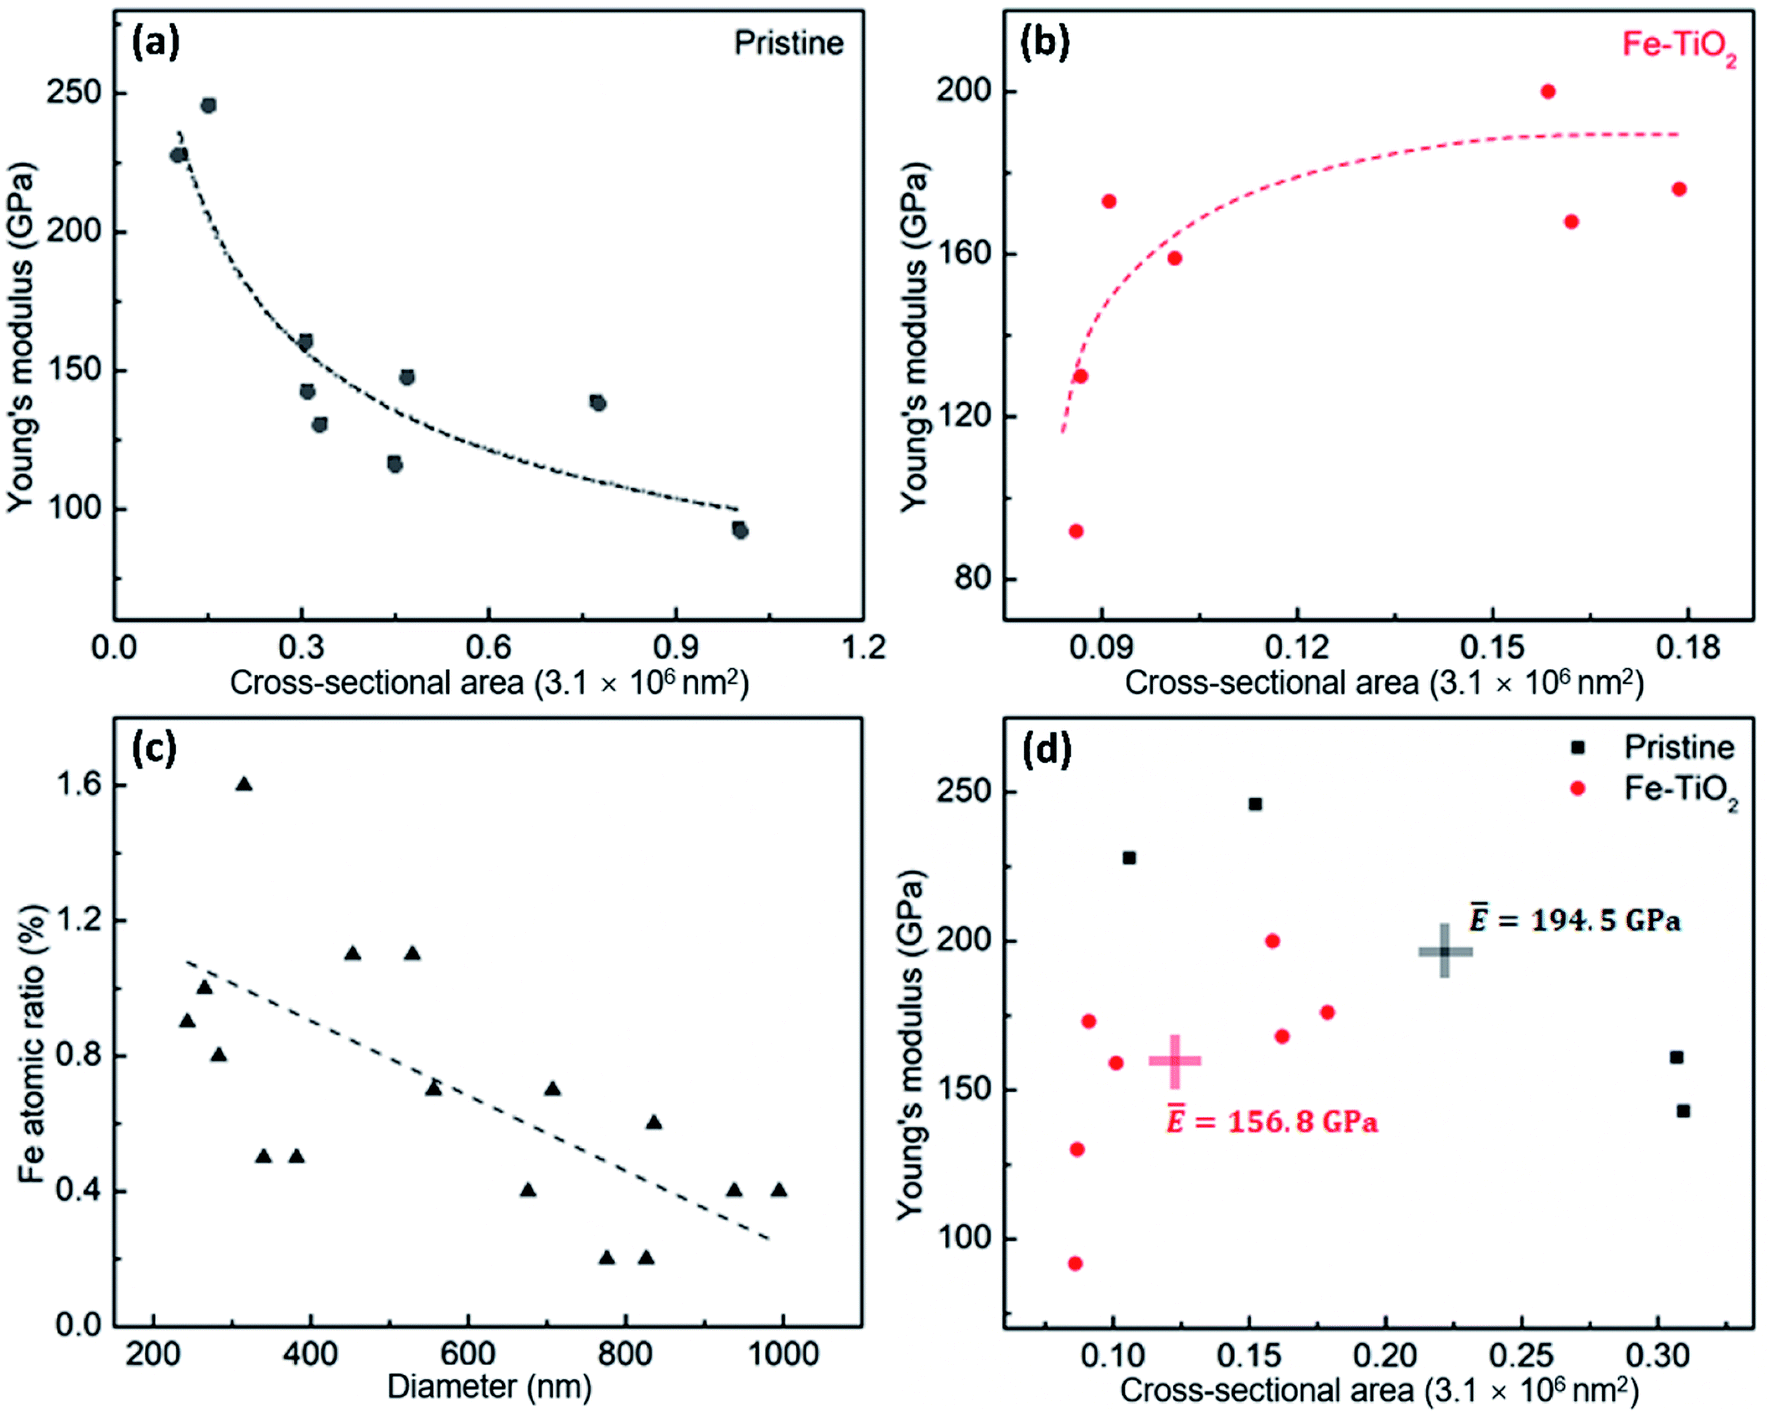 | ||
| Fig. 5 Results of the measured effective elastic moduli of (a) pristine and (b) Fe-doped rutile TiO2 NWs. (c) Relationship between atomic ratio of Fe and diameter of Fe-doped rutile TiO2 NWs. (d) Comparation of elastic moduli of the two kinds of NWs with similar cross-sectional areas. The dashed lines in (a–c) are the corresponding fitted curves. | ||
However, the relationship between elastic modulus and cross-sectional area of the Fe-doped rutile TiO2 NWs displays a reverse trend compared to that of the pristine rutile TiO2 NWs. As shown in Fig. 5b, the elastic modulus of Fe-doped rutile TiO2 NWs increases with the cross-sectional area increasing, ranging from 91.8 GPa to 200 GPa. This is most likely caused by the decreased oxygen vacancy density in the Fe-doped NWs. Fig. 5c shows the quantitative EDS mapping results of Fe in the doped rutile TiO2 NWs with increasing diameter, where the Fe ratio decreases with increasing NW diameter, indicating the increasing oxygen vacancy density caused by Fe-doping.41,42 More oxygen vacancies generated by Fe-doping in TiO2 NWs can increase average bond length and thus result in the reduction of elastic modulus.19,43,44Fig. 5d shows the average elastic moduli of pristine rutile and Fe-doped TiO2 NWs with similar cross-sectional areas (normalized value ranging 0.01–0.31). It is found that the average elastic modulus of pristine rutile TiO2 NWs is 194.5 GPa, which is 24% larger than that of Fe-doped rutile TiO2 NWs (∼156.8 GPa). To be noted, the average cross-sectional area of pristine rutile TiO2 NWs is 1.8 times of that of Fe-doped rutile TiO2 NWs. Hence, the reducing effect on the elastic modulus of rutile TiO2 NWs caused by Fe-doping may be underestimated.
Generally, the levels of oxygen vacancy density in TiO2 vary among different crystalline structures, resulting in the distinctions in the elastic moduli. Table 1 lists the elastic moduli of individual 1D TiO2 nanostructures with different phases obtained using various experimental testing methods. Ignoring the measurement deviations caused by the testing methods, it can be seen that even though the Fe-doping in this work can cause a decrease in elastic modulus of rutile TiO2 NWs, it still makes the elastic modulus larger than that of their 1D anatase and TiO2-B counterparts, respectively. This suggests that even though the Fe-doping can bring a degradation in the elastic modulus of high-quality single-crystalline rutile TiO2 NWs, the doped rutile TiO2 NWs are still stronger than their pristine counterparts with other phases.
| Structures | Young's modulus (GPa) | Size (nm) | Phase | Testing method |
|---|---|---|---|---|
| a Results in this work. | ||||
| Nanofiber45 | 75.6 | Diameter: ∼109 | Polycrystalline anatase | AFM three-point bending |
| NW46 | 11.87 | Diameter: ∼252 | Single-crystalline anatase | SEM bending |
| NW47 | 110.77 | Diameter: 320 | Single-crystalline TiO2-B | AFM bending |
| [210]-oriented NW14 | 56.3 | Diameter: 20–80 | Single-crystalline rutile | SEM tensile test |
| Nanoribbon16 | 120 | Width: 1600; thickness: 60 | Polycrystalline rutile | AFM bending |
| [110]-oriented nanoribbon15 | 360 | Width: 160; thickness: 30 | Single-crystalline rutile | Nanoindentation |
| Bulk48 | 287.9 | Single-crystalline rutile | ||
| Bulk49 | 280 | Single-crystalline rutile | ||
| [001]-oriented NWa | 194.5 | Diameter: ∼998 | Single-crystalline rutile | Three-point bending using a nanoindentor |
| [001]-oriented NWa | 156.8 | Diameter: ∼750 | Single-crystalline Fe-doped rutile | Three-point bending using a nanoindentor |
Conclusions
In conclusion, we investigated the elastic moduli of high-quality single-crystalline pristine and Fe-doped rutile TiO2 NWs. It is found that the sizes of the two kinds of NWs played different roles in their elastic moduli, respectively. The Young's modulus of the pristine NWs was found to decrease with increasing the cross-sectional area, ranging from 246 GPa to 93.2 GPa. However, the elastic modulus of the Fe-doped NWs increased with increasing the cross-sectional area, ranging from 91.8 GPa to 200 GPa, which is related to the increase oxygen vacancy density. Comparing the mean value of the elastic moduli of the two kinds of NWs with similar sizes, it is found that the elastic modulus of Fe-doped rutile NWs (∼156.8 GPa) is 24% smaller than that of the pristine rutile TiO2 NWs (∼194.5 GPa). It is assumed that the vacancies generated by the Fe-doping result in the reduction of elastic modulus of rutile TiO2 NWs. This work can help understand the effects of transition-metal-doping on the elastic properties of TiO2 NWs and offer us a guidance when carrying out strain engineering on transition-metal-doped TiO2 NWs.Conflicts of interest
There are no conflicts to declare.Acknowledgements
We acknowledge the support from the Australian Research Council (ARC) Discovery Project (DP170102861) and the Central Analytical Research Facility (CARF) of Queensland University of Technology (QUT).References
- X. Wang, Z. Li, J. Shi and Y. Yu, Chem. Rev., 2014, 114, 9346–9384 CrossRef CAS PubMed.
- H. Dong, F. Xu, Z. Sun, X. Wu, Q. Zhang, Y. Zhai, X. D. Tan, L. He, T. Xu, Z. Zhang, X. Duan and L. Sun, Nat. Nanotechnol., 2019, 14, 950–956 CrossRef CAS PubMed.
- W. Zhang, L. Cai, S. Cao, L. Qiao, Y. Zeng, Z. Zhu, Z. Lv, H. Xia, L. Zhong, H. Zhang, X. Ge, J. Wei, S. Xi, Y. Du, S. Li and X. Chen, Adv. Mater., 2019, 31, 1906156 CrossRef CAS PubMed.
- D. Li, C. Wei, J. Song, X. Huang, F. Wang, K. Liu, W. Xiong, X. Hong, B. Cui, A. Feng, L. Jiang and Y. Lu, Nano Lett., 2019, 19, 4195–4204 CrossRef CAS PubMed.
- Z. Li, J. Chen, J. Yang, Y. Su, X. Fan, Y. Wu, C. Yu and Z. L. Wang, Energy Environ. Sci., 2015, 8, 887–896 RSC.
- L. Zhang, L. Sun, Z. Guan, S. Lee, Y. Li, H. D. Deng, Y. Li, N. L. Ahlborg, M. Boloor, N. A. Melosh and W. C. Chueh, Nano Lett., 2017, 17, 5264–5272 CrossRef CAS PubMed.
- C. Zhang, O. Cretu, D. G. Kvashnin, N. Kawamoto, M. Mitome, X. Wang, Y. Bando, P. B. Sorokin and D. Golberg, Nano Lett., 2016, 16, 6008–6013 CrossRef CAS PubMed.
- L. Wang, P. Liu, P. Guan, M. Yang, J. Sun, Y. Cheng, A. Hirata, Z. Zhang, E. Ma, M. Chen and X. Han, Nat. Commun., 2013, 4, 2413 CrossRef PubMed.
- J. R. Greer, W. C. Oliver and W. D. Nix, Acta Mater., 2005, 53, 1821–1830 CrossRef CAS.
- L. Wang, K. Zheng, Z. Zhang and X. Han, Nano Lett., 2011, 11, 2382–2385 CrossRef CAS PubMed.
- G. Dong, S. Li, M. Yao, Z. Zhou, Y.-Q. Zhang, X. Han, Z. Luo, J. Yao, B. Peng, Z. Hu, H. Huang, T. Jia, J. Li, W. Ren, Z.-G. Ye, X. Ding, J. Sun, C.-W. Nan, L.-Q. Chen, J. Li and M. Liu, Science, 2019, 366, 475–479 CrossRef CAS PubMed.
- J. Narvaez, F. Vasquez-Sancho and G. Catalan, Nature, 2016, 538, 219–221 CrossRef CAS PubMed.
- M. Humar, D. Arčon, P. Umek, M. Škarabot, I. Muševič and G. Bregar, Nanotechnology, 2006, 17, 3869 CrossRef.
- S. S. Amin, S.-y. Li, X. Wu, W. Ding and T. T. Xu, Nanoscale Res. Lett., 2010, 5, 338 CrossRef CAS PubMed.
- X. Wu, S. S. Amin and T. T. Xu, J. Mater. Res., 2010, 25, 935–942 CrossRef CAS.
- Y. Wang, R. Wang, C. Guo, J. Miao, Y. Tian, T. Ren and Q. Liu, Nanoscale, 2012, 4, 1545–1548 RSC.
- B. Liu, H. M. Chen, C. Liu, S. C. Andrews, C. Hahn and P. Yang, J. Am. Chem. Soc., 2013, 135, 9995–9998 CrossRef CAS PubMed.
- Y. Matsumoto, M. Murakami, T. Shono, T. Hasegawa, T. Fukumura, M. Kawasaki, P. Ahmet, T. Chikyow, S.-y. Koshihara and H. Koinuma, Science, 2001, 291, 854–856 CrossRef CAS PubMed.
- S. Wang, Z. Shan and H. Huang, Adv. Sci., 2017, 4, 1600332 CrossRef PubMed.
- Y. Chen, T. Burgess, X. An, Y.-W. Mai, H. H. Tan, J. Zou, S. P. Ringer, C. Jagadish and X. Liao, Nano Lett., 2016, 16, 1911–1916 CrossRef CAS PubMed.
- A. Bo, H. Zhan, J. Bell, H. Zhu and Y. Gu, RSC Adv., 2014, 4, 56970–56976 RSC.
- Y. J. Kim, K. Son, I. C. Choi, I. S. Choi, W. I. Park and J.-i. Jang, Adv. Funct. Mater., 2011, 21, 279–286 CrossRef CAS.
- E. Pickering, A. Bo, H. Zhan, X. Liao, H. H. Tan and Y. Gu, Nanoscale, 2018, 10, 2588–2595 RSC.
- J. Kosmaca, R. Meija, M. Antsov, G. Kunakova, R. Sondors, I. Iatsunskyi, E. Coy, J. Doherty, S. Biswas, J. D. Holmes and D. Erts, Nanoscale, 2019, 11, 13612–13619 RSC.
- A. Banerjee, D. Bernoulli, H. Zhang, M.-F. Yuen, J. Liu, J. Dong, F. Ding, J. Lu, M. Dao, W. Zhang, Y. Lu and S. Suresh, Science, 2018, 360, 300–302 CrossRef CAS PubMed.
- Q. Liu, H. Zhan, H. Zhu, H. Liu, Z. Sun, J. Bell, A. Bo and Y. Gu, Nano Lett., 2019, 19, 7742–7749 CrossRef CAS PubMed.
- Q. Liu, H. Zhan, H. Zhu, Z. Sun, J. Bell, A. Bo and Y. Gu, Nanoscale, 2019, 11, 11847–11855 RSC.
- C. Chisholm, H. Bei, M. Lowry, J. Oh, S. S. Asif, O. Warren, Z. Shan, E. P. George and A. M. Minor, Acta Mater., 2012, 60, 2258–2264 CrossRef CAS.
- Y. Calahorra, O. Shtempluck, V. Kotchetkov and Y. E. Yaish, Nano Lett., 2015, 15, 2945–2950 CrossRef CAS PubMed.
- A. Roy, J. Mead, S. Wang and H. Huang, Sci. Rep., 2017, 7, 9547 CrossRef PubMed.
- S. Wang, Y. Wu, L. Lin, Y. He and H. Huang, Small, 2015, 11, 1672–1676 CrossRef CAS PubMed.
- Y. Sun, Y. Chen, H. Cui, J. Wang and C. Wang, Small, 2017, 13, 1700389 CrossRef PubMed.
- X. Pan, M.-Q. Yang, X. Fu, N. Zhang and Y.-J. Xu, Nanoscale, 2013, 5, 3601–3614 RSC.
- Q. Liu, F. Cao, F. Wu, H. Lu and L. Li, Adv. Mater. Interfaces, 2016, 1600256 CrossRef.
- Y. Sun, C. Lu, H. Cui, J. Wang, Y. Ma and C. Wang, Nanoscale, 2015, 7, 4912–4919 RSC.
- A. Heidelberg, L. T. Ngo, B. Wu, M. A. Phillips, S. Sharma, T. I. Kamins, J. E. Sader and J. J. Boland, Nano Lett., 2006, 6, 1101–1106 CrossRef CAS PubMed.
- D. Hally, Calculation of the Moments of Polygons, Defence Research Establishment Suffield Ralston, Alberta, 1987 Search PubMed.
- F. Xu, Q. Qin, A. Mishra, Y. Gu and Y. Zhu, Nano Res., 2010, 3, 271–280 CrossRef CAS.
- C. Chen, Y. Shi, Y. S. Zhang, J. Zhu and Y. Yan, Phys. Rev. Lett., 2006, 96, 075505 CrossRef CAS PubMed.
- R. E. Miller and V. B. Shenoy, Nanotechnology, 2000, 11, 139 CrossRef CAS.
- A. Ali, I. Ruzybayev, E. Yassitepe, S. I. Shah and A. S. Bhatti, J. Phys. Chem. C, 2013, 117, 19517–19524 CrossRef CAS.
- S. Rehman, H. Kim, M. F. Khan, J.-H. Hur, A. D. Lee and D.-k. Kim, Sci. Rep., 2019, 9, 1–10 CrossRef CAS PubMed.
- S.-H. Jhi, S. G. Louie, M. L. Cohen and J. Ihm, Phys. Rev. Lett., 2001, 86, 3348 CrossRef CAS PubMed.
- J. Wang, C. Lu, Q. Wang, P. Xiao, F. Ke, Y. Bai, Y. Shen, X. Liao and H. Gao, Nanotechnology, 2011, 23, 025703 CrossRef PubMed.
- S.-H. Lee, C. Tekmen and W. M. Sigmund, J. Mater. Sci. Eng. A, 2005, 398, 77–81 CrossRef.
- M. Chang, J. R. Deka, C. H. Lin and C. C. Chung, Key Eng. Mater., 2010, 437, 66–69 CAS.
- Z. Ye, H. Zhu, Y. Zheng, W. Dong and B. Chen, J. Mater. Sci. Eng. A, 2015, 641, 281–289 CrossRef CAS.
- D. G. Isaak, J. D. Carnes, O. L. Anderson, H. Cynn and E. Hake, Phys. Chem. Miner., 1998, 26, 31–43 CrossRef CAS.
- U. Diebold, Surf. Sci. Rep., 2003, 48, 53–229 CrossRef CAS.
Footnote |
| † Electronic supplementary information (ESI) available. See DOI: 10.1039/d0na00284d |
| This journal is © The Royal Society of Chemistry 2020 |