DOI:
10.1039/D0NA00263A
(Paper)
Nanoscale Adv., 2020,
2, 3444-3451
Enhanced desalination performance in compacted carbon-based reverse osmosis membranes†
Received
3rd April 2020
, Accepted 28th June 2020
First published on 2nd July 2020
Abstract
Reverse osmosis membranes typically suffer compaction during the initial stabilization stage due to the applied hydraulic pressure, altering the desalination performance. The elucidation of the underlying transformations during compaction is key for further development of new membranes and its deployment in real-world scenarios. Hydraulic compaction of amorphous carbon (a-C) based membranes under cross-flow operation for water purification and desalination has been observed experimentally, and analysed employing molecular dynamics simulations. The previous outstanding separation performance for carbon membranes, especially for the nitrogen-containing (a-C:N) type, has been studied during compaction using lab-scale cross-flow desalination membrane systems. Our results indicate that the high-water pressure induces an overall reduction in the interstitial spaces within the a-C structure. Remarkably, the compacted a-C:N membrane exhibits improved performance in salt rejection and water permeability, compared to the a-C based membrane. Our analysis shows that performance improvement can be related to the higher mechanical stability of the carbon structure due to the presence of nitrogen sites, which also promote water diffusion and permeability. These results show that a-C:N based membranes are a feasible alternative to conventional polymeric membranes.
1. Introduction
The optimization of carbon nanostructured materials towards functional systems that can compete with current technologies is one of the top priorities of many research groups. In the past few years, our group has been proposing several alternatives to traditional polymeric based reverse osmosis (RO) membranes for water desalination and purification, such as carbon nanotube-polyamide nanocomposite membranes,1 and disruptive proposals such as graphene/graphene oxide2 and nitrogenated amorphous carbon (a-C:N) based membranes.3 The usability of these and other nanostructured materials-based membranes is still under intense development, considering that the operating conditions during practical applications of membrane systems are harsher compared with typical conditions in a laboratory, and these novel materials still have not yet been tested against long-term operational performance of current polymeric commercial membranes. Particularly, in the case of membrane systems used in water desalination and purification deployments, the phenomenon of membrane compaction produced by hydraulic pressure is well known and considered a part of the stabilization process after the installation of new membrane modules. Usually, this membrane compaction leads to a reduction in its permeability, with an associated increase in solute rejection performance.4 Interestingly, the compaction process has been addressed for some thin-film composite membranes, and represented through relationships such as the Voigt–Wiechert model,5 which accounts for the influence of the viscoelastic properties of the base polymer of the membrane. These properties are defined from the membrane porosity, tortuosity and thickness, all of them being parameters related to the polymer structure. Naturally, the usage of novel nanostructured materials would imply differences in these membrane properties, which need to be studied and described in detail.
The compaction phenomenon has been well described for conventional polymer-based membranes. For example, one study describes the compaction as a time-dependent process related to membrane structure, viscoelastic properties of the polymer in the active layer, and the time-dependent sorption of the feed within the membrane.6 This work also uses a mathematical model (the Burger model with a Kevin–Voigt element),7 to account for the tensile strength and viscosity changes during compression of the polymer. Moreover, it has been reported that under specific circumstances, compaction can be used for increasing the retention properties, at least for ultrafiltration membranes.8 In general, these studies rely on the well-developed background of mechanical characterization of polymers, in conditions where water sorption and hydraulic compression are relatively common. Nevertheless, to the best of our knowledge, compaction by hydraulic pressure has been scarcely studied in deep for carbon nanostructured-based membranes.9–11 For instance, there is research assessing the compaction in nanocomposite RO membranes made of non-porous silica and microporous zeolite nanoparticles embedded in the support membrane (typically polysulfone), but not in the active RO membrane layer.12 The report arguments that the presence of such nanostructures in the support layer increases the mechanical stability of the membrane system, reducing its compaction upon the appearance of hydraulic pressure. Given this lack of analysis for membrane related phenomena occurring with nanostructured carbon membrane, we consider that is necessary to address processes like compaction, especially for membrane systems in application-scale experiments, and at relatively high-pressures which would open possibilities to new setups.13
As demonstrated previously, membranes based on a-C:N films were successfully developed, and their performances during water desalination tests were reported.3 This development was based on applied research of amorphous carbons such as diamond-like-carbon (DLC) and related materials,14–16 exploiting the proven advantages of nitrogen incorporation within their structures. Currently, a-C:N based materials are mainly proposed as promising candidates for catalysis applications, due to their increased catalytic activity at regions where nitrogen atoms are incorporated,17–19 but relevant research has demonstrated that the N-doping of carbon nanostructures can have a broader impact towards alternative applications. For example, the inclusion of nitrogen within carbonaceous networks has been consistently reported as a factor for carbon network restructuring,20 including the increase of its graphitic/metallic nature and alteration to their mechanical properties, leading to increased structural stability.21 It could be argued that the improvement in structural stability is one of the underlying explanations for the observed increase in water desalination performance of a-C:N based membranes, given that the improved flexibility allows the use of thinner membranes, which in principle exhibit higher permeability. In addition, relevant reports on the pore structure of pure and N-doped DLC membranes,3,14 related to water permeation, suggest significant effects of structure compaction in the overall membrane separation performance. This work aims to deepen the understanding of the effects of hydraulic pressure induced compaction in a-C based membranes, operated in cross-flow setup for water desalination experiments.
2. Materials and methods
2.1 Membrane synthesis
a-C and a-C:N based membranes were produced as reported before, by high-power impulse magnetron sputtering.3 Briefly, a thin film of a-C or a-C:N was deposited in top of a polymeric porous substrate made of polysulfone (PSU, Alfa Laval GR40PP ultrafiltration membrane) as used typically for RO membranes. The carbon films were formed from a graphite source (99.999% pure C, Myojo Kinzoku, Osaka, Japan) sputtering and plasma polymerization, using a stream of Ar (44 cm3 min−1) for the a-C thin film, and a mixture of Ar (44 cm3 min−1), N2 (44 cm3 min−1) and CH4 (4 cm3 min−1) for the a-C:N thin film, as gaseous precursors in a high-power impulse magnetron sputtering system (HiPIMS, ICF-500SHp, Nanotech, Chiba, Japan). The resulting membranes were rinsed in a mixture of water–ethanol (1![[thin space (1/6-em)]](https://www.rsc.org/images/entities/char_2009.gif) :1) before being placed in a laboratory-scale cross-flow system for compaction experiments.
:1) before being placed in a laboratory-scale cross-flow system for compaction experiments.
2.2 Membrane compaction and performance measurements
Fig. 1 describes the setup used for cross-flow experiments on the carbon-based membranes. In summary, the membrane under test (circular membrane samples, with an effective area of 3.46 cm2) was placed inside a stainless-steel module, dividing a pressurized section where the concentrate water flows (top section), and a permeate section, where the permeate flows outside the system. The membrane module was first pressurized by pumped pure water in a laboratory-scale cross-flow system for water desalination tests (MK-FMT-1-CH, Mikunikikai, Osaka Japan), at a constant transmembrane pressure of 5.5 MPa during a period of 22 h as compaction phase, after which the desalination performance was determined for each analysed membrane sample.
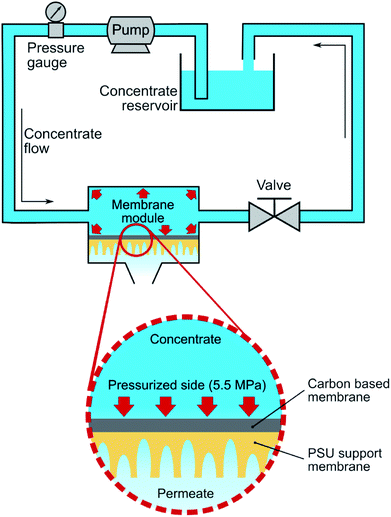 |
| | Fig. 1 Scheme of the laboratory-scale cross-flow setup used for a-C based membranes compaction and test. The membrane was placed on a cell where a hydraulic transmembrane pressure of 5.5 MPa was used during compaction and desalination phases. | |
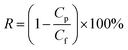
For salt rejection and water permeation performance tests, a-C and a-C:N membranes, with and without a previous compaction phase, were compared by laboratory-scale cross-flow experiments using a NaCl water solution (concentration of 3.2 wt%, equivalent to sea-water salinity). The transmembrane pressure during all tests was set to 5.5 MPa. As in the previous report, the permeated water flux (J) and salt rejection (R) were measured as follows:
| |  | (1) |
where
J is expressed in L m
−2 h
−1 (LMH), Δ
V corresponds to the permeated volume during the Δ
t time, and
A is the membrane effective area. The rejection performance is reported as:
| |  | (2) |
where
R is the NaCl rejection,
Cp is the permeate NaCl concentration, and
Cf corresponds to the saline water feed's original concentration. The NaCl concentrations were measured by a solution conductivity meter (Horiba Scientific LAQUAct ES-71, Kyoto, Japan). The results for permeate flux and salt rejection are the averages of 3–5 independent measurements, taken when their values were stable over time.
2.3 Characterization routines
Surface morphological characterization was carried out by scanning electron microscopy (SEM, Hitachi SU8000 FE-SEM), done on membrane samples before and after compaction tests. Transmission electron microscopy (HR-TEM, JEOL JEM 2100F, Tokyo, Japan) was performed also over membrane samples with and without compaction, transferring the a-C and a-C:N thin layers to TEM copper grids by dissolving the PSU substrates after desalination experiments.
2.4 Computational simulations
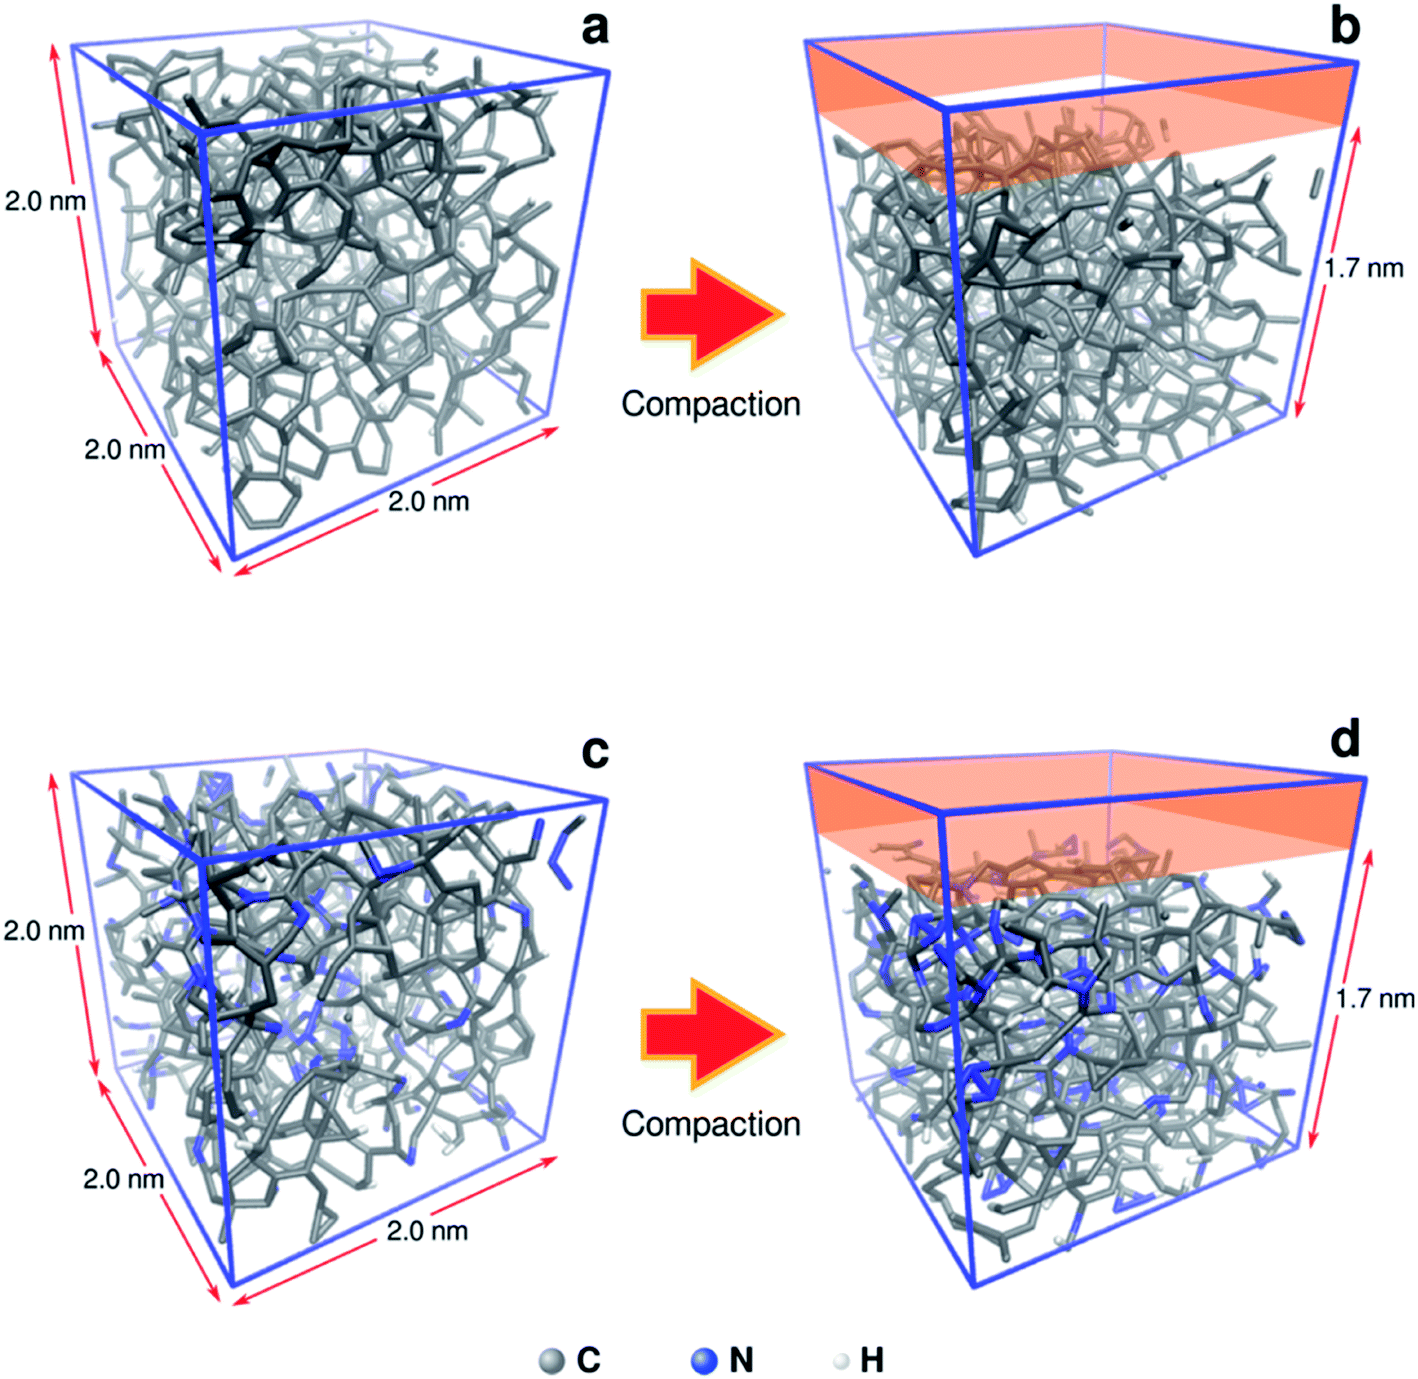
To understand in more detail the role of compacted a-C:N structure, we performed molecular dynamics (MD) using LAMMPS simulation package.22 The systems under analysis were two cubic a-C cells, one for simple a-C, and the other one for nitrogenated a-C (a-C:N), with 2.0 × 2.0 × 2.0 nm as x, y, z orthogonal dimensions (see Fig. 2). The cells contained 994 atoms in total, from which 10% were hydrogen atoms. In the case of the a-C:N cell, the content of nitrogen was fixed to 20%. The starting fraction of sp2 hybridized carbon in both cells was fixed to be 50% of total carbon. For the simulations, the Reax/C pair potential was used for all atom types, as implemented within the LAMMPS package.23
 |
| | Fig. 2 Molecular models of a-C (a, b) and nitrogenated a-C (c, d) used for compaction simulation. The original size of the cubic cells is 2.0 nm each side. The compaction process was simulated as a reduction of 15% in volume on the z dimension (from 2.0 to 1.7 nm). | |
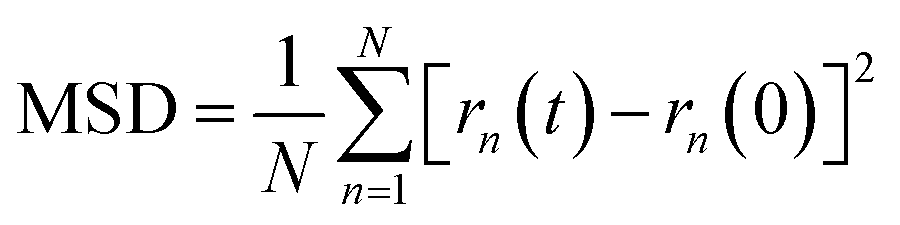
The simulations routine consisted in two phases: first, a molecular relaxation step was applied to both cells, to minimize the energy of the initial structure (conjugate gradient algorithm, with tolerances for energy changes (etol) of 1.0 × 10⁻⁶ and for global force vector (ftol) of 1.0 × 10⁻⁶ Kcal mole−1 Å−1). After the structural energy minimization, simulated annealing was performed, by a heating ramp using a Nose–Hoover thermostat under the NVT ensemble from 10 K to 300 K in 50 ps. Finally, the a-C cells were maintained at 300 K during an additional 50 ps, followed by a calculation of the radial distribution function (RDF) for the C–C pairs on the relaxed a-C cells, using the algorithm as implemented in the VMD visualization and analysis software.24 The second phase consisted of the random incorporation of water molecules inside the a-C and a-C:N cells, (10 at% of the carbon structure). After this, the cells were subjected to an MD run for 200 ps, at 300 K as temperature target. Once the MD run was completed, the trajectory files were used to compute the mean-squared displacement (MSD) of water, using the average trajectory of water molecules, monitored as the oxygen atoms position, as:
| |  | (3) |
being
N the number of water molecules within a-C cells, and
rn their position in time
t. Furthermore, the diffusion coefficient (
D) is derived from the slope of the MSD plot (squared distance
vs. time).
3. Results and discussion
3.1 Salt rejection and water permeation
To understand the compaction effect on the filtration performance, the a-C and a-C:N membranes were compacted at 5.5 MPa for 22 h Table 1 presents the salt rejection and water permeability results measured during cross-flow experiments. The results show also the effect of membrane compaction on the rejection and permeability performance. As it can be observed, the performance for both types of membranes (a-C and a-C:N without compaction) is clearly contrasting; while the a-C:N membrane has a NaCl rejection of 96.5% and a water permeability around 9.5 LMH, the a-C membrane shows no rejection (0.0%), with an extremely high water permeability around 130.0 LMH. These results can be compared with previous reports on thinner a-C membranes,3 where water fluxes were higher but rejections were lower for a-C:N membranes (see Fig. S1 in ESI†). The superior performance of a-C:N is attributed to the presence of nitrogenated sites within the carbon amorphous network, which provide enhanced mechanical stability and improved water permeability, compared to the pure carbon-based a-C membrane. One experimental observation we could make at the moment of handling a-C and a-C:N membranes was that the a-C based membranes were more sensitive to mechanical stress, with an increased proneness to fractures and other related structural damages, given the rigidity of the pure carbon network. This would explain why the salt rejection performance for a-C based membranes was practically zero, whereas the water permeability appeared too high for an RO membrane. Contrastingly, the NaCl rejection performance for a-C:N membranes was 96.5% on average, with corresponding water permeability of 9.5 LMH. These results, as discussed when reporting the a-C:N membranes for first the time,3 explained by the enhanced structural flexibility, and augmented hydrophilicity within the amorphous carbon network, given by the presence of the nitrogen species.
Table 1 Salt rejection and water permeability results for a-C and a-C:N, before and after compaction process
| Membrane |
NaCl rejection (%) |
Water permeation (LMH) |
| a-C |
No compacted |
0.0 |
130.0 |
| Compacted |
7.4 |
28.5 |
| a-C:N |
No compacted |
96.5 |
9.5 |
| Compacted |
97.6 |
10.6 |
The next membrane assessment phase consisted in the rejection andpermeation tests for membranes after the compaction process. The results, also shown in Table 1, reveal an increase in both parameters, with values of 97.6% of salt rejection (an increase of c.a. 1.1%) and 10.6 LMH (an increase of c.a. 1.1 LMH) for a-C:N membranes. It is noteworthy that the compaction process seems to improve both membrane parameters, otherwise, typically rejection and permeability are inversely related (i.e., higher rejection rates is present at low permeabilities). This could be linked to the fact that the nitrogen-groups induced hydrophilicity on the a-C network occurs at a much smaller scale than the structural modifications consequence of the compaction process, thus having a negligible effect on the overall water permeability for the a-C:N membrane. Now, contrastingly, the rejection for the a-C membranes also shows marginal improvement, going from 0.0% to 7.4%, whereas the permeability decreases from 130.0 to 28.5 LMH, as it could be expected for conventional membranes. These results agree with other works which explain that the membrane deformation due to hydraulic compaction leads to reductions in membrane thickness, pore size and porosity,25 and thus their selectivity can be compromised at certain values of applied transmembrane pressure.4
3.2 Structural characterization results
Fig. 3 displays SEM images of top and side views for a-C and a-C:N membranes, before and after hydraulic compaction. The top images (a–d) reveal no visible defects that can account for the difference in rejection and permeability performance, neither before nor after the compaction process. Nevertheless, the insets show a more clustered composition for the a-C membrane, compared to the a-C:N membrane. This lack of clustering in a-C:N has been previously attributed to one of the effects of nitrogen incorporation within carbon amorphous networks,3 which would also be related to their enhanced separation performance: i.e., the homogenization of the carbon network density. In fact, in our previous report on a-C based membranes, theoretical modeling of such cells revealed a free volume vs. total cell volume ratio of 0.46, 0.37, and 0.30 for pure a-C, a-C:N with 11 at% of nitrogen, and 22 at% of nitrogen, respectively.3 Those results agreed with the observed experimental results described then and in this report. The side views are shown only for membranes before compaction (e, f), since the differences after compaction were not visible at that scale. Nonetheless, the images reveal the thin (below 100 nm) carbon-based active layer, which is supported by a typical PSU porous substrate. According to our previously reported results, the nitrogen incorporation effectively avoids the formation of high-density carbon clusters, as the ones presumably observed preferentially in the SEM insets of Fig. 3 for a-C membrane samples. The structural network of the a-C:N membranes would possess a homogeneous density, which avoids the presence of cavities or empty spaces where the dissolved ions could diffuse easily.
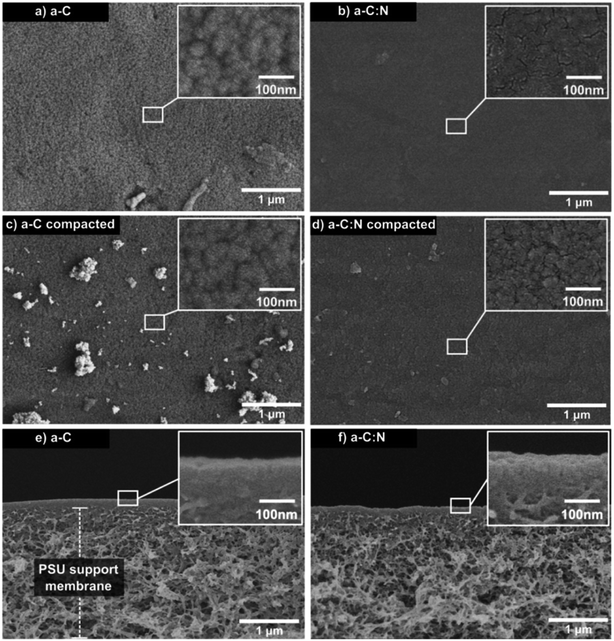 |
| | Fig. 3 SEM images of carbon-based membranes. Images (a) and (c) show top views for the a-C membranes before and after compaction, respectively, whereas (b) and (e) show the same for a-C:N based membranes. (e and f) Display side views for a-C and a-C:N membranes respectively, where the PSU porous support can be visualized. | |
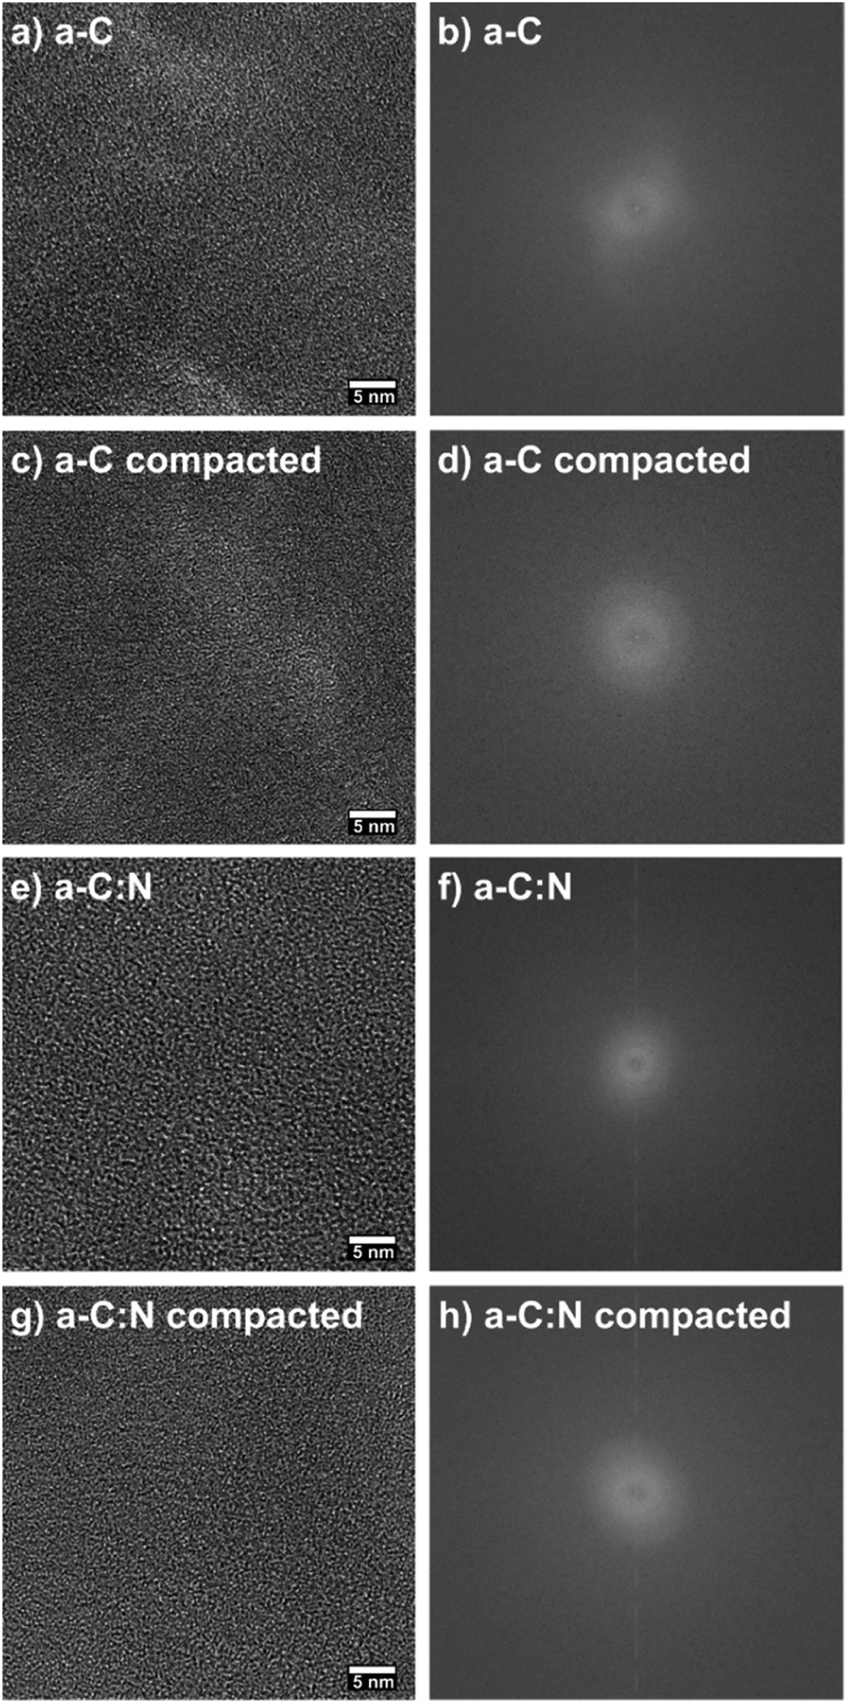
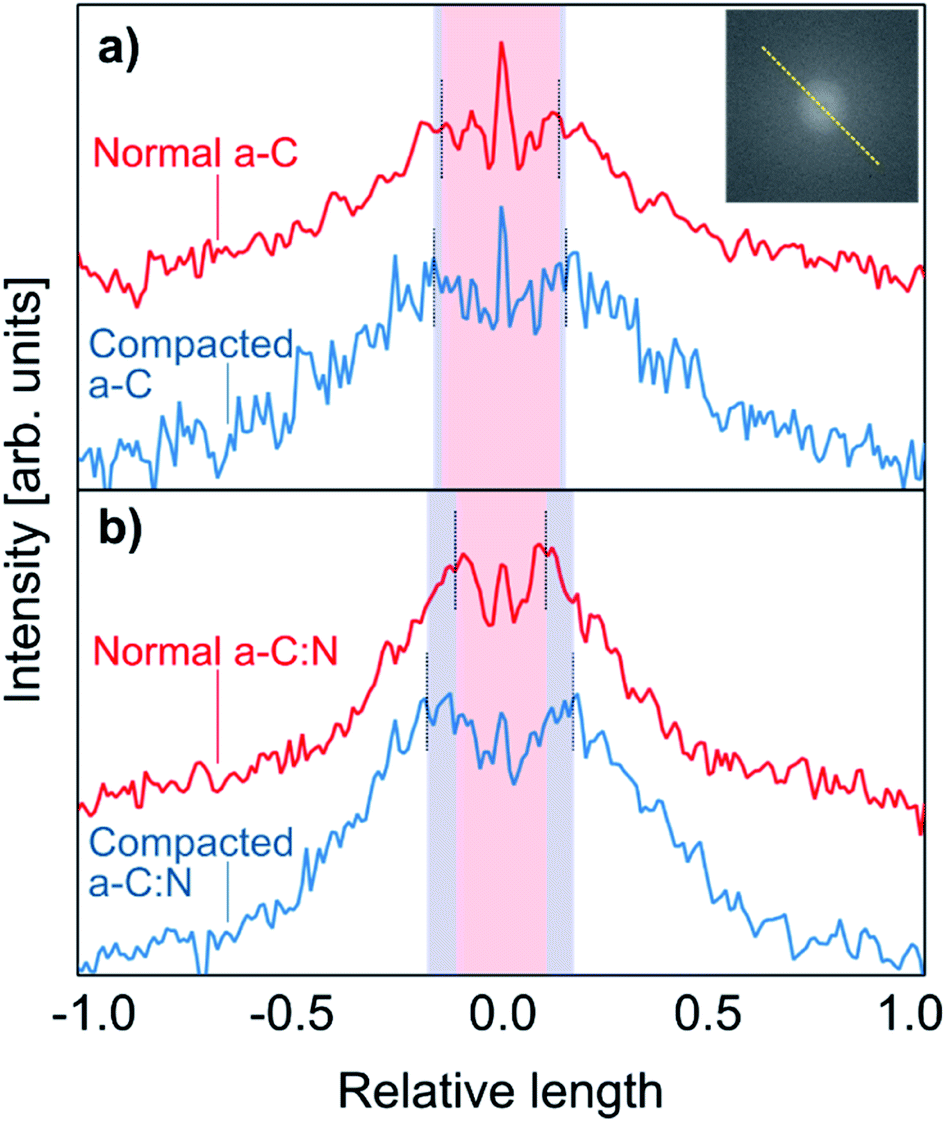
The observed results for salt rejection and water permeability improvements after compaction would be related to significant structural changes. Fig. 4 presents TEM images for the a-C and a-C:N membranes, before and after the compaction process. The images in Fig. 4(a), (c), (e) and (g) show the actual amorphous carbon network, whereas the Fig. 4(b), (d), (f) and (h) display the simulated diffraction patterns corresponding to each TEM image (calculated by fast-Fourier-transform or FFT algorithm, as implemented in ImageJ26). By the analysis of the TEM images, it can be observed that there is no specific arrangement on the carbon structure, either before or after compaction. All of the micrographs show an amorphous structure, which is observed on the corresponding FFT calculated image. The presence of diffuse halos indicates a distribution of spacings that, by analysing the profile plots in Fig. 5, are more sensitive to the hydraulic pressure, in the case of the a-C:N structures, compared to those of a-C structures. This can be inferred from the increased spacing (in reciprocal space) between the intensity peaks of the profiles for the a-C:N membranes after experimental hydraulic compaction; the pink shaded areas behind the plots represent the space between the peaks before compaction, and the blue shaded areas represent the change (increase) after compaction. The fact that the inter-peak spacings are larger for compacted membranes implies that, in the real structure, the spacings are getting smaller. Remarkably, the a-C:N samples show the largest change (interpeak space reduced around 12% and 60%, for a-C and a-C:N membranes respectively), which can be explained by the increased flexibility of the amorphous network due to the presence of nitrogen groups.
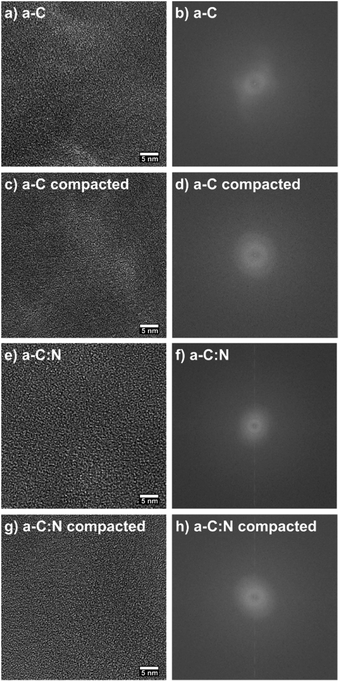 |
| | Fig. 4 TEM images of a-C before (a) and after (c) compaction, and for a-C:N before (e) and after (g) compaction. The corresponding images to the right (b, d, f, and g) show the FFT simulated diffraction patterns, where the halos can indicate changes in the interstitial spacing due to the membrane compaction process. | |
 |
| | Fig. 5 Intensity profiles taken on the FFT calculated patterns, from the TEM images shown in Fig. 4. The profiles correspond to the intensity profile along the dashed yellow line as pictured in the inset. The top plots (a) correspond to the a-C membranes, before (red) and after (blue) compaction, whereas the bottom (b) plots correspond to the a-C:N membranes. The pink central shaded areas represent the space between the intensity peaks for uncompacted membranes, and the blue shades show the increment in spacing (reciprocal space) due to the compaction process. | |
3.3 Molecular simulations results
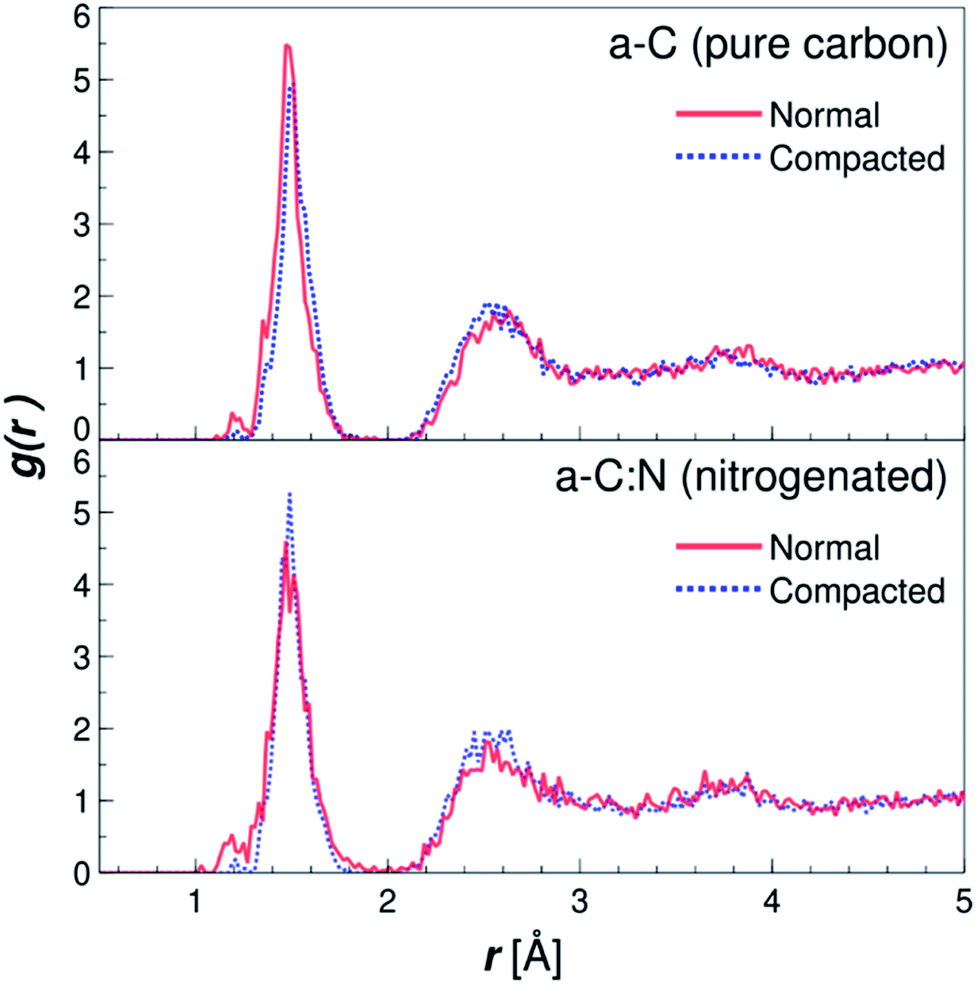
The MD results for the a-C cells show interesting characteristics that support the experimental observations. Fig. 6 displays the RDFs for both types of simulated a-C cells: pure and nitrogenated carbon. The RDFs were also calculated before and after the compaction process, to assess the changes in the C–C neighbouring that could arise from a reduction of 15% in volume. As can be seen by the plots, the changes inboth cases are negligible, since the main peak around 1.44 Å does not change significantly either in position nor intensity. This is an indication of the overall invariability of the carbonaceous structure for both types of a-C cells after compaction, which is in part one of the attractive characteristics of this kind of carbon material. Nevertheless, if we compare now the changes in water diffusivity induced by the compaction process, as shown in Fig. 7, it can be noted that the a-C:N exhibits a considerable alteration in its water permeability. For the a-C structure, the diffusion coefficient (D) has a reduction of ca. 12% (from 3.03 × 10⁻⁵ cm2 s−1 to 2.66 × 10⁻⁵ cm2 s−1), while for the a-C:N, D presents a reduction of ca. 46% (from 3.29 × 10⁻⁵ cm2 s−1 to 1.78 × 10⁻⁵ cm2 s−1). It is noteworthy also that the starting (non-compacted) D for a-C:N is slightly higher than the simple a-C (3.29 × 10⁻⁵ cm2 s−1vs. 3.03 × 10⁻⁵ cm2 s−1), which is one of the characteristics observed clearly during membrane experiments. It is important to highlight that the calculations for the diffusion coefficient indicate the mobility of water molecules within the a-C structure, without the presence of an applied external pressure as a driving force. The fact that D is more sensitive to the structure compaction of a-C:N would then be associated with the effective flexibility of the nitrogenated structure, which would be strongly correlated to its mechanical stability, and consequent superior desalination performance. This can also explain the difference in simulated D with experimental results, where it was observed that a-C membranes display a wider dispersion in measured permeability values. Furthermore, the experimental a-C membranes, in contrast with simulated models, have a clustered and brittle structure, which can result in micro-fractures that produce high water permeabilities with low (or even zero) rejection.
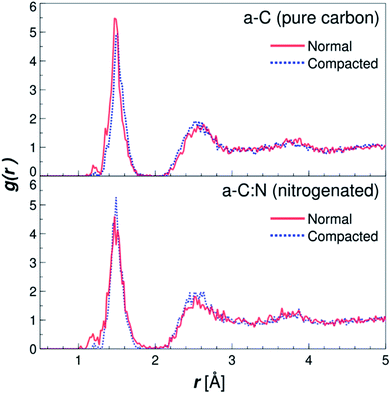 |
| | Fig. 6 Radial distribution functions (RDF) for the simple (a-C) and nitrogenated (a-C:N) amorphous carbon cells. The RDFs are plotted for both structures, before (solid lines) and after (dotted lines) compaction of 15% in volume (see Fig. 2), calculated as C–C pair distribution functions. | |
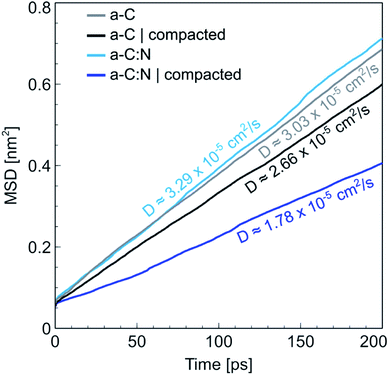 |
| | Fig. 7 Mean squared displacement (MSD) for water in a-C and (nitrogenated) a-C:N. The plots are shown for cells in a normal and compact state. The water diffusivity, calculated as the slope of the MSD plot, indicates a larger difference between normal and compacted state for the a-C:N cell, compared with the difference shown by plain a-C cell. | |
It is important to analyse these results from the perspective of previous reports. When we informed about the initial desalination and rejection performance of the a-C:N based membranes,3 we compared the water fluxes with other seminal works on a-C based membranes.27–29 The conclusions were that the nitrogen groups within the carbon structure allow the enhanced water permeability, by promoting a hydrophilic environment due to the charged induced regions in nitrogenated sites. Some recent research has proposed that heavily nitrogenated tetrahedral carbons (basically carbonitrides) exhibit good properties for seawater desalination.30 Other recent theoretical approaches for studying the water permeation on carbon-based membranes propose instead the control of the pores in the carbon structure as a feasible method for tuning the water permeability. For instance, Babicheva et al.31 proposed recently a carbon structure with a specific arrangement of pores that, according to density functional theory (DFT) and MD simulations, can produce a water flux up to 140 L cm−2 h−1, which could be a considerably high value for real membrane systems, but understandable given that the simulation was done using a single atomic layer of the proposed carbon membrane. Contrastingly, the calculated diffusion coefficients are lower (up to 1.75 × 10⁻⁵ cm2 s−1) than the ones calculated for our a-C and a-C:N based membranes (within 1.7 × 10⁻⁵ to 3.3 × 10⁻⁵ cm2 s−1, see Fig. 7). Another recent work emphasizes, using results from DFT simulations, on the importance of the porous structure in carbon-based membranes,32 arguing that the pore size should be larger than the van der Waals diameter for water molecules (2.8 Å), but small enough to separate the hydrated ions, in case of desalination membranes. Regarding this, we observed and reported3 that actually, the a-C based membranes exhibit a porous structure within the range that allows the water molecules passage. Moreover, the a-C:N nanostructure results in a more uniform pore distribution, which, given the results shown here, presents improved flexibility that makes the nitrogenated carbon structures resilient to the mechanical stress imposed by hydraulic pressure during compaction, as already discussed and shown in Fig. 5.
4. Conclusions
The results from experimental routines in lab-scale cross-flow systems, supported by evidence from molecular dynamics simulations, demonstrated that the nitrogen presence within the a-C structure plays a crucial role in the improved performance upon hydraulic compaction of carbon-based membranes for water desalination applications. Specifically, the a-C:N mechanical resilience allowed for a membrane compaction process that did not affect the structural integrity of the carbonaceous network. Remarkably, even with the compacted, and thus reduced pore size within the a-C:N based membranes structure, the water permeability did not show a significant decrease experimentally, compared with the a-C based membranes. At the same time, the rejection performance improved with compaction, as it occurs in most membranes systems. These results, in line with our previous reports, can be attributed to the increased flexibility and hydrophilicity induced in carbon networks by nitrogen groups incorporation. The present membrane is an attractive alternative to polymeric membranes, entirely composed of carbon and nitrogen in the active layer. The a-C:N based membranes proposed here are thus a competitive candidate for water treatment setups where high hydraulic pressures pose a problem for efficient membrane operations.
Conflicts of interest
The authors declare no conflict of interest related to this work.
Acknowledgements
This research was supported by the Center of Innovation (COI) Program “Global Aqua Innovation Center for Improving Living Standards and Water Sustainability” (Grant JPMJCE1316), from the Japan Science and Technology Agency (JST). This work was also partially supported (for M. E., R. C.-S., A. M.-G., K. T.) by JSPS KAKENHI Grant Number JP17H0340100.
References
- S. Inukai, R. Cruz-Silva, J. Ortiz-Medina, A. Morelos-Gomez, K. Takeuchi, T. Hayashi, A. Tanioka, T. Araki, S. Tejima, T. Noguchi, M. Terrones and M. Endo, Sci. Rep., 2015, 5, 13562 CrossRef PubMed.
- A. Morelos-Gomez, R. Cruz-Silva, H. Muramatsu, J. Ortiz-Medina, T. Araki, T. Fukuyo, S. Tejima, K. Takeuchi, T. Hayashi, M. Terrones and M. Endo, Nat. Nanotechnol., 2017, 12, 1083–1088 CrossRef CAS PubMed.
- J. Ortiz-Medina, H. Kitano, A. Morelos-Gomez, Z. Wang, T. Araki, C.-S. Kang, T. Hayashi, K. Takeuchi, T. Kawaguchi, A. Tanioka, R. Cruz-Silva, M. Terrones and M. Endo, NPG Asia Mater., 2016, 8, e258 CrossRef CAS.
- S.-M. Park and S. Lee, Membranes, 2019, 9, 37 CrossRef.
- Y. A. Hussain and M. H. Al-Saleh, Desalination, 2014, 344, 362–370 CrossRef CAS.
- U. A. Handge, Polym. Int., 2017, 66, 521–531 CrossRef CAS.
- P. Majda and J. Skrodzewicz, Int. J. Adhes. Adhes., 2009, 29, 396–404 CrossRef CAS.
- S. Stade, M. Kallioinen, T. Tuuva and M. Mänttäri, Sep. Purif. Technol., 2015, 151, 211–217 CrossRef CAS.
- Y. Wei, Y. Zhang, X. Gao, Y. Yuan, B. Su and C. Gao, Carbon, 2016, 108, 568–575 CrossRef CAS.
- S. Xia, M. Ni, T. Zhu, Y. Zhao and N. Li, Desalination, 2015, 371, 78–87 CrossRef CAS.
- W. Li, W. Wu and Z. Li, ACS Nano, 2018, 12, 9309–9317 CrossRef CAS PubMed.
- M. T. M. Pendergast, J. M. Nygaard, A. K. Ghosh and E. M. V. Hoek, Desalination, 2010, 261, 255–263 CrossRef CAS.
- D. M. Davenport, A. Deshmukh, J. R. Werber and M. Elimelech, Environ. Sci. Technol. Lett., 2018, 5, 467–475 CrossRef CAS.
- S. Karan, S. Samitsu, X. Peng, K. Kurashima and I. Ichinose, Science, 2012, 335, 444–447 CrossRef CAS.
- Y. T. Pei, X. L. Bui and J. T. M. De Hosson, Scr. Mater., 2010, 63, 649–652 CrossRef CAS.
- A. Shirakura, M. Nakaya, Y. Koga, H. Kodama, T. Hasebe and T. Suzuki, Thin Solid Films, 2006, 494, 84–91 CrossRef CAS.
- J. Ortiz-Medina, Z. Wang, R. Cruz-Silva, A. Morelos-Gomez, F. Wang, X. Yao, M. Terrones and M. Endo, Adv. Mater., 2019, 31, 1805717 CrossRef PubMed.
- M. Inagaki, M. Toyoda, Y. Soneda and T. Morishita, Carbon, 2018, 132, 104–140 CrossRef CAS.
- D. Guo, R. Shibuya, C. Akiba, S. Saji, T. Kondo and J. Nakamura, Science, 2016, 351, 361–365 CrossRef CAS.
- M. K. Hoque, J. A. Behan, S. N. Stamatin, F. Zen, T. S. Perova and P. E. Colavita, RSC Adv., 2019, 9, 4063–4071 RSC.
- D. Yang, H. Ren, D. Wu, W. Zhang, X. Lou, D. Wang, K. Cao, Z. Gao, F. Xu and K. Jiang, J. Colloid Interface Sci., 2019, 542, 81–90 CrossRef CAS.
- S. Plimpton, J. Comput. Phys., 1995, 117, 1–19 CrossRef CAS.
- H. M. Aktulga, J. C. Fogarty, S. A. Pandit and A. Y. Grama, Parallel Comput, 2012, 38, 245–259 CrossRef.
- W. Humphrey, A. Dalke and K. Schulten, J. Mol. Graphics, 1996, 14, 33–38 CrossRef CAS.
- G. Blandin, H. Vervoort, A. D'Haese, K. Schoutteten, J. Vanden Bussche, L. Vanhaecke, D. T. Myat, P. Le-Clech and A. R. D. Verliefde, Process Saf. Environ. Prot., 2016, 102, 316–327 CrossRef CAS.
- C. A. Schneider, W. S. Rasband and K. W. Eliceiri, Nat. Methods, 2012, 9, 671–675 CrossRef CAS PubMed.
- D. Peric, A. T. Bell and M. Shen, J. Appl. Polym. Sci., 1977, 21, 2661–2673 CrossRef CAS.
- H. Yasuda and C. E. Lamaze, J. Appl. Polym. Sci., 1973, 17, 201–222 CrossRef CAS.
- P. V. Hinman, A. T. Bell and M. Shen, J. Appl. Polym. Sci., 1979, 23, 3651–3656 CrossRef CAS.
- J.-Q. Zhou, L. Li, C. Fu, J. Wang, P. Fu, C.-P. Kong, F.-Q. Bai, R. I. Eglitis, H.-X. Zhang and R. Jia, Nanoscale, 2020, 12, 5055–5066 RSC.
- R. I. Babicheva, S. V Dmitriev, A. A. Kistanov, M. Dahanayaka, A.-K. Law and K. Zhou, IOP Conf. Ser.: Mater. Sci. Eng., 2018, 447, 012053 Search PubMed.
- D. Tománek and A. Kyrylchuk, Phys. Rev. Appl., 2019, 12, 024054 CrossRef.
Footnote |
| † Electronic supplementary information (ESI) available. See DOI: 10.1039/d0na00263a |
|
| This journal is © The Royal Society of Chemistry 2020 |
Click here to see how this site uses Cookies. View our privacy policy here. 
 Open Access Article
 This Open Access Article is licensed under a Creative Commons Attribution-Non Commercial 3.0 Unported Licence
 *d,
Isamu
Ito
b,
Aaron
Morelos-Gomez
bc,
Rodolfo
Cruz-Silva
*d,
Isamu
Ito
b,
Aaron
Morelos-Gomez
bc,
Rodolfo
Cruz-Silva